Article

Assessing Potential Impacts of Sea Level Rise on Public Health and Vulnerable Populations in Southeast Florida and Providing a Framework to Improve Outcomes

1
Department of Civil and Environmental Engineering, Florida Atlantic University, Boca Raton, FL 33431, USA
2
Center for Environmental Studies, Florida Atlantic University, Boca Raton, FL 33431, USA
3
School of Urban and Regional Planning, Florida Atlantic University, Boca Raton, FL 33431, USA
4
Florida Institute for Health Innovation, West Palm Beach, FL 33407, USA
5
South Florida Regional Planning Council, Hollywood, FL 33021, USA
*
Author to whom correspondence should be addressed.
Sustainability 2016, 8(4), 315; https://doi.org/10.3390/su8040315
Submission received: 12 January 2016 / Revised: 24 March 2016 / Accepted: 25 March 2016 / Published: 31 March 2016
(This article belongs to the Special Issue Sustaining the Shrinking City: Concepts, Dynamics and Management)

Abstract

:
In recent years, ongoing efforts by a multitude of universities, local governments, federal agencies, and non-governmental organizations (NGOs) have been focused on sea-level rise (SLR) adaptation in Florida. However, within these efforts, there has been very little attention given to the potential impacts of sea-level rise on human health. The intent of this project is to identify populations in Southeast Florida that are most vulnerable to sea-level rise from a topographic perspective, determine how vulnerable these population are from a socio-economic perspective, identify potential health impacts, develop adaptation strategies designed to assist these communities, and produce an outreach effort that can be shared with other coastal communities. The location of socially-vulnerable and health-vulnerable populations are correlated, but at present they are not generally in the geographically-vulnerable areas. Projections indicate that they will become at risk in the future but the lack of data on emerging diseases makes public health assessments difficult. We propose a redefinition of “who is vulnerable?” to include health indicators and hard infrastructure solutions for flood and property protection. These tools can be used to help protect water resources from the impacts of climate change, which would, in turn, protect public health via drinking water supplies, and efforts to address social issues.

1. Introduction

Climate change impacts are felt globally, but some areas and populations are recognized as being particularly vulnerable [1,2,3]. The Southeast Florida region, with its low-lying coasts, subtropical climate, porous geology, and distinctive hydrology, has been identified as one of the world’s most vulnerable areas [1,2,3,4]. Due to these unique conditions, sea-level rise is the principal long-term, permanent impact of climate change for the region, threatening both its natural systems and its densely populated and highly diverse built environment [1,4]. With 6.6 million people, the region constitutes one-third of the state’s total population, one third of the state’s economy, over $4 trillion in property value, and among the highest rates of projected population growth in the state [5].
The mean sea level is expected to rise up to three feet (1 m) by 2100 due increased rates of thermal expansion, glacier mass loss, groundwater losses, and discharge from land-based ice-sheets [1,6,7,8,9,10,11]. The U.S. Army Corps of Engineers used Key West tidal data from 1913 to 1999 to calculate a projected sea-level rise. Results suggested that the sea-level rise in Southeast Florida will rise one foot from the 2010 baseline by 2040, and could raise two feet (0.65 m) by 2060 [12]. Figure 1 shows the current projections and the uncertainty associated with same which comport with the medium 2013 IPCC projections.
Much of the research focus has been on coastal communities due to the direct threat of sea level rise (SLR). Bloetscher, et al. [13], Bloetscher and Romah [14], and Romah [15] noted that groundwater levels in Southeast Florida are intrinsically linked to the sea level and, thus, while coastal populations are particularly at risk due to erosion, inundation, and storm surge, interior populations are also susceptible to rising water tables and extended periods of inundation. Chang, et al. [16] describes an overall “lifting process” by which there is a 1:1 ratio in water table elevation that correlated to sea-level rise. Higher groundwater levels mean reduced aquifer storage, thereby lessening the capacity of soil to absorb precipitation, and thereby increasing the risk of groundwater flooding [14,15,17]. Due to the associated loss of soil storage capacity caused by sea level rise, more intense storms will overwhelm the current storm water infrastructure. Projections indicate the potential for severe damage to Southeast Florida’s energy systems, transportation infrastructure, water infrastructure, agricultural lands, and the Everglades ecosystem [18,19].
Much of the current work on adaptation to sea-level rise (SLR) focuses on understanding the physical and economic vulnerability of infrastructure, as well as on developing adaptation strategies for the natural and built environments using new infrastructure systems [18,20,21,22,23,24,25]. Long-term decisions which consider a systems approach that includes population, economics, and environmental conditions, are essential as local governments and businesses examine long-term viability, particularly in respect to investment decisions related to location. Property values are also dependent upon the maintenance of transportation and utilities, especially storm water, wastewater treatment, and water supply. The insurance industry, which has traditionally been focused on a one year vision of loss risk, is beginning to discuss long-term risks of losses. If the insurance industry takes a longer view of risk, there will be an accompanying impact on lending practices. Where properties are at risk, lending options may be reduced by insurance limitations—i.e., if the insurance industry sees the potential for significant losses from sea level rise within 30 years, the mortgage industry will limit the length of loans and increase interest rates due to insurance risk, thereby increasing costs to buyers and reducing the attractiveness of the purchase for sellers. The result may be declining property values and slower sales. Hence, it is in the community’s interest to develop a planning framework to adapt to sea-level rise and protect vulnerable infrastructure through a long-term plan.
Climate change also has the potential to create a serious public health threat that affects human health outcomes and disease patterns [26]. Although preventative and adaptive strategies for climate change will help lessen negative health impacts, human health will continue to be affected from present climate change conditions [27,28,29]. It is expected that climate change will both aggravate existing human health risks and conditions and create new ones. Health impacts will vary and have both direct and indirect effects [28]. Populations with combined health, socio-economic, and place-based vulnerabilities will be most affected [29]. The health impacts will be felt to different degrees depending on action taken to adapt [20,22,30,31].
Due to the inevitability of sea-level rise in Southeast Florida and in other low-lying coastal regions as a consequence of climate change, the focus of this research was to identify the communities most at risk, evaluating potential nexus points for three factors: (1) areas that will be most vulnerable to sea-level rise using United States Army Corps of Engineers (USACE) projections; (2) locations of populations that are socially and economically vulnerable; and (3) locations of increased health risk. Socially-vulnerable populations that reside in these low-lying areas and already have predisposed health vulnerabilities and economic limitations lack the resources and capacity to mitigate sea-level rise impacts. In this investigation, current conditions were compared against incremental increases of 0, 1, 2, and 3 feet of sea-level rise based on actual data. The increments work as threshold values by allowing planners to know ahead of time where the next set of vulnerable areas will be, thereby permitting an opportunity for a proactive response approach.

2. Materials and Methods

2.1. Sea Level and Groundwater Mapping

Prior to compiling data, the local community needs were assessed in order to define an acceptable level of service (LOS) for the community. In Southeast Florida, the king tides occur annually, in September and October. Storms may alter this pattern slightly, but these are atypical and temporal events that may cause significant damage and disruption to the community, but do little to affect the long-term trends for sea level rise. Hence, storm related impacts were not considered. Figure 2 shows tidal data, graphed from highest to lowest, illustrating how the highest tides are much higher than the average. The LOS should indicate how often it is acceptable for flooding to occur in a community on an annual basis. The failure to establish an acceptable LOS is often the cause of a loss of confidence in public officials at a later point in time. The effects of sea-level rise on the LOS should be used to update the mapping in terms of demonstrating changes in vulnerability and increased flooding frequency. For example, a 1% flooding frequency translates to four flood days per year.
Once the level of service was defined, a unique method of vulnerability assessment was performed. The purpose of sea-level rise vulnerability modeling is to evaluate the future vulnerabilities of infrastructure, buildings, and facilities on public and private property based on their topography. Development of the surface topography included high resolution LiDAR, “ground-truthing” by tying it to local benchmarks and transportation plans, and USGS groundwater and NOAA tidal data from local monitoring stations to modeled groundwater surfaces.
Groundwater was examined similarly with respect to the sea-level rise scenarios. The groundwater levels are the result of investigating all USGS monitoring wells and those other monitoring wells with at least 30 years of data to determine the critical junctures that would increase vulnerability to surface flooding. While the goal of this effort was not to model groundwater flow, the concept was to consider more than just static elevation to determine sea-level rise vulnerability. Groundwater levels fluctuate with rainfall, but given distinct wet (summer) and dry (winter) seasons, and the end of the wet season coinciding with the highest tides, groundwater levels are generally highest at the end of the wet season. In addition, groundwater levels generally increase as one moves inland. By matching actual groundwater levels to tidal conditions, a groundwater surface can be developed.
As the greatest vulnerability to flooding occurs when the groundwater was closest to the surface, the 99 percentile (4 days/year) water levels from the wells data were interpolated ordinarily to match the 99 percentile tidal data. The topographic LiDAR layer and the groundwater maps were used to find the difference between land height and peak groundwater elevation, essentially indicating whether the soil can absorb water or is saturated and will pool or run off. As this layer may be adjusted for soil—sand versus clay to decrease the soil storage capacity, it is a robust data layer that was used in the modeling as a physical risk sub-index. This type of modeling is termed a “modified bathtub model.” The three classifications delineate where the difference between topography and groundwater is organized into levels of: vulnerable (below 0 ft), potentially vulnerable (0–2 ft), and not vulnerable (>2 ft). The term “potentially vulnerable” is used for areas that need further investigation to deal with the uncertainty of drainage and storm water improvements that might affect the situation.

2.2. Southeast Florida Vulnerability Index

The modified bathtub model demonstrates that SLR not only affects coastal regions, but it can affect low lying regions inland by affecting ground water levels which lead to localized flooding. South Florida’s climate makes these low lying, inland areas that are flooded a primary target for the negative effects of disease especially from waterborne, foodborne, and vector-borne diseases. Unlike most of the country, South Florida provides optimal conditions for viruses, bacteria, ticks, and mosquitoes year around. Therefore, it is important that the potential consequences of sea-level rise be reviewed in order to mitigate the effects.
As a part of the project, indices for health and socio-economic impacts were developed. Such indices build upon recent developments in measures seeking to quantify various aspects of community vulnerability. The index was created using the z-score approach. A z-score approach is an appropriate technique for variable sampling distributions that satisfy the normality assumptions. A z-score indicates how much a particular observation deviates from the mean relative to the standard deviation, and is calculated as follows:
z s c o r e = o i μ s
The Kolmogorov–Smirnov test and other statistical techniques will be used to test the hypothesis that the observed data approximate a normal distribution. Data transformation and/or windsorization (i.e., trimming of the tails to the 97.5th percentile) is performed if outliers or extreme values that distort the distribution are present [32]. Truncation can also be used to remove the effects of the outliers on the mean and the standard deviation [33]. Truncation to the 99th percentile will preserve the extreme values in the tails of the distribution, allowing them to still represent “best” and “worst” practices, but reduces their undue effect on the aggregation algorithm.
Few of the existing indices have accounted for the health status of the affected populations. In addition, there is growing attention to the anticipated health risks, such as waterborne diseases resulting from prolonged ponding conditions related to the effects of floods and sea-level rise [33]. The emphasis for this project was on health and social denominators to fill this gap by developing a composite measure to quantify health-related vulnerability, such as the incidence of chronic and acute health conditions, in conjunction with socio-economic variables and physical exposure to the anticipated effects of sea-level rise. For those diseases with only a few cases reported during the observation period, as in the instance with the diseases reviewed in this study, rates may be unreliable and could be difficult to interpret. This may also occur when there are no cases reported for a given location during the period of interest. The FDOH used relative standard error (RSE) as a way of measuring the reliability for statistical estimates. This is calculated by dividing the standard error of the rate by the rate itself and then multiplying by 100 to convert it to a percent. For rates, this calculation can be simplified to taking the inverse of the square root of the total number of cases and multiplying by 100. When the RSE is large, it indicates that the rate is imprecise. The FDOH chose a cut-point of 30, such that rates with an RSE greater than 30 in this report should be considered unreliable. This is a cut-off used by several CDC programs. The FDOH suppressed all crude rates as well as case counts for strata with an RSE > 30. All health data were collected and completed by the FDOH. A more detailed explanation is presented in a companion paper.

2.3. Statistical Analysis

Ultimately, policy-makers will need more information to prioritize resources and address the most drastically needed improvements. For example, a major goal to reduce economic vulnerability requires identifying where economic activity occurs and where potential jobs are. At-risk populations, valuable property (tax base), and emergency response may be drivers for policy decisions, which means data from other sources must be considered. To better understand the differences between the subareas, the collected data were compiled, summarized, and analyzed using an EXCEL add-on element called XLStat® (Addinsoft, New York, NY, USA). Correlation analysis was used to indicate whether the variables are related to other variables on an individual basis. However, correlation analysis works best when there are a limited number of variables (as opposed to the 24 variables here). Exploratory factor analysis in XLStat® (Addinsoft, New York, NY, USA) was employed to reveal the potential existence of underlying factors within data containing a very large number of measured variables.
Next, Principle Component Analysis (PCA) was used to reduce the number of variables by consolidating similar correlated variables into factors, preferably two or three that explain most of the data. PCA uses a multivariate statistical parameter called an eigenvalue, which is a measure of the amount of variation explained by each principal component [34]. With the PCA analysis, all factors in excess of one are kept. It is desirable that the factors represent at least 70 percent of the resulting eigenvalues. A scree plot is used to visualize the total variance fraction explained by each principal component.

3. Results

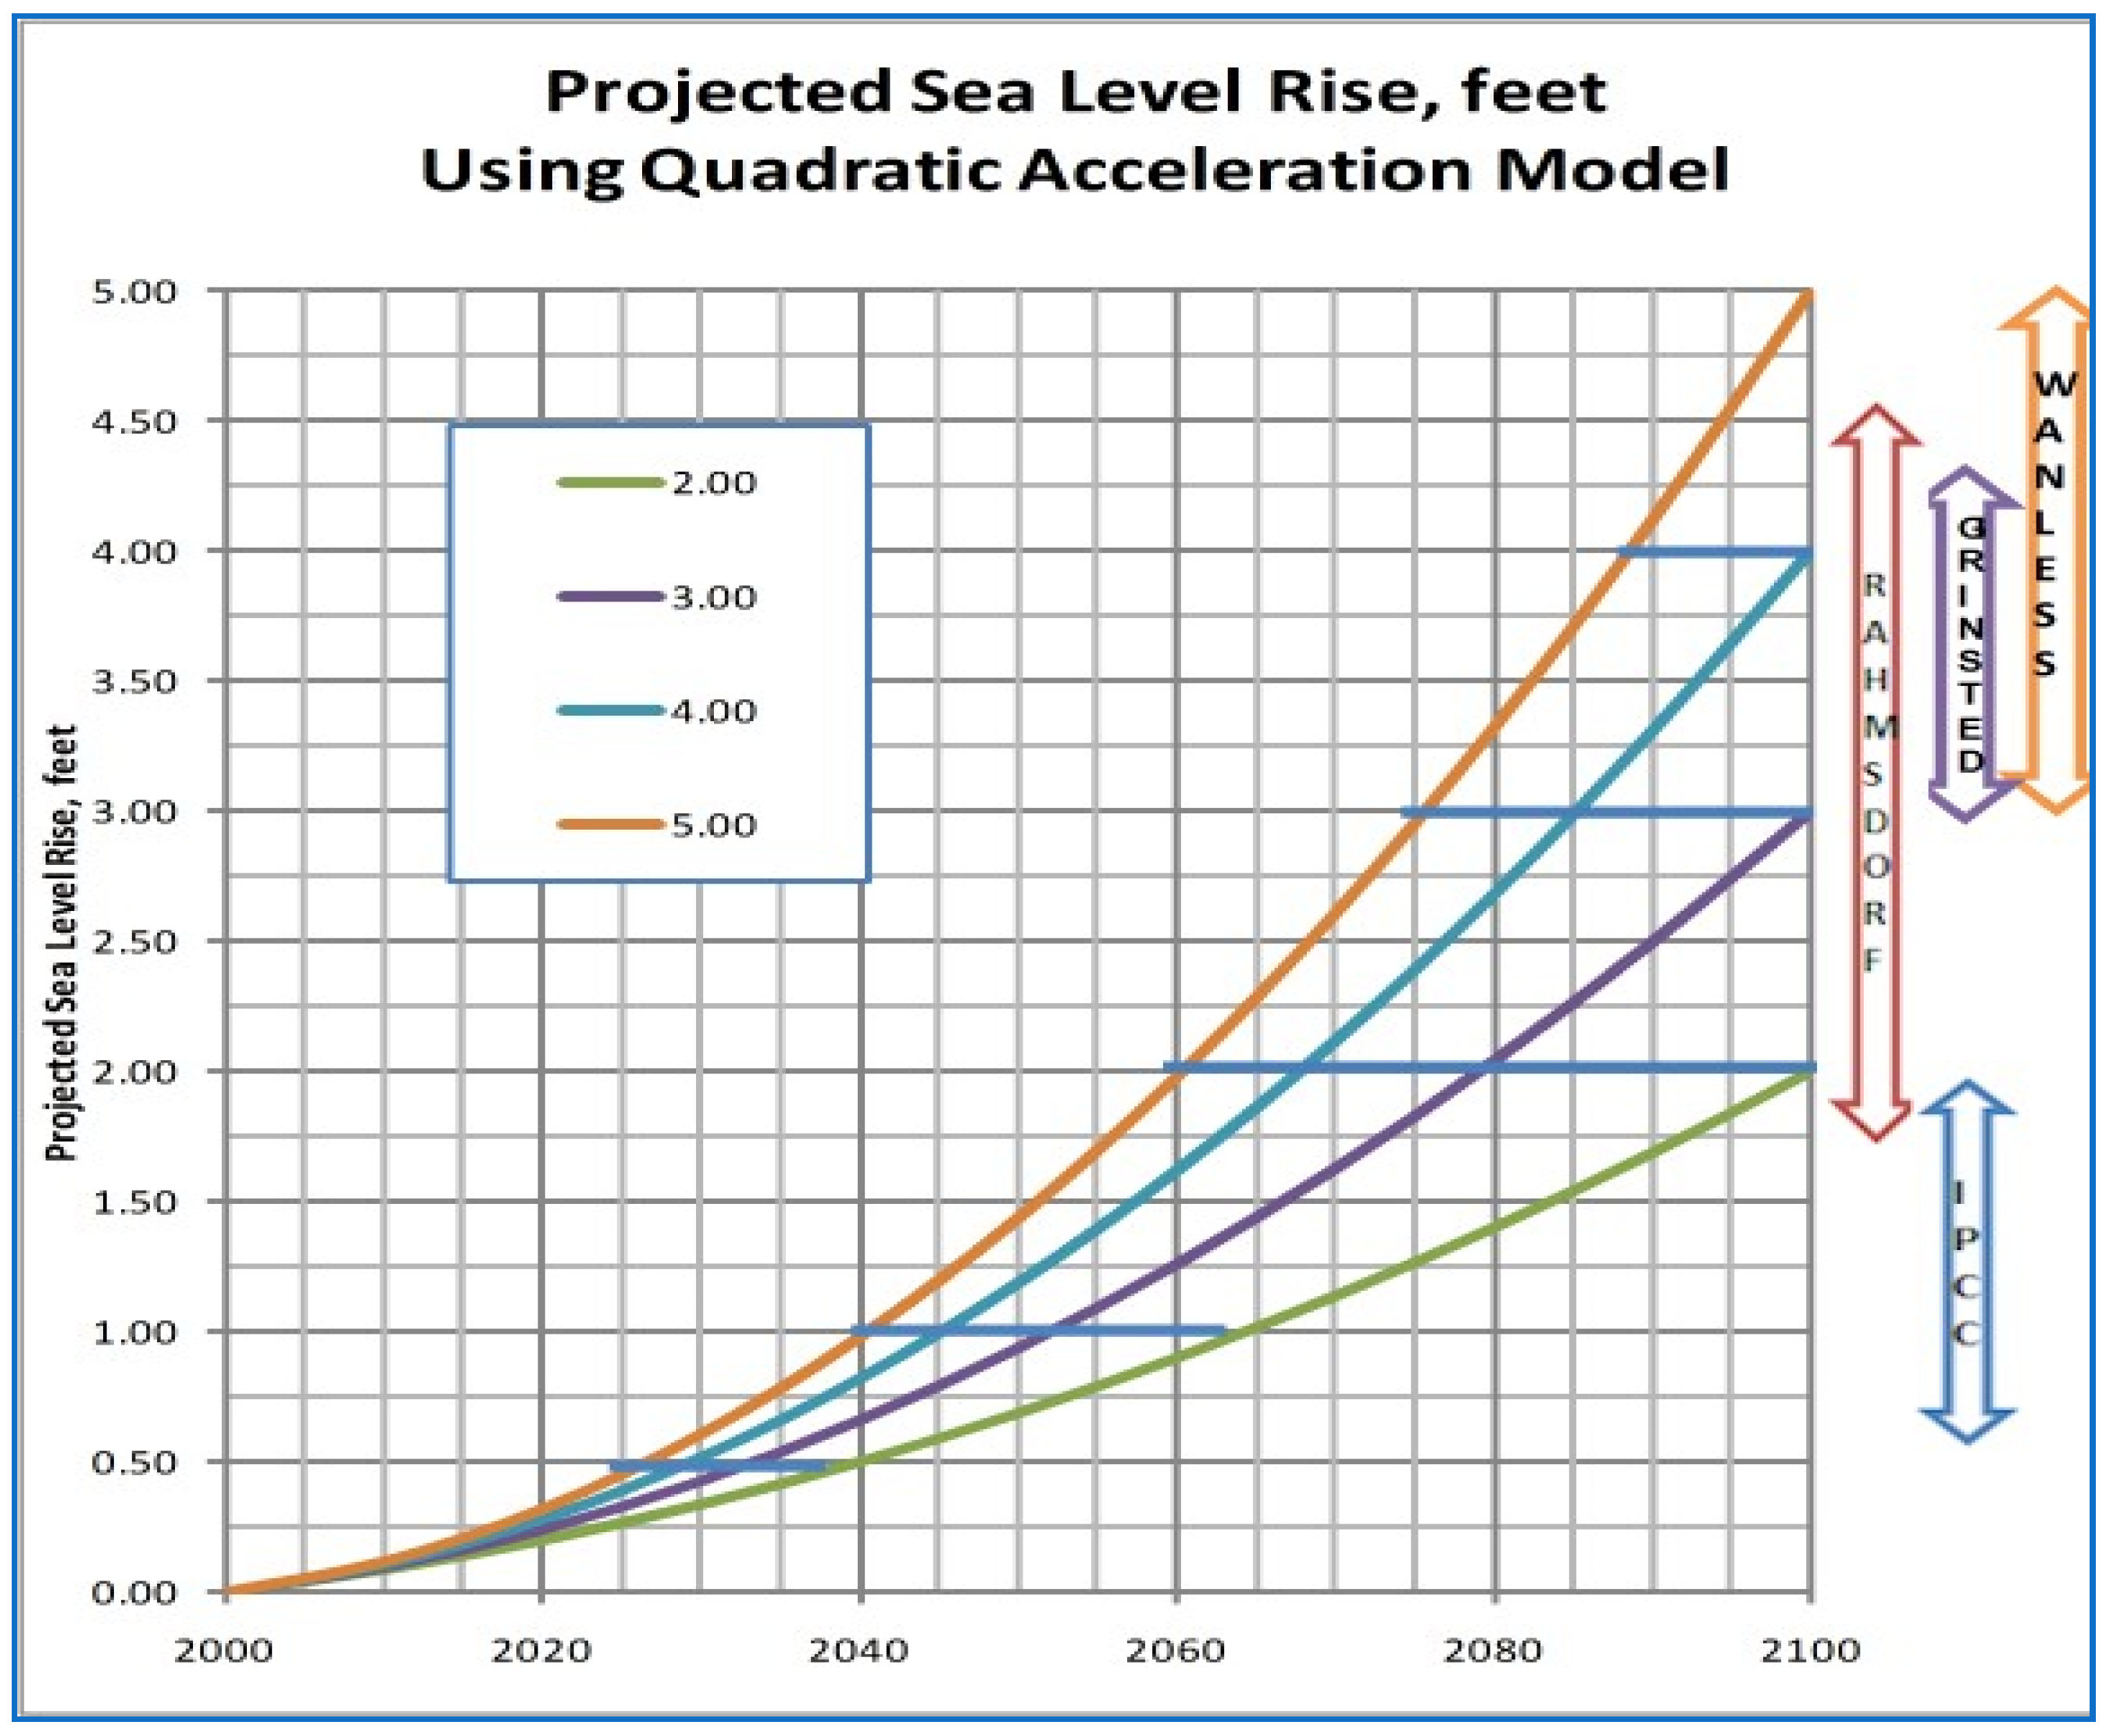
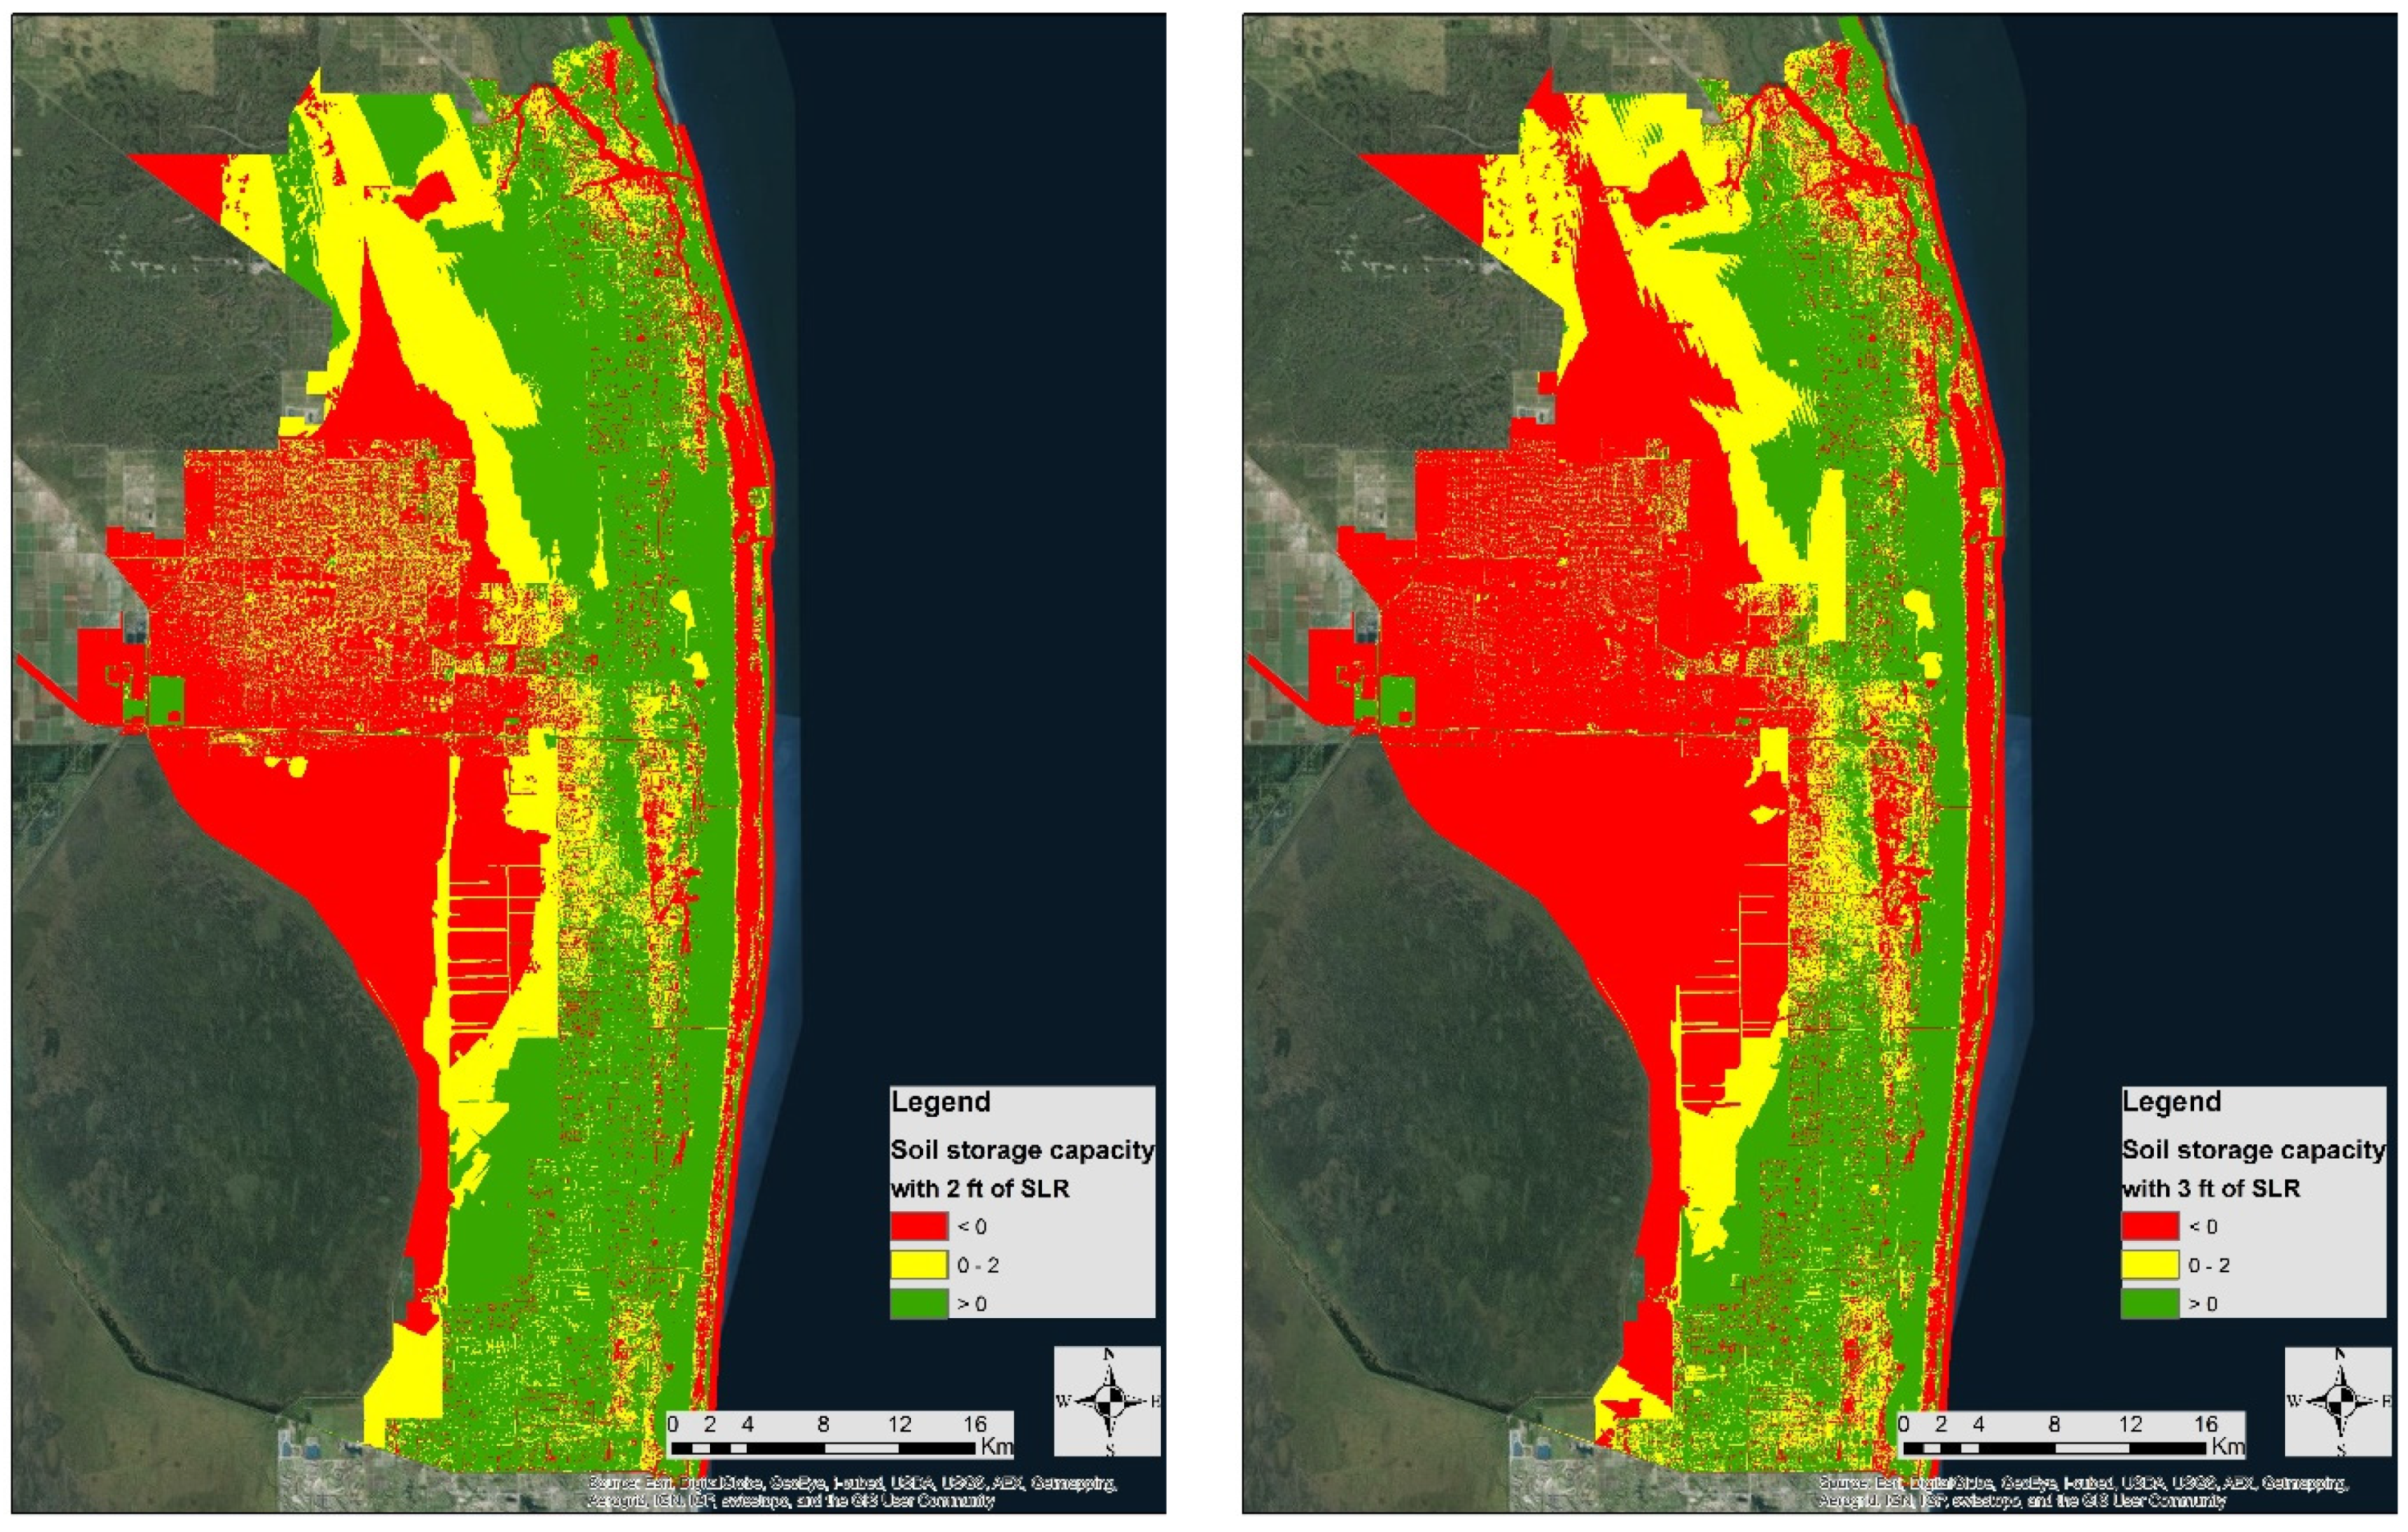
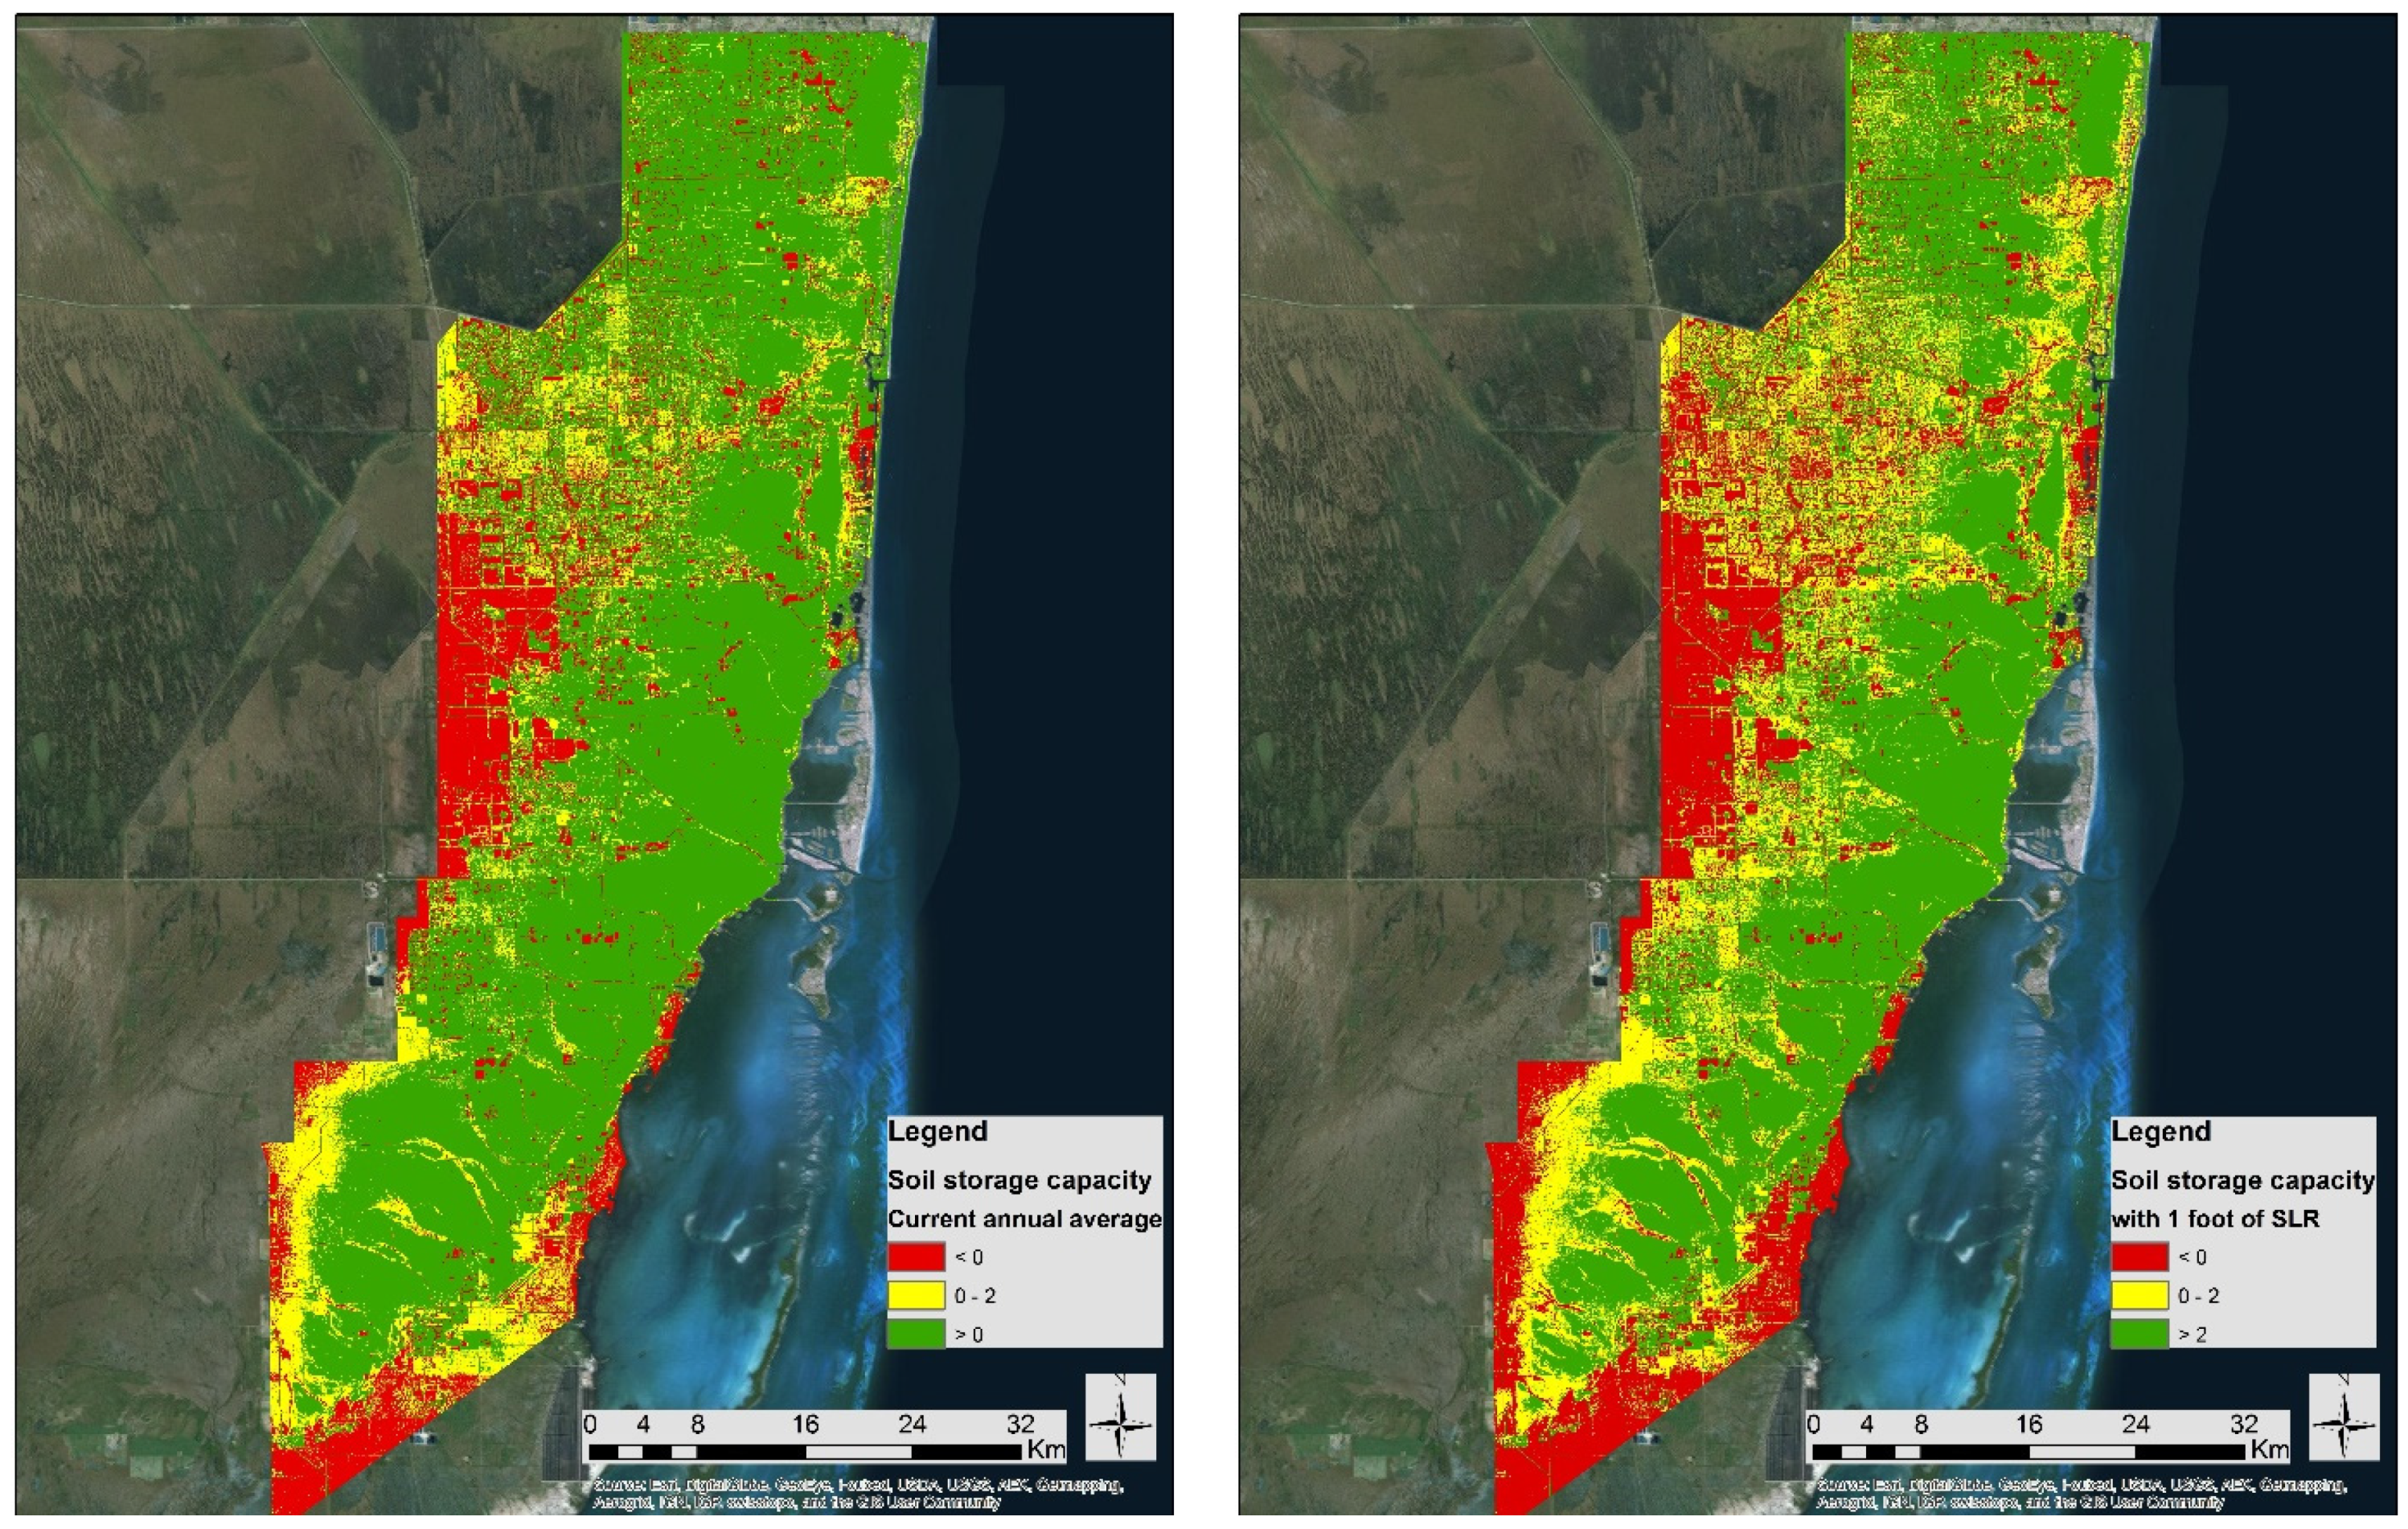
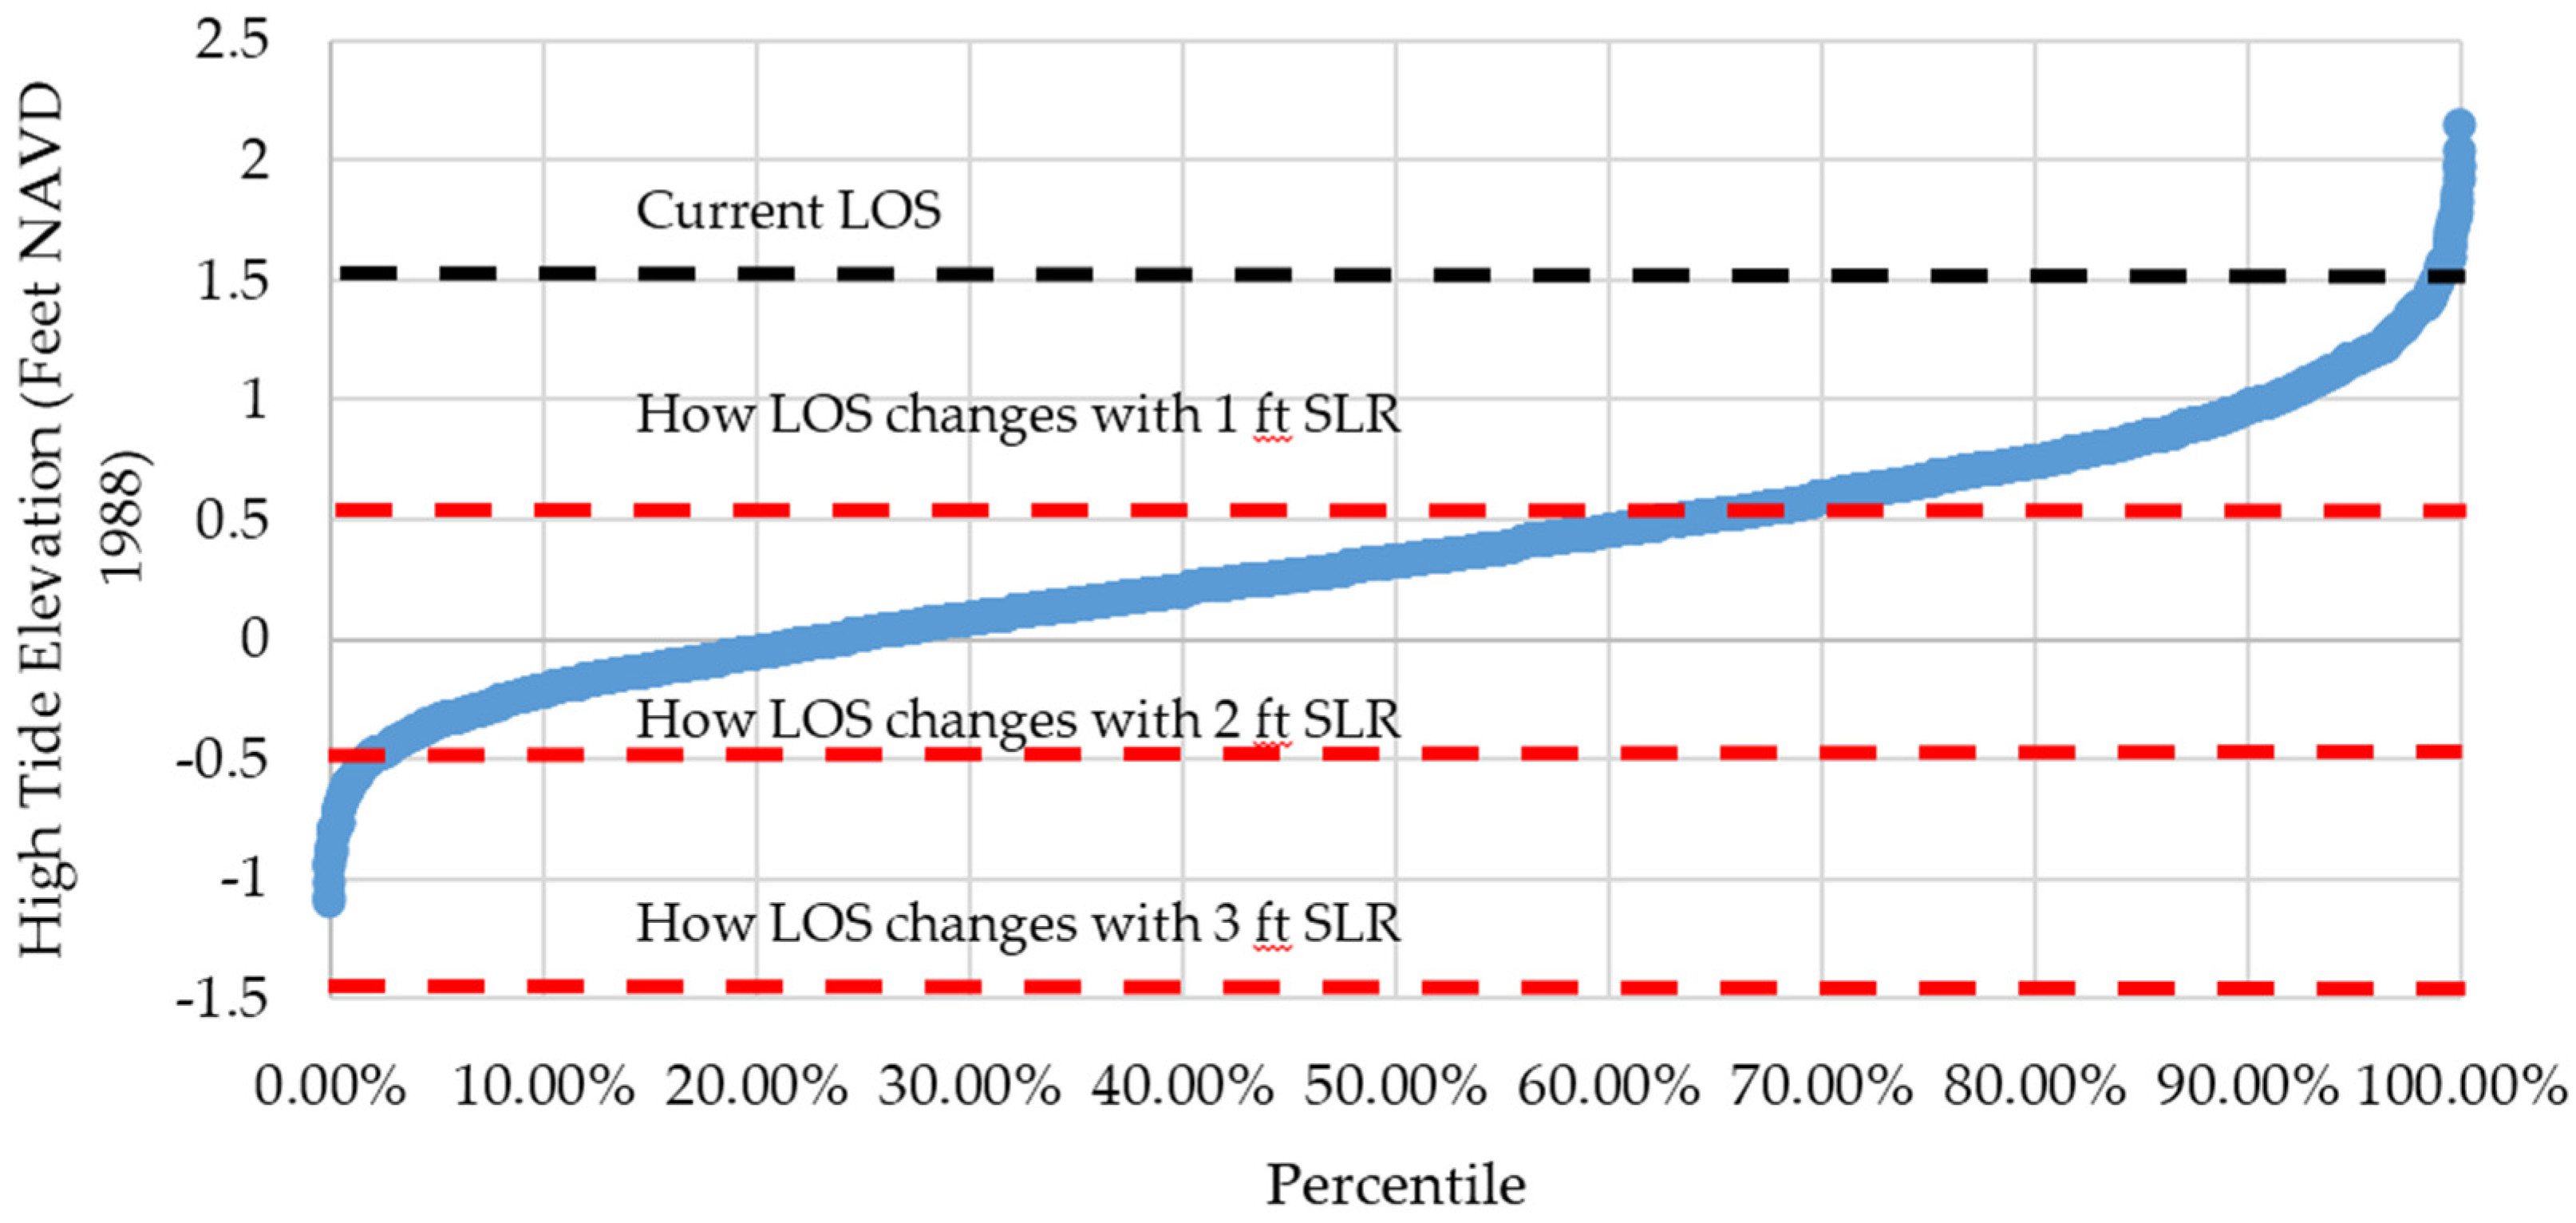
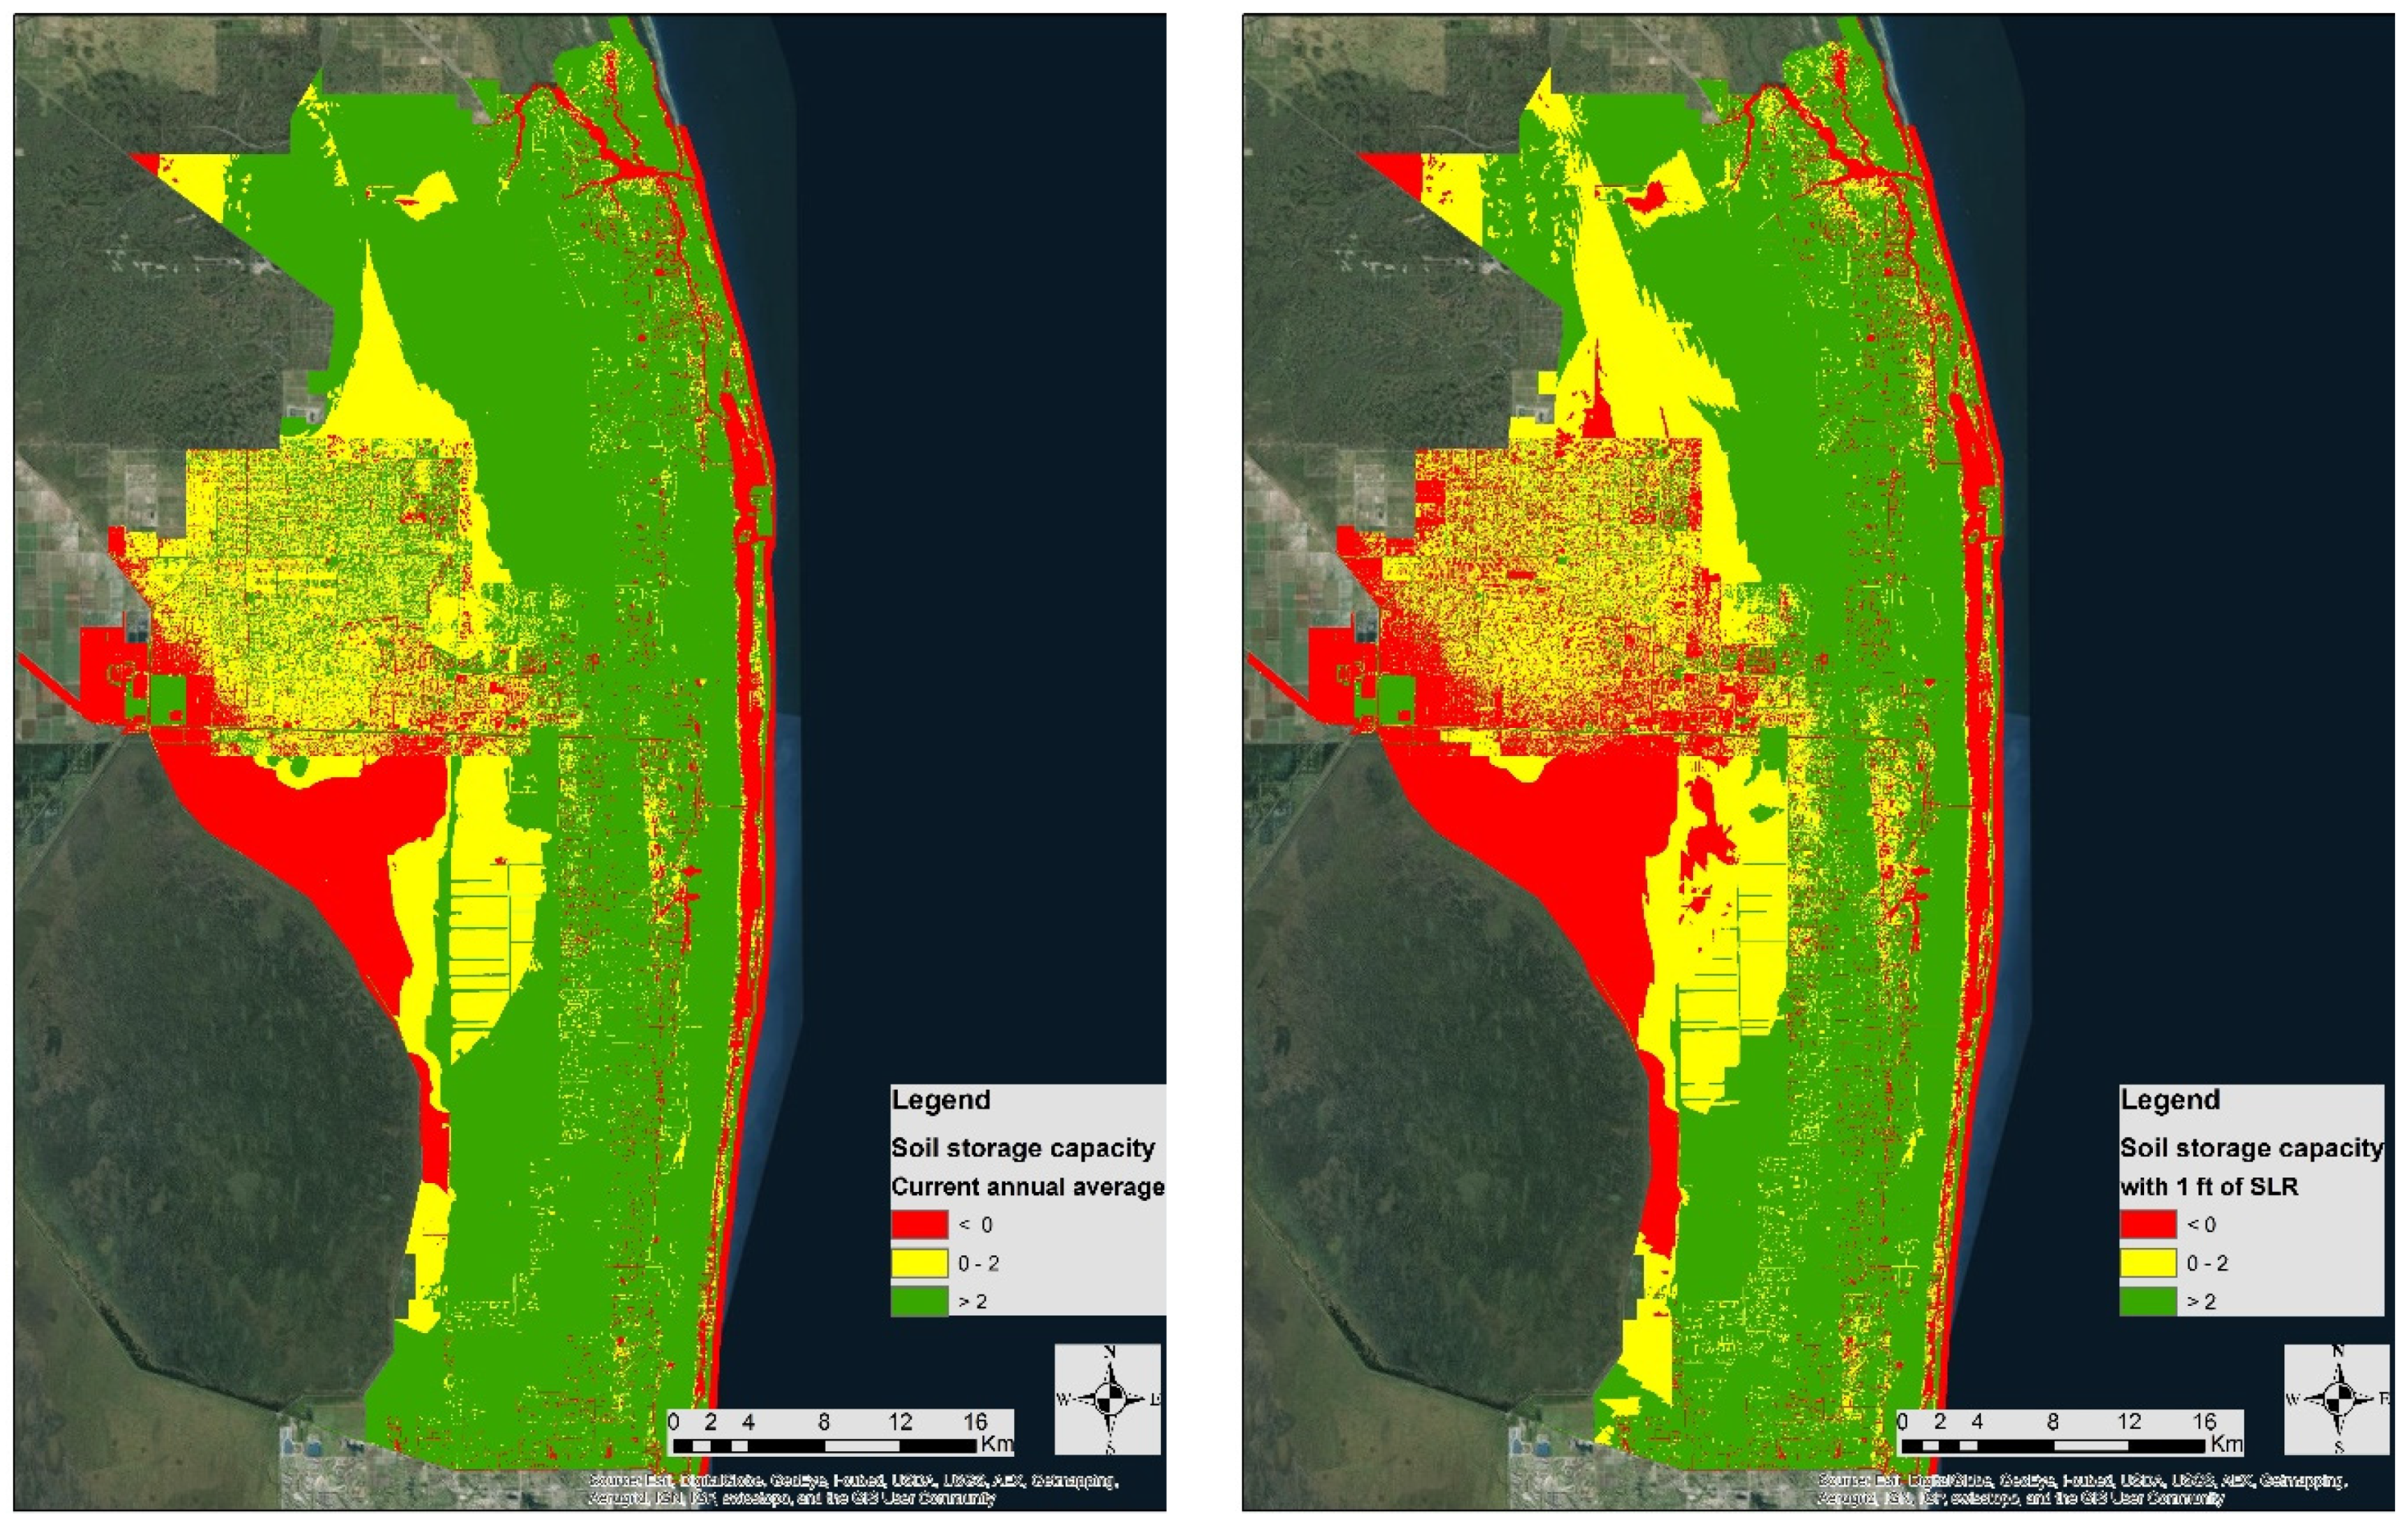
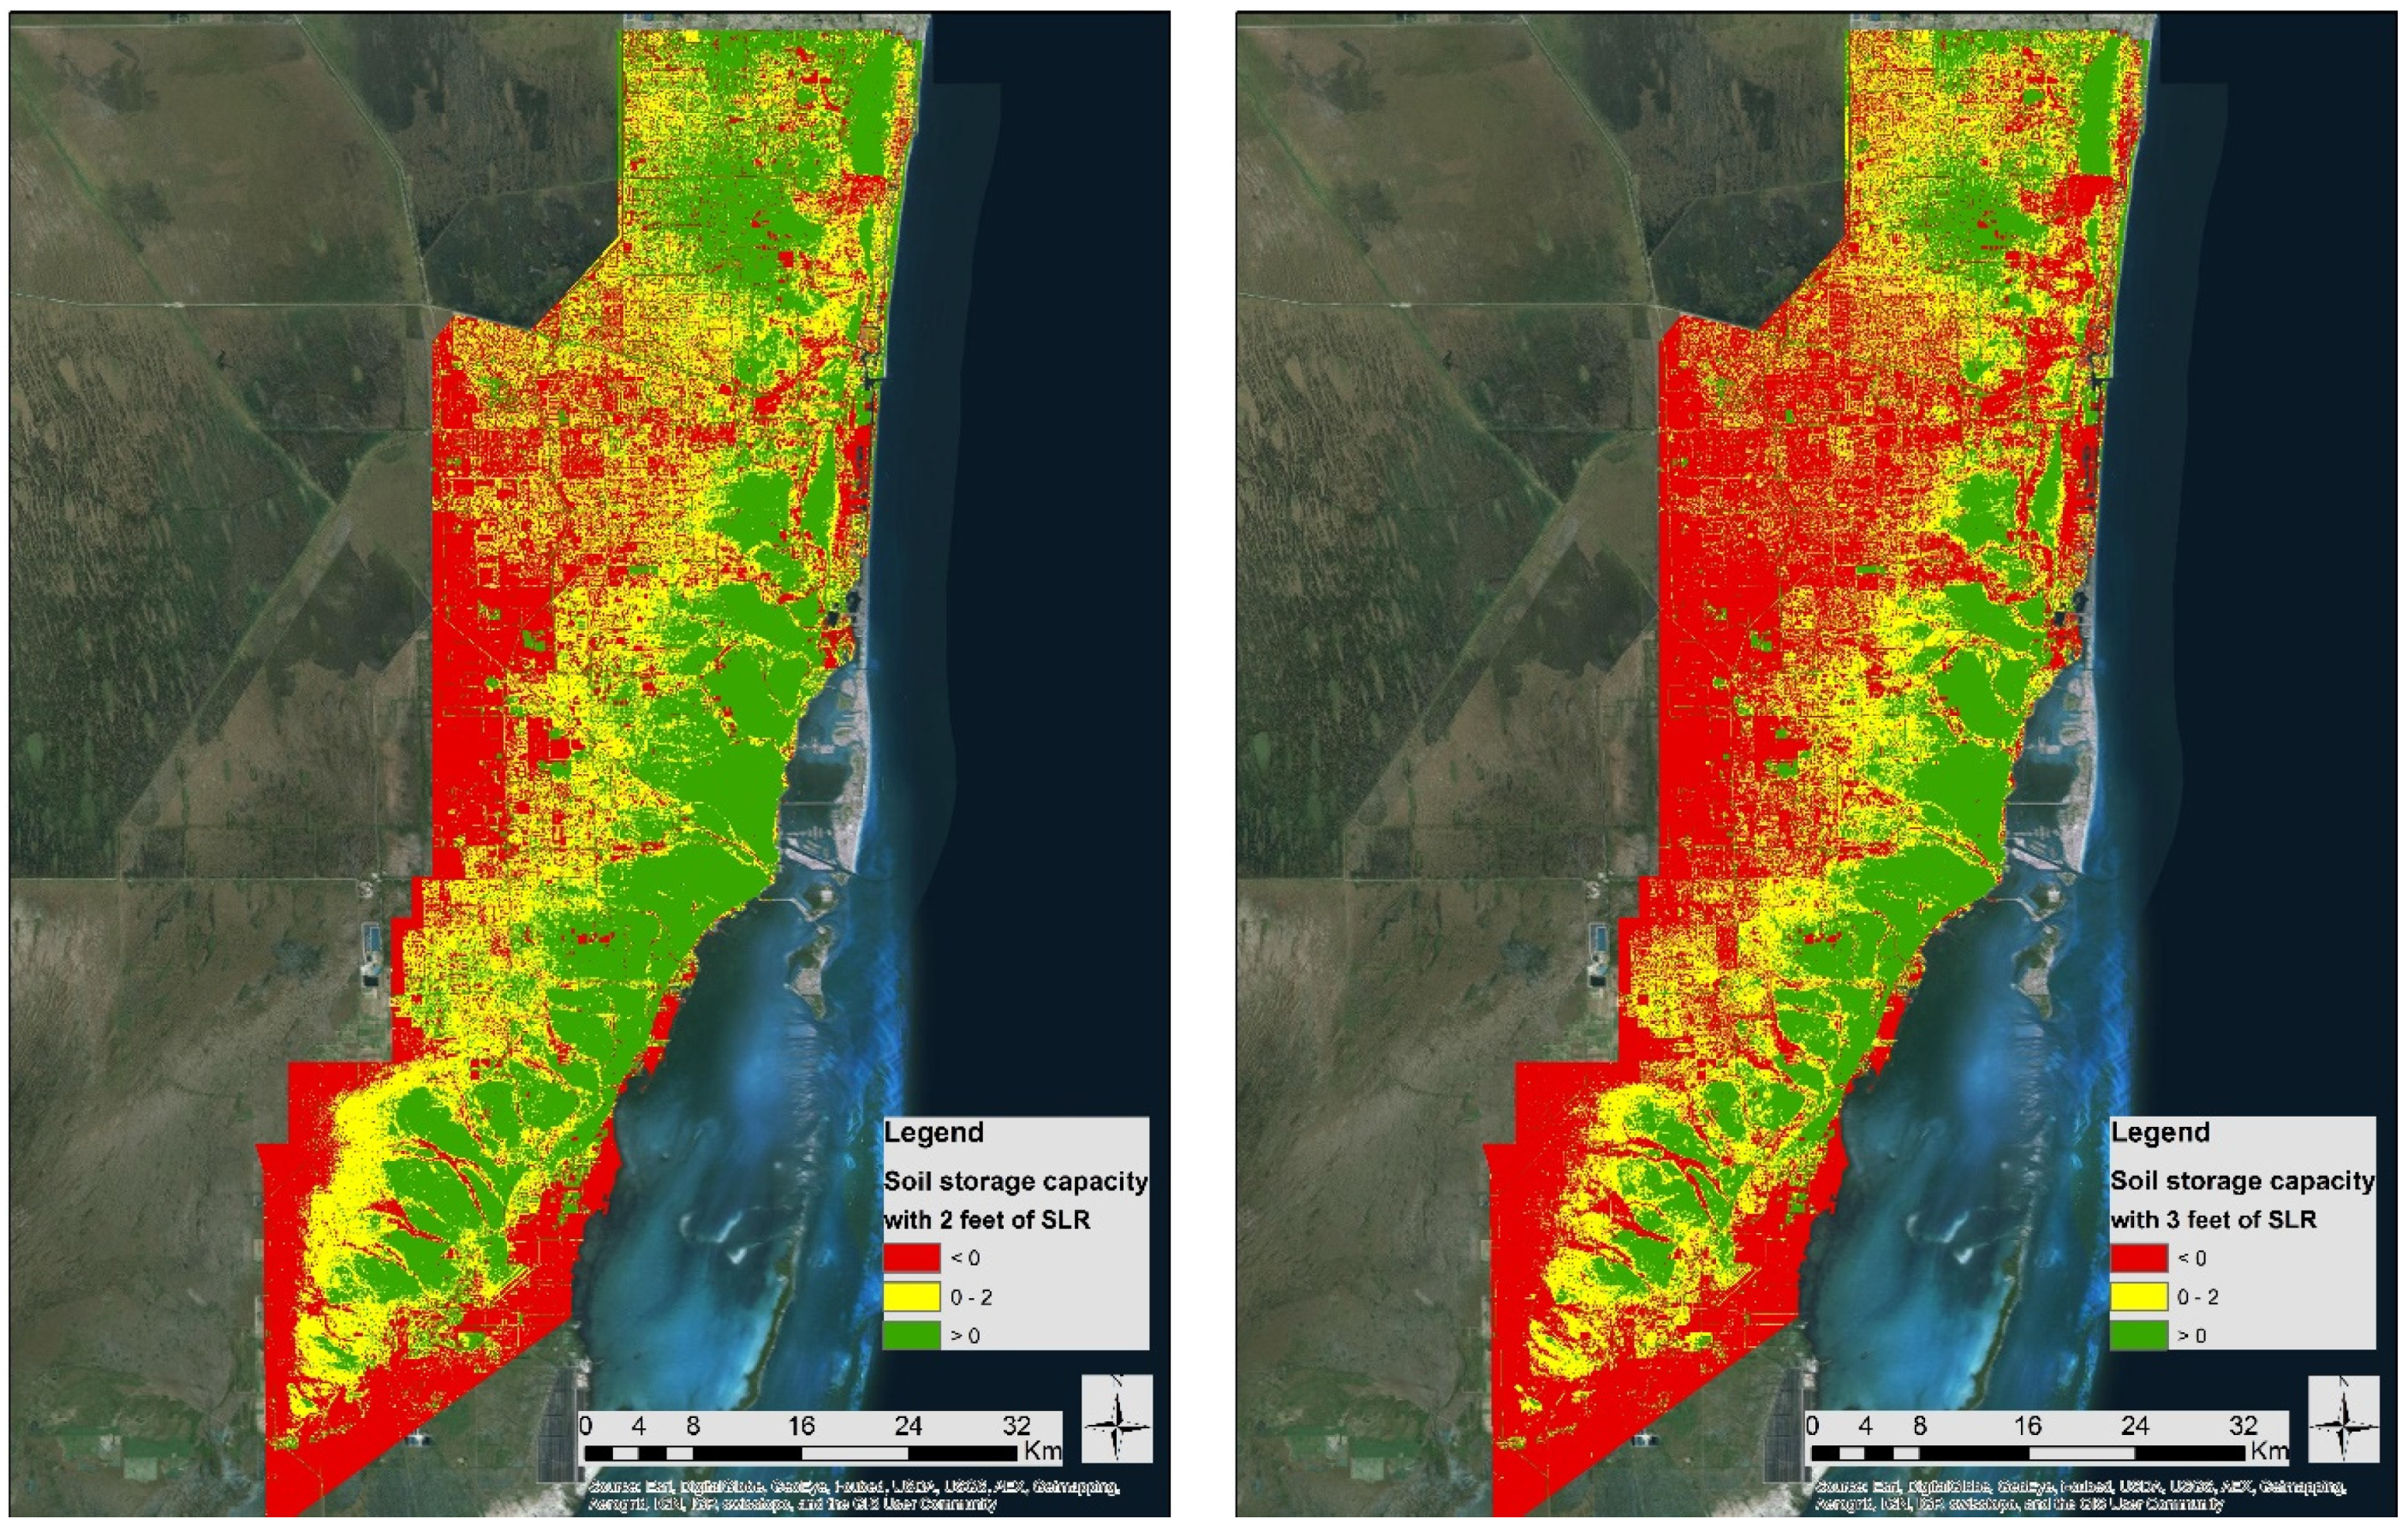
3.1. Sea-Level Rise Mapping

The sea-level rise vulnerability maps for the four counties, Broward, Miami-Dade, Palm Beach, and Monroe, are shown in the following figures. Figure 3 shows the vulnerable and potentially vulnerable areas in Palm Beach County. Many believe that Palm Beach County is far less at risk from sea-level rise than other southeast Florida counties as a result of higher elevations. However, the groundwater levels in Palm Beach County show that these impacts are already a challenge. Figure 4 shows the same information for Miami-Dade and Broward Counties. Each of these figures shows that the impacts of sea-level rise and groundwater is significantly higher than the bathtub models project.

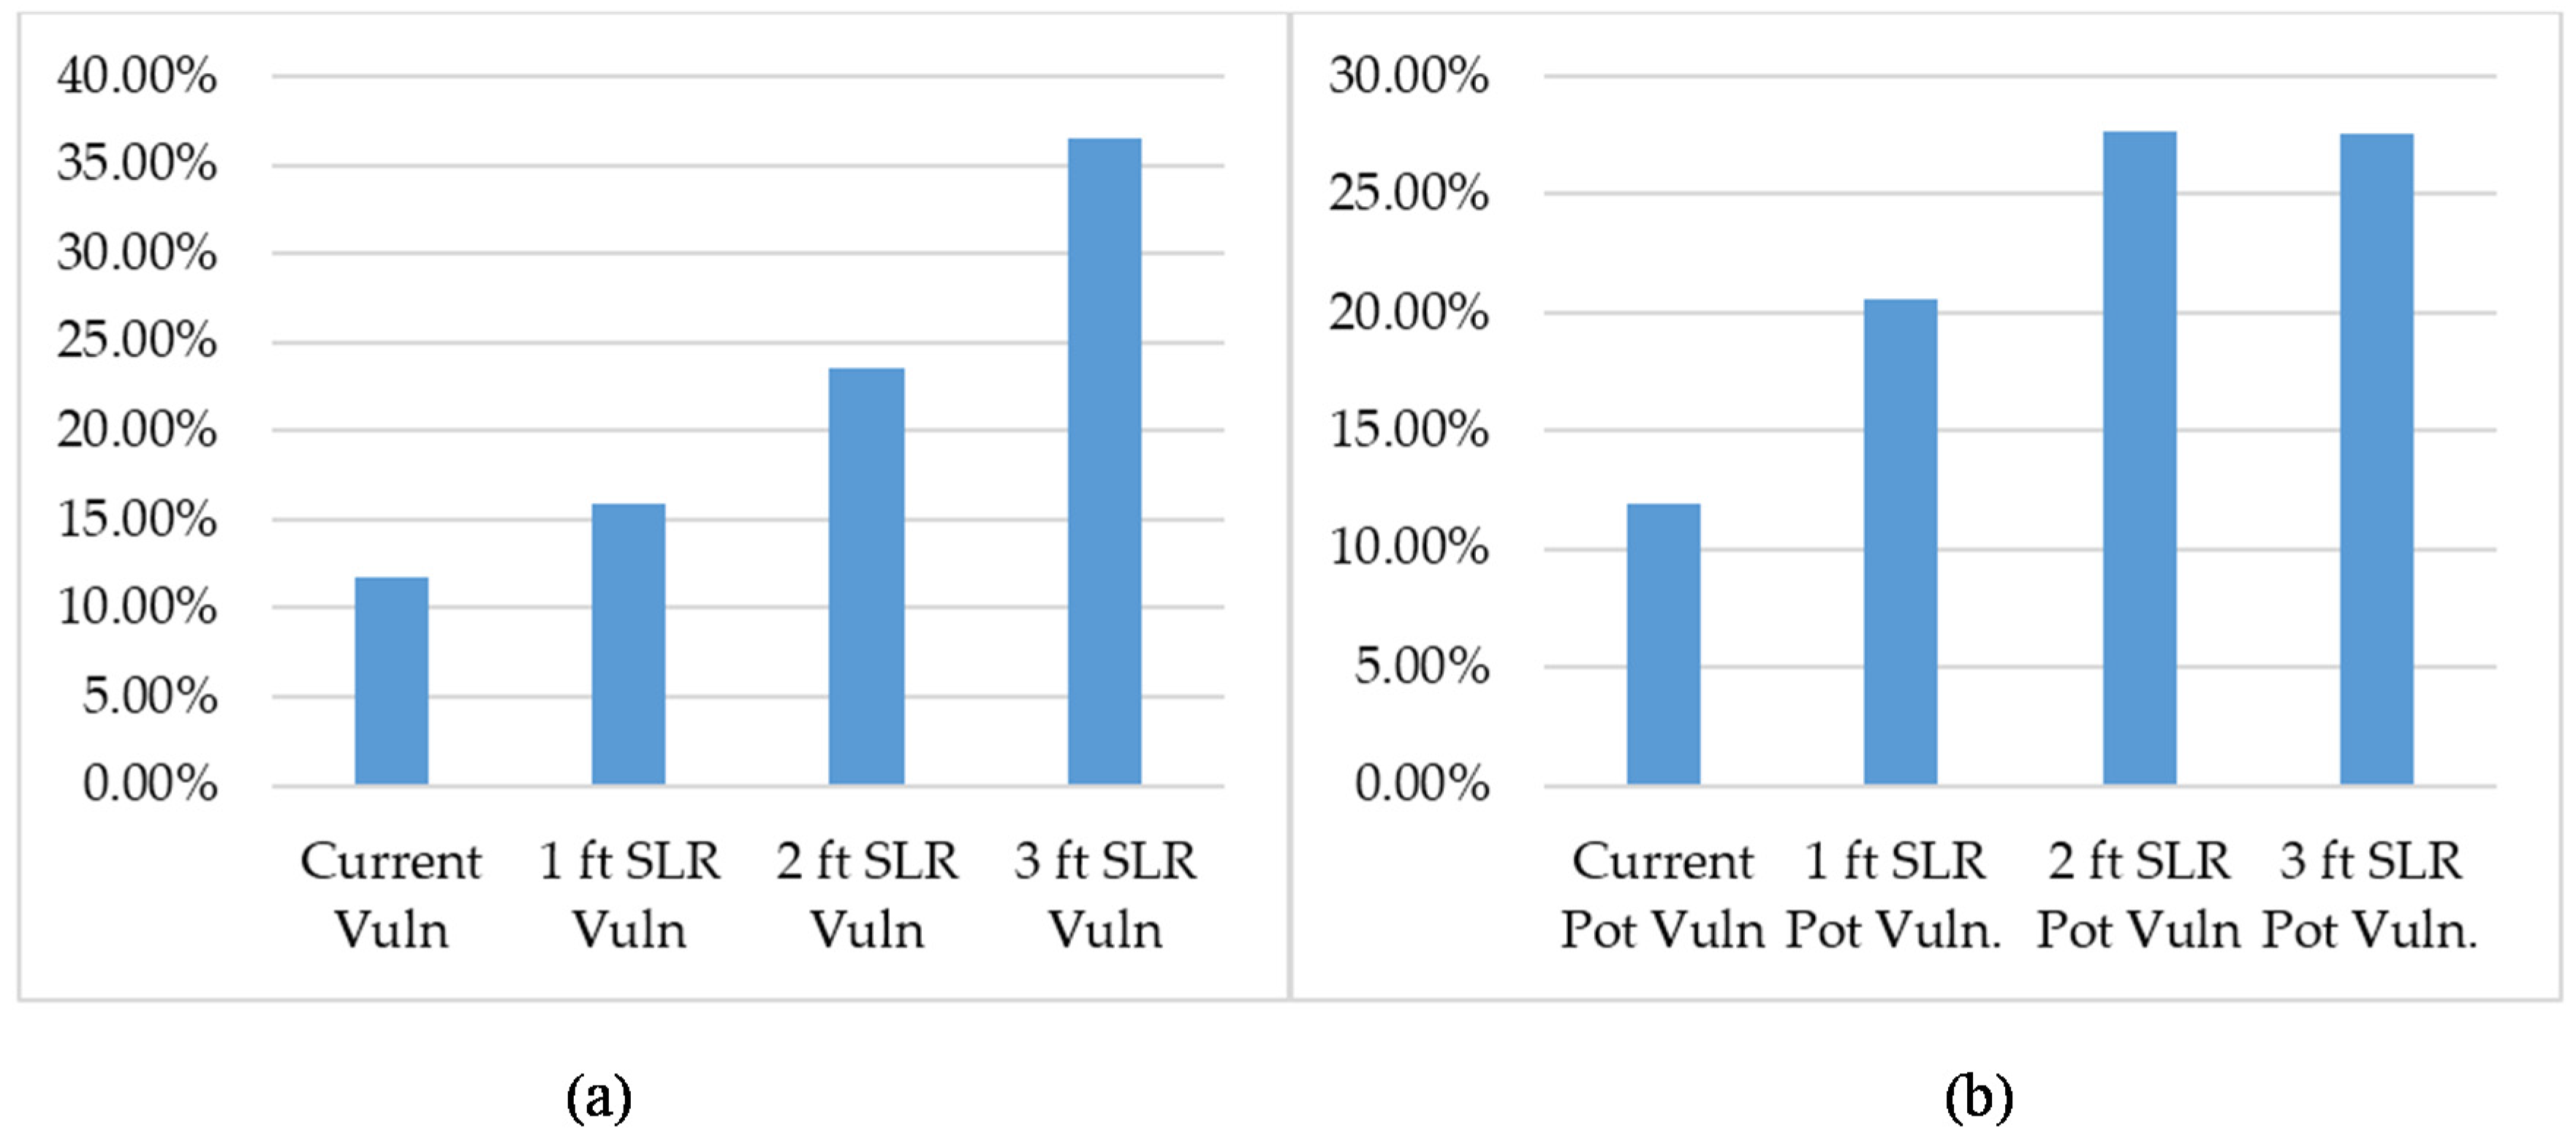
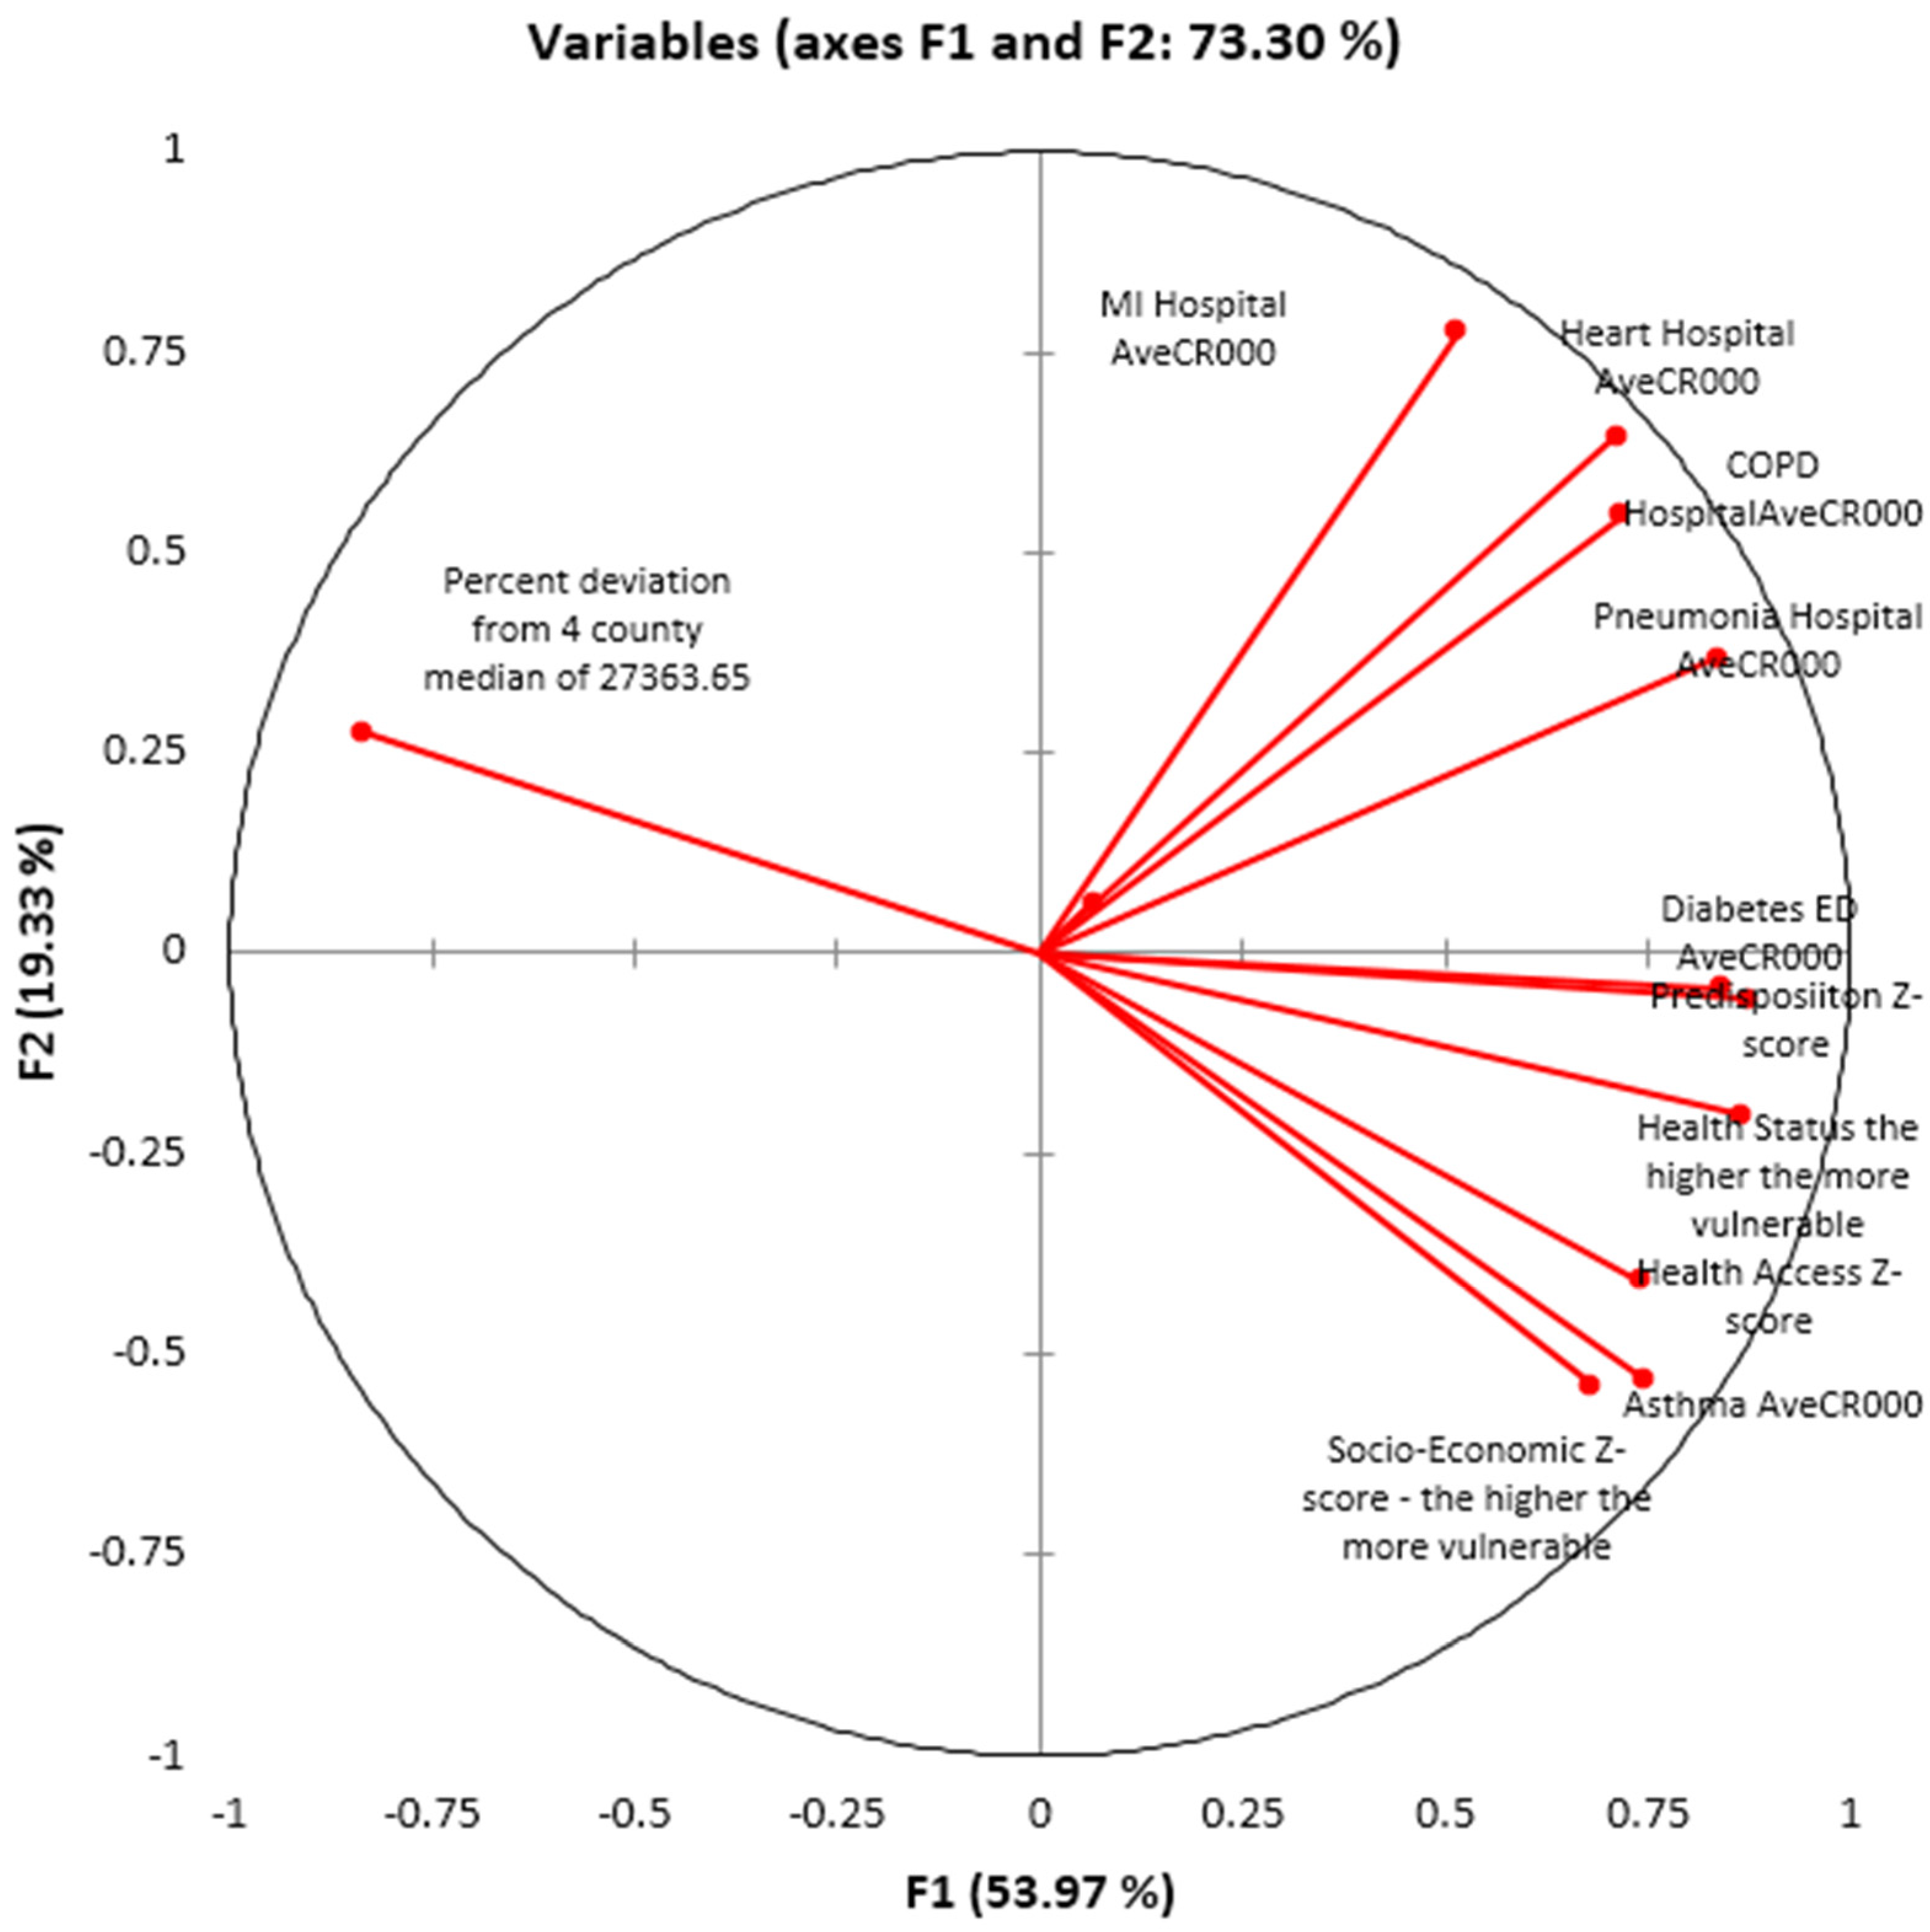
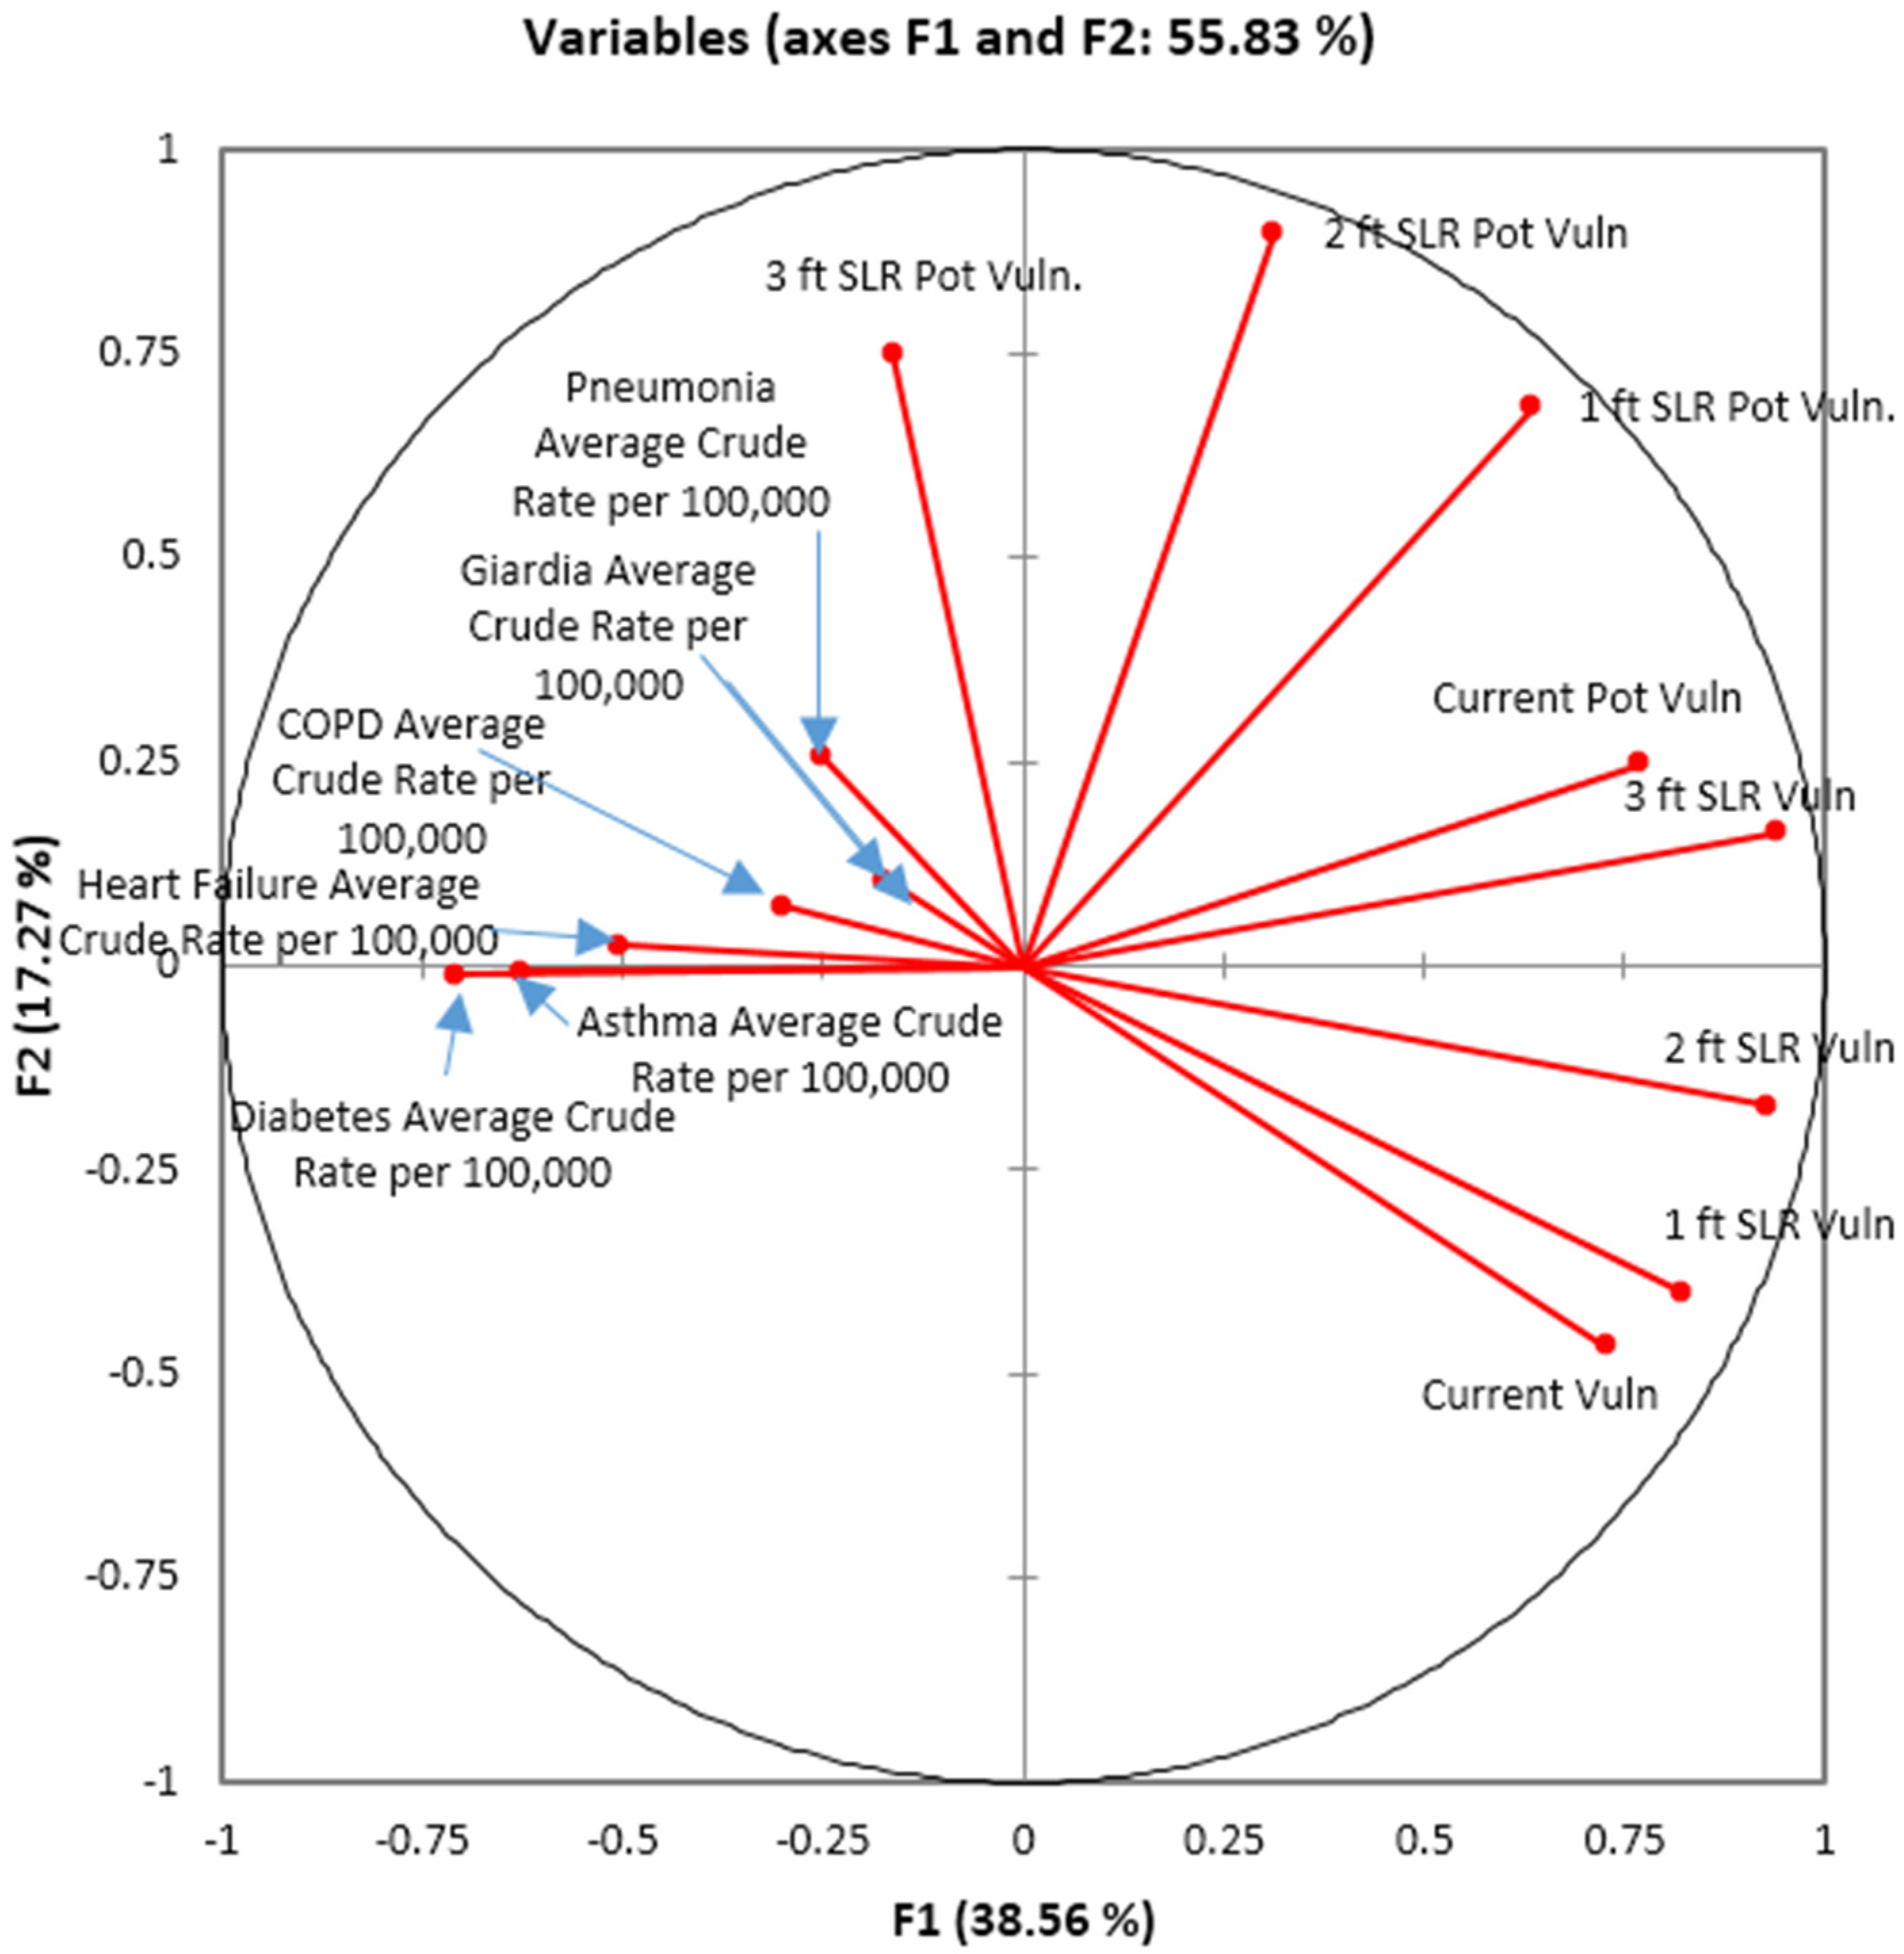
3.2. Results from the Statistical Analysis

Using XLStat® (Addinsoft, New York, NY, USA) an add-on to EXCEL® (Microsoft, Redmond, WA, USA), statistical analysis was conducted for the sea-level rise potential, demographic data and disease incidences. First, sea-level rise data were analyzed, for the current, 1, 2, and 3 foot sea-level rise scenarios, showing the vulnerable and potentially vulnerable land. Figure 5 compares these numbers directly, illustrating that more land is vulnerable as sea-level rises.
Various analyses were undertaken. Exploring disease versus demographic characteristics, PCA found that six factors explained 80% of the variation in the data. For all analyses, there was strong correlation between social and health vulnerability as measured by lower income, percent of minority populations, lower educational attainment, lack of fluency in English, low penetration of medical services, disability status, and age. Figure 6 shows a varimax PCA plot of social and health indicators versus income above the median. Not surprisingly, there was an inverse correlation between higher income and social and health vulnerability. Figure 7 indicates the result when income and social indicators are compared to sea level rise vulnerability. This plot shows that a higher income level is correlated with SLR vulnerability—the wealthier people live in more geographically vulnerable areas (the coast and newer houses in the western areas) but that, with time, the vulnerability rotates toward increased social and health vulnerability. The results indicate that an increase in vulnerable land area affects a larger and more diverse population.

3.3. Outreach

Outreach activities with local stakeholders from June through November of 2015 were focused on discussions of some of the key findings of this study, including (i) the possible expansion of vulnerable area over time; (ii) the lack of evidence that the most vulnerable land areas are currently correlated with the most vulnerable populations; (iii) the lack of knowledge on future distributions of vector and waterborne diseases; (iv) the need for incremental strategies as new data become available; (v) the need for planning actions to reduce both socio-economic and place-based vulnerability; and (vi) the need for better monitoring/reporting of disease. Other messages were that adaptation must be coordinated; strategies must be incremental, and there is a need for a plan for impacts to both socioeconomically- and geographically-vulnerable populations. In all, these issues are designed to raise awareness among key stakeholders and policy-makers of the correlation between non-chronic health impacts and socioeconomic and geographic vulnerable populations. It also permitted the research team to compile framework tools of options that might be useful in dealing with the social and health vulnerability.
The South Florida Regional Planning Council initiated the dialogue with policy-makers and planners. The Council reached out to the Southeast Florida Regional Climate Change Compact, a seven-county organization focused on climate change. Within the next two years, the Southeast Florida Regional Climate Change Compact will amend their action plan, and begin to prioritize areas for adaptation implementation. This provided the opportunity for a Health Impact Assessment (HIA) to be performed to ensure that human health is considered throughout the update and implementation process [35]. In the screening phase, the HIA was designed to be timely such that its findings and recommendations are able to assist jurisdictions and decision-makers in understanding the local health implications of climate change in each of the six sections of the Climate Change Compact’s Action Plan.

4. Discussion

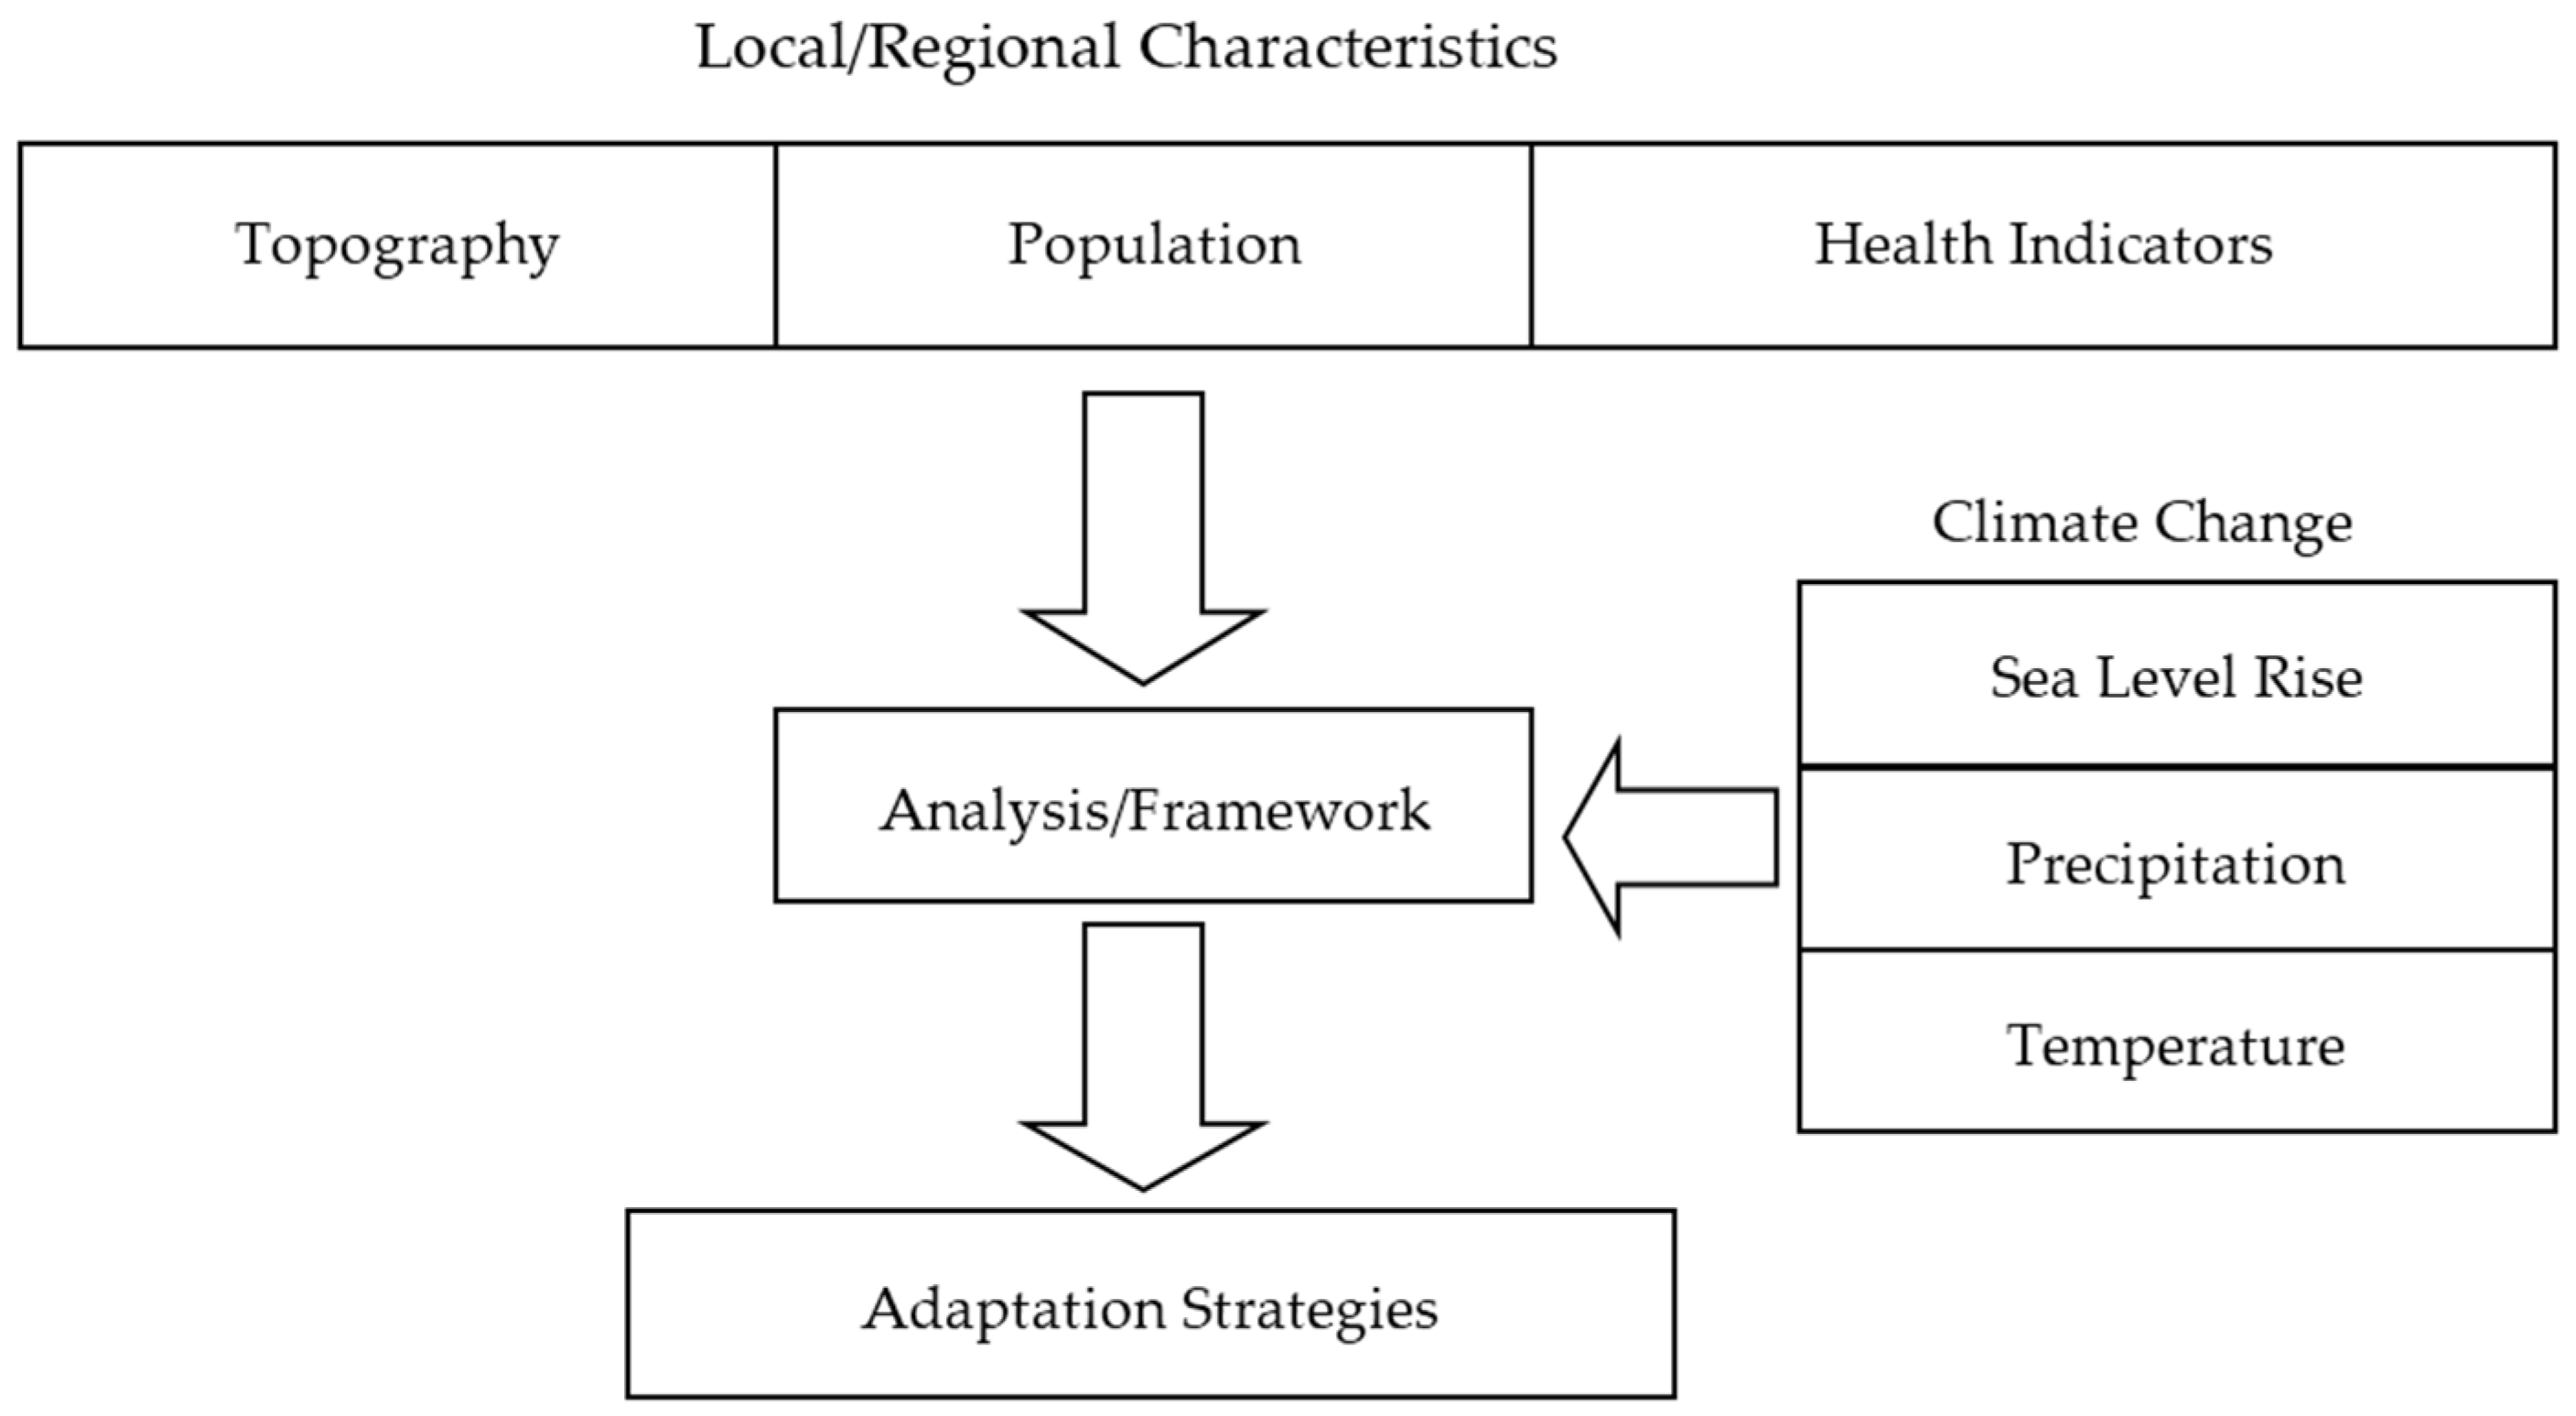
4.1. Proposed Frameowrks

Based on findings of the vulnerable areas, the next task involves the development of scenarios whereby various options can be utilized to address community vulnerability. The goal is to identify successful flood mitigation strategies used by other cities that face similar drainage and construction problems based on identified vulnerabilities and cost effectiveness. These two issues are then combined to develop a framework to evaluate the impacts of climate change on infrastructure and urban development (as they are intrinsically intertwined). Figure 8 outlines a simplified flow chart used as a basis for the evaluation.
The strength of this framework lies in the proposed holistic and incremental approach to addressing climate change impacts which entails understanding of combined social and health vulnerabilities in the context of higher exposure of the physical infrastructure to hazards. As such, it combines physical vulnerability with health indicators and social evaluation criteria, and conveys the notion that a plan is not a fixed document, but rather a process that evolves with the changing environment. The final two steps occur at regular intervals at the community level with associated adjustments made to the initial plans for improvements to various infrastructure systems.
The final task was to develop a series of strategies that could be used to improve the regional resiliency to sea level rise. The first set of strategies focuses on hard infrastructure systems. Roadways are the first areas that will see more frequent flooding since roadways are traditionally built at elevations lower than the finished floor of structures. In addition, most infrastructure systems are co-located with roadways (water, sewer, storm water, power, etc.). As a result, there is a need to prioritize where funds are spent on transportation infrastructure and other major investments. Table 1 outlines hard infrastructure solutions for flood and property protection. Catastrophic flooding would be expected during heavy rain events because of reduced capacity of the drainage system. The vulnerability of transportation infrastructure will require the design of more resistant and adaptive infrastructure and network systems. This would, in turn, involve the development of new performance measures to assess the ability of transportation infrastructure (e.g., roadways, bridges, rail, sea ports, and airports) in preparation for sea-level rise and to enhance resiliency standards and guidelines for design and construction of transportation facilities. Specifically, considerations must include retrofitting, material protective measures, rehabilitation and, in some cases, the relocation of a facility to accommodate sea-level rise impacts. As they are related, groundwater is, similarly, expected to have a significant impact on flooding in these low-lying areas as a result of the loss of soil storage capacity; yet, this continues to not be the focus of many planning efforts.
A number of strategies can be considered for improving water supplies, although the applicability will vary from one location to the other. Table 2 summarizes the tools that can be used to help protect water resources from the impacts of climate change, which would in turn protect public health by protecting drinking water supplies. Table 3 outlines efforts to address social issues. At the center of these planning efforts should also be provisions for an adequate drainage system, designed to accommodate increased volume of water from precipitation events and rising tides. This provision will be critical in protecting the roadway base and the infrastructure beneath it. Since these systems will not be viable as sea-levels rise, future storm water systems should be designed like sanitary sewers with tight piping, with minimal allowances for infiltration, and adequately-sized pumping stations that permit discharge points and means for associated treatment of the stormwater. Discharges of storm water to water bodies may portend poorly to vital seagrasses and reefs, so some effort will be required to determine the level of treatment needed to protect the ecosystem in the face of excessive water levels. Drainage wells could be an essential component to improving drainage systems. These wells require splitter boxes and filters to remove solids, regular inspections, and regular maintenance which would all need to be included in budget considerations.

4.2. Needs

To address the gaps in knowledge a number of tools could be developed. Models of population migration should be reviewed to determine if sufficient data exists to probabilistically evaluate potential patterns of migration. A second effort may be to develop a probabilistic model that combines sea-level rise (as it affects the amount of livable property, the projected increases in population, the project property values, and projected growth in economic activity in the future). Such an effort might be useful as a predecessor to population migration as a means to address the tipping point. A third effort would be to evaluate current data overseas regarding disease incidence and develop predictive models of growth in Southeast Florida. Limited data might suggest another Bayesian exercise, but the application would need further evaluation given altered conditions that exist in Southeast Florida. A fourth effort would be to develop tools to assess the impacts of sea level rise to chronic conditions given that little impacts could be discerned in this project. There is insufficient evidence to determine if chronic conditions are exacerbated by sea level rise, so an effort should be developed to engage health practitioners in developing long-term data on disease incidence, long-term strategies to address the effects of climate change, and a means to communicate these strategies to the public.

5. Conclusions

This study has found that, at present, there is a strong correlation between vulnerability associated with a number of health indicators and social vulnerability in the study area. Spatially, the most vulnerable populations are not found in the most physically vulnerable areas at present, but exposure will increase with time. However, the lack of data on emerging diseases makes future projections regarding the health impacts of sea level rise a challenge.
Preliminary results from this study indicate that the future effects of sea level rise requires a multidimensional perspective which incorporates the need to address physical, social, and health vulnerabilities conjointly and in a cohesive manner. An outcome of this study is a series of options to assist decision-makers in addressing the anticipated vulnerabilities based on more detailed local studies. In this context, it is ever more important to continue research in climate change and sea-level rise and its impacts on the natural and built environment.
Sea level rise will decrease available land, increase competition for development, and will require additional infrastructure and costs. Given the growing population and the constraints on land availability, altered redevelopment patterns will increase competition for lower prices and higher ground, challenging the ability of socially-vulnerable populations to respond to the impacts of sea-level rise. Processes of migration will likely lead to an increase of the number of people at risk. A better understanding of future trends in mosquito-spread diseases like Zika, dengue fever, or chikungunya, or waterborne diseases, like giardia and cryptosporidium, is also necessary to adequately address the challenges posed by climate change. Adaptation strategies depend on funding, and preliminary assessment of availability of resources is needed to address social and infrastructure needs in the future. Community involvement is critical as adaptation efforts will be organized and shaped by challenges at the neighborhood, rather than regional, scale.

Acknowledgments

The authors would like to acknowledge the Kresge Foundation which funded this project.

Author Contributions

Frederick Bloetscher was the primary author of the paper, developed the sea level rise methodology and maps and conducted the statistical analysis. Colin Polsky is the Director for the Center for Environmental Studies at Florida Atlantic University. His contribution was the review, organization and coordination of work products and this paper. Keren Bolter and Diana Mitsova performed the research, accessed, organized and contributed the social data sources. Keren Bolter edited the paper. Kristin Pablicke Garces performed the research to generate the health data. Roderick King was responsible for the design of the research. Isabel Cosio Carballo and Karen Hamilton organized and facilitated the public outreach portion of the project that led to Table 3. All authors have reviewed and approved the paper.

Conflicts of Interest

The authors declare no conflict of interest.

References

  1. Heimlich, B.N.; Bloetscher, F.; Meeroff, D.E.; Murley, J. Southeast Florida’s Resilient Water Resources: Adaptation to Sea Level Rise and Other Impacts of Climate Change; Center for Urban and Environmental Solutions at Florida Atlantic University: Boca Raton, FL, USA, 2009; Available online: http:/www.ces.fau.edu/files/projects/climate_change/SE_Florida_Resilient_Water_Resources.pdf (accessed on 29 March 2016).
  2. Bloetscher, F.; Meeroff, D.E.; Heimlich, B.N. Improving the Resilience of a Municipal Water Utility against the Likely Impacts of Climate Change, A Case Study: City of Pompano Beach Water Utility; Florida Atlantic University: Boca Raton, FL, USA, 2009; Available online: http://www.ces.fau.edu/files/projects/climate_change/PompanoBeachWater_CaseStudy.pdf (accessed on 29 March 2016).
  3. Pachauri, R.; Reisinger, A. (Eds.) Contribution of Working Groups I, II and III to the Fourth Assessment Report to the Fourth Assessment Report of the Intergovernmental Panel on Climate Change; Climate Change 2007: Synthesis Report; IPCC: Geneva, Switzerland, 2007.
  4. Southeast Florida Regional Climate Change Compact Technical Ad hoc Work Group. A Unified Sea Level Rise Projection for Southeast Florida. A document prepared for the Southeast Florida Regional Climate Change Compact Steering Committee. 2011. Available online: http://southeastfloridaclimatecompact.org/pdf/Sea%20Level%20Rise.pdf (accessed on 15 December 2014).
  5. United States Census Bureau. State and County Quickfacts: Florida. 2012. Available online: http://quickfacts.census.gov/qfd/states/12000.html (accessed on 15 March 2015). [Google Scholar]
  6. Church, J.A.; White, N.J. Sea-level rise from the late 19th to the early 21st century. Surv. Geophys. 2011, 32, 585–602. [Google Scholar] [CrossRef]
  7. Gregory, J.M.; Browne, O.J.H.; Payne, A.J.; Ridley, J.K.; Rutt, I.C. Modelling large-scale ice-sheet-climate interactions following glacial inception. Clim. Past 2012, 8, 1565–1580. [Google Scholar] [CrossRef]
  8. Domingues, C.M.; Church, J.A.; White, N.J.; Gleckler, P.J.; Wijffels, S.E.; Barker, P.M.; Dunn, J.R. Improved estimates of upper-ocean warming and multi-decadal sea-level rise. Nature 2008, 453, 1090–1093. [Google Scholar] [CrossRef] [PubMed]
  9. Gregory, J.M. Sea level Rise: What Makes Prediction So Difficult? NERC: Atlanta, GA, USA, 2008; pp. 24–27. [Google Scholar]
  10. Vermeer, M.; Rahmstorf, S. Global sea level linked to global temperature. Proc. Natl. Acad. Sci. USA 2009, 106, 21527–21532. [Google Scholar] [CrossRef] [PubMed]
  11. Jevrejeva, S.; Moore, J.C.; Grinsted, A. How will sea level respond to changes in natural and anthropogenic forcings by 2100? Geophys. Res. Lett. 2010, 37, 256–265. [Google Scholar] [CrossRef]
  12. U.S. Army Corps of Engineers (USACE). Water Resource Policies and Authorities, Incorporating Sea level Change Considerations in Civil Works Programs; Expires July 2011; CECW-CE Circular No. 1165-2-211; Department of the Army, U.S. Army Corps of Engineers: Washington, DC, USA, 2009.
  13. Bloetscher, F.; Romah, T.; Berry, L.; Hernandez Hammer, N.; Cahill, M.A. Identification of Physical Transportation Infrastructure Vulnerable to Sea Level Rise. J. Sustain. Dev. 2012, 5, 40–51. [Google Scholar] [CrossRef]
  14. Bloetscher, F.; Romah, T. Tools for assessing sea level rise vulnerability. J. Water Clim. Chang. 2015, 6, 181–190. [Google Scholar] [CrossRef]
  15. Romah, T. Advanced Methods in Sea Level Rise Vulnerability Assessment. Master’s Thesis, Florida Atlantic University, Boca Raton, FL, USA, December 2012. [Google Scholar]
  16. Chang, S.W.; Clement, T.P.; Simpson, M.J.; Lee, K.K. Does sea-level rise have an impact on saltwater intrusion? Adv. Water Resour. 2011, 34, 1283–1291. [Google Scholar] [CrossRef] [Green Version]
  17. Bolter, K.P. Perceived Risk versus Actual Risk to Sea-Level Rise: A Case Study in Broward County; Florida Atlantic University: Boca Raton, FL, USA, 2014. [Google Scholar]
  18. Zhang, K. Analysis of non-linear inundation from sea-level rise using LIDAR data: A case study for South Florida. Clim. Chang. 2011, 106, 537–565. [Google Scholar] [CrossRef]
  19. Karl, T.; Melillo, J.; Peterson, T. (Eds.) Global Climate Change Impacts in the United State; Cambridge University Press: Cambridge, UK, 2009.
  20. Hanson, S.; Nicholls, R.; Ranger, N.; Hallegatte, S.; Corfee-Morlot, J.; Herweijer, C.; Chateau, J. A global ranking of port cities with high exposure to climate extremes. Clim. Chang. 2011, 104, 89–111. [Google Scholar] [CrossRef] [Green Version]
  21. Parkinson, R.W. Adapting to Rising Sea Level: A Florida Perspective. In Sustainability 2009: The Next Horizon; In Proceedings of the AIP Conference, Melbourne, FL, USA, 3–4 March 2009; Available online: https://411.fit.edu/sustainability/documents/FINAL%20-%20With%20Cover%2010-1-09.pdf (accessed on 28 March 2016).
  22. Southeast Florida Regional Climate Compact (SFRCCC). Analysis of the Vulnerability of Southeast Florida to Sea-Level Rise. 2012. Available online: http://www.southeastfloridaclimatecompact.org/wp-content/uploads/2014/09/regional-climate-action-plan-final-ada-compliant.pdf (accessed on 29 March 2016).
  23. Tebaldi, C.; Strauss, B.H.; Zervas, C.E. Modelling sea level rise impacts on storm surges along US coasts. Environ. Res. Lett. 2012, 7. Article 1. [Google Scholar] [CrossRef]
  24. Titus, J.G.; Richman, C. Maps of lands vulnerable to sea level rise: Modeled elevations along the US Atlantic and Gulf coasts. Clim. Res. 2001, 18, 205–228. [Google Scholar] [CrossRef]
  25. Weiss, J.L.; Overpeck, J.T.; Strauss, B. Implications of recent sea level rise science for low-elevation areas in coastal cities of the conterminous USA. Clim. Chang. 2011, 105, 635–645. [Google Scholar] [CrossRef]
  26. Haines, A.; Kovats, R.S.; Campbell-Lendrum, D.; Corvalan, C. Climate change and human health: Impacts, vulnerability and public health. Public Health 2006, 120, 585–596. [Google Scholar] [CrossRef] [PubMed]
  27. Hess, J.J.; McDowell, J.Z.; Luber, G. Integrating climate change adaptation into public health practice: Using adaptive management to increase adaptive capacity and build resilience. Environ. Health Perspect. 2012, 120, 171–179. [Google Scholar] [CrossRef] [PubMed]
  28. Kjellstrom, T.; McMichael, A. Climate change threats to population health and well-being: The imperative of protective solutions that will last. Glob. Health Act. 2013, 6. [Google Scholar] [CrossRef] [PubMed]
  29. Portier, C.; Thigpen Tart, K.; Carter, S.; Dilworth, C.; Grambsch, A.; Gohlke, J.; Hess, J.; Howard, S.; Luber, G.; Lutz, J.; et al. A Human Health Perspective on Climate Change: A Report Outlining the Research Needs on the Human Health Effects of Climate Change; Environmental Health Perspectives/National Institute of Environmental Health Sciences: Research Triangle Park, NC, USA, 2010. Available online: www.niehs.nih.gov/climatereport (accessed on 23 October 2014). [CrossRef]
  30. Doherty, T.J.; Clayton, S. The psychological impacts of global climate change. Am. Psychol. 2011, 66, 265–276. [Google Scholar] [CrossRef] [PubMed]
  31. Rose, J.B.; Epstein, P.R.; Lipp, E.K.; Sherman, B.H.; Bernard, S.M.; Patz, J.A. Climate variability and change in the United States: Potential impacts on water-and foodborne diseases caused by microbiologic agents. Environ. Health Perspect. 2001, 109 (Suppl. S2), 211–221. [Google Scholar] [CrossRef] [PubMed]
  32. Pleitez Herrera, F.J. Predicting Removal Efficiency of Reverse Osmosis Membranes with Respect to Emerging Substances of Concern Using a Discriminant Function Analysis. Master’s Thesis, Florida Atlantic University, Boca Raton, FL, USA, 2012. [Google Scholar]
  33. Esty, D.C.; Levy, M.; Srebotnjak, T.; de Sherbinin, A. Environmental Sustainability Index: Benchmarking National Environmental Stewardship; Yale Center for Environmental Law & Policy: New Haven, CT, USA, 2005. [Google Scholar]
  34. Funari, E.; Manganelli, M.; Sinisi, L. Impact of climate change on waterborne diseases. Ann. Ist. Super. Sanità 2012, 48, 473–487. [Google Scholar] [CrossRef] [PubMed]
  35. Southeast Florida Regional Climate Change Compact (SEFRCCC); Health Impact Assessment (HIA). Minimizing the Health Effects of Climate Change in the South Florida Region, Regional Climate Action Plan. Final Report. Available online: http://www.pewtrusts.org/~/media/assets/external-sites/health-impact-project/climatechangeinsouthfloridafinalreport31814.pdf?la=en (accessed on 28 March 2016).
Figure 1. Projected sea level rise.
Sustainability 08 00315 g001
Figure 2. Using the six years of tides, the 99th percentile for the City of Miami Beach which was used as a test case—four days flooding per year is shown in the red line. If sea-level rises one foot, the line will move downward one foot (dashed red line).
Sustainability 08 00315 g002
Figure 3. Palm Beach County Vulnerability at 0, 1, 2, 3 ft SLR at 99 percentile groundwater/tidal elevations (ignoring current infrastructure).
Sustainability 08 00315 g003aSustainability 08 00315 g003b
Figure 4. Miami-Dade and Broward Counties—vulnerability at 0, 1, 2, 3 ft SLR at 99 percentile groundwater/tidal elevations (ignoring current infrastructure).
Sustainability 08 00315 g004aSustainability 08 00315 g004b
Figure 5. Average land area vulnerable and potentially vulnerable in the four county area for the current, 1, 2, and 3 foot sea-level rise scenarios. (a) vulnerable property percentage; (b) potentially vulnerable property percentage.
Sustainability 08 00315 g005
Figure 6. Varimax rotation showing that disease and social vulnerability mostly lie together in the graph.
Sustainability 08 00315 g006
Figure 7. Varimax plot for sea-level rise and disease incidence.
Sustainability 08 00315 g007
Figure 8. Analytical framework for toolbox development.
Sustainability 08 00315 g008
Table 1. Hard Infrastructure Improvements.
Implementation StrategyBenefitsCostBarriers to ImplementationPoint When Action May Need to be Abandoned
Exfiltration TrenchesExcess water drains to aquifer, some treatment provided$250/ftSignificant damage to roadways for installation, maintenance needed, clogging issues reduce benefitsIf groundwater table is above exfiltration piping, the exfiltatrion efficiency diminishes quickly
Infiltration TrenchesExcess water gathered from soil and drained to pump stations, creating storage capacity of soil to store runoff, soil treatment$250/ft plus pump stationSignificant damage to roadways for installation, maintenance needed, clogging issues, costs for pump stationComplete inundation means pumps run constantly and pump the same water over and over
Install stormwater pumping stations in low lying areas to reduce storm water flooding (requires studies to identify appropriate areas, sites and priority levels)Removes water from streets, reduces floodingStart at $1.5 to 5 million each, number unclear without more studyNPDES permits, maintenance cost, land acquisition, discharge qualityWhen full area served is inundated (>3–5 ft SLR)
Added dry retentionRemoves water from streets, reduces flooding$200,000/acreLand availability, maintenance of pond, discharge locationWhen full area served is inundated
Armoring the sewer system (G7 program)Keeps stormwater out of sanitary sewer system and reduces potential for disease spread from sewage overflows. Major public health solution$500/manholelimited expense beyond capital costnone
Central sewer installation in OSTDS areasPublic health benefit of reducing discharges to lawns, canals and groundwater from septic tanks$15,000 per householdCost, assessments against property ownersnone
Raise roadwaysKeeps traffic above floodwaters$2–4 million/lane mileRunoff, cost, utility relocationWhen full area served is inundated
Class V gravity wellsMeans to drain neighborhoods$250,000 eaNeeds baffle box, limited flow volume (1 MGD)When full area served is inundated
Class I injection wellsMeans to drain neighborhoods, 15 MGD capacity$6 millionNeeds baffle boxWhen full area served is inundated
BioswalesMeans to drain neighborhoods, provides treatment of water$0.5 million/mileland area, flow volume, maintenanceWhen full area served is inundated
Raise sea wallsProtects property$0.1–1 million/propertyPrivate property rights, neighborsn/a
Relocate wellfields westward/horizontal wells$20 million assuming locations can be permitted in Biscayne aquifer$20 million assuming locations can be permitted in Biscayne aquiferCost, concern over saltwater intrusion east and west, inundation of wellfields, permitting by SFWMDWhen well is inundated
Salinity/lock structuresKeeps sea out, reduces saltwater intrusionUp to $10 million, may require ancillary storm water pumping stations at $2–5 million eachSFWMD, western residents, private property rights argumentsn/a—solution to retard sea encroachment and saltwater intrusion
Regional relocation of locks and/or conversion to pump stationsCreates regional system to use coastal ridge to protect inland property, keeps saltwater out$200 million eachSFWMD, western residents, private property rights argumentsn/a—solution to retard sea encroachment and protect property which can exist at levels below sea level
Pump to Tidehuge volume of water can be removed from urban areaunknownWater quality to reefs, sea grasses, etc.When full area served is inundated
Table 2. Tools for Protection Water Resources from Climate Change Impacts (adapted from [1]).
Water Resource Adaptation Alternatives
Water conservation
Reducing requirements for additional treatment capacity and development of alternative water supplies (AWS)
Reducing the impact of sea-level rise on existing water sources
Hydrodynamic barriers: aquifer injection/infiltration trenches to counteract saltwater intrusion using treated wastewater
Horizontal wells
Salinity structures and locks control advance of saltwater intrusion
Relocation of wellfields when saltwater intrusion or other threats render wellfield operations impractical
Gaining access to alternative water resources
Desalination of brackish waters
Regional alternative water supplies
Capture and storage of stormwater in reservoirs and impoundments
Aquifer storage and recovery (ASR)
Wastewater reclaim and reuse
Irrigation to conserve water and recharge aquifer
Industrial use and for cooling water
Indirect aquifer recharge for potable water
Stormwater management
Reengineering canal systems, control structures and pumping
Table 3. Soft Infrastructure Improvements.
Implementation StrategyBenefitsCostBarriers to ImplementationPoint When Action May Need to be Abandoned
Increase Access to Health CareImproved health care access should reduce impacts, e.g., vaccinations will not be possible for all climate-related conditions, because of the state of the art in vaccinesunknownCost, ongoing operationsWould occur only if the entire region was abandoned.
Reduce potential for forced migrationLessens risk of socially-vulnerable people moving out vulnerable areasunknownPressure from developers, rental properties at riskn/a
Redevelopment control ordinances and policiesreduces competition for land by removing land from redevelopmentunknownPressure from developers, rental properties at risk, property rights issuesWould occur only if the entire region was abandoned
Assessments for hard infrastructureprovides funding to support social effortssee Table 1 and Table 2Public resistance or public supportWould occur only if the entire region was abandoned
Public acquisition of at risk propertyreduces potential for migration to vulnerable property by taking property out of circulationvarious land regulatory tools: land lease, outright purchase, condemnation; may provide short-term incomePublic resistance or public supportn/a
Vaccinationsreduces riskn/aPublic resistance or public supportn/a
Risk Communicationimproves communication to residents about their vulnerabilityunknownPublic awarenessn/a
Outreachimproves communication to residents about vulnerabilityunknownPublic awarenessn/a

