
Characteristics of Land Use/Cover and Macroscopic Ecological Changes in the Headwaters of the Yangtze River and of the Yellow River over the Past 30 Years


Abstract
:1. Introduction
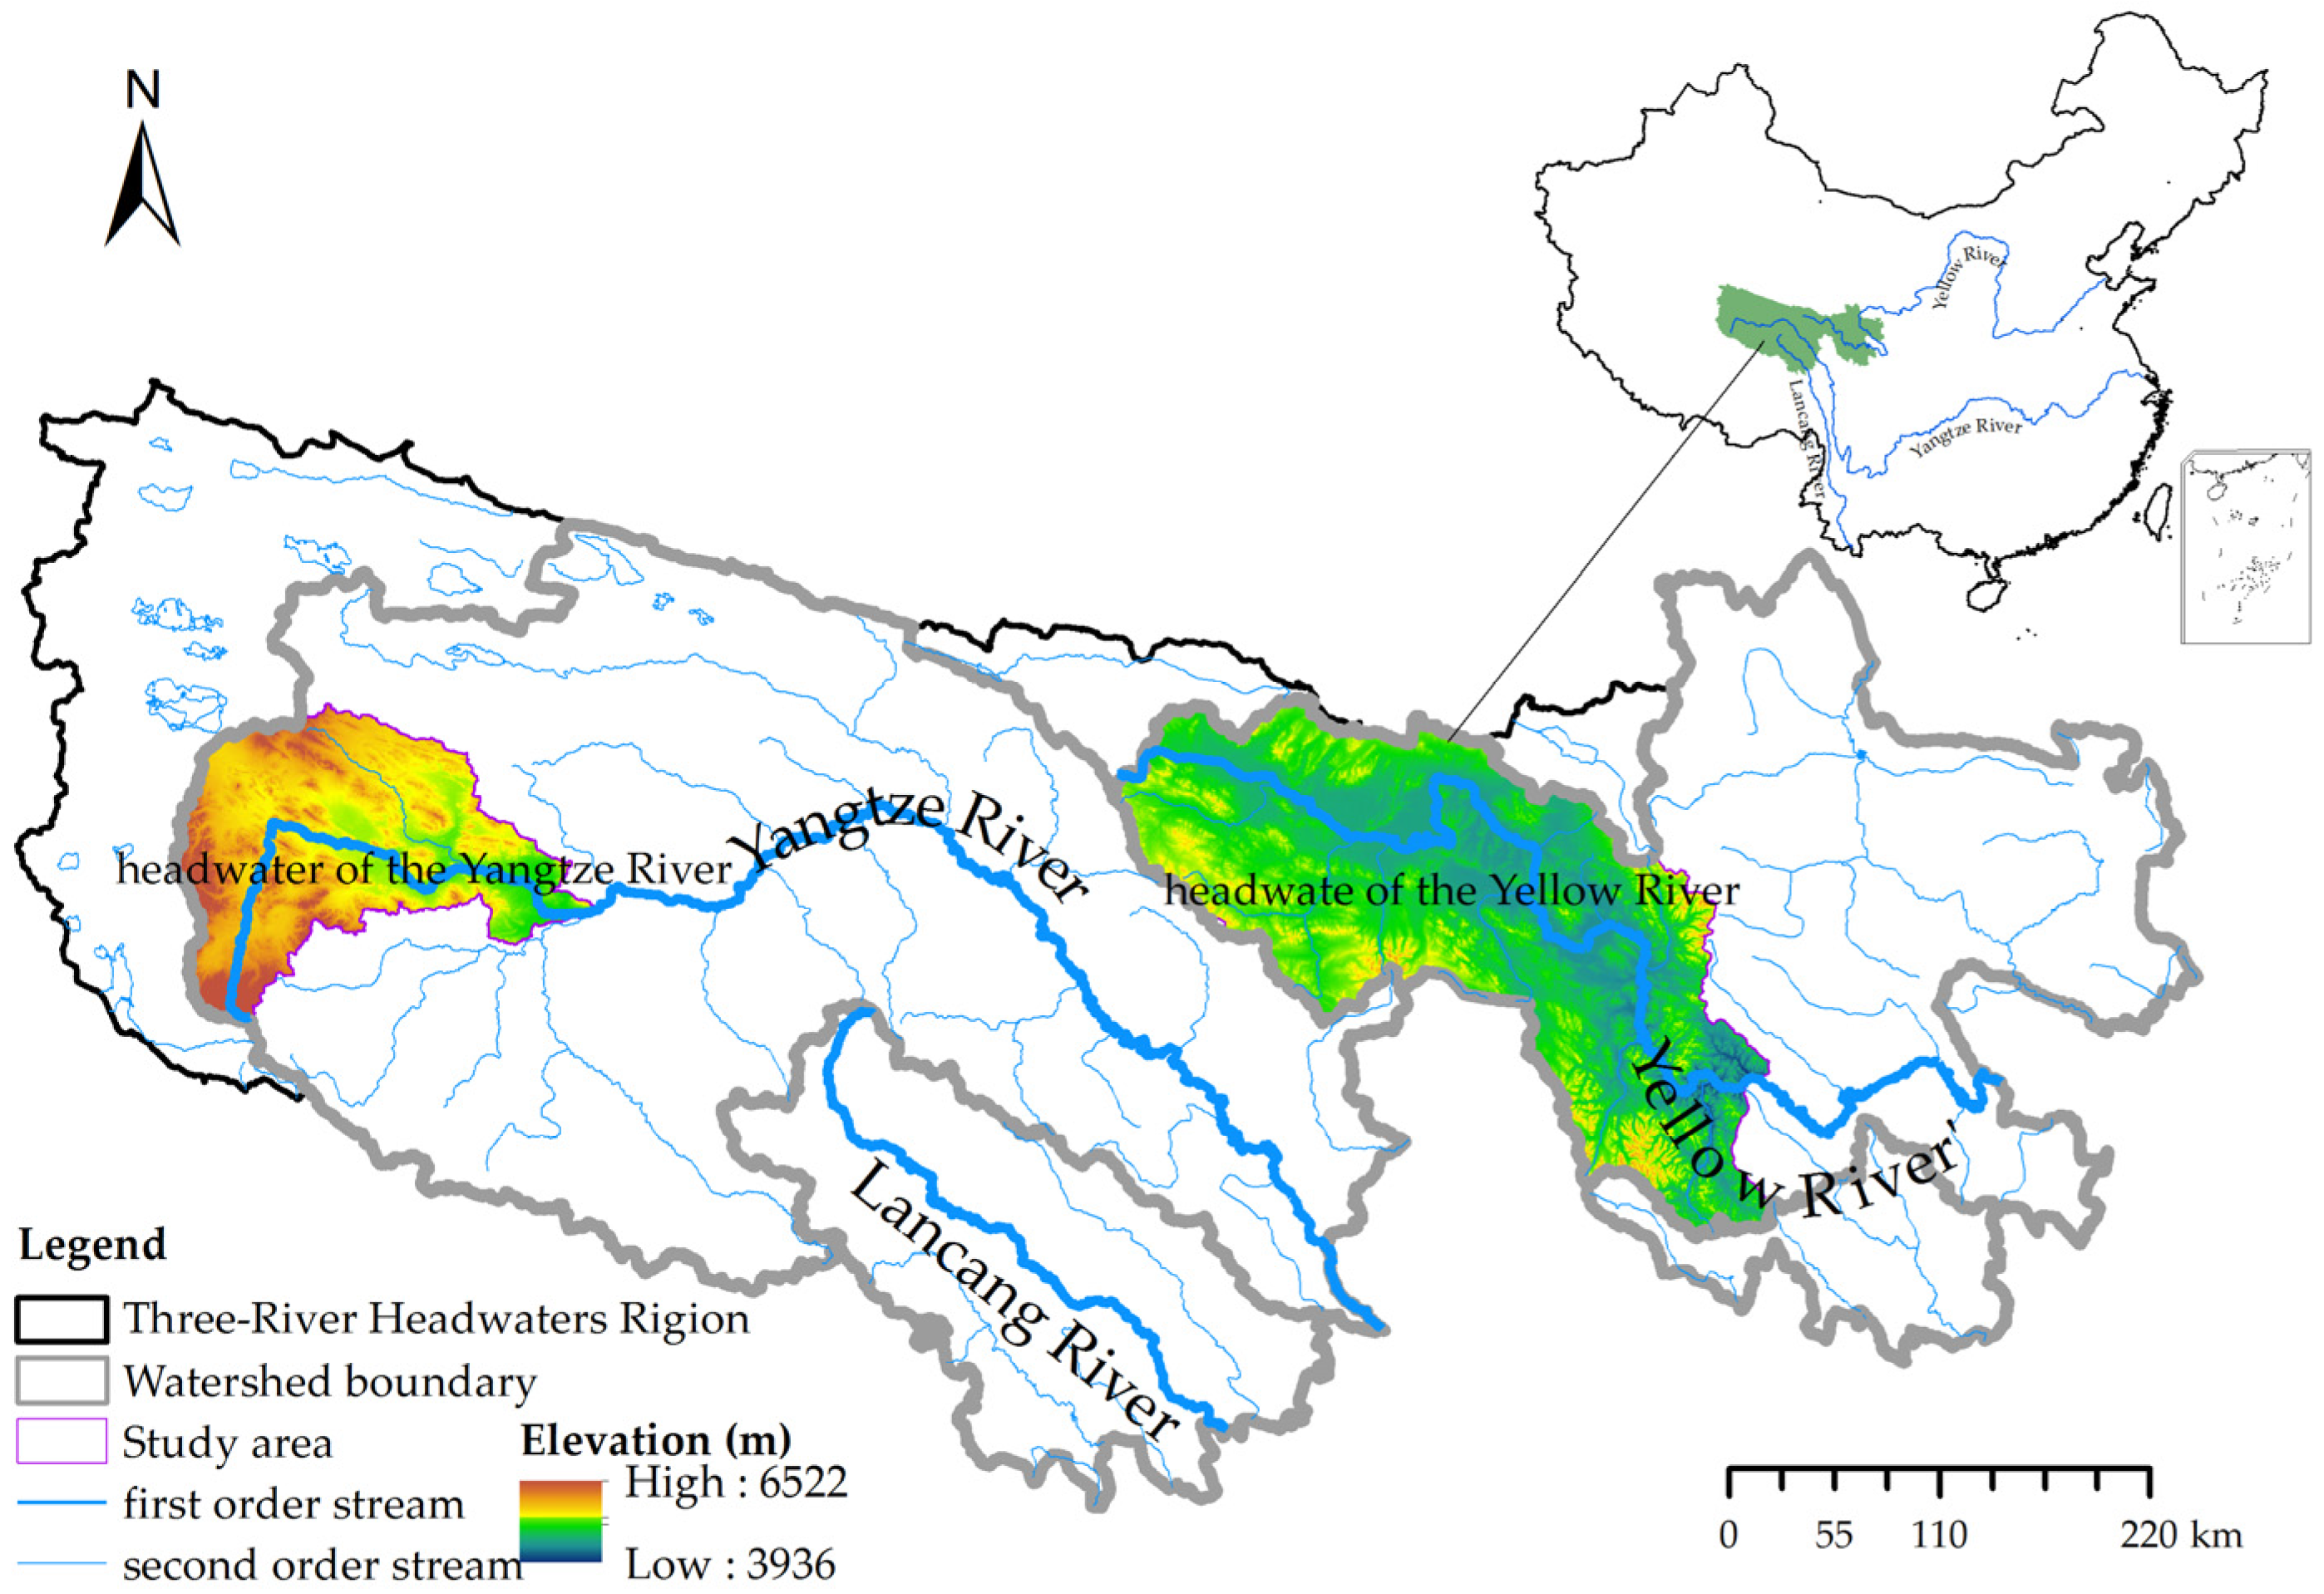
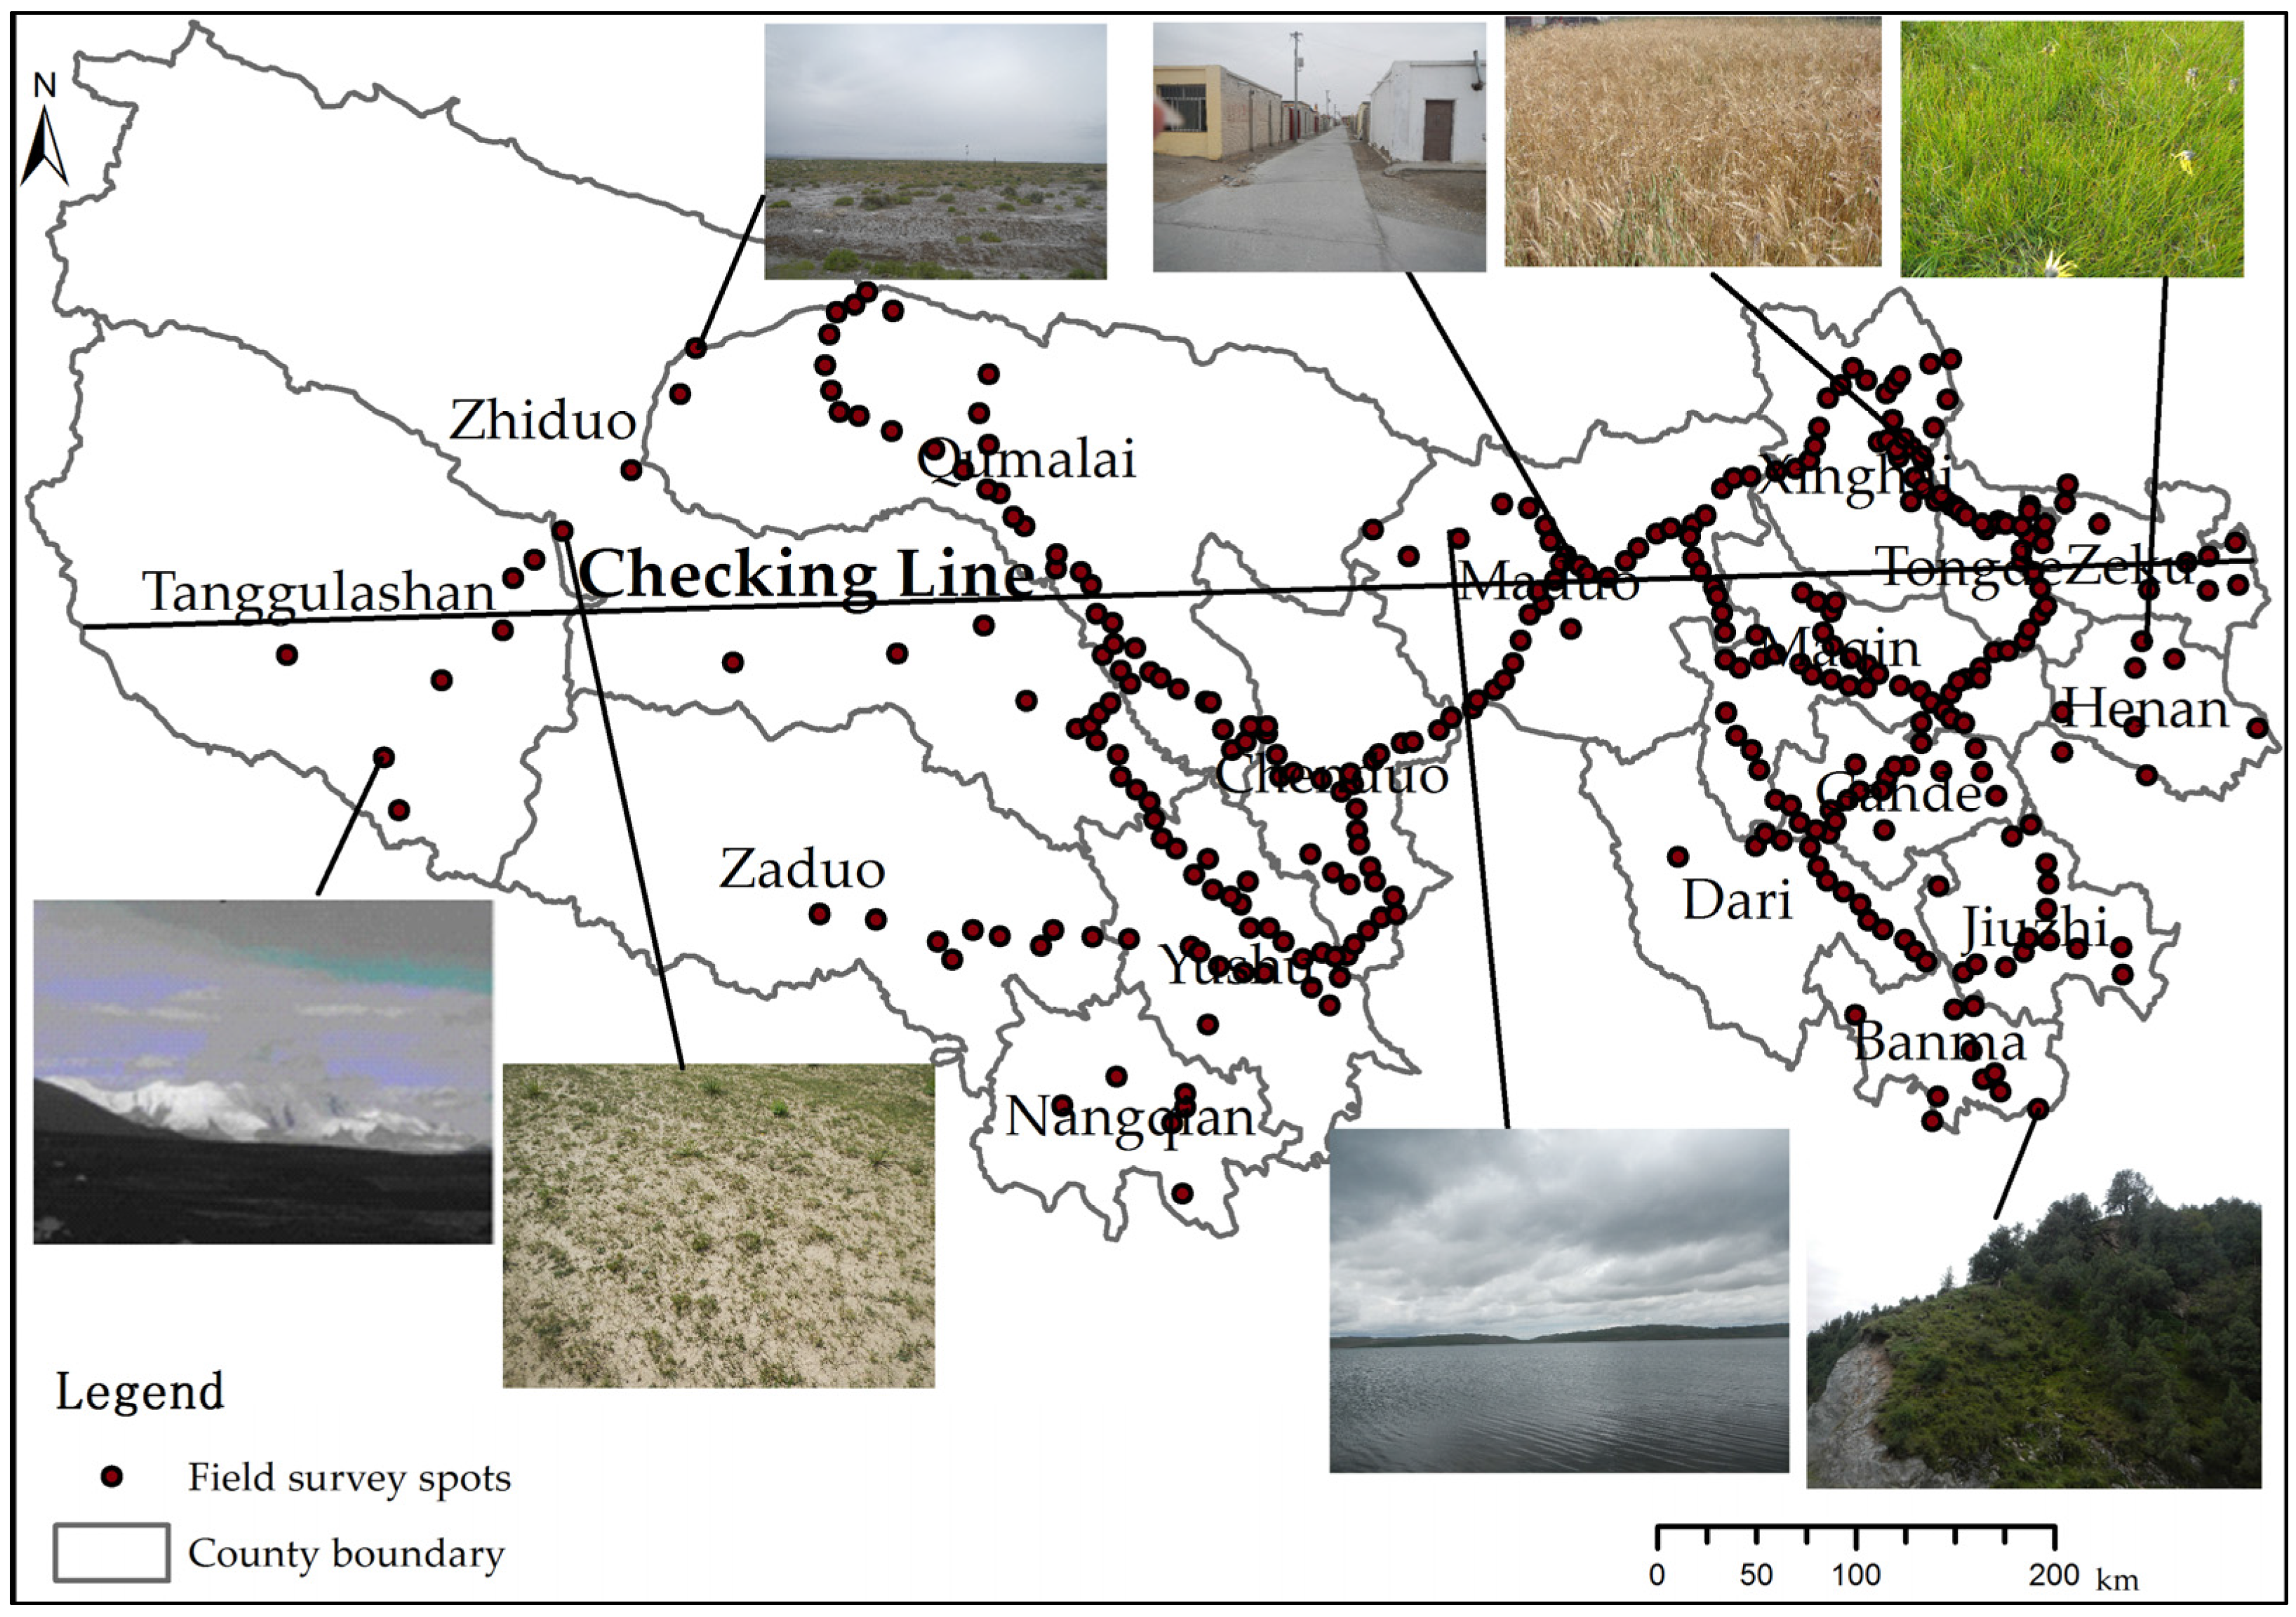
2. Study Area
3. Data and Method
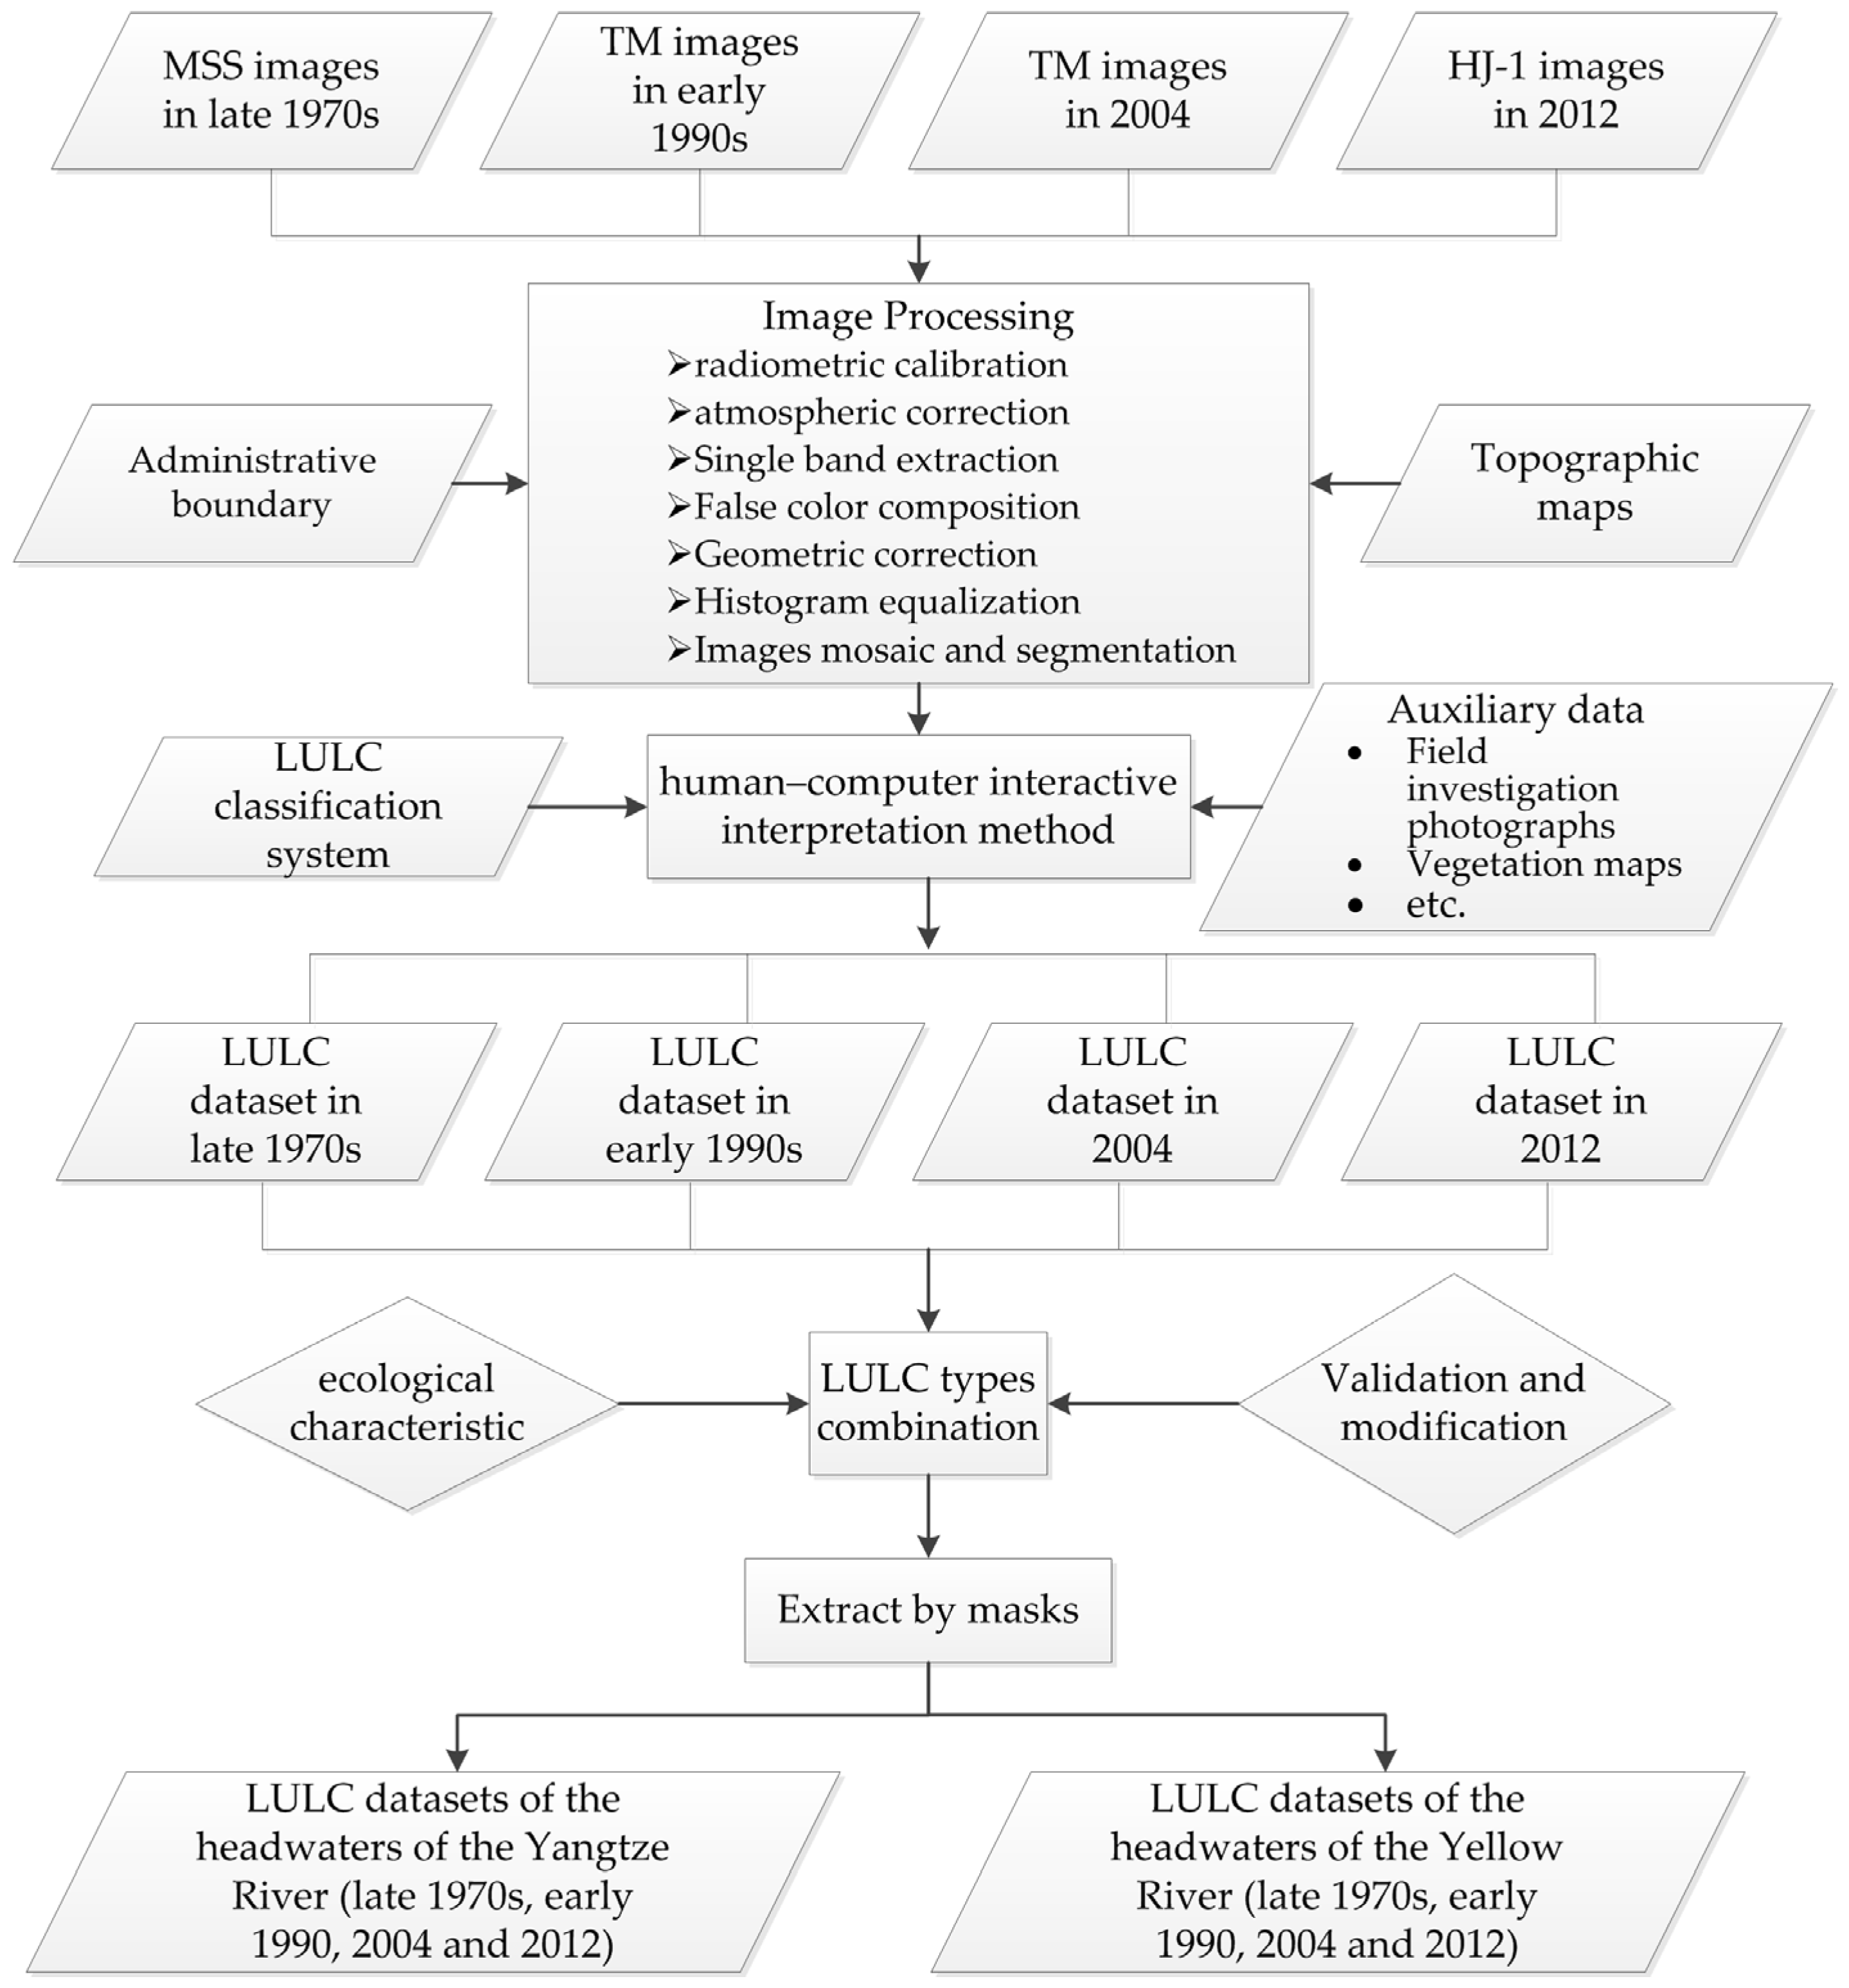
3.1. RS Images Processes
3.1.1. Image Pre-Processing
3.1.2. Classification Methodology
3.1.3. Accuracy Assessment
3.2. Detection of LULC Change
3.3. Land Use/Cover Change Index
4. Results
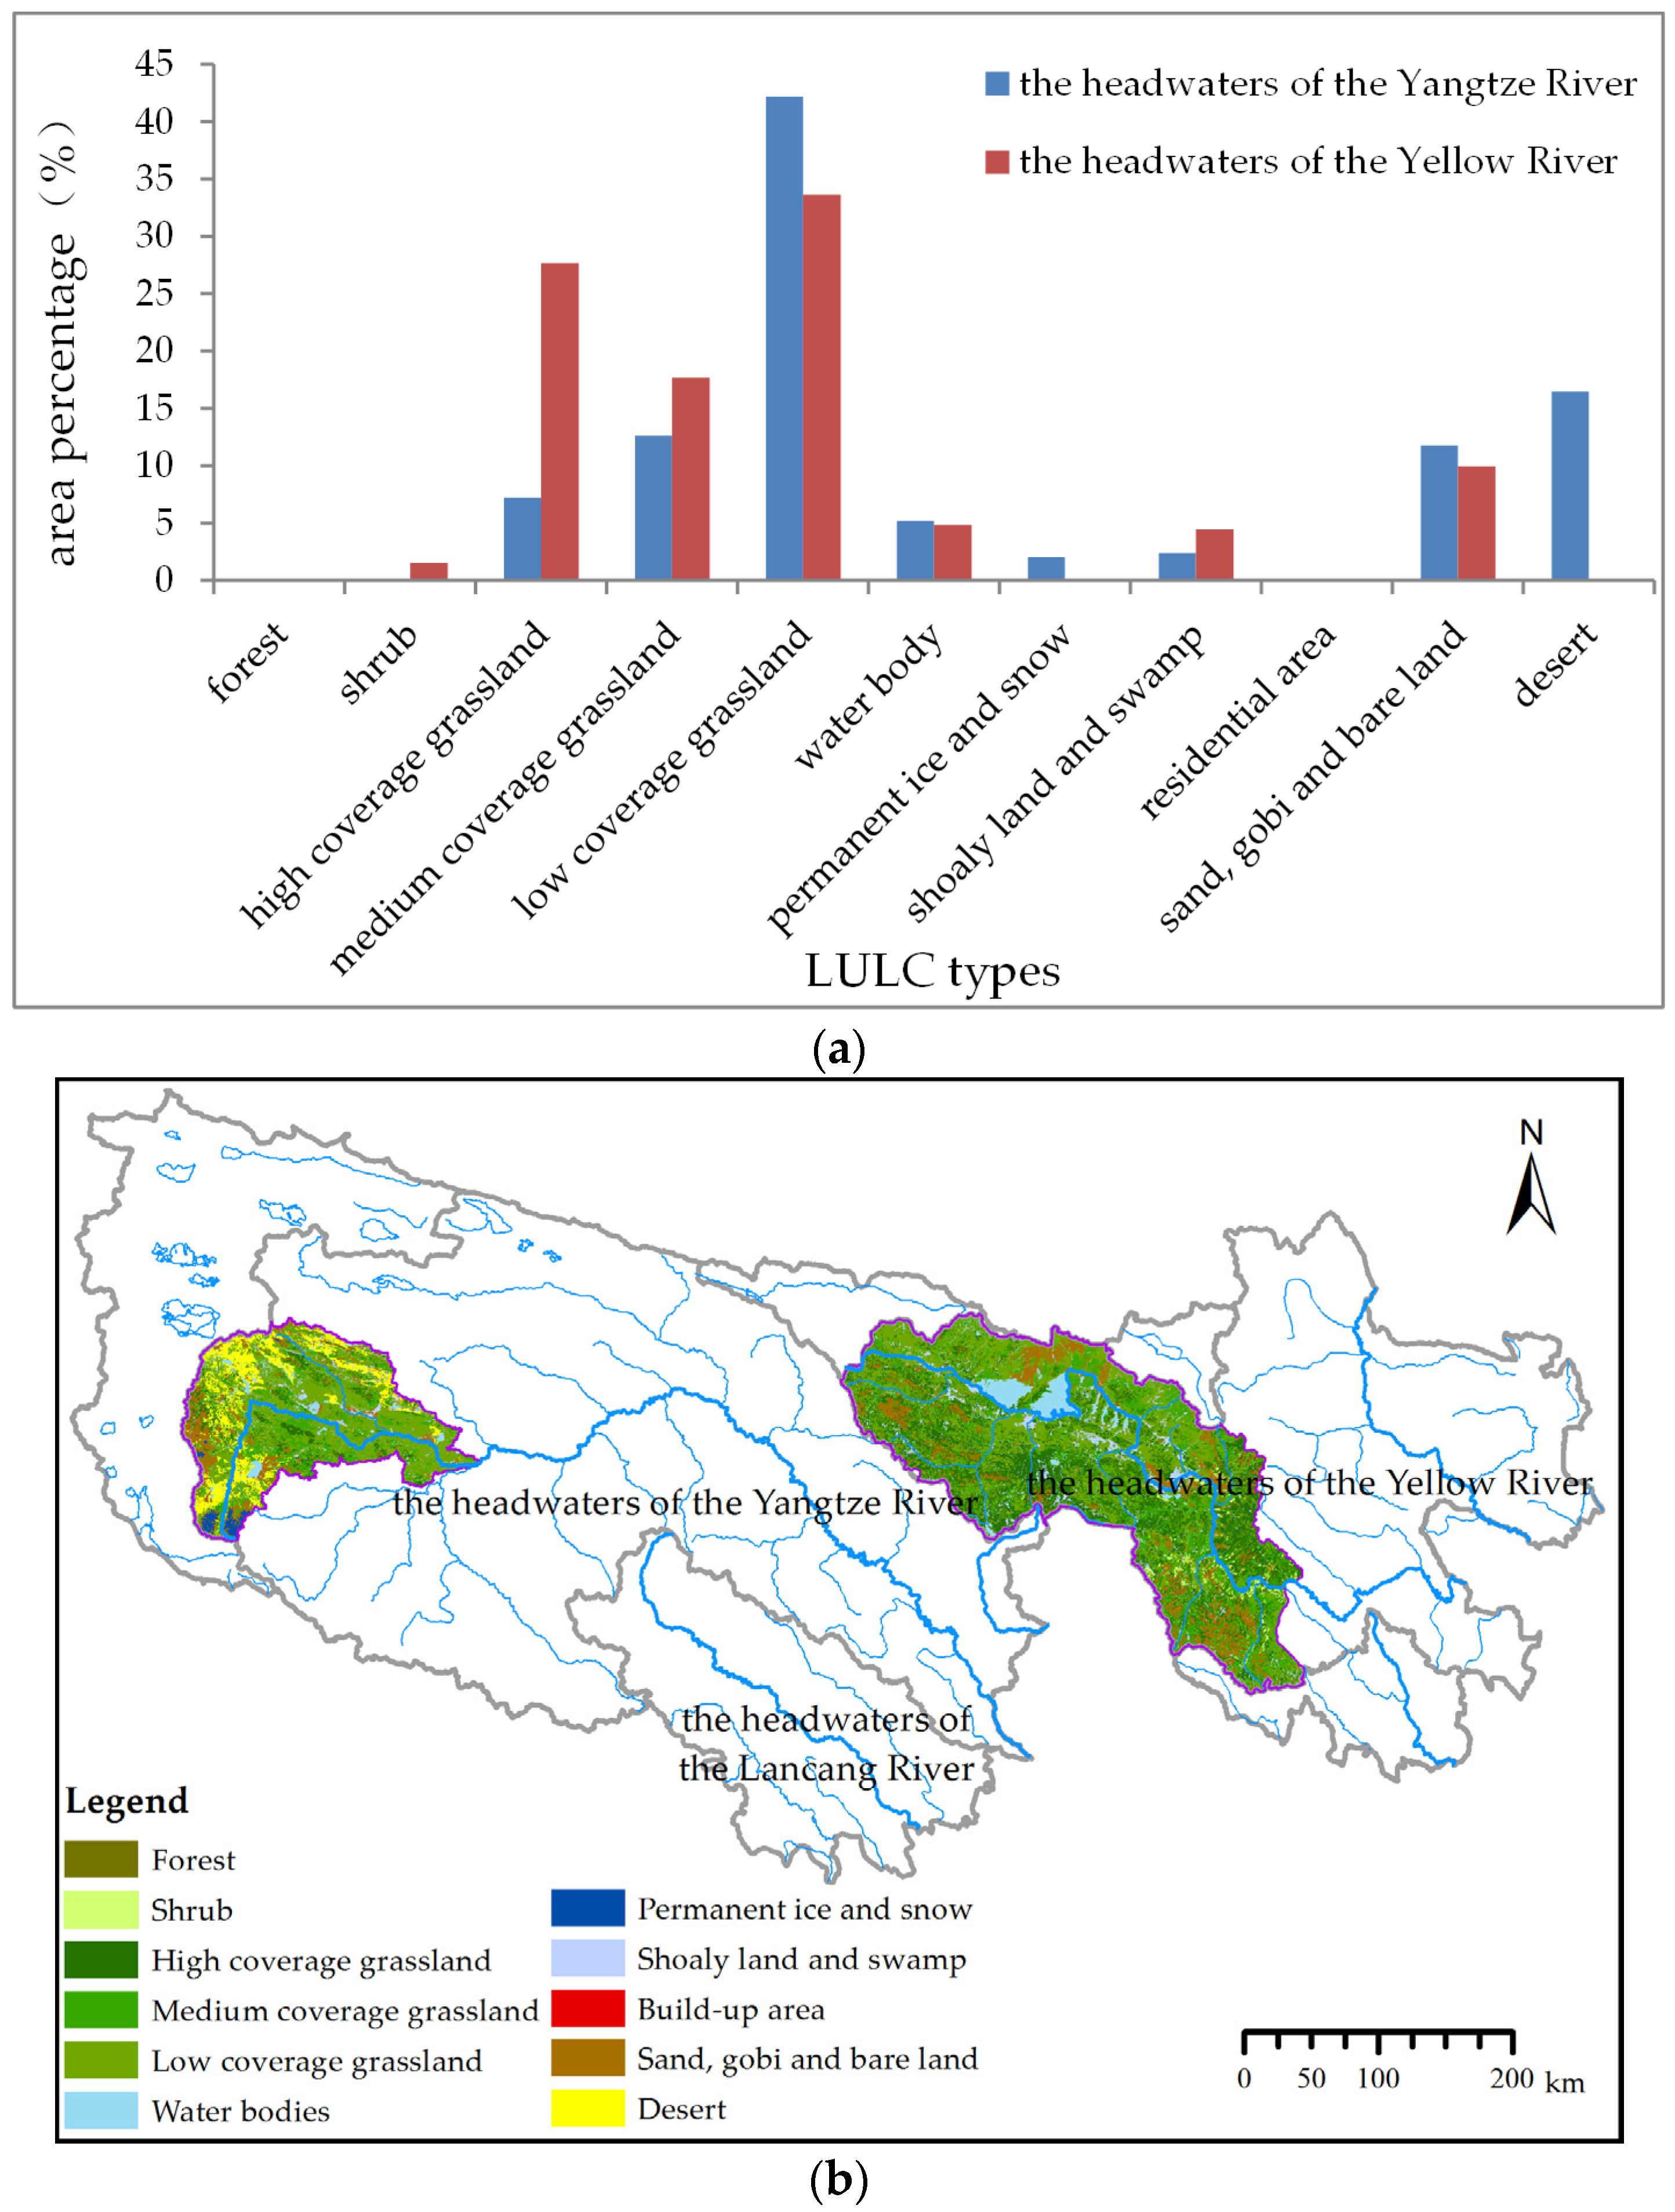
4.1. Land Use/Cover Conditions
4.2. The Direction and Magnitude of LULC Change
4.3. Land Use/Cover Change Index
5. Discussion and Conclusions
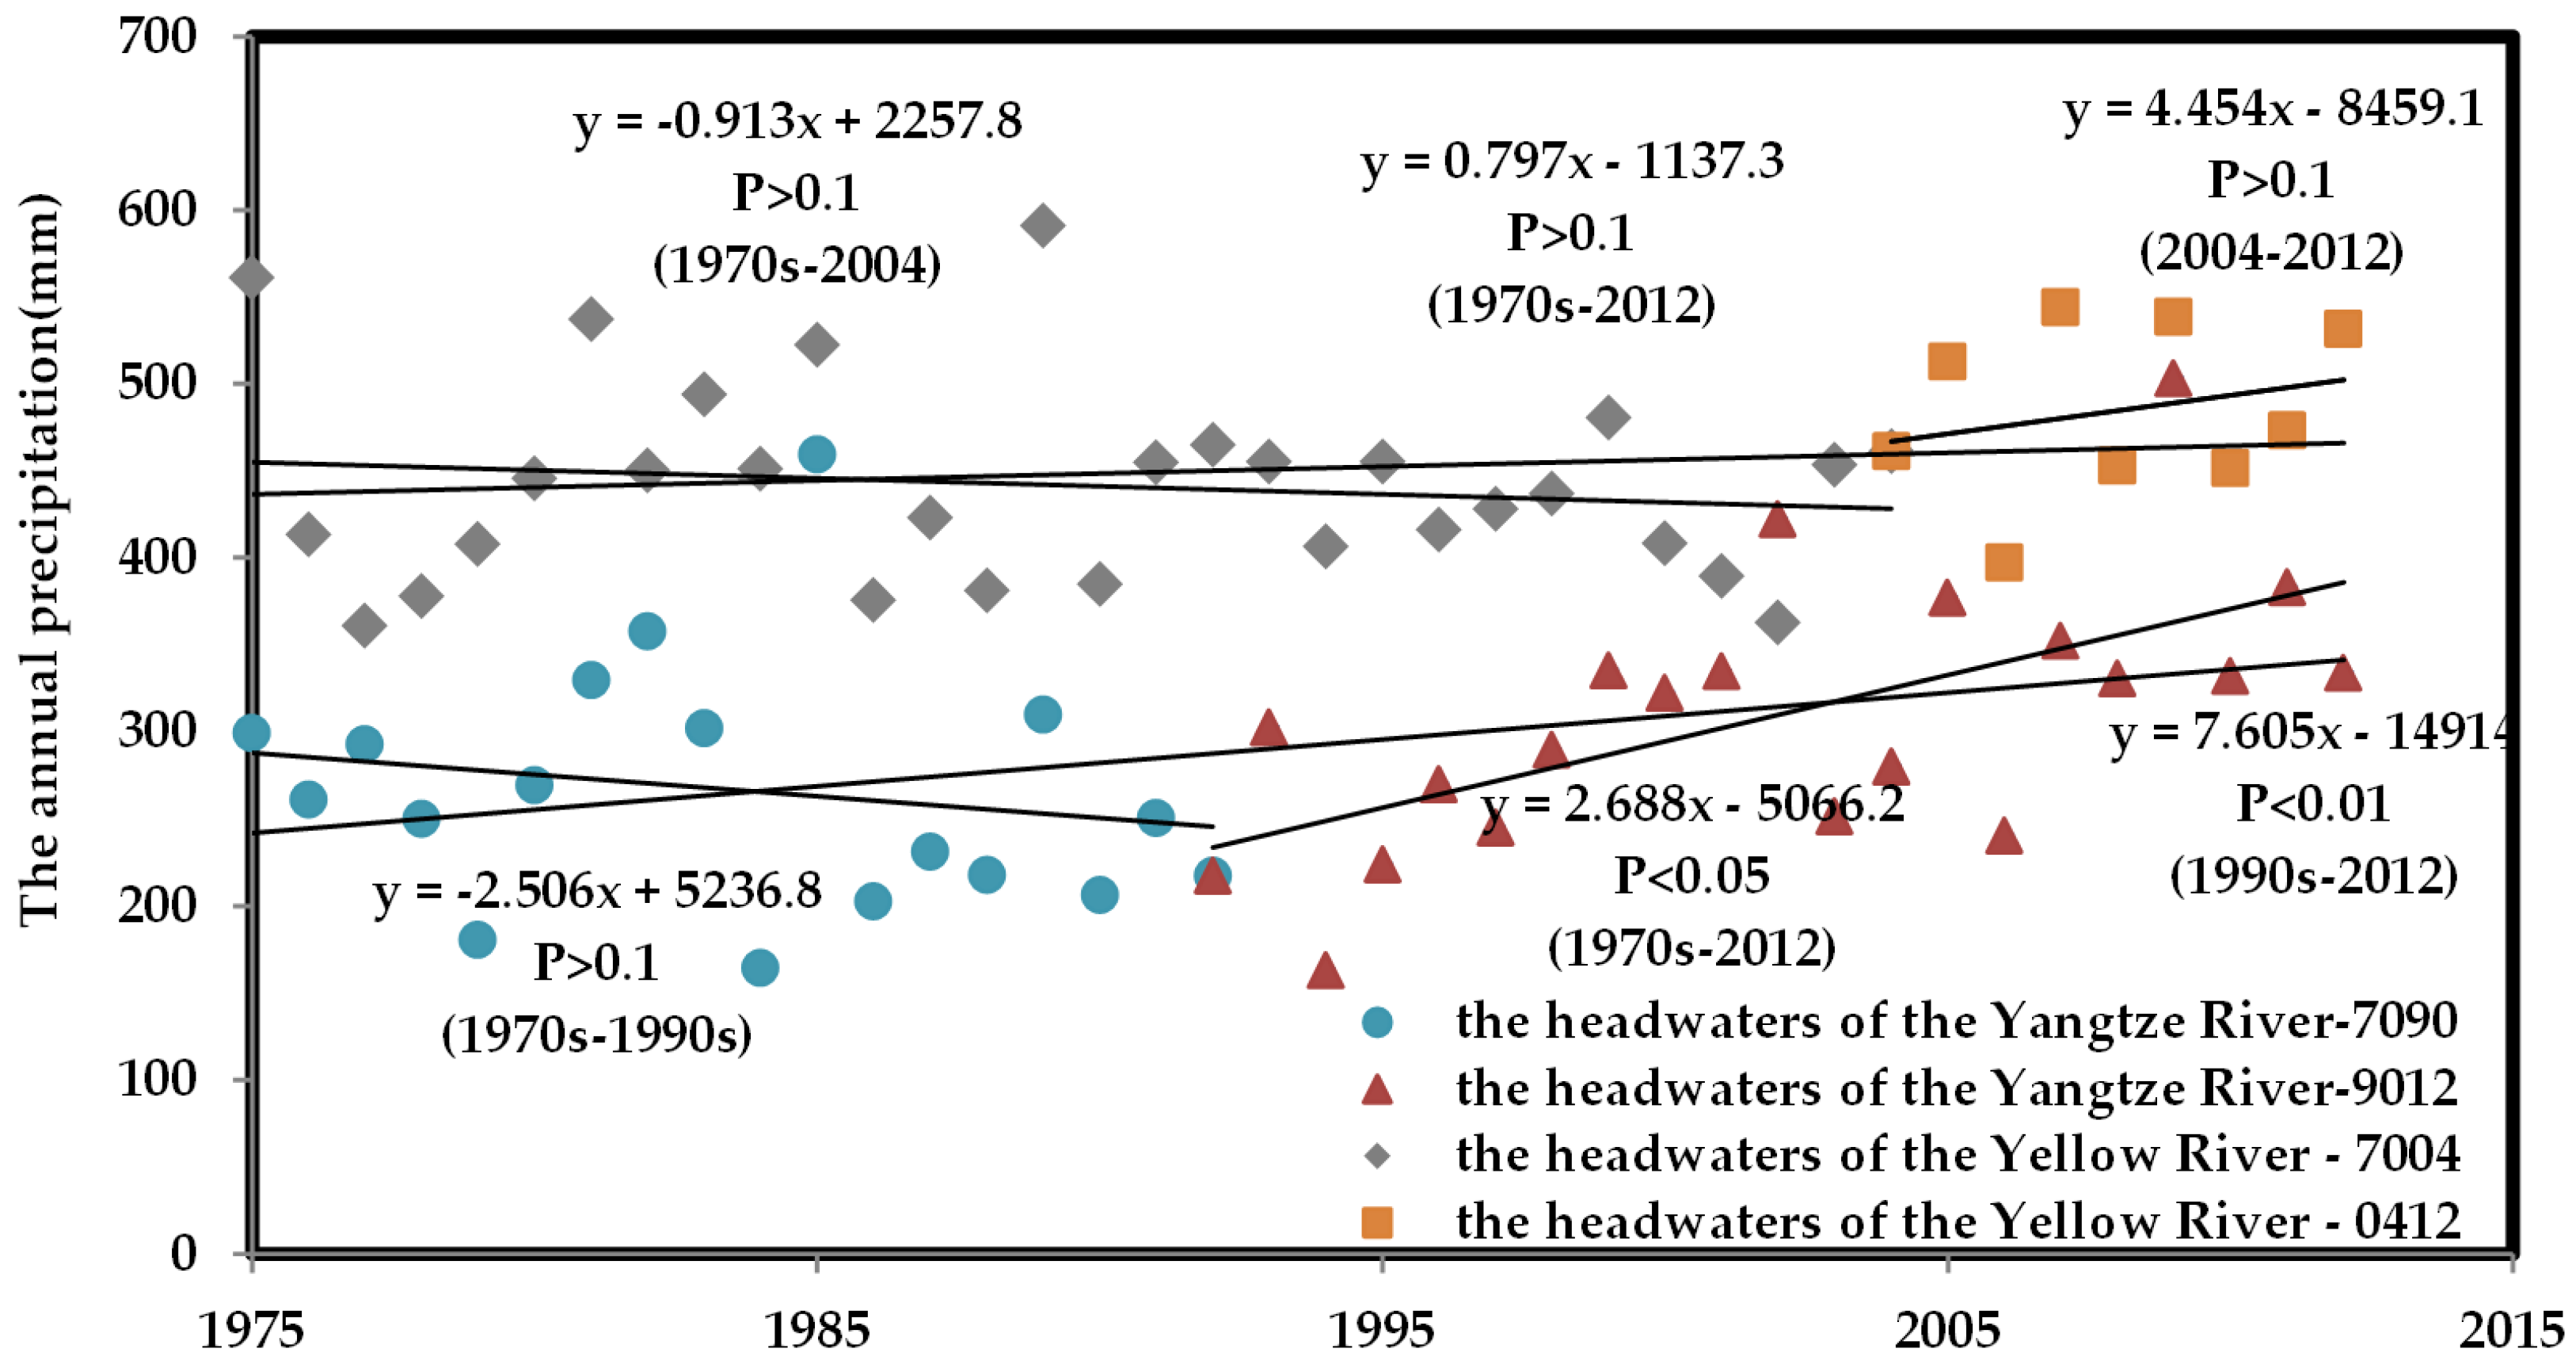
5.1. Discussion
5.2. Conclusions
- (1)
- While the dominant LULC type was grassland in the headwaters of both the Yangtze River and Yellow River, the area percentage of the grassland in the headwaters of the Yellow River was 17.00% more than in the headwaters of the Yangtze River, especially the high-coverage grassland; in addition, permanent ice and snow were found only in the headwaters of the Yangtze River, with their percentage being 2.03%.
- (2)
- During the past 30 years, in the headwaters of the Yangtze River, the grassland and wet- and marshland area increased at the expense of sand, gobi and bare land and desert; in the headwaters of the Yellow River, significant reduction of grassland coverage, shrinkage of wet- and marshland and the consequential expansion of sand, gobi and bare land were noticed, and the change magnitude was more dramatic overall. From the late 1970s to the early 1990s, shrinkage of wet- and marshland and desertification were the main LULC change types in the headwaters of the Yangtze River, while an expansion of sand, gobi and bare land and a decline in grassland coverage were the main LULC change types in the headwaters of the Yellow River. From the early 1990s to 2004, desert changing to wet- and marshland was the main LULC change type in the headwaters of the Yangtze River, while a further grassland deterioration, wet- and marshland shrinkage and significant expansion in sand, gobi and bare land were noticed in the headwaters of the Yellow River. From 2004 to 2012, the sand, gobi and bare land and desert changing to wet- and marshland and grassland were the main LULC change types in the headwaters of the Yangtze River; in the headwaters of the Yellow River, an increase in grassland coverage, expansion of the wet- and marshland and a decrease in the sand, gobi and bare land area were the main LULC change types.
- (3)
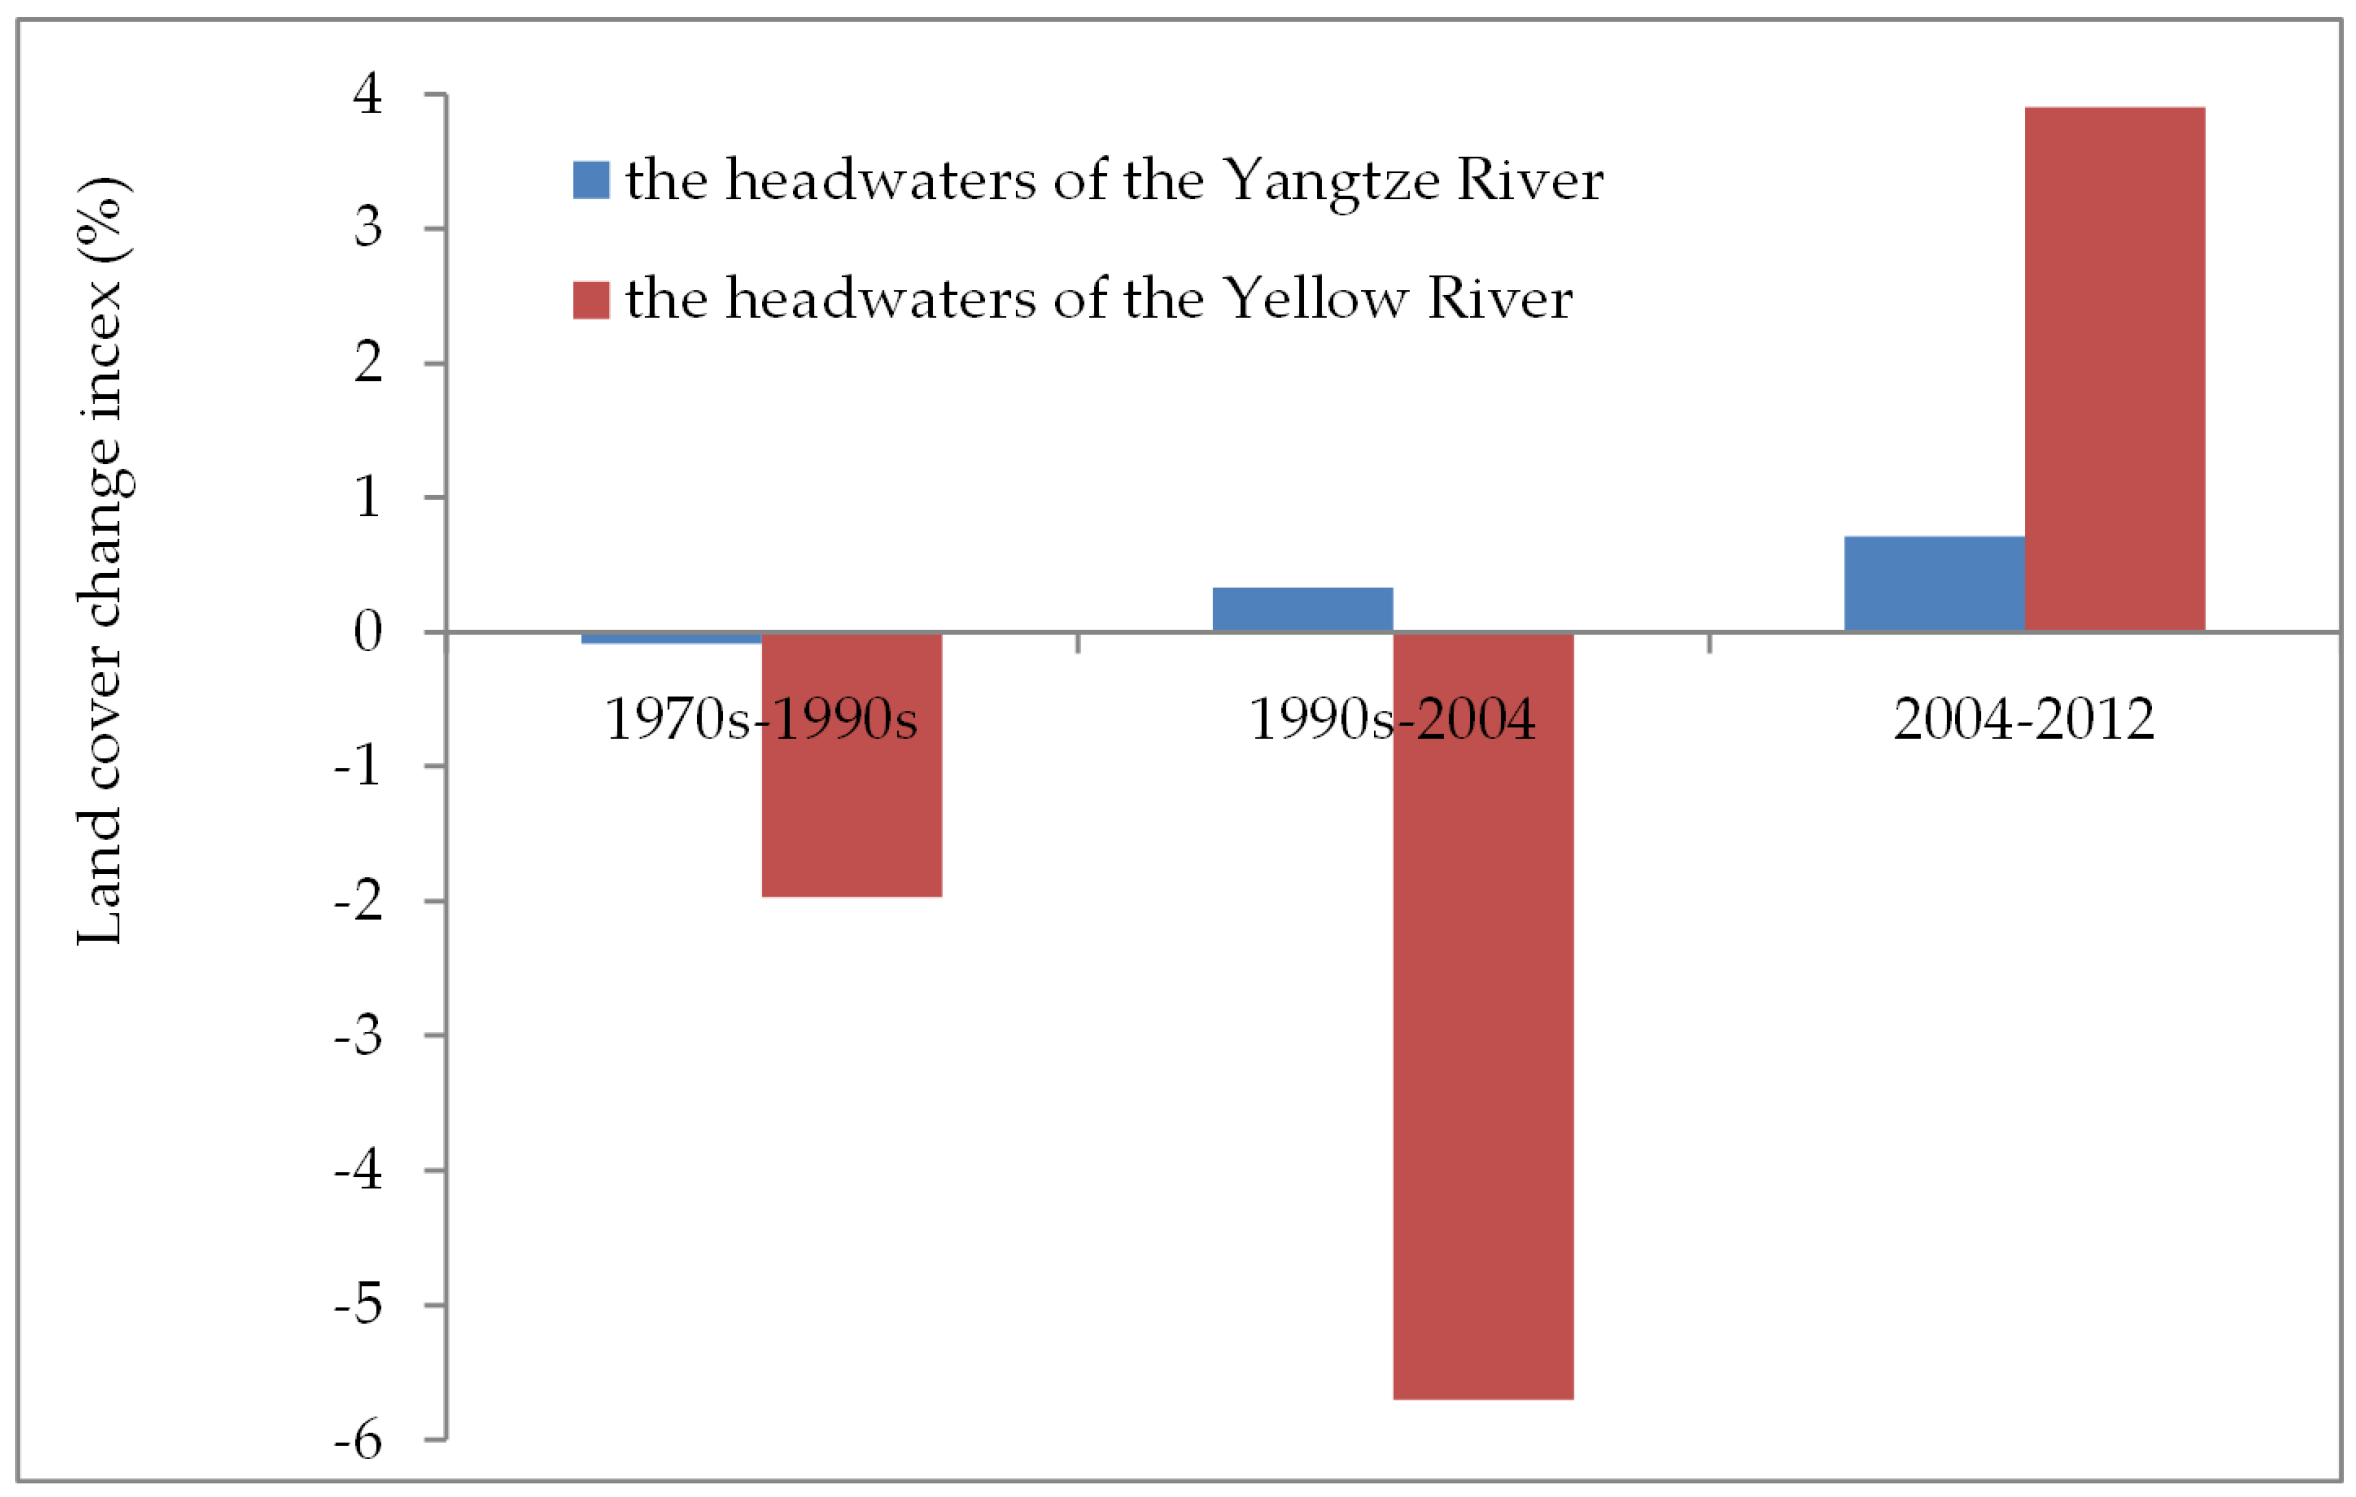
- According to the LULC change index, during the past 30 years, the macro-ecological situation in the headwaters of the Yangtze River has experienced a process of degeneration, slight melioration, and continuous melioration, in that order; while the headwaters of the Yellow River has experienced a process of degeneration, obvious degeneration, and slight melioration, in that order. In addition, the change magnitude in the headwaters of the Yellow River has been more dramatic than in the headwaters of the Yangtze River.
Acknowledgments
Author Contributions
Conflicts of Interest
Abbreviations
| TRHR | the Three-River Headwaters Region |
| LULC | Land use and land cover |
References
- Liu, J.; Kuang, W.; Zhang, Z.; Xu, X.; Qin, Y.; Ning, J.; Zhou, W.; Zhang, S.; Li, R.; Yan, C.; et al. Spatiotemporal characteristics, patterns, and causes of land-use changes in China since the late 1980s. J. Geogr. Sci. 2014, 24, 195–210. [Google Scholar] [CrossRef]
- Gascoigne, W.R.; Hoag, D.; Koontz, L.; Tangen, B.A.; Shaffer, T.L.; Gleason, R.A. Valuing ecosystem and economic services across land-use scenarios in the Prairie Pothole Region of the Dakotas, USA. Ecol. Econ. 2011, 70, 1715–1725. [Google Scholar] [CrossRef]
- Wang, W.; Guo, H.; Chuai, X.; Dai, C.; Lai, L.; Zhang, M. The impact of land use change on the temporospatial variations of ecosystems services value in China and an optimized land use solution. Environ. Sci. Policy 2014, 44, 62–72. [Google Scholar] [CrossRef]
- Geneletti, D. Assessing the impact of alternative land-use zoning policies on future ecosystem services. Environ. Impact Assess. Rev. 2013, 40, 25–35. [Google Scholar] [CrossRef]
- Liu, J.; Daily, G.C.; Ehrlich, P.R.; Luck, G.W. Effects of household dynamics on resource consumption and biodiversity. Nature 2003, 421, 530–533. [Google Scholar] [CrossRef] [PubMed]
- Dewan, A.M.; Yamaguchi, Y.; Ziaur Rahman, M. Dynamics of land use/cover changes and the analysis of landscape fragmentation in Dhaka metropolitan, Bangladesh. GeoJournal 2012, 77, 315–330. [Google Scholar] [CrossRef]
- Wang, K.; Zhang, Q.; Chen, Y.D.; Singh, V.P. Effects of land-use/cover change on hydrological processes using a gis/rs-based integrated hydrological model: Case study of the East River, China. Hydrol. Sci. J. 2015, 60, 1724–1738. [Google Scholar] [CrossRef]
- Dewan, A.M.; Yamaguchi, Y. Land use and land cover change in greater Dhaka, Bangladesh: Using remote sensing to promote sustainable urbanization. Appl. Geogr. 2009, 29, 390–401. [Google Scholar] [CrossRef]
- Jiang, Y.; Fu, P.; Weng, Q. Assessing the impacts of urbanization-associated land use/cover change on land surface temperature and surface moisture: A case study in the midwestern United States. Remote Sens. 2015, 7, 4880–4898. [Google Scholar] [CrossRef]
- Ge, X.; Dong, K.; Luloff, A.E.; Wang, L.; Xiao, J.; Wang, S.; Wang, Q. Correlation between landscape fragmentation and sandy desertification: A case study in Horqin sandy land, China. Environ. Monit. Assess. 2016, 188. [Google Scholar] [CrossRef] [PubMed]
- Ge, X.; Dong, K.; Luloff, A.E.; Wang, L.; Xiao, J. Impact of land use intensity on sandy desertification: An evidence from Horqin sandy land, China. Ecol. Indic. 2016, 61, 346–358. [Google Scholar] [CrossRef]
- Clement, M.T.; Chi, G.; Ho, H.C. Urbanization and land-use change: A human ecology of deforestation across the United States, 2001–2006. Soc. Inquiry 2015, 85, 628–653. [Google Scholar] [CrossRef]
- Mooney, H.A.; Duraiappah, A.; Larigauderie, A. Evolution of natural and social science interactions in global change research programs. Proc. Natl. Acad. Sci. USA 2013, 110, 3665–3672. [Google Scholar] [CrossRef] [PubMed]
- Abd El-Kawy, O.R.; Rød, J.K.; Ismail, H.A.; Suliman, A.S. Land use and land cover change detection in the western Nile Delta of Egypt using remote sensing data. Appl. Geogr. 2011, 31, 483–494. [Google Scholar] [CrossRef]
- Yang, X.Y.; Chen, L.G.; Li, Y.K.; Xi, W.J.; Chen, L.Q. Rule-based land use/land cover classification in coastal areas using seasonal remote sensing imagery: A case study from Lianyungang City, China. Environ. Monit. Assess. 2015, 187. [Google Scholar] [CrossRef] [PubMed]
- Shalaby, A.; Tateishi, R. Remote sensing and GIS for mapping and monitoring land cover and land-use changes in the northwestern coastal zone of Egypt. Appl. Geogr. 2007, 27, 28–41. [Google Scholar] [CrossRef]
- Yang, X.; Lo, C. Using a time series of satellite imagery to detect land use and land cover changes in the Atlanta, Georgia metropolitan area. Int. J. Remote Sens. 2002, 23, 1775–1798. [Google Scholar] [CrossRef]
- Alphan, H.; Doygun, H.; Unlukaplan, Y.I. Post-classification comparison of land cover using multitemporal landsat and aster imagery: The case of Kahramanmaras, Turkey. Environ. Monit. Assess. 2009, 151, 327–336. [Google Scholar] [CrossRef]
- Yuan, F.; Sawaya, K.E.; Loeffelholz, B.; Bauer, M.E. Land cover classification and change analysis of the Twin Cities (Minnesota) metropolitan area by multi-temporal Landsat remote sensing. Remote Sens. Environ. 2005, 98, 317–328. [Google Scholar] [CrossRef]
- Fan, J.W.; Shao, Q.Q.; Liu, J.Y.; Wang, J.B.; Harris, W.; Chen, Z.Q.; Zhong, H.P.; Xu, X.L.; Liu, R.G. Assessment of effects of climate change and grazing activity on grassland yield in the Three Rivers Headwaters Region of Qinghai-Tibet plateau, China. Environ. Monit. Assess. 2010, 170, 571–584. [Google Scholar] [CrossRef] [PubMed]
- Xu, X.L.; Liu, J.Y.; Shao, Q.Q.; Fan, J.W. The dynamic changes of ecosystem spatial pattern and structure in the Three-River Headwaters region in Qinghai Province during recent 30 years. Geogr. Res. 2008, 27, 829–838. [Google Scholar]
- Shao, Q.Q.; Zhao, Z.P.; Liu, J.Y.; Fan, J.W. The characteristics of land cover and macroscopical ecology changes in the source region of three rivers on Qinghai Tibet Plateau during the last 30 years. Geogr. Res. 2010, 29, 1439–1451. [Google Scholar]
- Shao, Q.Q.; Fan, J.W. Integrated Monitoring and Evaluation of Ecosystem in the Three Rivers Headwaters Region; Science Press: Beijing, China, 2012. [Google Scholar]
- Liu, X.F.; Zhang, J.S.; Zhu, X.F.; Pan, Y.Z.; Liu, Y.X.; Zhang, D.H.; Lin, Z.H. Spatiotemporal changes in vegetation coverage and its driving factors in the three-river headwaters region during 2000–2011. J. Geogr. Sci. 2014, 24, 288–302. [Google Scholar] [CrossRef]
- Huang, L.; Xu, X.L.; Shao, Q.Q.; Liu, J.Y. Improving carbon mitigation potential through grassland ecosystem restoration under climatic change in northeastern Tibetan plateau. Adv. Meteorol. 2014, 2014. [Google Scholar] [CrossRef]
- Tong, L.G.; Xu, X.L.; Fu, Y.; Li, S. Wetland changes and their responses to climate change in the “Three-river Headwaters” region of China since the 1990s. Energies 2014, 7, 2515–2534. [Google Scholar] [CrossRef]
- Ding, Y.J.; Liu, S.Y.; Chen, R.S.; Wang, G.X.; Shen, Y.P.; Wang, J.; Xie, C.W.; Zhang, S.Q. Exploration of eco-environment range in the source regions of the Yangtze and Yellow rivers. J. Geogr. Sci. 2003, 58, 519–526. [Google Scholar]
- Liu, J.Y.; Liu, M.L.; Tian, H.Q.; Zhuang, D.F.; Zhang, Z.X.; Zhang, W.; Tang, X.M.; Deng, X.Z. Spatial and temporal patterns of China’s cropland during 1990–2000: An analysis based on landsat TM data. Remote Sens. Environ. 2005, 98, 442–456. [Google Scholar] [CrossRef]
- Liu, J.Y.; Zhang, Z.X.; Zhuang, D.F. Research on the Remote Sensing Information on Land Use Change in 1990s, China; Science Press: Beijing, China, 2005. [Google Scholar]
- Nazeer, M.; Nichol, J.E.; Yung, Y.-K. Evaluation of atmospheric correction models and landsat surface reflectance product in an urban coastal environment. Int. J. Remote Sens. 2014, 35, 6271–6291. [Google Scholar] [CrossRef]
- Gilmore, S.; Saleem, A.; Dewan, A.M. Effectiveness of DOS (Dark-Object Subtraction) Method and Water Index Techniques to Map Wetlands in a Rapidly Urbanizing Megacity with Landsat 8 Data. Available online: http://ceur-ws.org/Vol-1323/paper41.pdf (accessed on 22 February 2016).
- Reyers, B.; O’Farrell, P.J.; Cowling, R.M.; Egoh, B.N.; le Maitre, D.C.; Vlok, J.H.J. Ecosystem services, land-cover change, and stakeholders: Finding a sustainable foothold for a semiarid biodiversity hotspot. Ecol. Soc. 2009, 14, 23–38. [Google Scholar]
- Dewan, A.M.; Humayun Kabir, M.; Nahar, K.; Ziaur Rahman, M. Urbanisation and environmental degradation in Dhaka metropolitan area of Bangladesh. Int. J. Evriron. Sustain. Dev. 2012, 11, 118–147. [Google Scholar] [CrossRef]
- Liu, M.C.; Li, D.Q.; Wen, Y.M.; Luan, X.F. The ecological function analysis and evaluation of ecosystem in Sanjiangyuan region. Acta Sci. Circumst. 2005, 25, 1280–1286. [Google Scholar]
- Lai, M.; Wu, S.H.; Dai, E.F.; Yin, Y.H.; Pan, T.; Zhao, D.S. Dynamic Valuation on Ecosystem Services to Ecological Construction in the Three-River Headwaters Nature Reserve, China. J. Mt. Sci. 2013, 31, 8–17. [Google Scholar]
- Wang, G.X.; Guo, X.Y.; Cheng, G.D. Dynamic variations of landscape pattern and the landscape ecological functions in the source area of the Yellow river. Acta Ecol. Sin. 2002, 22, 1587–1598. [Google Scholar]
- Li, H.X.; Liu, G.H.; Fu, B.J. Response of vegetation to climate change and human activity based on NDVI in the Three-River Headwaters region. Acta Ecol. Sin. 2011, 31, 5495–5504. [Google Scholar]
- Jiang, C.; Zhang, L. Climate change and its impact on the eco-environment of the Three-rivers Headwater Region on the Tibetan plateau, China. Int. J. Environ. Res. Public Health 2015, 12, 12057–12081. [Google Scholar] [CrossRef] [PubMed]
- Ma, S.J. Analysis of ecosystem protection and construction projects implemented in Three-River Headwaters region—A case study in Tanggulashan Town of Geermu City. Pratacult. Sci. 2010, 27, 161–168. [Google Scholar]
- Fang, Y.P. Managing the Three-Rivers headwater region, China: From ecological engineering to social engineering. Ambio 2013, 42, 566–576. [Google Scholar] [CrossRef] [PubMed]
- Mao, X.F.; Wei, X.Y.; Xia, J.X. Evaluation of ecological migrants’ adaptation to their new living area in Three-river Headwater wetlands, China. Procedia Environ. Sci. 2012, 13, 1346–1353. [Google Scholar] [CrossRef]
- Zhang, Y.; Liu, S.Y.; Xu, J.L.; Shangguan, D.H. Glacier change and glacier runoff variation in the Tuotuo river basin, the source region of Yangtze River in western China. Environ. Geol. 2008, 56, 59–68. [Google Scholar] [CrossRef]
- Byomkesh, T.; Nakagoshi, N.; Dewan, A.M. Urbanization and green space dynamics in greater Dhaka, Bangladesh. Landsc. Ecol. Eng. 2011, 8, 45–58. [Google Scholar] [CrossRef]
- Dewan, A.M.; Yamaguchi, Y. Using remote sensing and gis to detect and monitor land use and land cover change in Dhaka metropolitan of Bangladesh during 1960–2005. Environ. Monit. Assess. 2009, 150, 237–249. [Google Scholar] [CrossRef] [PubMed]
- Cui, G.; Lee, W.-K.; Kim, D.; Lee, E.J.; Kwak, H.; Choi, H.-A.; Kwak, D.-A.; Jeon, S.; Jeon, S.; Zhu, W. Estimation of forest carbon budget from land cover change in south and north Korea between 1981 and 2010. J. Plant Biol. 2014, 57, 225–238. [Google Scholar] [CrossRef]
- Pan, T.; Wu, S.; Liu, Y. Relative contributions of land use and climate change to water supply variations over yellow river source area in Tibetan plateau during the past three decades. PLoS ONE 2015, 10, e0123793. [Google Scholar] [CrossRef] [PubMed]
- Zhang, J.P.; Zhang, L.B.; Liu, W.L.; Qi, Y.; Wo, X. Livestock-carrying capacity and overgrazing status of alpine grassland in the Three-River headwaters region, China. J. Geogr. Sci. 2014, 24, 303–312. [Google Scholar] [CrossRef]


| Types in this Study | Chinese LULC Classification System [28,29] | Description | |
|---|---|---|---|
| forest | 21 forest land 23 sparse forest land 24 other forest | Arbor, including timber forest, commercial forest, protection forest and others | |
| shrub | 22 shrub | Scrub with the height lower than 2 m and shrubbery | |
| high-coverage grassland | 31 high-coverage grassland | Grassland with the coverage higher than 50% | |
| medium-coverage grassland | 32 medium-coverage grassland | Grassland with the coverage between 20% and 50% | |
| low-coverage grassland | 33 low-coverage grassland | Grassland with the coverage between 5% and 20% | |
| wet- and marshland | Water bodies | 41 stream and rivers 42 lake 43 reservoir and ponds | Natural water bodies, wetland, and land for water conservancy facilities |
| permanent ice and snow | 44 permanent ice and snow | ||
| shoaly land and swamp | 46 shoaly land 64 swamp | ||
| build-up area | 51 urban land 52 rural residential area 53 other construction land | Residential, commercial and services, industrial, transportation | |
| sand, gobi and bare land | 61 sand land 62 gobi 63 saline-alkali soil 65 bare land 66 bare rock | Land covered with sand, gravel or soil with the vegetation coverage lower than 5%, or land covered with saline-alkali | |
| desert | 67 other unused land | alpine desert, tundra, etc. | |
| LULC Types | Water and Marsh Land | Forest | Shrub | HCG | MCG | LCG | Desert | Sand, Gobi and Bare Land |
|---|---|---|---|---|---|---|---|---|
| ecological level | 8 | 7 | 6 | 5 | 4 | 3 | 2 | 1 |
| (A) The headwaters of the Yangtze River | |||||||||||||||||||
| LULC Types | High Coverage Grassland | Medium Coverage Grassland | Low Coverage Grassland | Water Bodies | Permanent Ice and Snow | Shoaly Land and Swamp | Sand, Gobi and Bare Land | Desert | The Late 1970s | ||||||||||
| high-coverage grassland | 1398.20 | 0.00 | 0.00 | 0.00 | 0.00 | 0.00 | 0.00 | 0.00 | 1398.20 | ||||||||||
| medium-coverage grassland | 0.00 | 2442.57 | 0.00 | 0.47 | 0.00 | 0.00 | 0.00 | 0.00 | 2443.04 | ||||||||||
| low-coverage grassland | 0.00 | 0.00 | 8162.07 | 1.63 | 0.00 | 0.00 | 0.00 | 0.24 | 8163.94 | ||||||||||
| water bodies | 0.00 | 0.00 | 1.28 | 956.95 | 0.00 | 9.36 | 0.85 | 5.11 | 973.55 | ||||||||||
| permanent ice and snow | 0.00 | 0.00 | 0.00 | 0.00 | 397.15 | 0.00 | 0.00 | 0.00 | 397.15 | ||||||||||
| shoaly land and swamp | 0.00 | 0.00 | 0.00 | 2.80 | 0.00 | 488.61 | 0.00 | 0.00 | 491.41 | ||||||||||
| sand, gobi and bare land | 0.00 | 0.00 | 0.00 | 0.00 | 0.00 | 0.00 | 2333.10 | 0.00 | 2333.10 | ||||||||||
| desert | 0.00 | 0.00 | 0.00 | 2.76 | 0.00 | 0.00 | 0.00 | 3216.26 | 3219.02 | ||||||||||
| The early 1990s | 1398.20 | 2442.57 | 8163.35 | 964.61 | 397.15 | 497.96 | 2333.95 | 3221.62 | 19,419.41 | ||||||||||
| (B) The headwaters of the Yellow River | |||||||||||||||||||
| LULC Types | Forest | Shrub | High Coverage Grassland | Medium Coverage Grassland | Low Coverage Grassland | Water Bodies | Shoaly Land and Swamp | Build-up Area | Sand, Gobi and Bare Land | The Late 1970s | |||||||||
| forest | 30.29 | 0.00 | 0.00 | 0.00 | 0.00 | 0.00 | 0.00 | 0.00 | 0.00 | 30.29 | |||||||||
| shrub | 0.00 | 687.26 | 1.50 | 2.83 | 0.28 | 0.00 | 0.26 | 0.00 | 0.00 | 692.13 | |||||||||
| high-coverage grassland | 0.00 | 0.00 | 12,261.27 | 416.88 | 25.66 | 0.00 | 11.46 | 0.88 | 0.04 | 12,716.19 | |||||||||
| medium-coverage grassland | 0.00 | 0.00 | 4.40 | 7096.47 | 295.92 | 0.00 | 0.18 | 0.00 | 2.91 | 7399.88 | |||||||||
| low-coverage grassland | 0.00 | 0.00 | 0.24 | 7.63 | 15,038.61 | 0.06 | 9.09 | 1.34 | 93.32 | 15,150.28 | |||||||||
| water bodies | 0.00 | 0.00 | 0.45 | 0.00 | 2.44 | 2068.57 | 2.48 | 0.00 | 0.00 | 2073.93 | |||||||||
| shoaly land and swamp | 0.00 | 0.00 | 0.31 | 0.00 | 4.07 | 0.00 | 1990.20 | 0.00 | 0.00 | 1994.58 | |||||||||
| build-up area | 0.00 | 0.00 | 0.00 | 0.00 | 0.00 | 0.00 | 0.00 | 7.73 | 0.00 | 7.73 | |||||||||
| sand, gobi and bare land | 0.00 | 0.00 | 0.00 | 0.00 | 21.59 | 0.00 | 0.00 | 0.00 | 3851.44 | 3873.03 | |||||||||
| The early 1990s | 30.29 | 687.26 | 12,268.17 | 7523.81 | 15,388.56 | 2068.62 | 2013.67 | 9.95 | 3947.71 | 43,938.05 | |||||||||
| (A) The headwaters of the Yangtze River | |||||||||||||||||||
| LULC Types | High Coverage Grassland | Medium Coverage Grassland | Low Coverage Grassland | Water Bodies | Permanent Ice and Snow | Shoaly land and Swamp | Sand, Gobi and Bare Land | Desert | The Early 1990s | ||||||||||
| high-coverage grassland | 1398.20 | 0.00 | 0.00 | 0.00 | 0.00 | 0.00 | 0.00 | 0.00 | 1398.20 | ||||||||||
| medium-coverage grassland | 0.00 | 2442.42 | 0.00 | 0.15 | 0.00 | 0.00 | 0.00 | 0.00 | 2442.57 | ||||||||||
| low-coverage grassland | 0.00 | 0.00 | 8160.92 | 2.43 | 0.00 | 0.00 | 0.00 | 0.00 | 8163.35 | ||||||||||
| water bodies | 0.00 | 0.00 | 0.00 | 964.61 | 0.00 | 0.00 | 0.00 | 0.00 | 964.61 | ||||||||||
| permanent ice and snow | 0.00 | 0.00 | 0.00 | 0.00 | 397.15 | 0.00 | 0.00 | 0.00 | 397.15 | ||||||||||
| shoaly land and swamp | 0.00 | 0.00 | 0.00 | 18.87 | 0.00 | 479.10 | 0.00 | 0.00 | 497.96 | ||||||||||
| sand, gobi and bare land | 0.00 | 0.00 | 0.00 | 1.28 | 0.00 | 0.00 | 2332.67 | 0.00 | 2333.95 | ||||||||||
| desert | 0.00 | 0.00 | 0.44 | 6.96 | 0.00 | 0.00 | 0.00 | 3214.21 | 3221.62 | ||||||||||
| 2004 | 1398.20 | 2442.42 | 8161.36 | 994.30 | 397.15 | 479.10 | 2332.67 | 3214.21 | 19,419.41 | ||||||||||
| (B) The headwaters of the Yellow River | |||||||||||||||||||
| LULC Types | Forest | Shrub | High Coverage Grassland | Medium Coverage Grassland | Low Coverage Grassland | Water Bodies | Shoaly Land and Swamp | Build-up Area | Sand, Gobi and Bare Land | The Early 1990s | |||||||||
| forest | 30.29 | 0.00 | 0.00 | 0.00 | 0.00 | 0.00 | 0.00 | 0.00 | 0.00 | 30.29 | |||||||||
| shrub | 0.00 | 686.58 | 0.67 | 0.00 | 0.00 | 0.00 | 0.00 | 0.00 | 0.00 | 687.26 | |||||||||
| high-coverage grassland | 0.00 | 0.00 | 11960.96 | 227.46 | 74.71 | 0.00 | 4.93 | 0.10 | 0.00 | 12,268.17 | |||||||||
| medium-coverage grassland | 0.00 | 0.00 | 0.00 | 7223.77 | 294.94 | 0.39 | 0.22 | 0.00 | 4.50 | 7523.81 | |||||||||
| low-coverage grassland | 0.00 | 0.00 | 0.13 | 1.87 | 14,615.70 | 1.90 | 1.91 | 0.32 | 766.73 | 15,388.56 | |||||||||
| water bodies | 0.00 | 0.00 | 1.32 | 1.01 | 12.05 | 1968.62 | 84.88 | 0.00 | 0.75 | 2068.62 | |||||||||
| shoaly land and swamp | 0.00 | 0.00 | 19.47 | 17.44 | 36.59 | 7.94 | 1931.70 | 0.00 | 0.54 | 2013.67 | |||||||||
| build-up area | 0.00 | 0.00 | 0.00 | 0.00 | 0.00 | 0.00 | 0.00 | 9.95 | 0.00 | 9.95 | |||||||||
| sand, gobi and bare land | 0.00 | 0.00 | 0.00 | 0.00 | 31.97 | 0.00 | 0.00 | 0.00 | 3915.74 | 3947.71 | |||||||||
| 2004 | 30.29 | 686.58 | 11,982.56 | 7471.55 | 15,065.96 | 1978.85 | 2023.64 | 10.38 | 4688.24 | 43,938.05 | |||||||||
| (A) The headwaters of the Yangtze River | |||||||||||||||||||
| LULC Types | High Coverage Grassland | Medium Coverage Grassland | Low Coverage Grassland | Water Bodies | Permanent Ice and Snow | Shoaly Land and Swamp | Sand, Gobi and Bare Land | Desert | 2004 | ||||||||||
| high-coverage grassland | 1394.97 | 2.86 | 0.19 | 0.17 | 0.00 | 0.00 | 0.00 | 0.00 | 1398.20 | ||||||||||
| medium-coverage grassland | 0.18 | 2441.39 | 0.78 | 0.06 | 0.00 | 0.00 | 0.00 | 0.00 | 2442.42 | ||||||||||
| low-coverage grassland | 0.84 | 5.32 | 8138.59 | 8.64 | 0.00 | 0.27 | 7.70 | 0.00 | 8161.36 | ||||||||||
| water bodies | 0.00 | 0.00 | 0.08 | 994.19 | 0.00 | 0.03 | 0.00 | 0.00 | 994.30 | ||||||||||
| permanent ice and snow | 0.00 | 0.00 | 0.00 | 0.00 | 394.92 | 0.00 | 2.23 | 0.00 | 397.15 | ||||||||||
| shoaly land and swamp | 7.26 | 3.93 | 1.79 | 3.93 | 0.00 | 462.19 | 0.00 | 0.00 | 479.10 | ||||||||||
| sand, gobi and bare land | 0.02 | 0.95 | 43.02 | 5.70 | 0.00 | 0.00 | 2282.98 | 0.00 | 2332.67 | ||||||||||
| desert | 0.40 | 1.19 | 1.64 | 5.55 | 0.00 | 0.00 | 0.00 | 3205.43 | 3214.21 | ||||||||||
| 2012 | 1403.69 | 2455.65 | 8186.09 | 1018.24 | 394.92 | 462.48 | 2292.91 | 3205.43 | 19,419.41 | ||||||||||
| (B) The headwaters of the Yellow River | |||||||||||||||||||
| LULC Types | Forest | Shrub | High Coverage Grassland | Medium Coverage Grassland | Low Coverage Grassland | Water Bodies | Shoaly Land and Swamp | Build-up Area | Sand, Gobi and Bare Land | 2004 | |||||||||
| forest | 30.29 | 0.00 | 0.00 | 0.00 | 0.00 | 0.00 | 0.00 | 0.00 | 0.00 | 30.29 | |||||||||
| shrub | 0.00 | 686.58 | 0.00 | 0.00 | 0.00 | 0.00 | 0.00 | 0.00 | 0.00 | 686.58 | |||||||||
| high-coverage grassland | 0.00 | 0.00 | 11,957.12 | 21.44 | 1.96 | 0.39 | 1.65 | 0.00 | 0.00 | 11,982.56 | |||||||||
| medium-coverage grassland | 0.00 | 0.00 | 190.10 | 7271.07 | 1.67 | 7.21 | 1.50 | 0.00 | 0.00 | 7471.55 | |||||||||
| low-coverage grassland | 0.00 | 0.00 | 18.74 | 627.85 | 14,329.64 | 43.27 | 46.47 | 0.00 | 0.00 | 15,065.96 | |||||||||
| water bodies | 0.00 | 0.00 | 0.00 | 0.27 | 6.23 | 1972.29 | 0.06 | 0.00 | 0.00 | 1978.85 | |||||||||
| shoaly land and swamp | 0.00 | 0.00 | 3.31 | 0.00 | 8.39 | 112.78 | 1899.16 | 0.00 | 0.00 | 2023.64 | |||||||||
| build-up area | 0.00 | 0.00 | 0.00 | 0.00 | 0.00 | 0.00 | 0.00 | 10.38 | 0.00 | 10.38 | |||||||||
| sand, gobi and bare land | 0.00 | 0.00 | 0.00 | 0.63 | 209.17 | 5.98 | 2.99 | 0.00 | 4469.47 | 4688.24 | |||||||||
| 2012 | 30.29 | 686.58 | 12,169.27 | 7921.25 | 14,557.06 | 2141.92 | 1951.83 | 10.38 | 4469.47 | 43,938.05 | |||||||||
© 2016 by the authors; licensee MDPI, Basel, Switzerland. This article is an open access article distributed under the terms and conditions of the Creative Commons by Attribution (CC-BY) license (http://creativecommons.org/licenses/by/4.0/).
Share and Cite
Liu, L.; Cao, W.; Shao, Q.; Huang, L.; He, T. Characteristics of Land Use/Cover and Macroscopic Ecological Changes in the Headwaters of the Yangtze River and of the Yellow River over the Past 30 Years. Sustainability 2016, 8, 237. https://doi.org/10.3390/su8030237
Liu L, Cao W, Shao Q, Huang L, He T. Characteristics of Land Use/Cover and Macroscopic Ecological Changes in the Headwaters of the Yangtze River and of the Yellow River over the Past 30 Years. Sustainability. 2016; 8(3):237. https://doi.org/10.3390/su8030237
Chicago/Turabian StyleLiu, Lulu, Wei Cao, Quanqin Shao, Lin Huang, and Tian He. 2016. "Characteristics of Land Use/Cover and Macroscopic Ecological Changes in the Headwaters of the Yangtze River and of the Yellow River over the Past 30 Years" Sustainability 8, no. 3: 237. https://doi.org/10.3390/su8030237