Article

Advancing City Sustainability via Its Systems of Flows: The Urban Metabolism of Birmingham and Its Hinterland

Department of Civil Engineering, University of Birmingham, Edgbaston, Birmingham B15 2TT, UK
*
Author to whom correspondence should be addressed.
Sustainability 2016, 8(3), 220; https://doi.org/10.3390/su8030220
Submission received: 23 December 2015 / Revised: 9 February 2016 / Accepted: 19 February 2016 / Published: 1 March 2016
(This article belongs to the Special Issue 5th World Sustainability Forum - Selected Papers)

Abstract

:
Cities are dependent on their hinterlands for their function and survival. They provide resources such as people, materials, water, food and energy, as well as areas for waste disposal. Over the last 50 years, commerce and trade has become increasingly global with resources sourced from further afield often due to cheap labour costs, better transportation and a plentiful supply of energy and raw materials. However, the use and transportation of resources is becoming increasingly unsustainable as the global population increases, raw materials become increasing scarce, and energy costs rise. This paper builds on research undertaken in the Liveable Cities Programme on the resource flows of Birmingham, UK. It investigates how people, material, and food flows interact within regional, national, and international hinterlands through road and rail transportation and assesses their sustainability across all three pillars (economic, social, and environmental). The type and weight of goods is highlighted together with their costs and energy used. For a city to move with greatest effect towards sustainability it needs to: (i) source as much as it can locally, to minimise transportation and energy costs; (ii) adopt such principles as the “circular economy”; and (iii) provide clean and efficient means to move people, especially public transportation.

1. Introduction

Cities and their hinterlands drive the global economy through their demand for and the supply of goods and services. According to the UN [1] they account for 85% of Gross Domestic Product (GDP) in the richest countries and up to 55% of GDP for the poorest countries. They have become increasingly important over the last thirty years due to an increasing urbanised global population and economic growth in countries such as India and China [2,3]. However, this growth has slowed considerably over recent years due to the effects from the economic crash of 2007/2008 hitting export markets [4]. As cities grow, they demand more resources (water, food, energy, and materials) from their surrounding areas or hinterlands. These hinterlands were initially local, but, as a city prospers, and its influence spreads, they have become progressively regional, national and, ultimately, global. Cities have many forms and sizes with different cultural structures and layouts across the world. However, there are many commonalities that are useful to explore and understand in order to address the rising challenges of an increasing global urbanised population together with a rapidly changing context, particularly climate and the increasing pressure this exerts on world resources and their availability.
The resources needed by a city are many and varied ranging from essentials such as food, water, and energy to the goods and services used by the city and its people. These resources form part of the material flows of a city as they move in and out as well as within the city boundaries and are vital to its survival.
There is a need to understand the current material flows in cities for a number of reasons: (i) to provide a baseline for future work; (ii) to identify the significant flows with regards to weight (hence, transport impacts) and value, and (iii) to address how best to tackle the issues arising with a reduction in the availability of these resources. How is a city going to maintain the standard of living (or perhaps more pertinently, quality of life) of its citizens as resources become increasingly scarce? At the same time the issue of sustainability is rising up the political agenda [5] and is becoming ever more pervasive with the key pillars of sustainability—environment, economy, and social aspects—being considered increasingly as a whole rather than in isolation [6].
The Oxford English Dictionary (OED) [7] defines a sustainable city as: “a city constructed or landscaped in such a way as to minimise environmental degradation, with facilities (such as transport, waste management, etc.) which are designed so as to limit their impact on the natural environment, while providing the infrastructure needed for its inhabitants”. It also defines sustainable transport as “transport that minimises harmful effects on the environment and the depletion of natural resources, such as walking, cycling, and fuel-efficient public transport, and hence can be sustained in the long term”. Both of these definitions focus on the importance of the natural environment but a city also needs to be economically active, to provide employment for its citizens, as well as stimulating the purchase of goods and services within the city. Such activity should not be detrimental to the environment or to the health of its citizens or lead to social disadvantage.
Several studies within the urban environment [8,9,10,11,12,13,14,15,16,17], as well as transport studies, have approached the issue of sustainability from a range of perspectives or a particular aspect of sustainability (environmental, e.g., Life Cycle Analysis [18]; economic [19] or social [20]) with the dominant focus being environmental. However, there are few studies that have endeavoured to cover all three pillars of sustainability together. In the case of transport the focus is often on a specific mode (e.g., rail [21], road [22], sea [23], or air [24]), rather than looking at the transport system as a whole.
Other studies have considered interactions between specific flows, e.g., the water-energy-food nexus [25,26,27,28], whereby these three flows are linked with each flow influencing either directly or indirectly on one or two of the other flows. In fact, when the operations of the water industry and the flows in and out of the city are considered, cognisance must also be taken on how this will impact on local agriculture and water supply, as well as links with the use of water by certain industries as their waste disposal. Furthermore, if more pumping is required to extract water or to distribute it, this will increase energy demands and lead to an associated rise in CO2 emissions depending on the energy used and its source. These studies highlight the importance of considering the interactions between these flows particularly in the socioeconomic development of China [27]. Singh and colleagues [29] carried out a comprehensive review of sustainable development studies, which included the sustainability of cities, and the assessment indices used. They concluded that many of the indices were of limited use as, although many were derived in an objective manner, they were often combined on the basis of subjective decisions. Some attempts have been made to develop social indicators, a particularly promising approach being adopted by Albino and Dangelico [30] who proposed three domains of well-being criteria which included material well-being, quality of life, and social inclusion. Urban Metabolism has provided the framework for a number of studies into flows within the urban environment, and while this helps to quantify flows specifically within cities ([11,31,32,33]), it tends to ignore the hinterlands. Additionally, Barles [34] highlighted the lack of regional “urban scale” studies in this field. Furthermore, within the field of urban teleconnections [35,36], which looks at the flows of goods and services across scales within a global urban network with core and peripheral places [37], there is a need for quantification of flows, a greater understanding of their interactions and the processes that influence flows at all scales. To address these points, this paper builds on previous work which identified the key resource flows of Birmingham in terms of mass, together with the associated waste and CO2 emissions. The aim of this paper is to focus on the sustainability criteria (social, environmental, and economic), and qualitatively assess, the existing flows of people and goods between Birmingham and its hinterlands, and to quantify some of these flows. To do this a holistic approach has been adopted whereby the three pillars of sustainability are considered together when studying the hinterland flows, in conjunction with the Birmingham resource flows. The benefit of this approach is to draw attention to flows that interact with each other and increase awareness of such flows. Suggested areas for change to flows to improve sustainability will be highlighted together with recommendations for far-reaching and potentially radical interventions and innovations to the movement of goods, services and people. Birmingham is the UK’s second largest city after London and the largest local authority in Europe, and by further understanding its influences and issues this will assist in sustainability planning of other UK cities for the future.
This paper initially focuses on the city of Birmingham and presents the flows of resources currently used by the city (water, energy, food, materials, and people, i.e., commuter flows) together with its waste and CO2 emissions, considering these from the perspective of the three pillars of sustainability. It highlights such flows into and out of the city, as well as their interactions with its hinterland. To ascertain transport movements and the associated CO2 emissions, the flows of people and goods are then linked to the city’s regional hinterland which includes the Black Country (Dudley, Sandwell, Walsall, Wolverhampton) and the West Midlands. The flows of goods to and from the regional hinterland, the rest of the UK and overseas (Europe and globally) are identified and quantified in terms of mass and value. They are a “snapshot” in time to provide a baseline against which future flows can be compared. The energy use of different transportation modes (road, rail, air, and sea) is shown together with their associated CO2 emissions. Social and environmental factors are presented for Birmingham itself. In the discussion session, the three pillars of sustainability are considered and a qualitative assessment made as to the sustainability of the city and its issues as it currently operates. Suggestions are made as to possible future improvements and a number of proposals presented.

1.1. Birmingham Historical Context

From the 16th century onwards Birmingham (Figure 1) gradually changed from a market-orientated town into an industrialised centre of trade. Industries were attracted to the expanding town due to its central location, good transport connections, and natural resources (iron ore, coal, and water) [38]. The woollen and leather trades became established, followed by the metal working industries. Manufacturing in the city ranged from pen nibs and toys, to jewellery and gun-making. To this day, over 40% of all the UK’s handmade jewellery is produced in Birmingham’s Jewellery Quarter [38]. In the late 19th century railway carriages were made in Birmingham and the bicycle and car industry started in the early 20th Century. By the time of the Second World War, Birmingham was the metropolitan heart of the United Kingdom's manufacturing and automotive industries. However, during the 1970s, the manufacturing industry rapidly declined with cheaper imports and changing technologies and, over the last 30 years, the city’s focus has been increasingly on the service economy. Finance and tourism are now important industries in Birmingham [39]. Birmingham is home to the historic Bull Ring—site of a market for more than 800 years. There are five retail markets attracting around 20 million customers a year and the city is regarded as a major European convention and shopping destination [40]. The city also boasts 6 million trees, with more parks than any other European city [40]. Its current population is just over 1 million people and 6 million people live within 50 miles of the city [40].
The Black Country was described as “Black by day and red by night” by Elihu Burritt, the American Consul to Birmingham, in 1862. It originally encompassed the area where a large coal seam came to the surface and was, thus, easily worked. Today the Black Country covers the four Metropolitan District Council areas of Dudley, Sandwell, Walsall and Wolverhampton [42] and is part of the West Midlands region within 20 km to the northwest of Birmingham [43].
From its prominence in the industrial revolution and through its manufacturing, Birmingham rose to importance in the UK. It continues to be an influential city in the UK due, in part, to its central location and the size of its population. It retains both national and global importance through its remaining engineering skills and vehicle manufacturing (though this is more specialised than in the past) and its service industries. It thus provides goods and services to the rest of the UK as well as overseas. It is a central hub for the UK road and rail network and there are several major distribution centres in the region (such as Hams Hall Distribution Park at Coleshill). Birmingham Airport is nearby in neighbouring Solihull, while East Midlands Airport is only 64 km away. However, there are a number of social issues that are of concern to the city, some of these linking back to its industrial legacy and the post-industrial era. Many manufacturing firms have closed down over the last 30 years with increasing competition from overseas due to cheap labour and goods. This has contributed to the social deprivation experienced in inner city areas of the city [44]. The city also has an obesity problem, over 25% of adults are obese—the third highest in the UK [45], and 23% of Year 6 (10 to 11 year olds) are obese [46]; these high percentages reflecting, in part, the size of the city and the high proportion of young people (29% under 19 [47]). There are a number of factors that are responsible for the increasing levels of obesity in the UK but many studies have shown that this is linked to socio-economic position (SEP), i.e., the lower the SEP the more likely someone is to be obese. However, this is a complex relationship and is highly dependent factors such as population, age, sex, and ethnicity [48,49].
The city is home to four universities and various colleges which help to supply the region with highly-skilled workers as well as housing “knowledge economy” activities. It is also hoped that the proposed development of the High Speed railway (HS2) from London to the North of England will provide significant economic opportunities and is already precipitating changes in the form of the city centre and local transport provision. The proposed formation of the West Midlands Combined Authority (see Section 3.2), which will include Birmingham, Coventry, Dudley, Sandwell, Solihull, Walsall, and Wolverhampton councils, is also a potentially significant driver of change throughout the city and its hinterland and expected to lead to greater prosperity.

2. Methodology

The methodology is divided into five parts. More detail can be found within the relevant sections which are referenced accordingly. The first part explains the data collection procedure for particular resource flows (people and goods, including food) together with their associated transport carbon emissions for Birmingham, building on previous work (see [50]). The second part defines the term “hinterland” with reference to Birmingham. The third part is concerned with data extraction for the movement of goods, food and people, as well as the type of transport used between Birmingham and its hinterland and its associated CO2 emissions. The fourth part concerns the extraction of economic data in relation to movement of goods, transport and their sources and destinations. Finally, social and environmental data for Birmingham are presented.
Having identified the data used in this paper, Section 3 provides examples of how these data can be used to provide greater insight into issues pertaining to sustainability (economic, social, and environmental), as defined earlier (Section 1), that are directly or indirectly linked to the city flows of Birmingham. The usefulness of these data is then assessed in relation to sustainability issues and is discussed in Section 4. The paper concludes in Section 5.

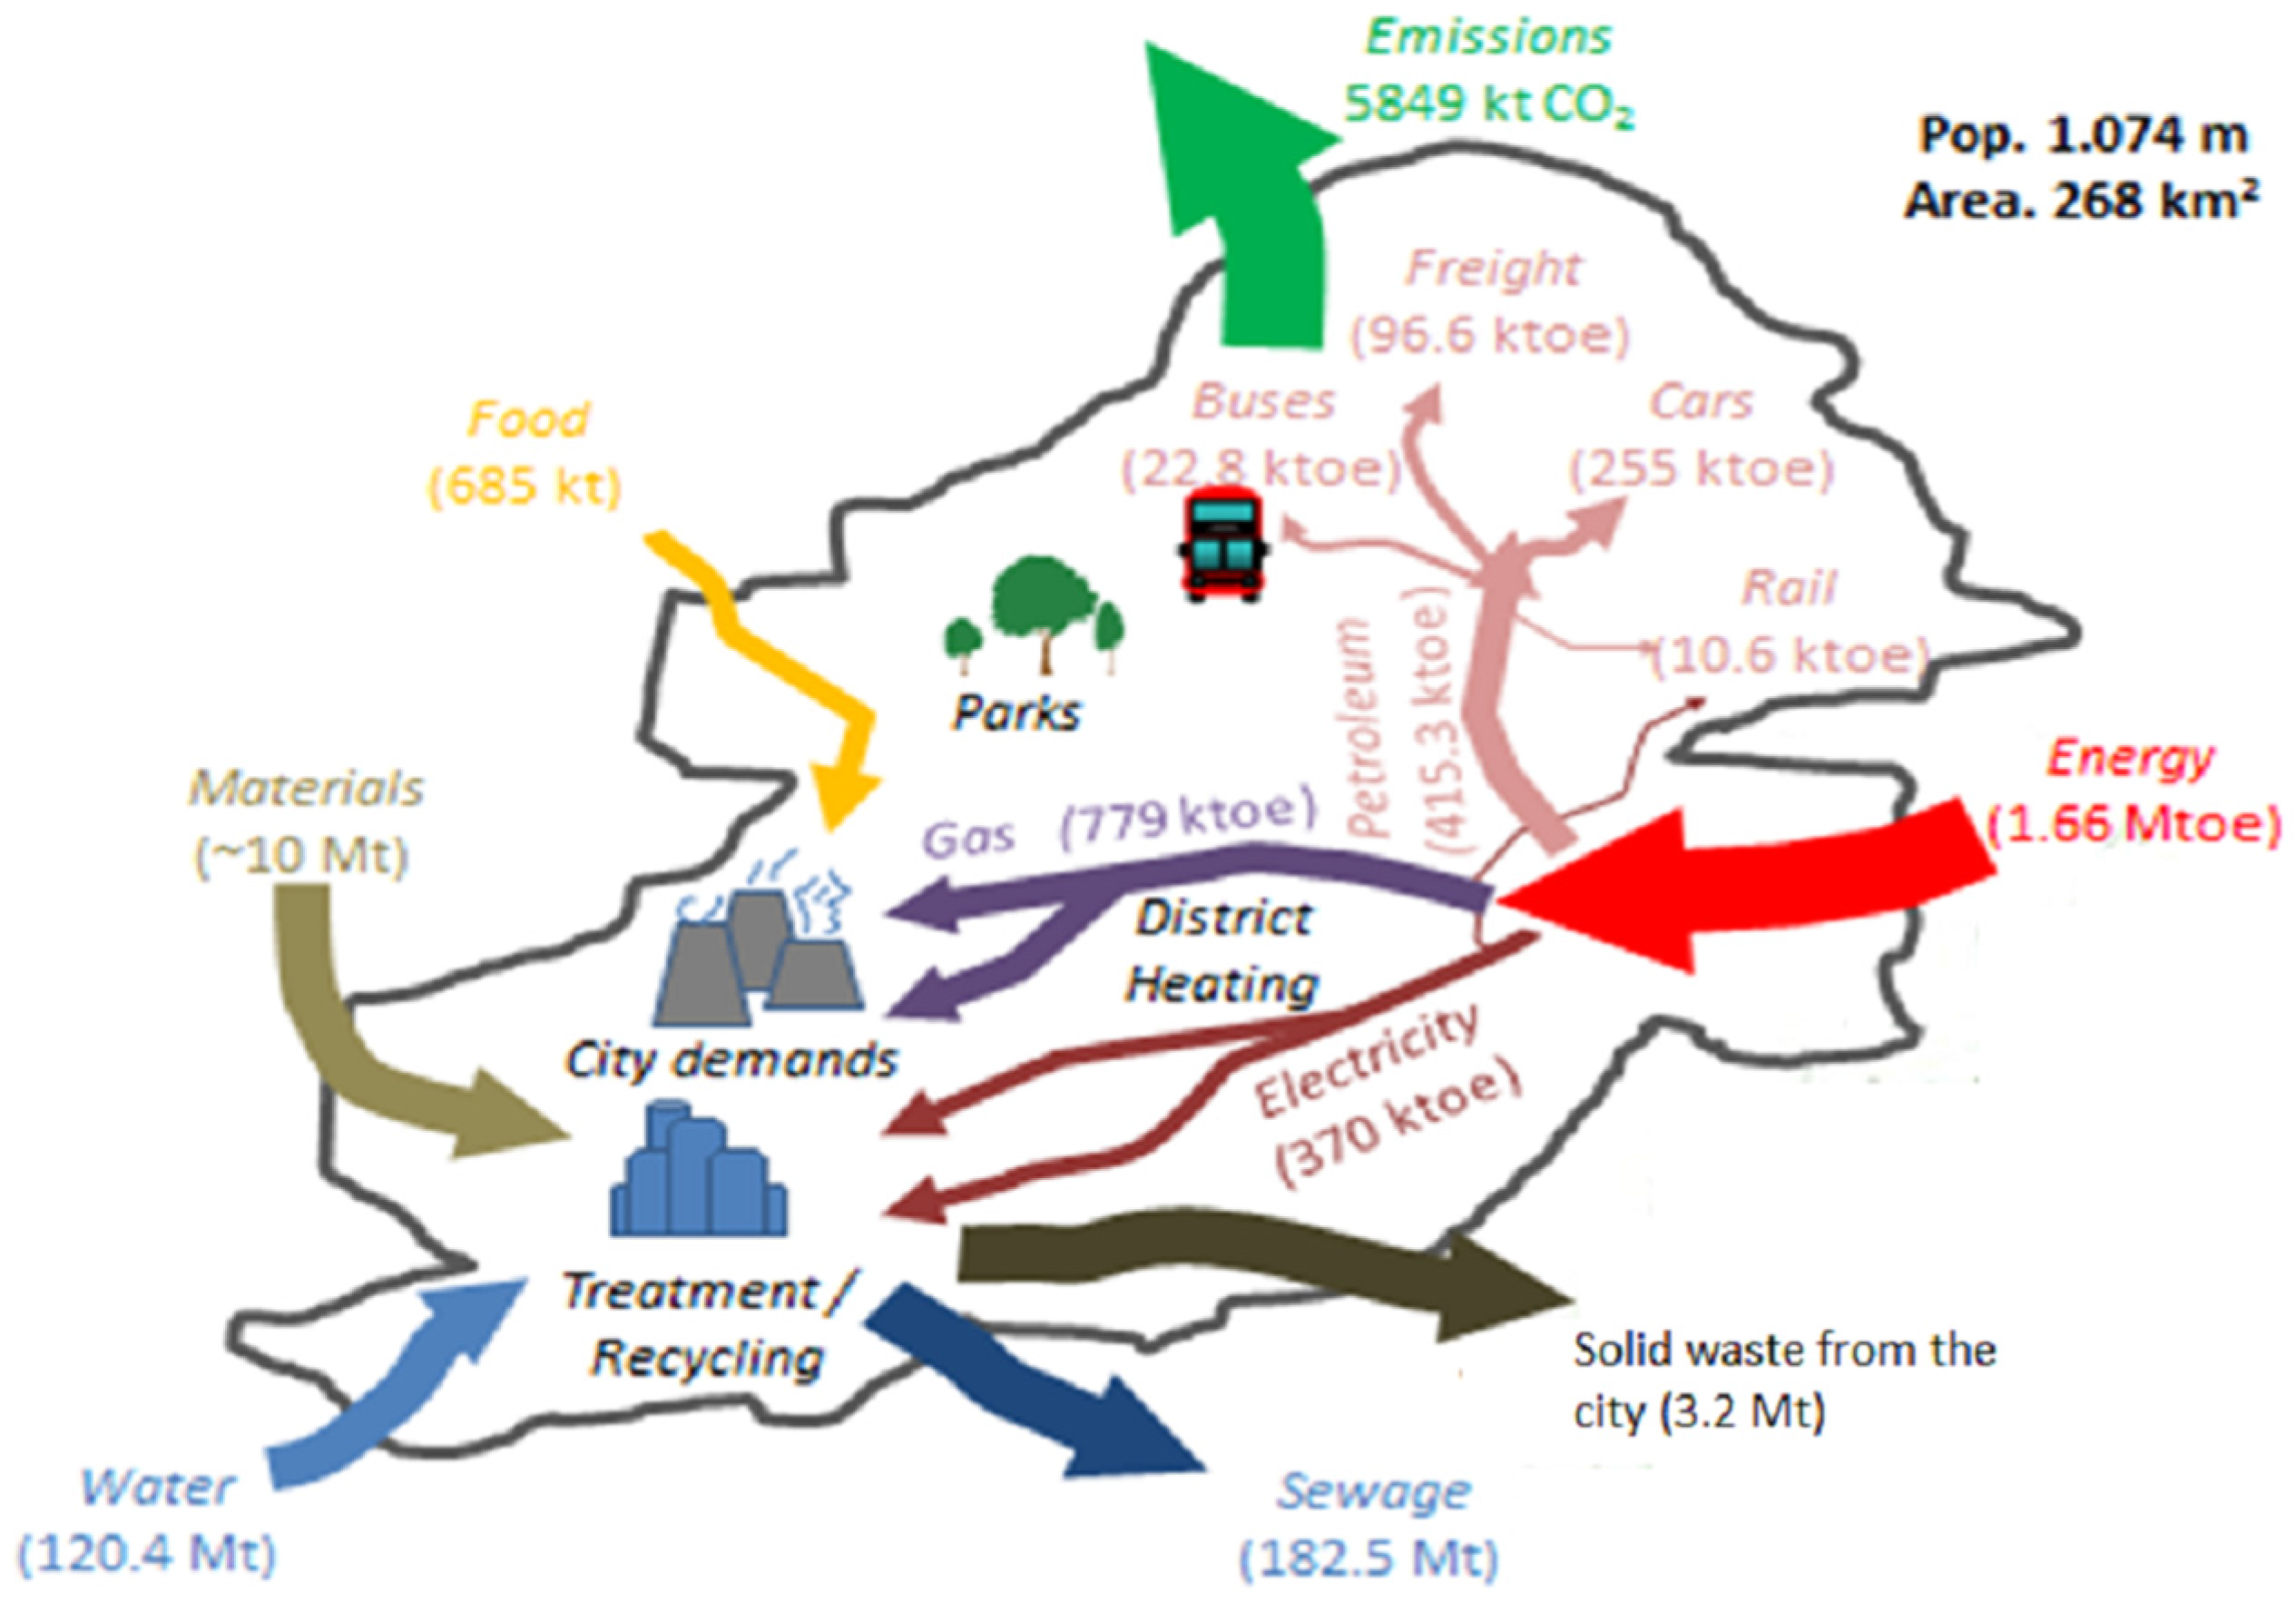
2.1. Birmingham Resource Flows
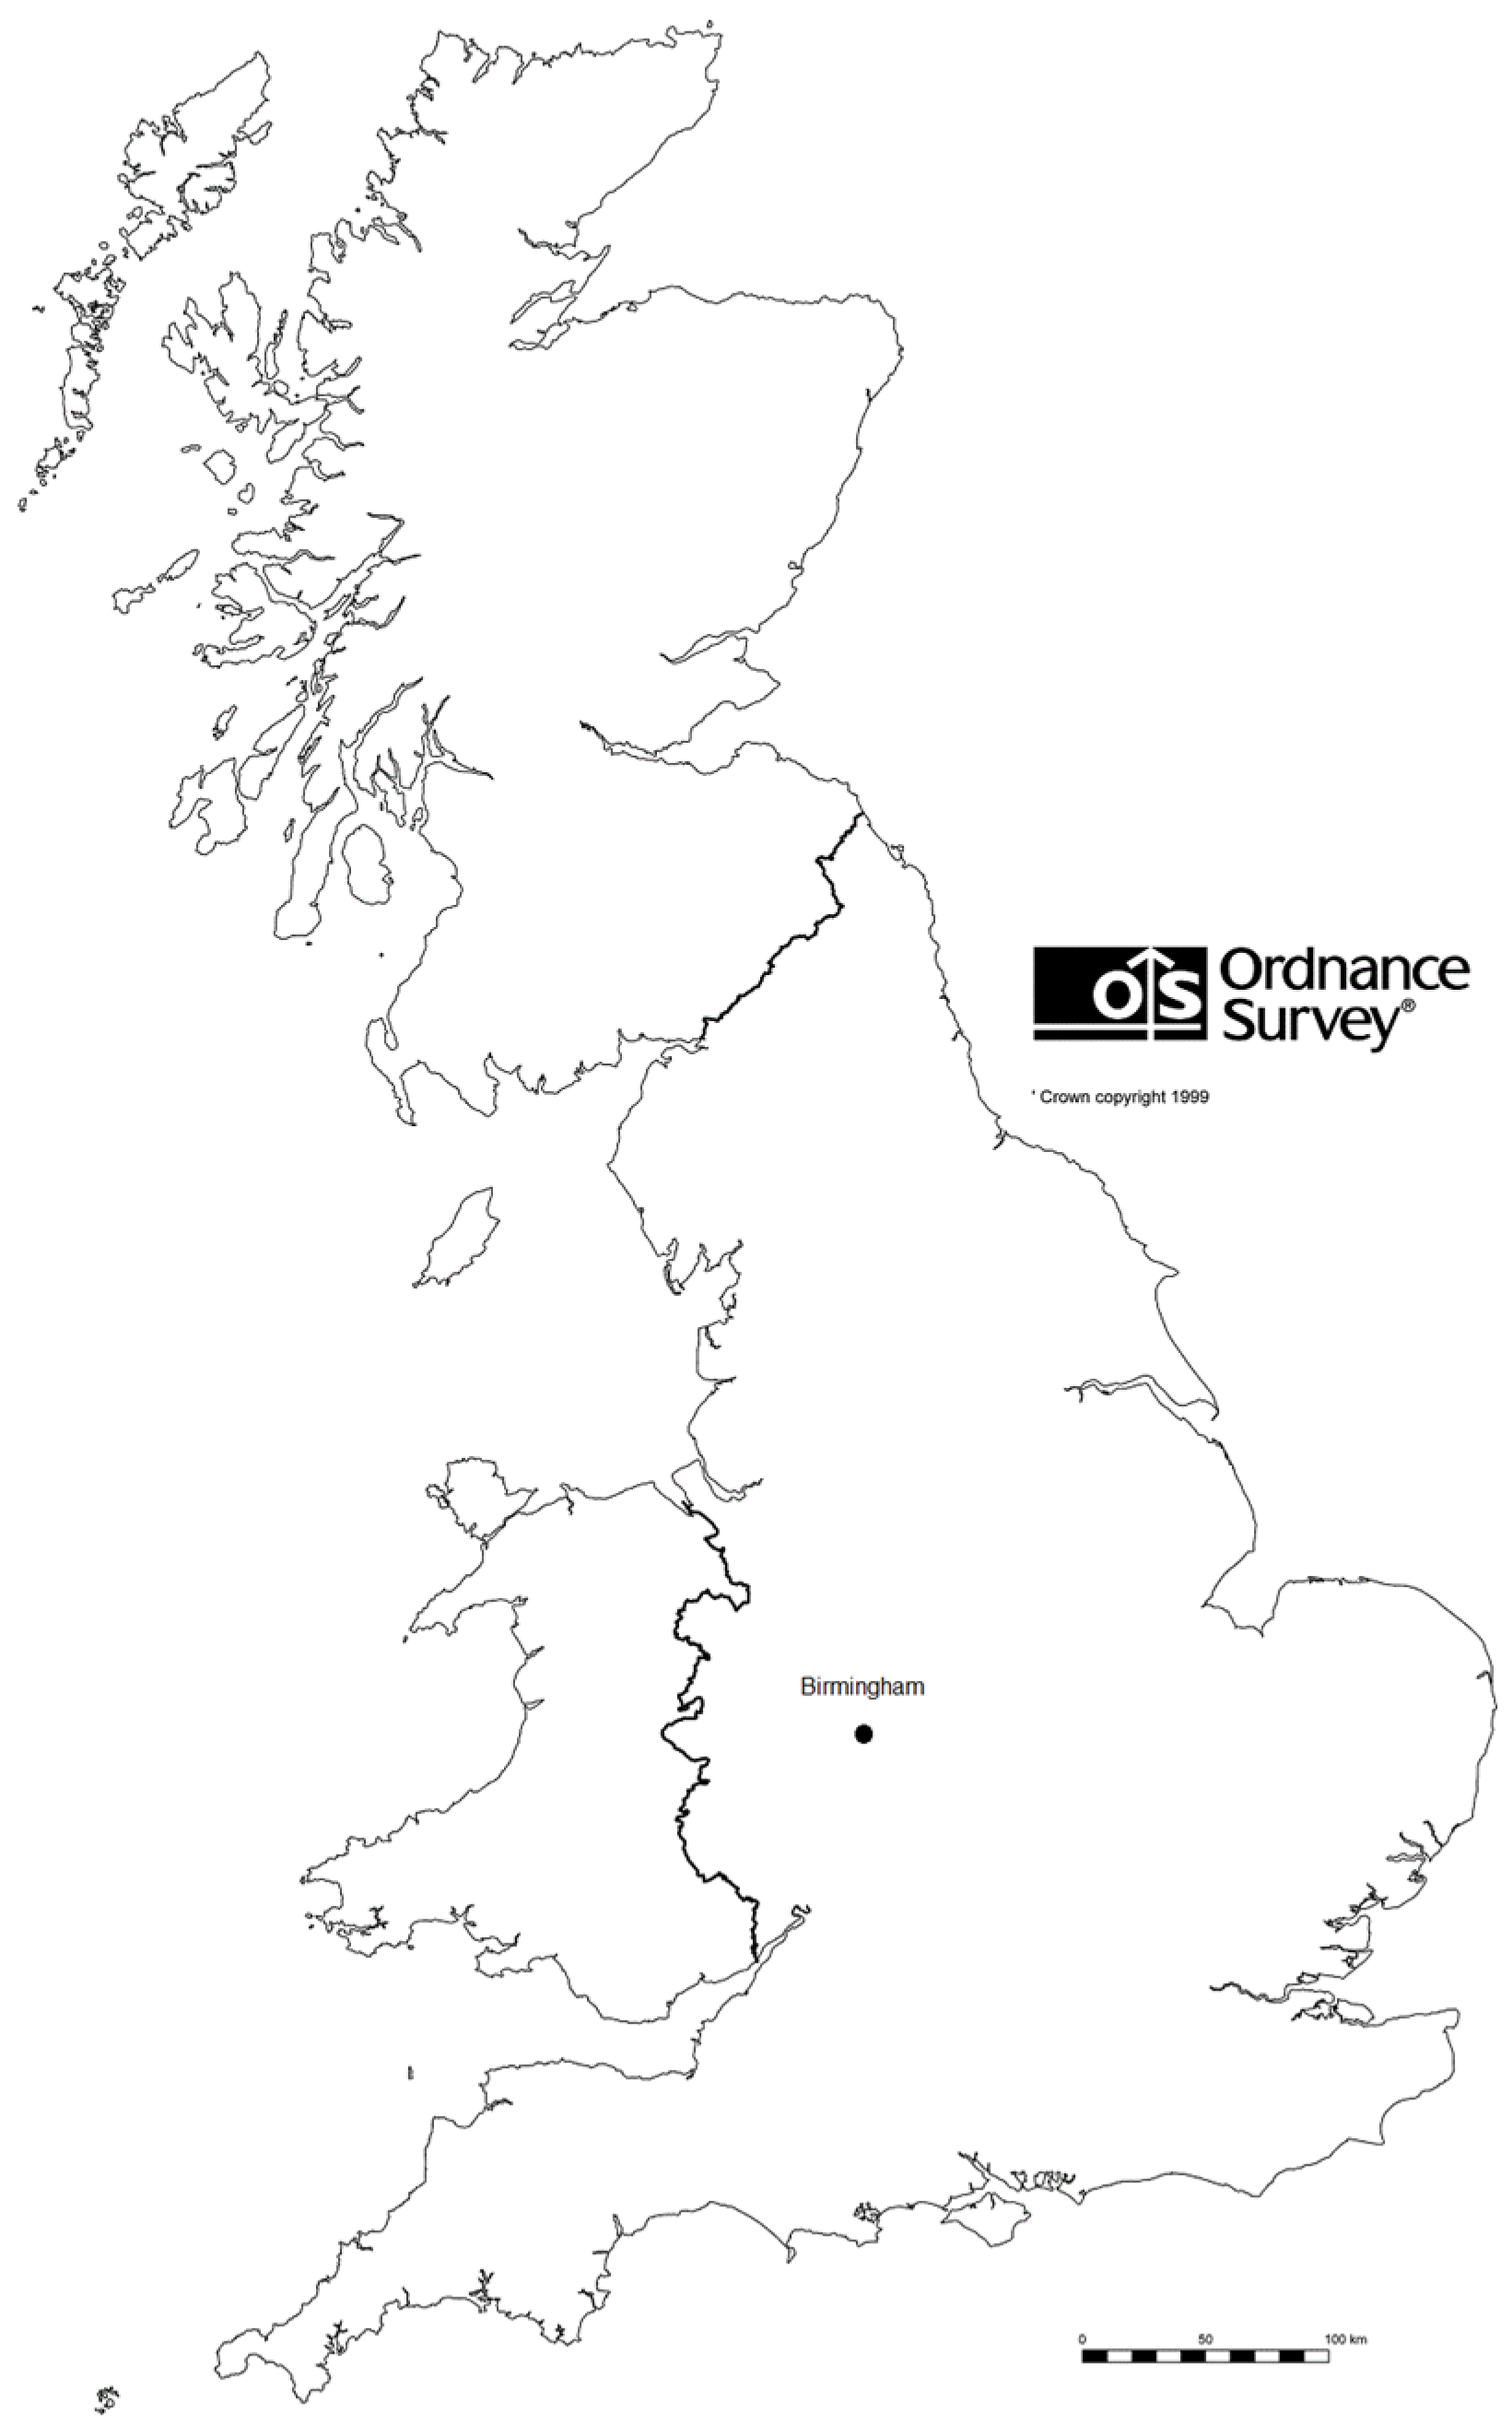
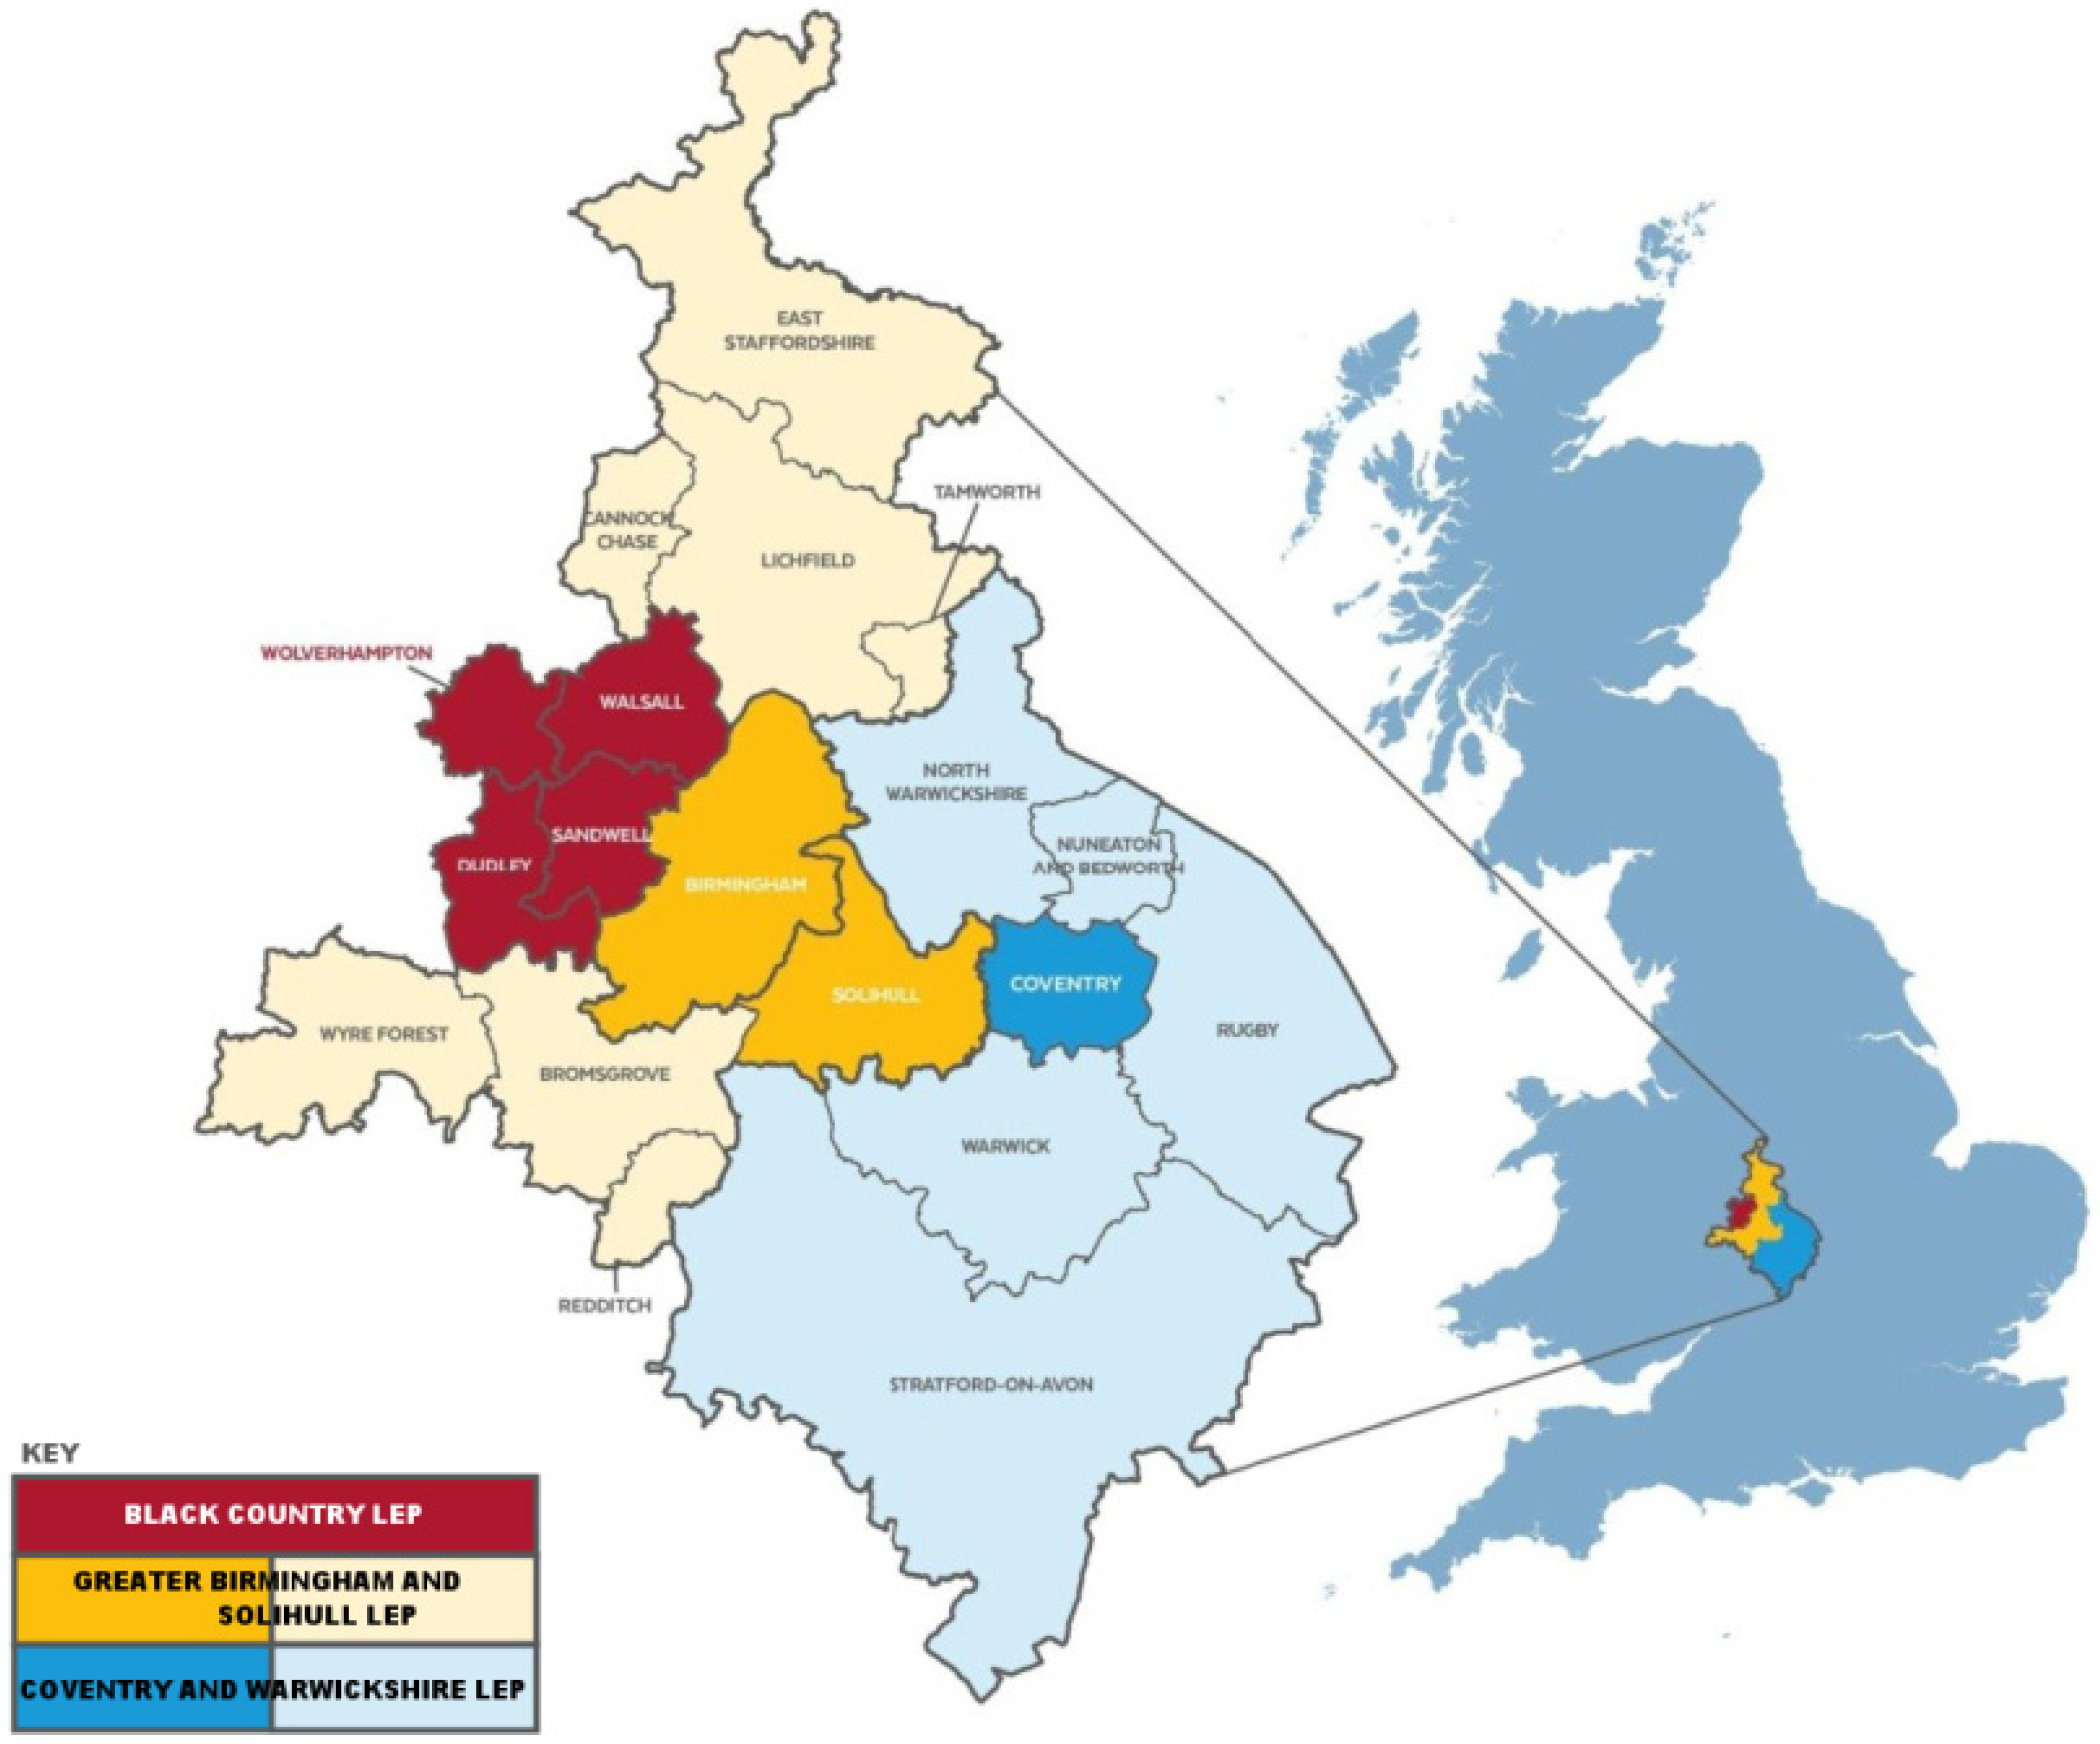
To determine the resource flows of the city, secondary data have been extracted from a number of datasets produced by the UK Government, water companies, trade organisations, Birmingham City Council, and company information. The resources that have been considered in detail in this paper are people, goods, and energy consumed. These are referenced in the text. The year of data collection is shown as well as the spatial coverage of the data.
Flows into, out of and within the city were calculated using a Material Flow Analysis with an Outcome Focus [51]. This ascertained the bulk flows of the city from a top down approach. This identified the magnitude of these flows and their associated CO2 emissions and waste (full details of this work can be found in Lee et al. 2015 [50]). Interactions and interconnections between these flows are being studied as part of the Liveable Cities Programme [52] with a view to applying the Data Envelopment Analysis (DEA) modelling/systems analysis approach for the whole city [53].
From this work [50], flows of people, materials, and food were determined, as well as potable water, CO2 emissions, and waste (including wastewater). It is recognised that the flows of goods, services, and people are influenced not only by a city itself and its structures, but also by the local economy and the city hinterland.

2.2. Hinterland

Fenton [54] described a method for defining the ’core urban area’ and ’hinterland’ for large and metropolitan cities in Britain: “For each city, the ‘core urban area’ is conceived of as the estimated current continuous built-up area of each city. This is primarily derived from the automated classification applied by ONS to define each Census Output Area as ‘urban’ or ‘rural’ on the basis of its morphology and density [55]. The 'hinterland' of each city is conceived as places outside this 'core urban area' whose primary economic orientation is towards that city. Living in the ‘hinterland’ is taken to be a reasonable substitute for living in the urban area itself for someone working in that city. They are thus defined by 2001 Travel-to-Work Areas [56]. Together, the core urban area and hinterland comprise the ‘wider city region’ [54].
Following on from this work and to distinguish between the regional hinterland and the national hinterland a number of criteria were used. The present-day regional hinterland was deemed to fulfil three criteria:
(i) The area where most (at least 75%) of the resident working population also work (known as the self-containment percentage). This area is known as the Travel to Work Area (TTWA) as defined by the ONS [56]. This falls within a 20 km (12 miles) radius around the city of Birmingham. Data have also been extracted from the ONS [57] to determine commuter flows into and out of Birmingham to the surrounding area, and employment data [58]. Most of the commuters into the city come from within a 30 km (19 miles) radius and most of those going out (9%) travel locally to work (i.e., within 15 km (9 miles)); (ii) the Black Country, which is within the 20 km radius and has historic links to the city through the supply of coal and (iii) areas where the economic activity is closely linked to the city of Birmingham. This includes the areas bounded by the Greater Birmingham and Solihull Local Enterprise Partnership (GBSLEP), as well as the Black Country LEP and Coventry and Warwickshire LEP. Further details about the LEPs can be found in Section 3.2. A West Midlands Combined Authority (WMCA) [59] is proposed which will include Birmingham, Coventry, Dudley, Sandwell, Solihull, Walsall, and Wolverhampton Councils working together with neighbouring District and County Councils, as well as the three Local Enterprise Partnerships (LEPs) (GBSLEP, Black Country LEP and Coventry and Warwickshire LEP). The whole area can be seen in Figure 2.
The regional term “West Midlands” is used throughout this paper. This term is taken to include the following towns in the West Midlands Metropolitan Borough: Birmingham, Coventry, Dudley, Sandwell, Solihull, Walsall, and Wolverhampton. These towns are also included in the West Midlands Metropolitan County (a NUTS2 region) (the Nomenclature of Territorial Units for Statistics (NUTS) is a geocode standard run by the European Union). In addition, the West Midlands NUTS1 region encompasses these towns, together with Staffordshire, Worcestershire, and Warwickshire, and the rural counties of Shropshire and Herefordshire up to the border with Wales. It should also be noted that for the different datasets, the region “West Midlands” which is used as proxy for the “regional hinterland” can encompass slightly different areas. In the case of the UK Department for Transport (DfT), this region is the West Midlands Government offices for the regions (GOR) [61] (which is the same as West Midlands NUTS1 region), as it is for the Her Majesty’s Revenue and Customs (HMRC), Department for Environment Food and Rural Affairs (DEFRA) and Department of Energy and Climate Change (DECC).
In relation to the economic activities of the regional hinterland, the Department for Communities and Local Government (DCLG) use the term FEMAs (Functional Economic Market Areas) which they define as “the area over which the local economy and its key markets operate. They vary in size and boundary, depending on the issue under consideration (e.g., labour market, housing markets) and the criteria used to define them”. The review of the West Midlands region in relation to the development of the West Midlands Combined Authority [60] stated that: “FEMAs reflect the real world in which the economy operates; they do not respect the boundaries of administrative areas. Collaboration across these borders is therefore essential to deliver transport and economic development and regeneration in the most effective way”.
The national hinterland is bounded by the coast of the UK, and Europe and the rest of the world forms the international hinterland.

2.3. Transport, Goods, Energy, and CO2 Emissions Data

Road traffic data are available from the DfT for 2014 [62]. In addition, data were obtained for the movement of goods by road between regions (2013 data) [63,64], as well as the goods lifted [65,66,67,68,69]. These data are mostly for the year 2013. (NB. It is noted if a different year is used). Prodcom (“PRODuction COMmunautaire”) [70] provides statistics on the production of manufactured goods together with a summary by the ONS (2012 data) [71]. Real-time data from HM Revenue and Customs (HMRC) [72,73] contain information on the type, weight, and value of goods moved within the UK, as well as imports and exports. Mass and value data on imports and exports can also be obtained for specific airports and sea ports [72,73]. In addition, sea port freight tonnage was extracted from the UK Port Freight Statistics [74]. Details on food transportation were extracted from DEFRA [75,76]. The energy used by different transport modes was obtained from DECC [77]. In addition CO2 emissions were obtained from DECC for different transport types [78]. Data are also available for other Greenhouse Gases (GHG) [79].

2.4. Economic Data

Gross Value Added (GVA) is a measure of the contribution made by an individual producer, industry or sector to the economy. Regional GVA estimates are compiled using the Nomenclature of Units for Territorial Statistics (NUTS), a framework established by Eurostat to provide a uniform regional breakdown of a country. These figures were used in conjunction with the data on regional trade statistics produced by HMRC [72] and the DfT movement of goods by road between regions (2013 data) [63,64]. Rail freight data were obtained from the Office of Rail and Road Regulation (2013 data) [80].

2.5. Social Data

Unemployment [81,82] and social deprivation [83] in Birmingham are compared with the UK figures. Additionally, environmental pollutants [84] are considered, as well as the health of Birmingham citizens [46], and road accidents in the city and Great Britain [85]. Road accidents provide an indication of how many people are killed in the region (this can subsequently be compared with other cities and regions). All of these factors are deemed important as they impact on an individual’s everyday life, health, and well-being [86].

3. Results

These results show flows of resources across the local hinterland of Birmingham and the Black Country, the movement of people between the city and the regional hinterland, goods and services from Birmingham to the rest of the UK and imports and exports of goods from the UK to Europe and the rest of the world. Section 3.1 presents the resource flows (water, energy, food, and people—i.e., daily commuters) and the associated waste and CO2 emissions of the city of Birmingham in terms of mass. These data are presented in the schematic (Figure 3). Section 3.2 describes the LEPS within the Birmingham regional hinterland and its composition. Section 3.3 presents data on the movement of goods into and out of the Birmingham and the regional hinterland, to the rest of the UK and overseas. The final section concerns energy consumption and CO2 emissions associated with the city and transportation.

3.1. Birmingham Resource Flows

Having defined the extent of the regional hinterland, the following section presents data on the flows into and out of the city into this hinterland. These flows are shown in Figure 3. To ease comparison between the flows of different materials, the units are shown in terms of mass. For energy, Mtoe (megatonnes of oil equivalent) are used (1 tonne of oil equivalent (toe) is a unit of energy defined as the amount of energy released by burning one tonne of crude oil). Different crude oils have different calorific values but 1 toe has an approximate value of 42 gigajoules).
Carbon dioxide emissions from the city are in terms of ktCO2 and water flows are shown as a mass (1 gigalitre (GL) of water is equivalent to 1 megatonne (Mt)).
For the period 2012/13, the key flow of the city in terms of mass is Water (120 Mt), followed by Materials (10 Mt) and Energy (1.66 Mtoe). In terms of CO2 emissions the contribution of water to the city’s emissions is small, though pumping for drinking water treatment, and sewage treatment, uses energy (125 GWh with associated CO2 emissions of 66 ktCO2) [50]. Materials contribute around 2358 ktCO2 directly from the city in terms of industrial production within the city, and the transfer of freight contributes to around a quarter of the total transport emissions (1395 ktCO2). Gas consumption accounts for 779 ktoe of energy flow (1120 ktCO2), much of it going to the domestic sector for heating (40%) [50]. Food contributes 685 kt in terms of mass with an estimated 557 ktCO2 of CO2 emissions through its transportation (UK food manufacturing is however responsible for 8 MtCO2e emissions [76], or 1.36% of UK CO2 emissions). Petroleum fuel which includes diesel contributes 415.3 ktoe of which cars use 61% (255 ktoe). Transportation (personal and freight) accounts for 24% of Birmingham’s CO2 emissions. To explore in more detail the daily movements of people into and out of Birmingham, the next section focuses on the commuters to the city, their mode of travel, which is mostly by car, and the places where these workers live.

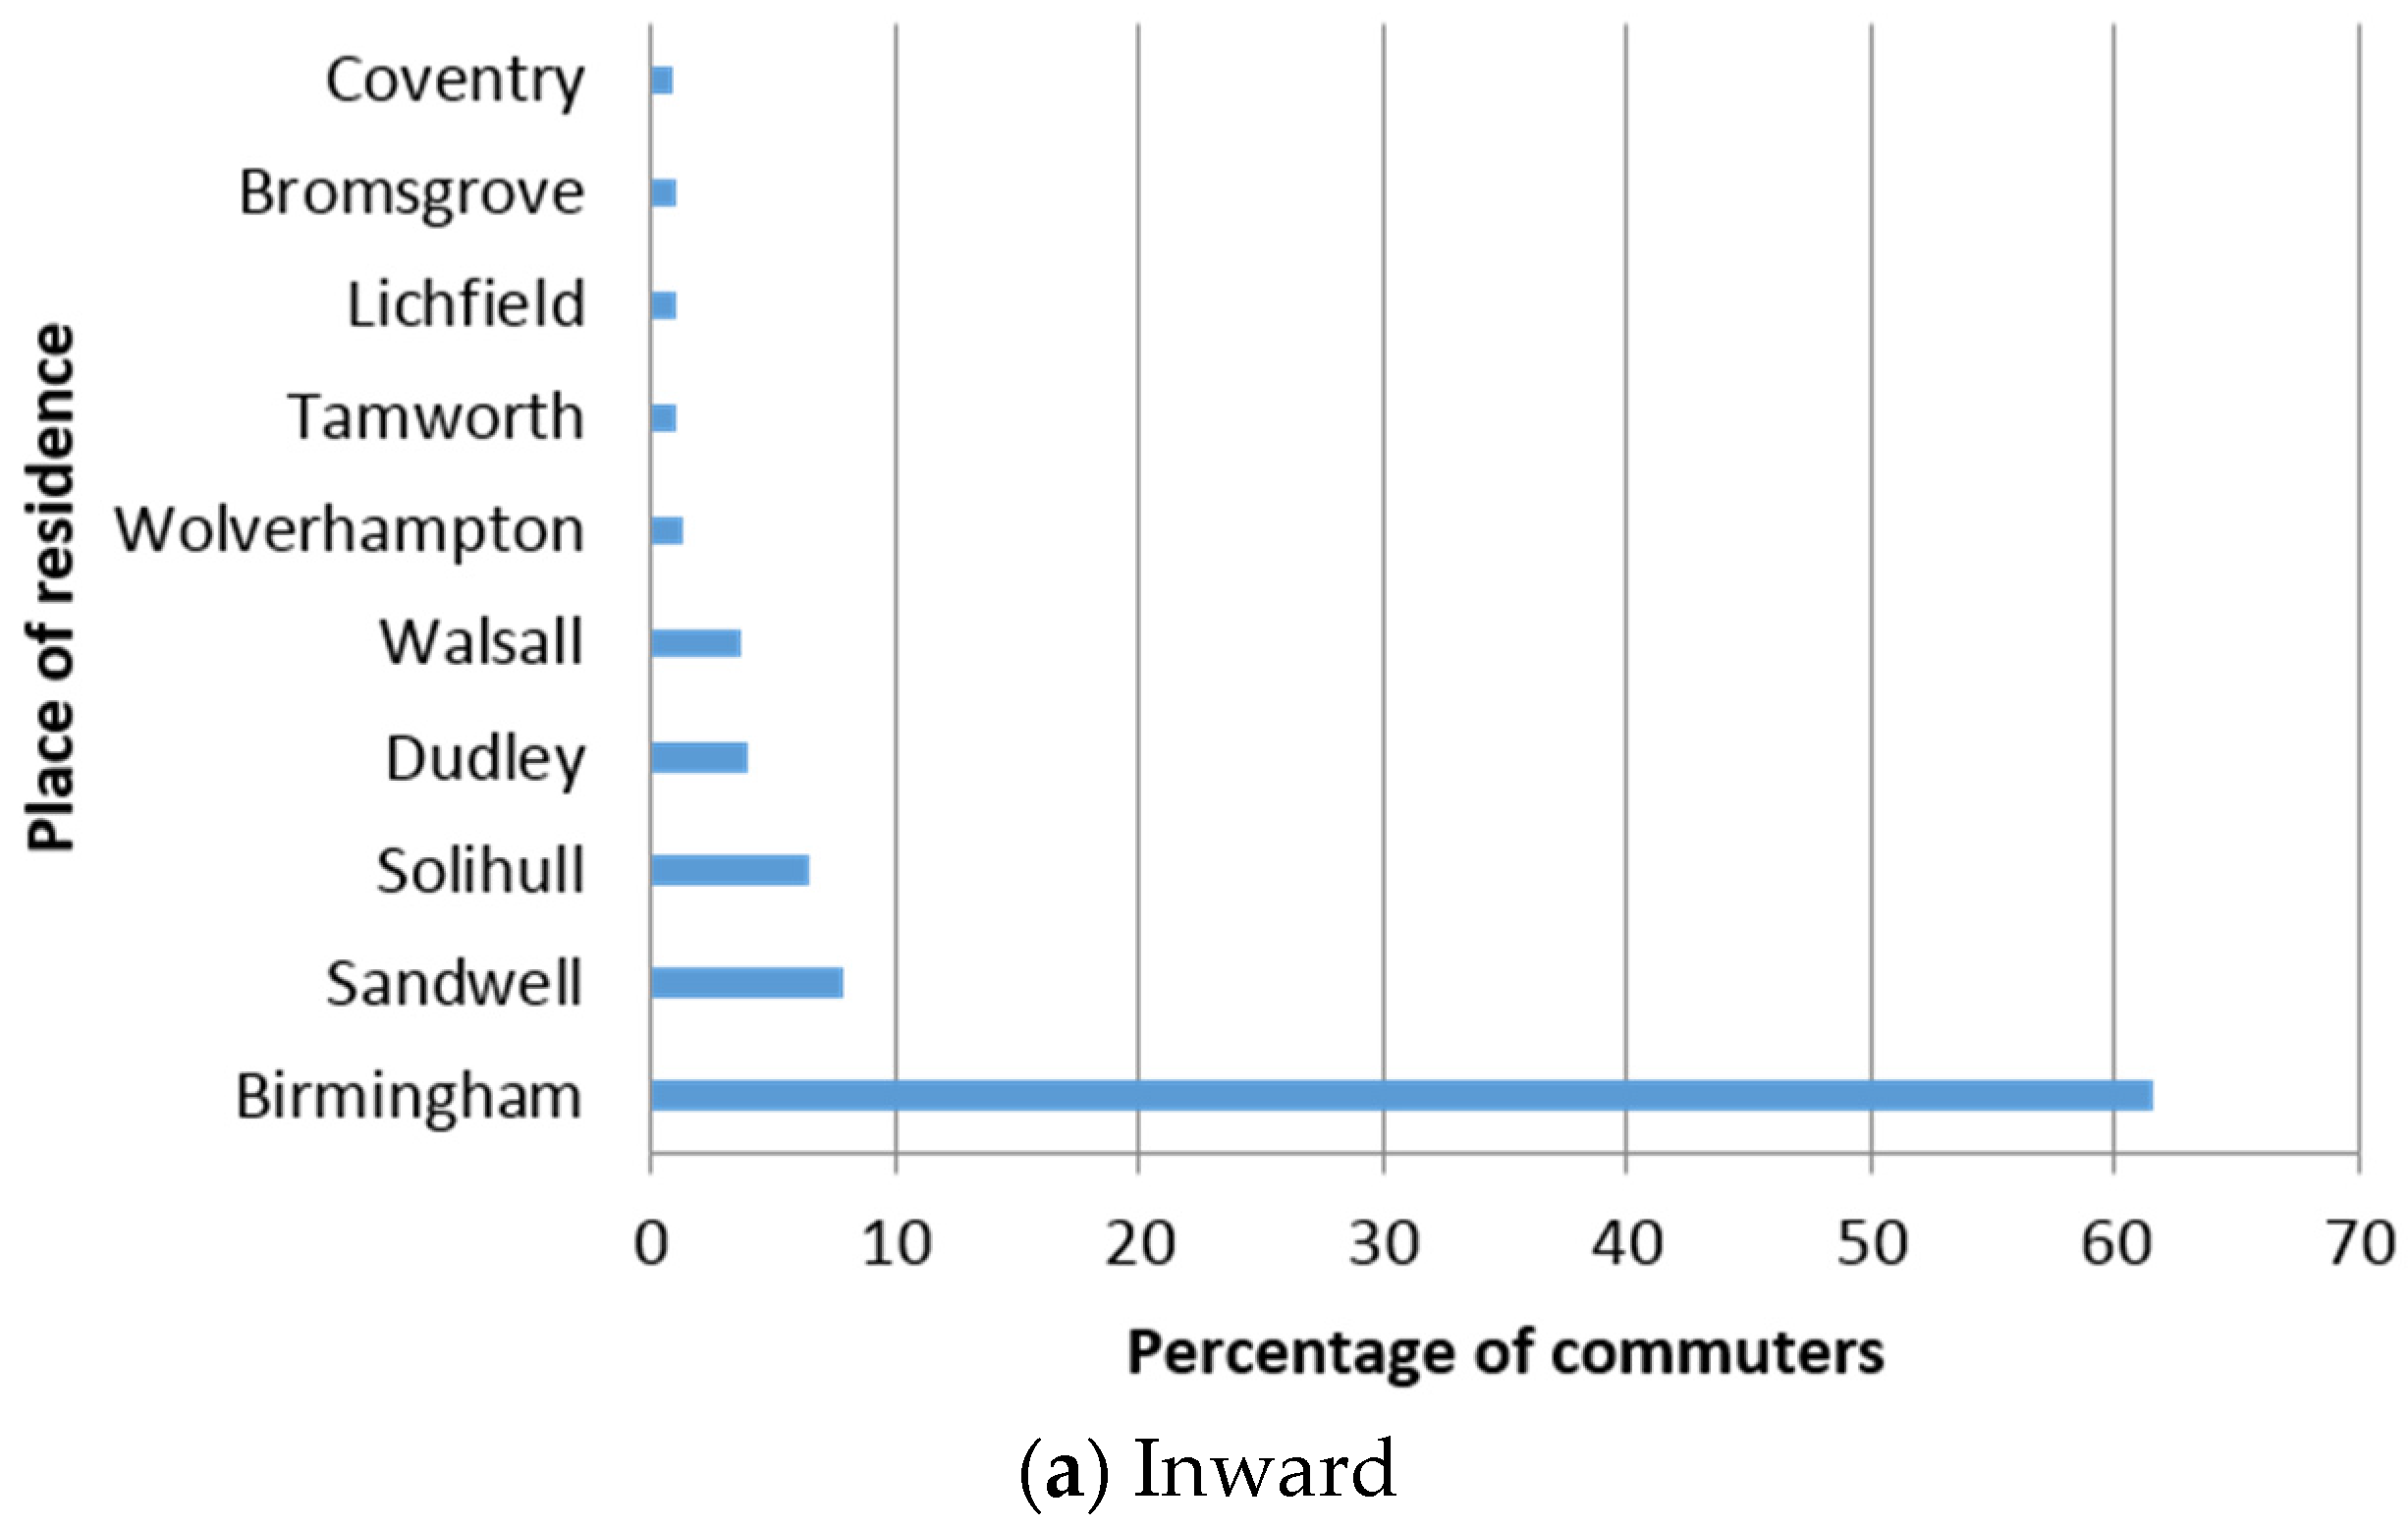
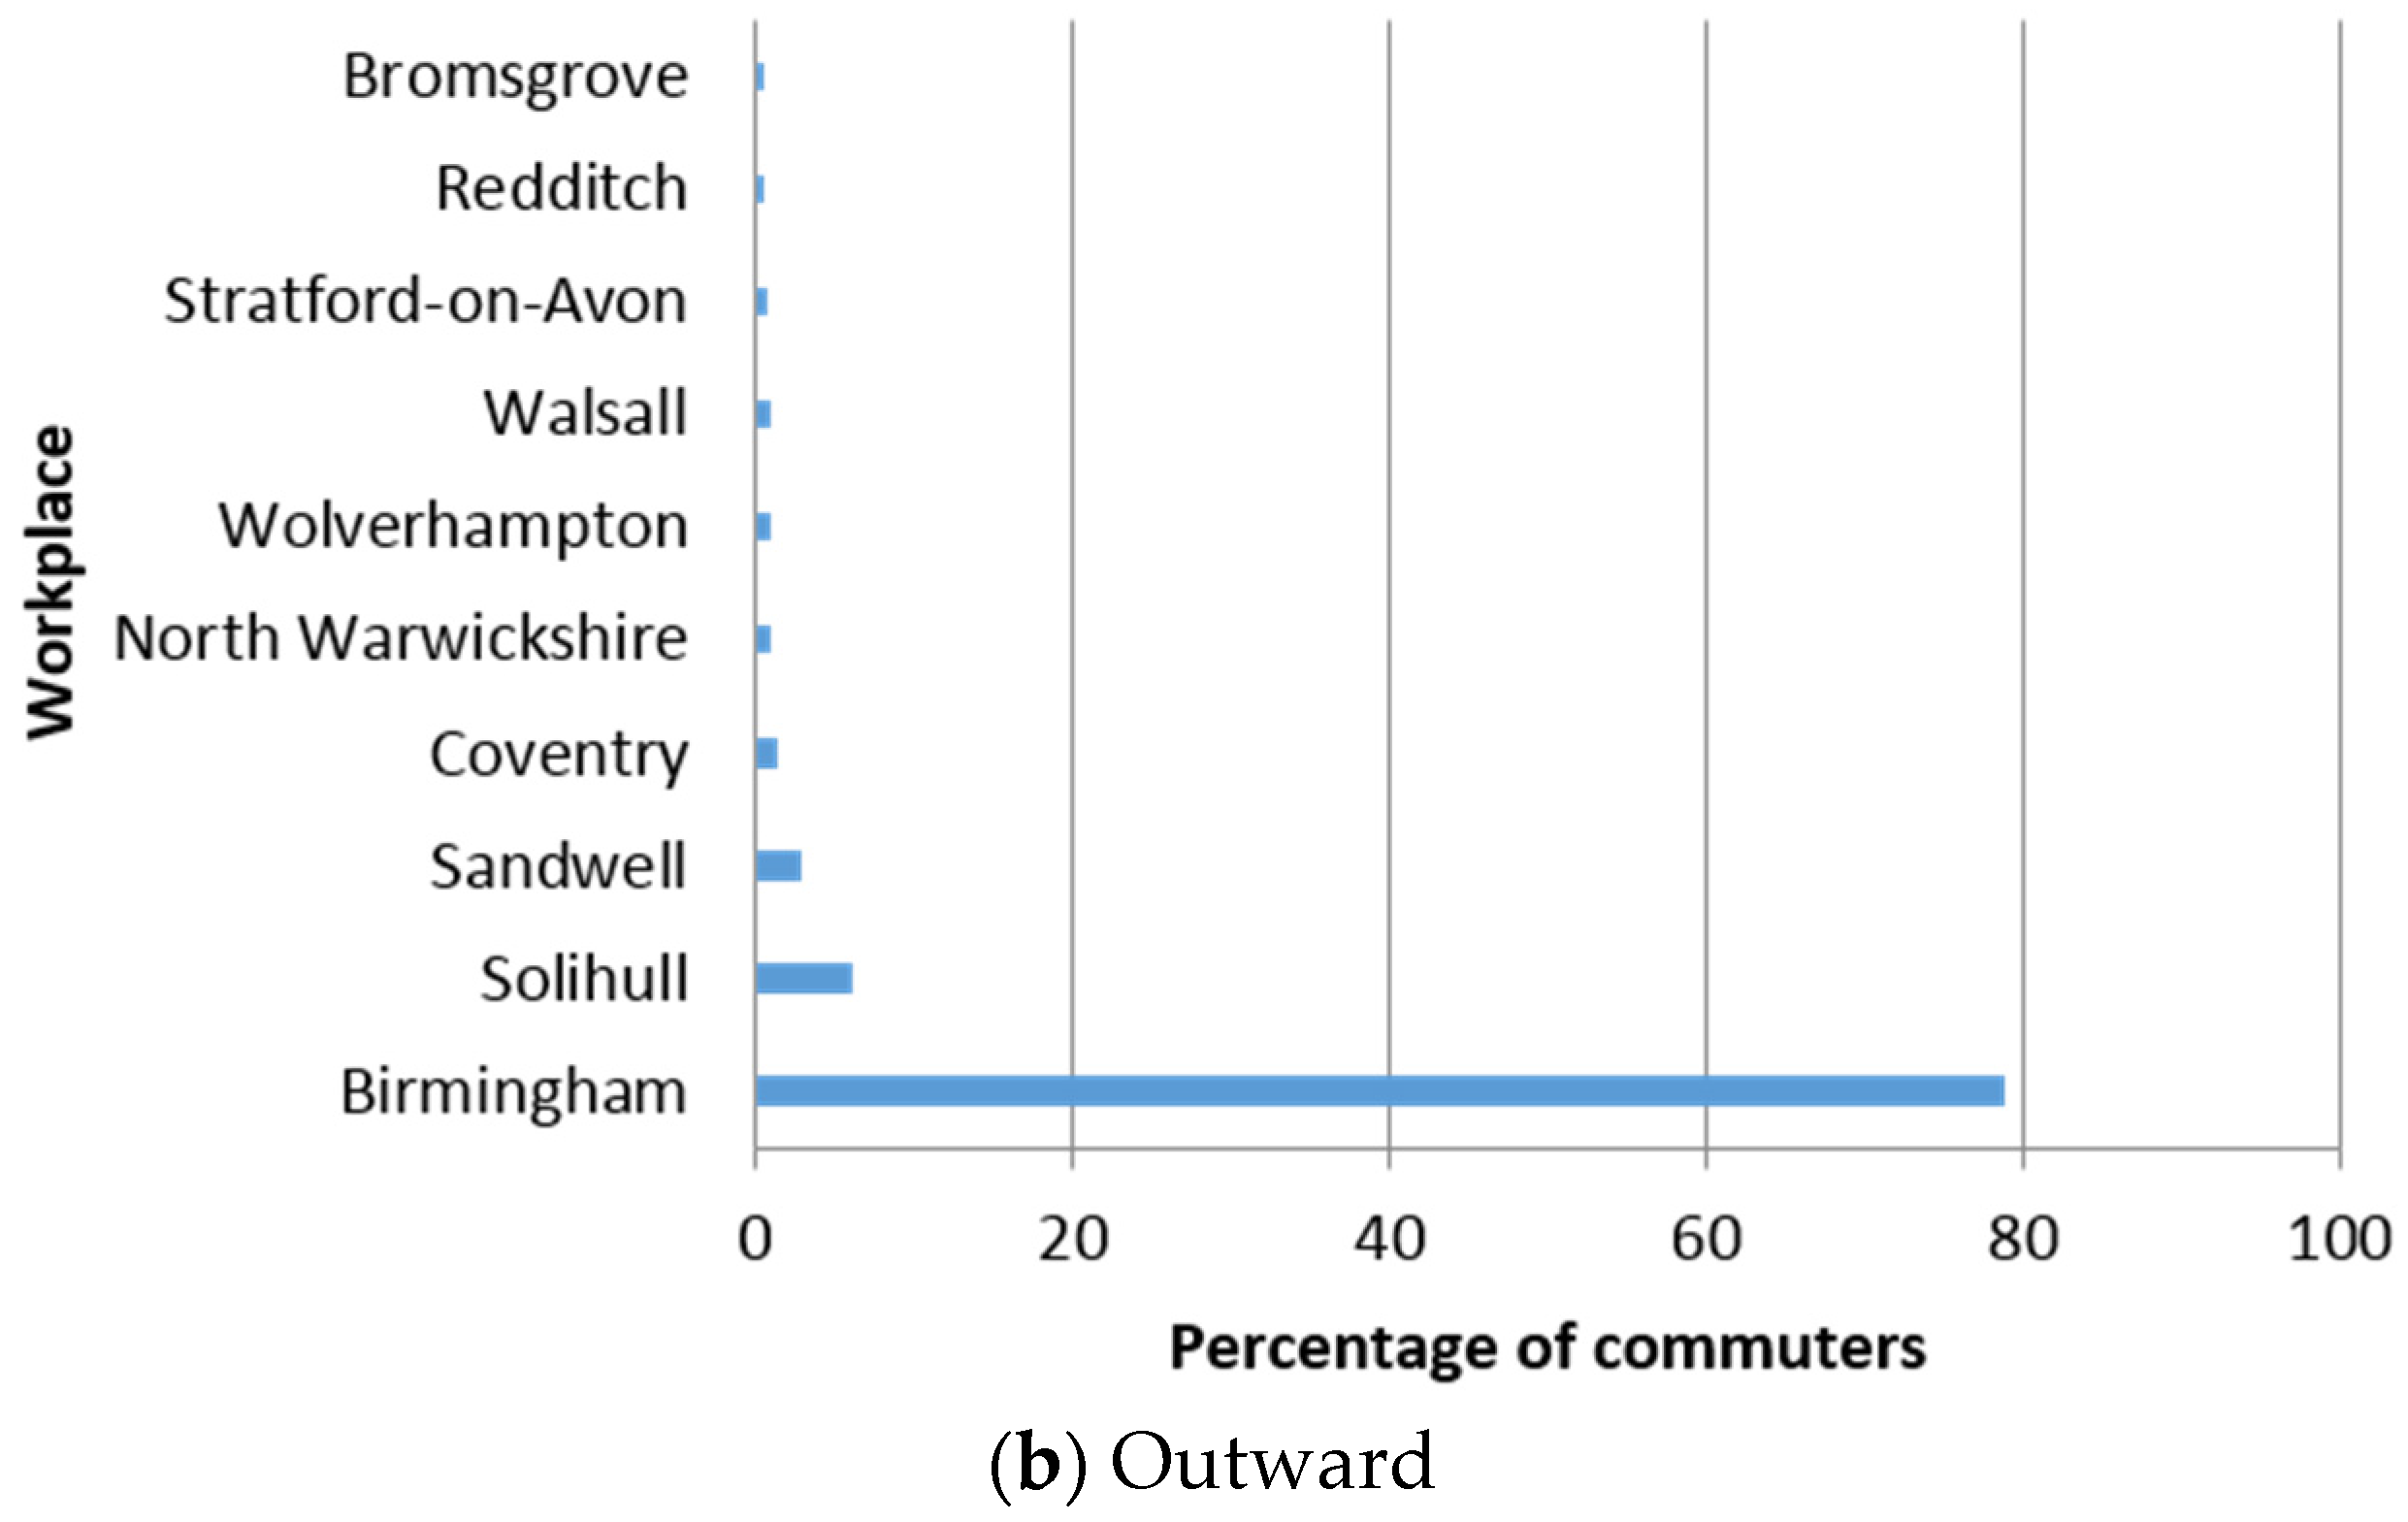
Birmingham Commuters

Birmingham has a population of 1.074 million people and employs 387,500 people (March 2013) [81]. Many of these employees live and commute to work in the city (313,250) or are self-employed, but there are a significant number who travel in from elsewhere (196,089) [88]. The place of origin of these commuters gives an indication of the influence that the city has on flows within the region. Of the people who are employed in the city and travel to their work, 63% do so by car or van as a driver or passenger, 18% travel by bus, and 5% by train. The remainder walk (10%), cycle (2%), or use some other method (less than 1%) [89].
According to the WMCA [59], “the greatest inflows and outflows between places in the West Midlands are between Sandwell, Birmingham and Solihull. Every day 56,000 people commute between Sandwell and Birmingham”. Furthermore, “90% of workers in WM live and work within the West Midlands Economy, a much higher proportion than in each of the three LEP areas and higher too than Greater Manchester, Sheffield and Liverpool”.
Figure 4 shows the top 10 towns supplying both inward (Figure 4a) and outward (Figure 4b) commuters for the Birmingham Metropolitan District including Birmingham itself [88]. The total number of incoming commuters (including Birmingham itself) is 509,339 (2011 data) with 62% (313,250) from within Birmingham and 38% (196,089) from elsewhere, of which 27% are from the regional hinterland (see Figure 4a). Sandwell, Solihull, Dudley, and Walsall (all within 15 km of the centre) account for 22% of inward commuters, with around 1% each from Wolverhampton, Tamworth, Lichfield, Bromsgrove, and Coventry (within 30km of the city centre), individually. The remaining 12% of incoming commuters come from more than 48 km away. It is a similar picture for the outward commuters though with a few subtle differences (Figure 4b). Notably, Dudley (1463 or 0.4%, outward commuters) features strongly for inward commuters yet does not appear in the “top 10” of outward commuters. Additionally, other areas feature strongly for outward commuters namely North Warwickshire, Stratford-upon-Avon, and Redditch. The number of total outgoing commuters is 396,745 (2011 data), with 79% (313,250) from within Birmingham and who stay in the city and 21% (83,495) who go elsewhere; of these, 15% go to the regional hinterland (9% to Sandwell and Solihull; and just over 1% to Coventry), which stretches as far as Stratford-Upon-Avon (0.7% of outward commuters), just under 64 km away [88].
From these data it is evident that much of the movement into and out of Birmingham is confined to within 50 km of the city. Also, from the ONS [89] and the DfT [90] data sets, it is clear that much of this movement is by private car [90] and is for journeys of less than 10 miles (16 km) [91].
This section has summarised some of the resource flows of Birmingham. From the resource flows work [50], it is clear that the city does not operate in isolation and that flows external to the city are vital to its successful functioning. The city is currently heavily reliant on the Elan reservoir for much of its water; the city water flows have been explored in more detail by Hunt and colleagues [87]. To determine the interactions of key flows with the broader hinterland of Birmingham in terms of the Black Country and other surrounding towns (see Section 3.2), the focus of attention is on the transportation of materials and food, given their heavy use of energy and their associated CO2 emissions. Also, one quarter of the large vehicles on the road are used to transport food [92]. In addition, there are health (air pollution) and safety (accidents) concerns from transport in general. Lee et al. [50] highlighted energy consumption as the greatest emitter of CO2, especially gas heating in the domestic sector, electricity use by industry, and the driving of private cars in the transport sector—these being the greatest users. This suggests that these sectors need to be studied in more detail to identify areas where sustainability can be improved.

3.2. Birmingham Hinterland

Section 2.2 introduced the criteria used to identify the boundaries of different hinterlands (Regional, National and International) from the city. From the economic and travel to work criteria, the regional hinterland was identified as being within the boundaries of the West Midlands Conurbation area, as well as encompassing the LEP areas (Figure 3).
The Greater Birmingham and Solihull Local Enterprise Partnership (GBSLEP) [93] zone (set up in 2011) spreads across much of the Midlands encompassing Burton on Trent (within 45 km) and Uttoxeter (within 50 km) in East Staffordshire to the north-east, and reaching down to Stourport-on-Severn in the south-west (within 30 km) [94]. GBSLEP contains a population of nearly two million, provides 918,000 jobs and has a Gross Value Added (GVA, i.e., value of goods and services) of approximately £35.5 billion [93]. Just over half the workforce is employed in retail or service industries, with a further 22% in financial and professional services.
In addition, the Black Country LEP, which includes Dudley, Sandwell, Walsall, and Wolverhampton, also contributes to the local economy, providing over 400,000 jobs and generating £16.2bn GVA per annum [42]. However, there are also 677,800 people of working age living in the Black Country, of which 22% are qualified to NVQ Level 4+ (12% below the national average of 34%). In addition, 16% of inhabitants have no qualifications, noticeably higher than the national rate of 10% [42].
The Coventry and Warwickshire LEP encompasses Atherstone in the north-west, Coventry, Rugby, much of Warwickshire, and reaches down to Oxfordshire and Gloucestershire. Its population is 862,434 people, one fifth of whom are classified as rural [95]. It covers an area of 2076 km2. There are 556,700 of working age of whom around 70% are employed (392,100). Coventry is 20 min from Birmingham by train and Rugby is 36 min away.

3.3. Movement of Goods between the West Midlands, the Rest of UK, and Overseas

Having established the regional hinterland of Birmingham as encompassing much of the West Midlands, it is possible show how goods are moved from this region to the rest of the UK and beyond. This section initially presents data on the goods produced in the West Midlands (including Birmingham) and the mass and values of the goods moved within the UK, followed by the section of Imports and Exports from overseas. Transportation used and CO2 emissions are also shown. From DfT definitions relating to goods moved by road [96], “Goods lifted” is defined as “the quantity derived by adding together the weight of all the loads carried. Measured in tonnes”. “Goods moved” is “a measure of the freight moved which takes account of the weight of the load and the distance through which it is hauled. Measured in tonne kilometres. For example, a load of 26 tonnes carried a distance of 100 kilometres represents 2600 tonne kilometres”. It should be noted that the DfT refer to weight (which is usually measured in Newtons), rather than mass, which is measured in kg. All DfT references relating to weight will be assumed to be mass in the following sections, with units of tonnes or Mt, as appropriate.

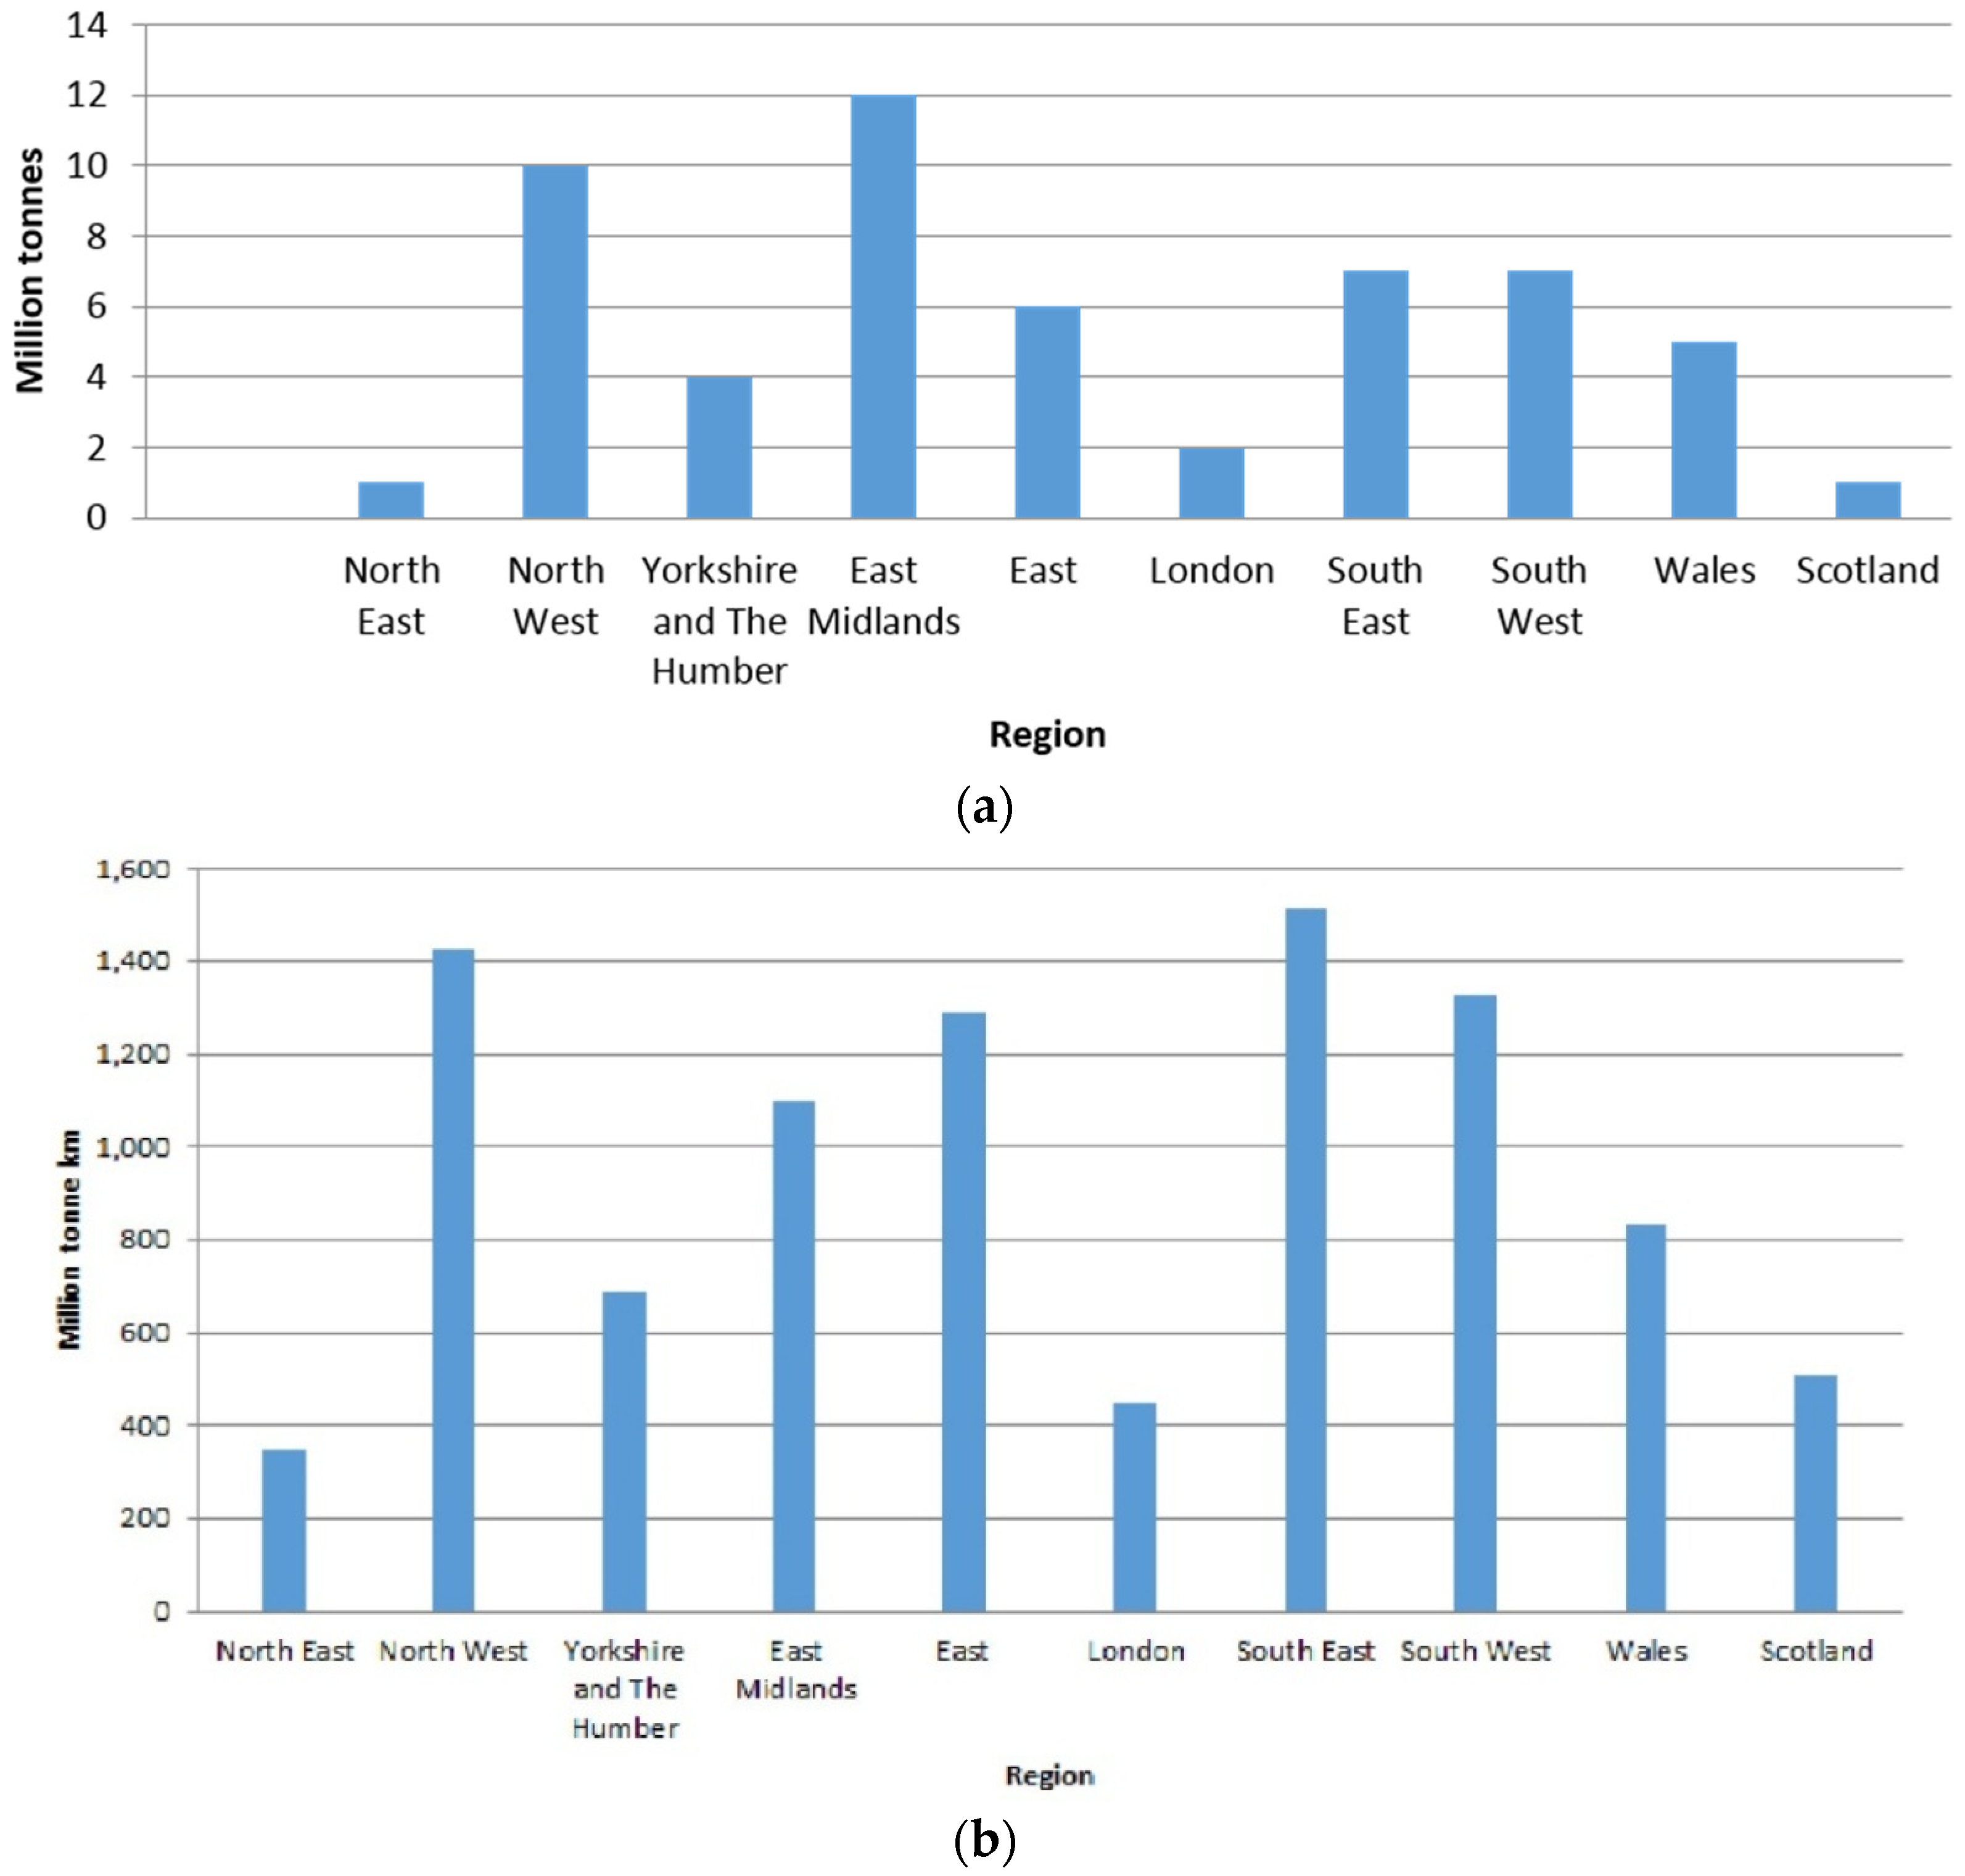
3.3.1. Goods Lifted and Moved from the West Midlands to the Rest of the UK

From Dft road haulage statistics on goods lifted by region and country of origin and destination for 2014 [97], many of the goods transported in the West Midlands remain within the region—91 Mt, of which 26 Mt (29%) stay within the former Metropolitan County (FMC) of the West Midlands (i.e., the area including Birmingham, Coventry, Dudley, Sandwell, Solihull, Walsall, and Wolverhampton) with the remainder going to the rest of the Government Office Region of the West Midlands. Figure 5a shows the distribution of goods from the West Midlands to other English regions, Scotland and Wales. A total of 49 Mt of the goods transported by road from the West Midlands go to the rest of England, 5 Mt to Wales and 1 Mt to Scotland, with a negligible amount to Northern Ireland, giving a UK total road movement of 148 Mt of goods from the West Midlands. Perhaps, not surprisingly, given their proximity, 12 Mt are transported to the East Midlands and 10 Mt to the North-West. If the distance travelled is also considered then a slightly different picture emerges (Figure 5b). This shows both distance moved as well as the mass of the goods. The unit used is million tonne km (i.e., 6 million tonne km would mean 6 million tonnes moved over a distance of 1 km or 3 million tonnes moved over of distance of 2 km), abbreviated to Mtkm.
Again, a large proportion of the goods moved, remain in the region (5,198 Mtkm), with 1257 Mtkm (24%) staying in the FMC. The West Midlands is responsible for 35% of the movement of road goods in the UK (total value 14,754 Mtkm). After the West Midlands itself, the region with the highest value is the South-East (1512 Mtkm), closely followed by the North-West (1429 Mtkm) and the South-West (1328 Mtkm). This is most likely due to the export of manufactured products overseas by sea ports in these regions (Dover, London, Liverpool, and Southampton). The East Midlands falls into fifth place behind the East region. The goods moved to this region may be heavy, but, because it is nearby, then more journeys would be needed to provide comparable figures with those regions further afield. In 2013, the DFT produced road freight statistics to show the average length of haul travelled by commodity [98]. Chemical products (139.0 km) and wood products (139.6 km) have the longest average haul distance. Food products have an average haul of 119.7 km. Metal ore, and glass and cement (including aggregates) have the lowest values of 45.4 km and 75.0 km, respectively. From previous work [99], it was found that the road vehicle freight load is actually more restricted by volume than weight. Particular commodities that are restricted by this factor include agricultural products; beverages; other foodstuffs; wood, timber and cork; crude materials; iron and steel products; chemicals; other metal products not elsewhere specified; machinery and transport equipment; miscellaneous manufactures; and miscellaneous articles. Rail moves the high mass and high volume material (e.g., coal, iron ore etc.).

3.3.2. Goods Moved from the West Midlands to the Rest of the World

From the Regional Trade Statistics (RTS) produced by the HMRC [73], the net mass (kt) and the value of goods imported and exported by the West Midlands region to the rest of the World (EU and non EU countries) are shown in Table 1 and compared with the UK (2014 data). The West Midlands region in this case originated from the Government Offices for the Regions classification and encompasses a similar area to the WMCA (see [100]). From Table 1, it can be seen that the West Midlands is an important contributor to the UK economy, exporting 10% by value though only 4% by mass. The value of the imports and the net mass both equate to 9% of the UK value.
Looking in more detail at the exports and imports for the West Midlands and using 2014 data from the HMRC [101], it is evident how important the manufacturing of machinery and transport equipment is, not only to the West Midlands, but to England as a whole. China is the main export partner for the West Midlands with a decrease in the amount of exports going to the EU in 2014. The USA is among the top three export partners for all nine English regions, while Germany, France, and the Irish Republic are within the top five for the West Midlands. In addition to the manufacturing of machinery and transport equipment, which dominates the export market (accounting for 73.1% of exports) and increased the West Midlands’ market share in 2014 for this section (due in part to a 13.8% rise in exports from “Road vehicles”), the following four commodities were in the top five for the West Midlands: “Manufactured goods classified chiefly by material”; “Miscellaneous manufactured articles”; “Chemicals and related products”; and “Crude materials, inedible, except fuels” [101].
The top five import partners for the West Midlands are (in order): Germany, Norway, China, France, and the Netherlands. The import region may not be representative of where the goods are finally consumed, but it does show the location of the importing companies that redistribute goods to the rest of the UK for consumption. Additionally, the import origin may not necessarily be the point of manufacture with some goods going through other countries. The highest growth rates in imports from China have been in the West Midlands (up 12.1% on 2013) contributing to an increase in non-EU imports (up 5.3% from 2013). The WM also had an increase in imports from Germany (6.3%). For England as a whole, the import trade continues to be dominated by the South East (26.7% by value) and London (20.4% by value), and for much of the country most of the import value comes from the EU [101].
Considering the approximate gross added value (aGVA, a measure of the income generated by businesses less their expenditure), the West Midlands region (NUTS1) generates £69.7 billion of which 50% is from service industries (excluding finance and insurance), 28% is from production, 14% is from distribution and 8% is from construction industries. This aGVA is considerably more than the North-East region (£28.4 billion), which has a similar distribution of industries, but less than the East of England (£82.2 billion), which has fewer production industries but a greater percentage of distribution and construction industries. The North-West region has similar percentages of industries to the West Midlands apart from distribution industries (19%) and generates £100.3 billion. London and the South-East produce the greatest values of aGVA, £226.4 billion and £156.8 billion respectively, with a predominance of service industries [102].

3.4. UK Imports and Exports

The UK imports £395 billion worth of goods (46% from EU) and exports £295 billion (51% to EU). The imports are worth 29% of the UK’s GVA (see Section 2.4) and the exports 22% [73].
Around 95 per cent by volume of the UK’s international trade is transported by sea, and, at least until recently, the UK port sector handled a greater weight of goods than any other in Europe [103]. In 2014, 503.2 million tonnes were handled by UK ports, with 325.5 million tonnes entering the country, and 177.7 million tonnes leaving it [74].
From ONS data on the material flow account for the UK (2013 data) [104], of the 155 Mt exported that year, 86 Mt were energy related (i.e., natural gas, etc.; 55%), 25 Mt (16%) related to metal ores including products made from metals and 21 Mt (14%) related to biomass (e.g., crops), while the remaining exports consisted of non-metallic minerals (e.g., sand and gravel; 10%), waste and other products. There were 293 Mt of imports.

3.5. UK Energy Consumption and CO2 Emissions by Different Transport Modes

Transport is the largest sector in the UK energy economy—representing 36% of energy consumption [105] and 22% of carbon emissions [79]. Looking in more detail at CO2 emissions and energy consumption by transport for 2013 (Table 2), it can be seen how the road sector dominates with 74% of transport energy consumption (46% attributable to passenger cars, 26% to freight, and 2% to biofuels) and 91% of its CO2 emissions. The air sector is also a high consumer (23%) of energy, but only contributes 1.5% of emissions (due to the relatively small number of flights relative to other transport uses). Water and rail consume around 2% and 4% of energy, respectively, and emit around 2% and 3%, respectively, of the CO2 transport emissions.

3.6. Social Considerations

In 2011, Birmingham’s top private sector employer was National Express Group Plc—primarily West Midlands Travel, who employed 4800 people. Out of the Top 10 such employers, six were supermarkets or associated with food and drink, accounting for the employment of 10,260 (39% of those employed by the Top 10). Altogether the top 100 private sector employers employ 86,500 people [107]. In total, 391,330 people of working age are employed in Birmingham [82].
The following wards in the city have the highest levels of unemployment (10% or more): Aston, Bordesley Green, Kingstanding, Lozells and East Handsworth, Nechells, Shard End, Soho, Sparkbrook, and Washwood Heath. The total unemployed in Birmingham (all wards) is 53,851. For Birmingham as a whole, the city’s unemployment is 8% compared with 5% for England [82].
In terms of social deprivation, 40% of Birmingham’s population live in areas described as in the most deprived 10% in England, and 23% of the population live in areas in the most deprived 5% [83].
According to Public Health England, the health of people in Birmingham is generally worse than the England average and life expectancy for both men and women is lower than the England average. About 32.2% (77,500) children live in poverty and 23% of 10 to 11 year olds are obese [46] (see also Section 1.1). There are a variety of reasons for this poor health, ranging from inadequate housing, poor air quality, unemployment, stress, and generally higher levels of social deprivation particularly in the city centre wards [44].

3.7. Environmental Considerations

Air and noise pollution cause significant problems in certain parts of the city. Of particular issue for Birmingham City Council is the air pollutant nitrogen dioxide, which is produced primarily by road traffic. It is an irritant that damages lung tissue and causes respiratory problems. Roadside monitoring sites of nitrogen dioxide (in the city centre area within the Middle Ring Road, along the M6 and A38(M) motorways, and around sections of the A38 Bristol Road in Selly Oak and the A34 Stratford Road in Sparkhill) continue to exceed the air quality objective of an annual average of 40 mg/m3 [84]. Also of concern, is Particulate Matter (PM) which includes sulphate, carbon and mineral dust and affects more people than any other pollutant. PM10 (organic and inorganic particles with an aerodynamic diameter smaller than 10 μm), contributes to cardiovascular problems, as well asthma and lung problems. PM2.5 (particles with an aerodynamic diameter smaller than 2.5 μm) is an even bigger concern as these particles can interfere with gas exchange within the lungs. Again a major source is road traffic, but it is also emitted by industrial processes [84].
During the period 1999 to 2010, from official police records, there were 358 people who died as a result of a road collision in Birmingham Local Authority. Over Great Britain as a whole, 36,371 died in the same period including 8242 pedestrians, of which there were 1279 children [85].

4. Discussion

This paper brings together thinking on the flows into, around, and out of cities with their means of movement. Given that movement of people, resources and goods always incurs an energy cost—people move by transportation (cars, buses, trains, trams, boats) that requires different resources (petrol, diesel, electricity, hydrogen) or are self-propelled and, therefore, they burn calories (the fuel being food)—there is a need to consider how, and why, these movements take place, as well as the “geography” of the movements (where these movements take place).
From the data presented, the essential question concerns the conclusions that can be drawn in relation to the three pillars of sustainability. From an economic perspective, Birmingham and its regional hinterland (WMCA) make a substantial contribution to the prosperity of the region and the rest of the UK. This has been assessed on the gross value added, which shows how much is produced in monetary terms as well as the amount of goods produced and moved within a region. After London and the South-East, Scotland, the North-West and the East, the West Midlands region is sixth in UK regional GVA performance. Its economic growth is in line with the country as a whole. However, the sustainability of this growth remains to be considered in terms of the social and environmental cost.
The city of Birmingham itself has one of the highest levels of social deprivation within its inner wards, many of its citizens are lacking in qualifications and skills needed for new technologies (for example, to take advantage of opportunities in renewable energy, autonomous vehicles, etc.), and many have health issues, including obesity and respiratory problems [46]. In addition, there are high levels of unemployment, both within the city and within its neighbouring regional hinterland. In terms of the environment, the provision of energy and its consumption contributes to large amounts of CO2 entering the atmosphere and exacerbating existing levels. Furthermore, traffic congestion, both within the city and surrounding areas, contributes to low air quality with concomitant health issues (including stress) and safety issues with traffic and pedestrians. Such congestion could potentially be alleviated, in part, with better traffic management, more widespread provision and use of public transport, encouragement for walking and cycling for the large number of shorter journeys, and the use of electric (or other non-locally polluting) vehicles within the city, including for the movement of freight. However, these types of intervention can only be truly effective if they are considered holistically in relation to the complete range of city systems, and at a city system, or city-region, scale. For example, linking to the need to consider individual wellbeing, the move to public transport should be incentivised by making it a more attractive proposition and affordable to more of the city’s citizens, and ultimately the aim might be for it to become a universal societal norm by making the use of private cars in cities socially unacceptable. A “tipping point” here could be associated with air pollution—that is compromised air quality in cities could become the equivalent of the now socially-unacceptable compromised indoor environment caused by smoking in confined spaces.
Birmingham City Council (BCC) is trying a number of initiatives within the city to address some of the problems [108], and the efficacy of these initiatives can be assessed by reviewing in the future the same data sets as those presented herein in terms of whether there is an in improvement in the flows of the city. At the same time, a strategic transport plan has recently been produced for the West Midlands region [109] which provides the framework for a more holistic approach. Looking further afield, many goods are transported into the city from, and out of the city to, the regional hinterland, as well as to the UK and overseas. It has been shown how bulky products, such as glass, cement, and aggregates, as well as food products and high-value items, such as chemicals, form an important part of these flows of goods. Greater efficiencies through sharing transport and transferring more goods to the rail system would assist in reducing the number and adverse impacts of journeys. In many cases, this would require greater efficiencies on an already busy rail system, though innovations in the design of rail carriages and the combined use of freight with passenger trains may be a possible way forward. The issue of waste still needs to be addressed, particularly with regard to the construction industry and the food industry. Steps are being taken to address specific issues related to food waste, but greater granularity in the data is required at the urban level to improve the understanding of existing flows of non-municipal waste and reduce the associated transport movements.
Moving the arguments to resource flows, Birmingham’s water is primarily sourced from the Elan Valley in Wales and is gravity-fed to Birmingham via a pipeline. Energy losses occur within this system (e.g., particularly due to pumping in water distribution and wastewater treatment) and, therefore, local sourcing of water would reduce the energy cost of water provision. Local sourcing could be achieved by extracting groundwater (assuming this was free from industrial contamination and did not require more pumping than at present) or by harvesting rainwater and, combined with local storage in rainwater harvesting tanks, this could be used to satisfy non-potable water demands (toilet flushing, garden irrigation, etc.). Given that there is also an energy cost in treating water, as well as material cost (the chemicals used for water treatment, for example), using non-potable water for these uses makes additional energy and resource savings [110,111,112]. Furthermore, from a sustainability viewpoint, a reduction in water leakage would be beneficial for the city. There is no financial incentive for UK water companies to reduce leakage, although there is a government regulator in place (Office of Water Services, Ofwat) [113], with leakage targets for each company, to ensure that leakage is reduced.
This thinking very obviously translates to energy supply, with local sourcing from means such as solar panels, wind turbines and ground source heat pumps, avoiding the energy and infrastructure costs associated with transmission. In this case, the transmission losses are even more severe than water, with heat loss (into the atmosphere on pylons, or into the ground when cables are buried) and inefficiencies in transmission systems accounting for a significant proportion of this energy loss (around 7% of the total electricity supply) [114]. Local generation from non-thermal sources also avoids the thermal inefficiencies associated with conventional power stations. Birmingham has a District Heating Scheme whereby gas turbines or boilers are used to produce electricity, and heat and hot water is distributed to public buildings via a network of pipes in the centre of Birmingham [115]. In addition, there is an Energy from Waste (EfW) plant at Tyseley that processes around 350,000 tonnes of waste per year and recovers energy in the form of steam and electricity. It produces around 217 GW/hr per year [116]. This means that the amount of municipal waste going to landfill is much lower than the rest of England (6% compared with 31%) [117]. There are plans to expand this facility with the provision of an additional CHP to supply heat. Discussions are underway within the City Council to determine the future of this plant and its waste supply [118]. There is an awareness that, if there is more recycling carried out within the city, this will impact on the waste supply to the Tyseley plant (i.e., more recycling, less waste). These discussions recognise the importance of involving the citizens of Birmingham in the decision making process, as well as understanding the city’s waste needs, and maximising the value of its waste [118]. However, more needs to done to quantify the waste produced by the city, particularly non-municipal waste (including waste from the construction industry), which accounts for 82% of Birmingham’s estimated total waste of 3.2 million tonnes [119,120]. This would help to understand the nature of the waste produced and its potential re-use within the city. However, in common with primary thermal generation, EfW schemes also require high quality water for cooling—another aspect of the water-energy-food-nexus, and for the landlocked WMCA this may be a restriction for development, particularly under the changing climate [121].
Perhaps less immediately evident, but no less serious, is the issue of transport of food to cities. Local sourcing and local treatment of food waste provide a means of reducing considerably the energy costs of movements with this aspect of the urban metabolism. Moreover, given the interdependence between food, water and energy, efforts to minimise food waste have multiple sustainability benefits, many of which influence the urban metabolism [25]. One further benefit of local sourcing is that it delivers greater resilience to a city and city-region [122], by making it less reliant on supplies from beyond its boundaries. The same principles apply to other raw materials and manufactured goods, although here the principles of the circular economy come into focus, with reuse and recycling (a form of local sourcing of resources) making the concept of multiple benefits far more extensive. Taking a holistic view of the full three-pillar costs of the supply of materials, as opposed to the direct economic cost only could, therefore, result in very considerable savings in terms of energy and GHG emissions, and a major enabler of more sustainable cities and city-regions. When considering materials, there is a further dominant influence that needs to be introduced: judgements need to be made on the basis of volume and mass of material movement when determining the environmental and social, as well as economic, cost of their movement. It should be noted that 3D printing could be potentially transformative here, though feedstock materials would still need to be transported. However, if waste materials could be used as an input (as in a circular economy) this would assist in this process. This technology still requires substantial development in order to produce complex goods, together with a re-balancing of costs with regard to energy use and the effort required in manufacturing if it is to complete with low-cost imported goods.
One final important consideration is the means of movement. For pipelines and cables, the energy and GHG emissions costs, and the influences on them, are clear in terms of the amount of energy used in the distribution of the product (oil, gas, electricity) and the associated energy lost in the transfer from its source to destination, and alternative means of movement, other than perhaps wireless rather than hard-wired communication systems, are limited. Local sourcing is the primary alternative strategy to reduce energy and associated heat losses in transfer. For bulk materials there are several alternatives, although all rely on efficient loading/unloading facilities being available. Transport by water can be energy efficient but slow, rail transport is more rapid but less flexible than road transport which is rapid, particularly in terms of end-to-end journeys, but the least energy efficient. The UK’s transportation systems have evolved over centuries, and until relatively recently it has been common to think that we have become “locked into” transport systems that are dominated by road or rail, the balance depending upon the city context in question and whether there is an underground tube or metro system. However the growing prevalence of new tram systems in the UK’s major cities (e.g., Manchester, Sheffield, Nottingham, and now Birmingham) has pointed to a reinvention of historically-prevalent systems where they make economic and social sense, with environmental benefits perhaps being a secondary consideration. Allied to this is the truism that Birmingham has a greater extent of canals than Venice, and that the canal system offers a potentially far more efficient means of transporting freight, where the rate of transport is less important than it is for people (even though a canal taxi system is in operation in Birmingham). Such an approach is made even more attractive in sustainability terms when alternative means of powering vehicles is proposed, building on University of Birmingham initiatives such as the PROTIUM hydrogen-powered canal barge [123] and hydrogen-powered cars (the university is home to England’s first hydrogen gas fuelling station and has its own fleet of hydrogen-powered cars) [124]. The means of transportation therefore demands consideration in any alternative strategies.
However for this to happen, as for many of the beneficial interventions in cities, there needs to be alignment between those who pay and those who benefit and, thus, a coherent system of governance (regulation, legislation, taxation, and financial incentives, etc.) needs to be created alongside visionary proposals for city system change, that is the governance system also needs to change to synthesise with these more practical changes to the urban metabolism [37]. In this respect, a further major research initiative—iBUILD: Infrastructure BUsiness models, valuation and Innovation for Local Delivery—is exploring how infrastructure interdependencies in city systems offer opportunities for alternative business models, and alternative forms of investment, which take account of social and environmental benefits alongside economic benefits [125]. These opportunities are made explicit by a deep understanding of a city’s urban metabolism. Further research work could explore the potential of the locality to reduce or re-use its materials and prioritise areas for development.
By adopting a holistic approach to the city’s interactions with its hinterland several of the issues highlighted in this paper could be addressed more effectively. Although cities will never approach a state in which they could ever be considered “fully sustainable”—perhaps a better description might be “optimally sustainable”—nevertheless with increasing awareness of the flows and the impacts of these flows, i.e., by making explicit the baseline situation, steps can be taken to reduce many of their negative impacts.
To maintain this state, the city needs to ensure that it is able to maximise the use of its own resources with minimum waste. This will require the co-operation of its populace and a greater awareness of the importance of sustainability (organisations such as the Ellen MacArthur Foundation are valuable in this process) not only for the environment but for economic prosperity and social health. This requires strong leadership and city governance as well as the means to facilitate such operations, e.g., the necessary infrastructure, co-operation across many sectors: the public and private sectors, voluntary organisations, utility companies, retail, etc., as well as social support particularly in deprived areas of the city.
City regions and other cities across the world need to work together to ensure that not only do their own citizens benefit from a more sustainable use of resources but also citizens across the world to ensure planetary well-being. This is an extremely challenging ideal, but steps are being taken to move towards this though the UN sustainable development goals [126].

5. Conclusions

This paper has provided an overview of, and established the baseline for, the urban metabolism of Birmingham and its hinterland in terms of resource flows and, in so doing, it has demonstrated that the city relies heavily on its hinterland. A deep understanding of the urban metabolism enables analysis of how radical, and potentially transformative, interventions in these systems could bring about both societal and environmental benefits, as well as potentially direct and indirect economic benefits. It allows those doing the analysis to question, and then challenge, the reasons for the movements through the landscape, design alternative changes to these systems, and explore the consequences of such changes. Transformative improvements to resource flows such as energy and water can be achieved via comprehensive systems of local sourcing which, in turn, will assist in making the city more resilient. For waste systems, adoption of the principles of the “circular economy”, i.e., reuse and recycling, would have a substantial influence on resource and material flows in cities. Regarding material flows, rethinking their means of transportation, and taking cognisance of their volumes and weights, could lead to major benefits in terms of energy consumption, and CO2 and GHG emissions. In addressing many of the complex and interdependent challenges that it faces, Birmingham City Council is seeking to design a holistic approach—an integrated transport system for both people and freight, both within the city and the wider West Midlands Combined Authority, will help. In fact, the first steps have been taken to do this, with the recent publication of the West Midlands Strategic Transport Plan by the West Midlands Integrated Transport Authority [109]. However, broader synthesis with all other resource flows—considering the complete urban metabolism—would be far more effective still.

Acknowledgments

The authors are grateful to the UK Engineering and Physical Sciences Research Council for financial support under the Liveable Cities (EP/J017698/1) Programme Grant, and the Urban Futures (EP/F007426/1), Critical Local Transport and Utility Infrastructures (EP/I016163/1) and iBUILD (EP/K012398/1) project grants. The third author gratefully acknowledges the contribution of the other members of the Lead Expert Group of the Foresight Future of Cites project, and the funding of the Government Office for Science that supported it.

Author Contributions

Susan E. Lee undertook the main body of the research within this paper and reported on the datasets. Contributions from the two co-authors provided critical judgement on the research, and provided detailed consideration of the urban metabolism (Chris Rogers) and transport (Andrew Quinn) issues.

Conflicts of Interest

The authors declare no conflict of interest.

References

  1. UN-Habitat. State of the World’s Cities 2006/2007. Available online: http://mirror.unhabitat.org/pmss/listItemDetails.aspx?publicationID=2101 (accessed on 2 December 2015).
  2. UNFPA. State of World Population 2007. Unleashing the Potential of Urban Growth. Available online: http://tinyurl.com/gm65eas (accessed on 13 October 2014).
  3. Global Health Observatory (GHO). Urban Population Growth. Available online: http://tinyurl.com/n4zmqhs (accessed on 11 September 2014).
  4. The Economist Running Out of Puff. Available online: http://tinyurl.com/ot9oj2u (accessed on 15 October 2015).
  5. United Nations. Sustainable Development: From Brundtland to Rio 2012. Available online: http://tinyurl.com/3bnxofq (accessed on 24 September 2015).
  6. Sachs, J.D. From millennium development goals to sustainable development Goals. Lancet 2012, 379, 2206–2211. [Google Scholar] [CrossRef]
  7. Oxford English Dictionary. “Sustainable, adj.”; Oxford University Press: Oxford, UK, 2015. [Google Scholar]
  8. Allen, A. Sustainable Cities or Sustainable Urbanisation? Available online: http://www.ucl.ac.uk/sustainable-cities (accessed on 10 February 2015).
  9. Agudelo-Vera, C.M.; Leduc, W.R.W.A.; Mels, A.R.; Rijnaarts, H.H.M. Harvesting urban resources towards more resilient cities. Resour. Conserv. Recycl. 2012, 64, 3–12. [Google Scholar] [CrossRef]
  10. Ahern, J. From fail-safe to safe-to-fail: Sustainability and resilience in the new urban world. Landsc. Urban Plan. 2011, 100, 341–343. [Google Scholar] [CrossRef]
  11. Barles, S. Urban metabolism of paris and its region. J. Ind. Ecol. 2009, 13, 898–913. [Google Scholar] [CrossRef]
  12. Barrett, J.; Scott, A. An Ecological Footprint of Liverpool: Developing Sustainable Scenarios. A Detailed Examination of Ecological Sustainability. Available online: http://tinyurl.com/z6p27pz (accessed on 13 Auguet 2014).
  13. Berardi, U. Chapter 15—Sustainability assessments of buildings, communities, and cities. In Assessing and Measuring Environmental Impact and Sustainability; Klemeš, J.J., Ed.; Butterworth-Heinemann: Oxford, UK, 2015; pp. 497–545. [Google Scholar]
  14. Block, T.; Van Assche, J.; Goeminne, G. Unravelling urban sustainability: How the Flemish City Monitor acknowledges complexities. Ecol. Inform. 2013, 17, 104–110. [Google Scholar] [CrossRef]
  15. Childers, D.L.; Pickett, S.T.A.; Grove, J.M.; Ogden, L.; Whitmer, A. Advancing urban sustainability theory and action: Challenges and opportunities. Landsc. Urban Plan. 2014, 125, 320–328. [Google Scholar] [CrossRef]
  16. Dempsey, N.; Brown, C.; Bramley, G. The key to sustainable urban development in UK cities? The influence of density on social sustainability. Prog. Plan. 2012, 77, 89–141. [Google Scholar] [CrossRef]
  17. Ferrao, P.; Fernandez, J.E. Sustainable Urban Metabolism; MIT Press: London, UK, 2013; p. 260. [Google Scholar]
  18. Profillidis, V.A.; Botzoris, G.N.; Galanis, A.T. Environmental effects and externalities from the transport sector and sustainable transportation planning—A review. Int. J. Energy Econ. Policy 2014, 4, 647–661. [Google Scholar]
  19. Gouldson, A.; Kerr, N.; Topi, C.; Dawkins, E.; Kuylenstierna, J.; Pearce, R. The Economics of Low Carbon Cities. A Mini-Stern Review for Birmingham and the Wider Urban Area. Available online: http://www.lowcarbonfutures.org/sites/default/files/ELCC%20-%20Birmingham.pdf (accessed on 23 February 2016).
  20. Tyler, N. Future cities: Meeting the bruntland challenge. In Proceedings of the International Symposium of Next Generation Infrastructure, Wollongong, Australia, 1–4 October 2013; Campbell, P., Perez, P., Eds.; SMART Infrastructure Facility, University of Wollongong: Wollongong, Australia, 2014. [Google Scholar]
  21. Rail Safety and Standards Board. The Rail Industry Sustainable Development Principles. Available online: http://tinyurl.com/o8jv7vd (accessed on 10 December 2015).
  22. Dell, R.M.; Moseley, P.T.; Rand, D.A. J. Chapter 9—The shape of things to come. In Towards Sustainable Road Transport; Academic Press: Boston, MA, USA, 2014; pp. 296–316. [Google Scholar]
  23. Nuttall, P.; Newell, A.; Prasad, B.; Veitayaki, J.; Holland, E. A review of sustainable sea-transport for Oceania: Providing context for renewable energy shipping for the Pacific. Mar. Policy 2014, 43, 283–287. [Google Scholar] [CrossRef]
  24. Åkerman, J. Sustainable air transport––On track in 2050. Transp. Res. D 2005, 10, 111–126. [Google Scholar] [CrossRef]
  25. De Laurentiis, V.; Hunt, D.V.L.; Rogers, C.D.F. Food security challenges: Influences of an energy/water/food nexus. In Proceedings of the 4th World Sustainability Forum, Vienna, Austria, 20–21 November 2014.
  26. Department of Energy (USA). The Water-Energy Nexus: Challenges and Opportunities. Available online: http://www.energy.gov/sites/prod/files/2014/07/f17/Water%20Energy%20Nexus%20Full%20Report%20July%202014.pdf (accessed on 4 September 2014).
  27. Gu, A.; Teng, F.; Wang, Y. China energy-water nexus: Assessing the water-saving synergy effects of energy-saving policies during the eleventh five-year plan. Energy Conv. Manag. 2014, 85, 630–637. [Google Scholar] [CrossRef]
  28. Hussey, K.; Pittock, J. The energy & water nexus: Managing the links between energy and water for a sustainable future. Ecol. Soc. 2012, 17, 31. [Google Scholar]
  29. Singh, R.K.; Murty, H.R.; Gupta, S.K.; Dikshit, A.K. An overview of sustainability assessment methodologies. Ecol. Indic. 2009, 15, 189–212. [Google Scholar] [CrossRef]
  30. Albino, V.; Dangelico, R.M. Green economy principles applied to cities: An analysis of best performers and the proposal of a set of indicators. In Proceedings of the IFKAD, Matera, Italy, 13–15 June 2012; pp. 1722–1739.
  31. Barrett, J.; Vallack, H.; Jones, A.; Haq, G. A Material Flow Analysis and Ecological Footprint of York; Stockholm Environment Institute: Stockholm, Sweden, 2002. [Google Scholar]
  32. Rosado, L.; Niza, S.; Ferrão, P. A material flow accounting case study of the lisbon metropolitan area using the urban metabolism analyst model. J. Ind. Ecol. 2014, 18, 84–101. [Google Scholar] [CrossRef]
  33. Ramaswami, A.; Chavez, A.; Chertow, M. Carbon footprinting of cities and implications for analysis of urban material and energy flows. J. Ind. Ecol. 2012, 16, 783–785. [Google Scholar] [CrossRef]
  34. Barles, S. Society, energy and materials: The contribution of urban metabolism studies to sustainable urban development issues. J. Environ. Plan. Manag. 2010, 53, 439–455. [Google Scholar] [CrossRef]
  35. Seto, K.C.; Reenberg, A.; Boone, C.G.; Fragkias, M.; Haase, D.; Langanke, T.; Marcotullio, P.; Munroe, D.K.; Olah, B.; Simon, D. Urban land teleconnections and sustainability. Proc. Natl. Acad. Sci. USA 2012, 109, 7687–7692. [Google Scholar] [CrossRef] [PubMed]
  36. Güneralp, B.; Seto, K.C.; Ramachandran, M. Evidence of urban land teleconnections and impacts on hinterlands. Curr. Opin. Environm. Sustain. 2013, 5, 445–451. [Google Scholar] [CrossRef]
  37. Castells, M. The Rise of the Network Society; Blackwell: Cambridge, MA, USA, 1996. [Google Scholar]
  38. VisitBirmingham. The History of Birmingham. Available online: http://tinyurl.com/zhmn9by (accessed on 21 October 2015).
  39. Lambert, T. A Brief History of Birmingham, England. Available online: http://tinyurl.com/jacds8b (accessed on 19 October 2015).
  40. Loat, S. Birmingham—Stuff You Should Know! Available online: http://tinyurl.com/4qbtz7 (accessed on 22 October 2015).
  41. OS Outline maps GB Coastline only. Available online: https://www.ordnancesurvey.co.uk/resources/maps-and-geographic-resources/outline-maps.html (accessed on 9 February 2016).
  42. Black Country LEP. Available online: http://www.blackcountrylep.co.uk/ (accessed on 5 November 2015).
  43. BBC. What and Where is the Black Country? Available online: http://tinyurl.com/yjwh65 (accessed on 17 November 2015).
  44. BBC. Index of Deprivation 2010—An Analysis of Birmingham Local Statistics. Available online: http://tinyurl.com/mceu8ww (accessed on 24 September 2014).
  45. Centre for Obesity Research Obesity in the UK. Available online: http://tinyurl.com/moxuq7t (accessed on 20 June 2014).
  46. Public Health England Health Profile 2014—Birmingham—00CN. Available online: http://tinyurl.com/zen36zj (accessed on 1 December 2015).
  47. ONS. Census Shows Increase in Population of the West Midlands. Available online: http://tinyurl.com/naferde (accessed on 14 October 2014).
  48. Wang, Y.; Zhang, Q. Are American children and adolescents of low socioeconomic status at increased risk of obesity? Changes in the association between overweight and family income between 1971 and 2002. Am. J. Clin. Nutr. 2006, 84, 707–716. [Google Scholar] [PubMed]
  49. Shrewsbury, V.; Wardle, J. Socioeconomic status and adiposity in childhood: A systematic review of cross-sectional studies 1990–2005. Obesity 2008, 16, 275–284. [Google Scholar] [CrossRef] [PubMed]
  50. Lee, S.E.; Leach, J.M.; Hunt, D.V.L.; Bouch, C.; Rogers, C.D.F. Urban Resource Flows and Waste for Birmingham, UK. Resour Conserv Recy. 2016. submitted. [Google Scholar]
  51. Lee, S.E.; Hunt, D.V.L.; Leach, J.M.; Rogers, C.D.F. Material flow analysis: Outcome focus (MFA:OF) for elucidating the role of infrastructure in the development of a liveable city. In Proceedings of the International Symposium for Next Generation Infrastructure (ISNGI), Vienna, Austria, 30 September–1 October 2014.
  52. Liveable Cities. Liveable Cities: Transforming the Engineering of Cities for Global and Societal Wellbeing. Available online: http://www.liveablecities.org.uk (accessed on 20 March 2015).
  53. Cook, W.D.; Tone, K.; Zhu, J. Data envelopment analysis: Prior to choosing a model. Omega 2014, 44, 1–4. [Google Scholar] [CrossRef]
  54. Fenton, A. Urban Area and Hinterland: Defining Large Cities in England, Scotland and Wales in Terms of Their Constituent Neighbourhoods. Available online: http://tinyurl.com/q7upk76 (accessed on 9 November 2015).
  55. ONS. 2001 Rural-Urban Classification. Available online: http://tinyurl.com/cxjekfa (accessed on 4 December 2015).
  56. ONS. Travel to Work Areas. Available online: http://tinyurl.com/zkgqzel (accessed on 22 December 2015).
  57. ONS. Area Based Analysis, Commuting Patterns from the Annual Population Survey, Local Authorities, 2010 and 2011. Available online: http://tinyurl.com/lqypx3u (accessed on 17 July 2014).
  58. ONS. NOMIS—Official Labour Market Statistics. Labour Market Profile—Birmingham. Available online: http://tinyurl.com/heqjbnn (accessed on 23 January 2015).
  59. WMCA. West Midlands Combined Authority. Available online: http://tinyurl.com/pst2w8t (accessed on 5 November 2015).
  60. WMCA. West Midlands Authorities’ Statutory Governance Review. Available online: http://tinyurl.com/gmnnyqm (accessed on 27 November 2015).
  61. ONS Regions. Available online: http://tinyurl.com/jwre52v (accessed on 4 December 2015).
  62. DfT. Road Traffic Estimates: Great Britain 2014. Available online: http://tinyurl.com/o2m9n27 (accessed on 26 November 2015).
  63. DfT. Goods Moved by Region and Country of Origin, 2004. Available online: http://tinyurl.com/pm4srtz (accessed on 26 November 2015).
  64. DfT. Goods Moved by Region and Country of Origin and Destination, 2014. UK Activity of GB Registered Heavy Goods Vehicles. Available online: http://tinyurl.com/o88ubkk (accessed on 26 November 2015).
  65. DfT. Goods Lifted by Region and Country of Origin and Destination 2013. Available online: http://tinyurl.com/qxr5ktq (accessed on 27 November 2015).
  66. DfT. Goods Lifted by Commodity Grouping, Annual and Quarterly 2004–2013. Available online: http://tinyurl.com/ojw4c7n (accessed on 20 November 2015).
  67. DfT. Goods Lifted by Commodity and Vehicle Type, 2014. Available online: http://tinyurl.com/or94kdo (accessed on 26 November 2015).
  68. DfT. Goods Lifted, Goods Moved and Loaded Vehicle Kilometres by Mode of Appearance, 2014. Available online: http://tinyurl.com/ojcj5qg (accessed on 26 November 2015).
  69. DfT. Goods Lifted by Region and Country of Origin, 2004–2014. Available online: http://tinyurl.com/nph9lcq (accessed on 27 November 2015).
  70. Eurostat Prodcom—Statistics by Product. Available online: http://tinyurl.com/nzlhqny (accessed on 12 February 2015).
  71. ONS. UK Manufacturers’ Sales by Product Survey (Prodcom), Intermediate Results 2013 and Final Results 2012. Available online: http://tinyurl.com/mg8peqv (accessed on 16 February 2015).
  72. HM Revenue and Customs (HMRC). RTS Data (Regional Trade Statistics). Build Your Own Tables. Available online: http://tinyurl.com/bnkfbdy (accessed on 29 September 2014).
  73. HM Revenue and Customs (HMRC). UK Overseas Trade Statistics and Regional Trade Statistics. Available online: http://tinyurl.com/oal2q8p (accessed on 11 December 2014).
  74. DfT. UK Port Freight Statistics: 2014. Available online: http://tinyurl.com/plety96 (accessed on 28 September 2015).
  75. DEFRA. Food Transport Indicators: Method and Assumptions. 10 January 2012. Available online: http://tinyurl.com/na74zlz (accessed on 27 November 2015).
  76. DEFRA. Food Statistics Pocketbook 2015. Available online: http://tinyurl.com/ob5bpev (accessed on 26 November 15).
  77. DECC. Energy Consumption in the UK (ECUK).Transport Data Tables. 2015 Update. Available online: http://tinyurl.com/qawrefq (accessed on 30 November 2015).
  78. DECC. Local Authority Carbon Dioxide Emissions Estimates 2012. Available online: http://tinyurl.com/lqxhcld (accessed on 23 January 2015).
  79. DECC. Final UK Greenhouse Gas Emissions National Statistics 1990–2013. Available online: http://tinyurl.com/q5n7k97 (accessed on 23 September 15).
  80. ORR Rail Market Share—Table 13.12. Great Britain Annual Data—1998 to 2013. Available online: http://tinyurl.com/jah5utn (accessed on 4 December 2015).
  81. ONS NOMIS—Official Labour Market Statistics. Labour Market Profile. Birmingham. Employment and Unemployment. Available online: http://tinyurl.com/kcpmw5q (accessed on 11 October 2013).
  82. BCC. Economic Activity for Birmingham Wards 2011—Residents Aged 16–64 (Numbers). Available online: http://tinyurl.com/h265qkp (accessed on 9 December 2015).
  83. BCC. Birmingham Areas of Deprivation. Available online: http://tinyurl.com/ayubtcu (accessed on 25 November 2015).
  84. BCC. Air Quality Action Plan 2011. Available online: http://tinyurl.com/oknkuz2 (accessed on 9 October 2015).
  85. BBC. Every Death on Every Road in Great Britain 1999–2010. Available online: http://tinyurl.com/c7jqhkb (accessed on 1 December 2015).
  86. Baker, P. On the Relationship between Economic Growth and Health Improvement: Some Lessons for Health-Conscious Developing Countries. Available online: http://www.radstats.org.uk/no098/Baker98.pdf (accessed on 23 February 2016).
  87. Hunt, D.V.L.; Leach, J.M.; Lee, S.E.; Bouch, C.; Braithwaite, P.; Rogers, C.D.F. Material flow analysis (MFA) for liveable cities. In Proceedings of the 4th World Sustainability Forum, Vienna, Austria, 20–21 November 2014.
  88. ONS. Annual Population Survey Commuter Flows, Local Authorities in Great Britain, 2010 and 2011. Available online: http://tinyurl.com/lqypx3u (accessed on 19 August 2014).
  89. ONS. 2011 Census: Method of Travel to Work (Alternative), Local Authorities in England and Wales. Available online: http://tinyurl.com/pqjo9jq (accessed on 27 August 2014).
  90. DfT. Passenger Transport: By Mode, Annual from 1952. Available online: https://www.gov.uk/government/uploads/system/uploads/attachment_data/file/482670/tsgb0101.xls (accessed on 9 February 2016).
  91. DfT. National Travel Survey: England 2013. Available online: http://tinyurl.com/nt7saq3 (accessed on 2 June 2015).
  92. DEFRA. Food Industry Sustainability Strategy (FISS). Available online: https://www.gov.uk/government/.../pb11649-fiss2006-060411.pdf (accessed on 9 February 2016).
  93. GBSLEP. The Greater Birmingham Project: The Path To Local Growth. Available online: http://tinyurl.com/o6vytux (accessed on 21 July 2015).
  94. GBSLEP. Our Area. Available online: http://centreofenterprise.com/our-area/ (accessed on 5 November 2015).
  95. Coventry and Warwickshire LEP. A SEP for the Future and for Bringing Manufacturing Home. Available online: http://tinyurl.com/o2ypkkt (accessed on 5 November 2015).
  96. DfT. Road Freight Statistics Notes and Definitions. Available online: http://tinyurl.com/pvqxjqq (accessed on 20 November 2015).
  97. DfT. Goods Lifted by Region and Country of Origin and Destination, 2014. Available online: https://www.gov.uk/government/uploads/system/uploads/attachment_data/file/10350/rfs0138.xls (accessed on 30 November 15).
  98. DfT. Average Length of Haul by Commodity: Annual 2004—2014. Table RFS0112. Available online: http://preview.tinyurl.com/joepsl2 (accessed on 11 December 2015).
  99. Allen, J.; Browne, M. Road Freight Transport and Sustainability in Britain 1984–2007; University of Westminster: London, UK, 2010. [Google Scholar]
  100. ONS. United Kingdom: Regions, 2011. Available online: http://tinyurl.com/zsyk3t2 (accessed on 1 December 2015).
  101. HMRC. Regional Trade Statistics Fourth Quarter 2014. Available online: http://tinyurl.com/nfmzr58 (accessed on 10 December 2015).
  102. ONS. UK Non-Financial Business Economy, Regional 2013 Summary. Available online: http://tinyurl.com/pg3e2va (accessed on 9 December 2015).
  103. DfT. UK Port Freight Statistics: 2011 Final Figures. Available online: http://tinyurl.com/ja2l2d2 (accessed on 4 June 2015).
  104. ONS. Material Flow Account for the UK. Domestic Extraction, Imports, Exports and Indicators per Capita (Person), in Metric tonnes, 1990 to 2012 (per Capita). Available online: http://tinyurl.com/plttnt5 (accessed on 11 November 2014).
  105. DECC. Energy Consumption in the UK. All Data Tables. Thousand Tonnes of Oil Equivalent. 2014 Update. Available online: http://tinyurl.com/p8vqtl2 (accessed on 19 February 2015).
  106. DECC. Energy Consumption in the UK (ECUK). Transport Data Tables. 2014 Update. Available online: http://tinyurl.com/p8vqtl2 (accessed on 2 February 2015).
  107. BCC. Top 100 Private Sector Employers in Birmingham. Available online: http://tinyurl.com/ntw4l39 (accessed on 24 November 2015).
  108. BCC. Birmingham City Centre. Vision for Movement. Laying the Foundations for a Vibrant and Liveable Global City. Available online: http://tinyurl.com/z7vbrof (accessed on 26 February 2015).
  109. WMITA. Movement for Growth: The West Midlands Strategic Transport Plan. Available online: http://tinyurl.com/pmjmh6m (accessed on 22 December 2015).
  110. Hunt, D.V.L.; Rogers, C.D.F. Rainwater harvesting: Trade-offs between urban pluvial flood risk alleviation and mains water savings. In Proceedings of the 4th World Sustainability Forum, Vienna, Austria, 20–21 November 2014.
  111. Zadeh, S.; Hunt, D.; Rogers, C. Socio-technological influences on future water demands. Water 2014, 6, 1961–1984. [Google Scholar] [CrossRef]
  112. Zadeh, S.M.; Hunt, D.V.L.; Lombardi, D.R.; Rogers, C.D.F. Carbon costing for mixed-use greywater recycling systems. water management. Proc. Inst. Civ. Eng. 2014, 167, 467–481. [Google Scholar] [CrossRef]
  113. Ofwat. About Us. Available online: http://www.ofwat.gov.uk/ (accessed on 4 February 2016).
  114. DECC. DUKES 2014, Chapter 5: Electricity. Available online: http://tinyurl.com/nw9pnk5 (accessed on 28 January 2015).
  115. DECC. District Heating—Birmingham. Available online: http://tinyurl.com/lvnyze2 (accessed on 18 February 2015).
  116. Veolia Environmental Services. Annual Performance Report for VESB Tyseley ERF. Permit No. WP3239SJ Year 2012. Available online: http://tinyurl.com/pvpajgg (accessed on 14 November 2014).
  117. DEFRA. Local Authority Collected Waste Statistics. Available online: http://tinyurl.com/l5sejxh (accessed on 24 February 2015).
  118. BCC. From Waste to Resource A Sustainable Strategy for 2019. Available online: http://tinyurl.com/oycop4s (accessed on 24 February 2015).
  119. SKM. Enviros Birmingham Waste Capacity Study Final Report, Report for Birmingham City Council. Available online: http://tinyurl.com/lh9rj89 (accessed on 14 October 2013).
  120. SKM. Enviros Birmingham Total Waste Strategy. Final_Report. Report for Birmingham City Council. Available online: http://tinyurl.com/o3dmbbq (accessed on 14 October 2013).
  121. Murrant, D.Q.; Quinn, A.; Chapman, L. The water-energy nexus: Future water resource availability and its implications on UK thermal power generation. Water Environ. J. 2015, 29, 307–319. [Google Scholar] [CrossRef]
  122. Rogers, C.D.F.; Bouch, C.; Williams, S.; Barber, A.R.G.; Baker, C.J.; Bryson, J.R.; Chapman, D.N.; Chapman, L.; Coaffee, J.; Jefferson, I.; et al. Resistance and resilience—Paradigms for critical local infrastructure. Proc. ICE Munic. Eng. 2012, 165, 73–83. [Google Scholar] [CrossRef]
  123. Harris, R. PROTIUM: Hydrogen Canal Boat. Available online: http://tinyurl.com/ho9d4ao (accessed on 22 December 2015).
  124. Centre for Hydrogen and Fuel Cell Research Hydrogen Gas Fuelling Station. Available online: http://tinyurl.com/zltj6cs (accessed on 22 December 2015).
  125. iBuild. iBuild Research Programme. Available online: http://tinyurl.com/ze989rg (accessed on 22 December 2015).
  126. United Nations. Sustainable Development Goals. Available online: https://sustainabledevelopment.un.org/sdgs (accessed on 5 February 2016).
Figure 1. Location of Birmingham. Source: [41].
Sustainability 08 00220 g001
Figure 2. The three LEP areas (Black Country (red); Greater Birmingham and Solihull (orange for Birmingham and Solihull Metropolitan Councils, and yellow for the remaining local authorities in this LEP); and Coventry and Warwickshire (blue for Coventry Metropolitan Council, and light blue for the remaining local authorities in this LEP) making up the West Midlands Combined Authority (WMCA) [60].
Sustainability 08 00220 g002
Figure 3. Resource flows for Birmingham 2012/2013a. Data source [50]; image source [87].
Sustainability 08 00220 g003
Figure 4. (a) Inward commuters [88] to Birmingham and its top nine neighbouring towns ranked by the percentage of commuters; and (b) outward commuters [88] from Birmingham and the top nine neighbouring towns ranked by the percentage of commuters. Note the different scale ranges.
Sustainability 08 00220 g004aSustainability 08 00220 g004b
Figure 5. (a) Goods lifted and transported by heavy goods vehicle (HGV) from West Midlands to other English regions, Wales and Scotland (2013 data) [97]; and (b) goods moved by heavy goods vehicle (HGV) from West Midlands to other English regions, Wales and Scotland (2014 data) [64]. Source: Department for Transport licensed under the Open Government Licence v.3.0.
Sustainability 08 00220 g005
Table 1. Imports and Exports from the West Midlands and the UK to the rest of the World (by value, £000’s, and by mass, kt) [73]. The West Midlands Imports and Exports are also shown as a percentage of the UK values.
LocationExports (£ooo’s)% UK ExportsExports Net mass (kt)% UK Exports
West Midlands28,726,1761056554
UK286,959,341 153,534
Imports (£ooo’s)% UK ImportsImports Net mass (kt)% UK Imports
West Midlands35,665,905927,8969
UK407,801,840 296,795
Table 2. Energy consumption and CO2 Emissions for different transport modes (2013 data) [79,106] (n/a not available).
Transport ModeEnergy Consumed (Mtoe)Percentage of Total Energy Consumed (%)CO2 Emissions (MtCO2)Percentage of Total CO2 Emissions
Road (passenger + freight + biofuels)39.373.6118.491.0
Road passenger24.345.5n/an/a
Road freight13.926.0n/an/a
Biofuels1.12.1n/an/a
Air12.323.02.01.5
Rail1.12.14.43.4
Water0.81.62.51.9
Other transport 1n/an/a3.02.3
Total53.4100130.0100
1 Military aircraft, shipping, and aircraft support vehicles.

