Article

Exploration and Exploitation as Antecedents of Environmental Performance: The Moderating Effect of Technological Dynamism and Firm Size

1
College of Business Administration, Hongik University, 94 Wausan-ro, Mapo-gu, Seoul 04066, Korea
2
Sogang Business School, Sogang University, 35 Baekbeom-ro, Mapo-gu, Seoul 04107, Korea
*
Author to whom correspondence should be addressed.
Sustainability 2016, 8(3), 200; https://doi.org/10.3390/su8030200
Submission received: 16 November 2015 / Revised: 11 February 2016 / Accepted: 22 February 2016 / Published: 25 February 2016
(This article belongs to the Section Economic and Business Aspects of Sustainability)

Abstract

:
This study aims to expand our understanding of environmental performance by adopting exploration and exploitation concepts, which are key types of firm innovation. We reveal exploration and exploitation as two important antecedents of proactive and reactive environmental performance. We also identify the conditions under which the distinct effects of these two types of innovation are moderated. Using a sample of 2060 firm-year observations over a 12-year period in various industries, we find that firm exploration positively affects proactive environmental performance, whereas firm exploitation positively influences reactive environmental performance. Furthermore, we find that the positive effect of exploitation on reactive environmental performance intensifies when technological dynamism is high, and the positive effect of exploration on proactive environmental performance strengthens when a firm is large.

1. Introduction

Environmental practices of firms receive attention from various stakeholders who expect environmental accountability [1,2]. Increased expectations about such environmental practices create strategic opportunities regarding environmental performance [3]. Further, efficient management of environmental performance enables firms to seize better market opportunities drawn from higher demand for environmentally friendly products and to achieve operational excellence, such as cost reductions and improved access to resources [4]. Furthermore, regulations and requirements (e.g., End of Life Vehicle, ISO 14001, Waste and Electronic Equipment, and Restriction of Hazardous Substances) regarding environmental performance have intensified. Therefore, the capability of a firm to develop environmentally friendly products and to build production facilities to reduce pollution has become more critical.
This study attempts to investigate the effect of firm innovation activities on two distinct types of environmental performance (proactive and reactive) and the conditions under which such effects intensify or weaken. Although a large amount of research has revealed the effects of environmental innovation activities on environmental performance, only a few studies adopt the traditional (general) innovation perspective to understand the relationship between the two [5,6,7]. We contribute to the current literature on environmental performance by empirically testing the effects of traditional innovation on environmental performance. We separate innovation into exploration and exploitation—the two representative types of traditional innovation activities [8]. A firm seeks innovation to develop new products or services to gain long-term viability, and environmentally related concerns or issues may not be the first priority. Therefore, examining the effect of traditional innovation activities on environmental performance is worthwhile. We further extend our arguments by suggesting two moderators (technological dynamism as an external factor and firm size as an internal factor) on the main relationships.
The remainder of this paper is structured as follows. We provide arguments on the relationship between the two types of innovation (exploration and exploitation) and the two types of environmental performance (proactive and reactive). Next, we delineate the moderating effects of technological dynamism and firm size on the main relationships. In the methods and results sections, we provide a description of the data, our empirical model, and the results of the data analysis. In the conclusions section, we discuss the implications of this study and provide future research agendas.

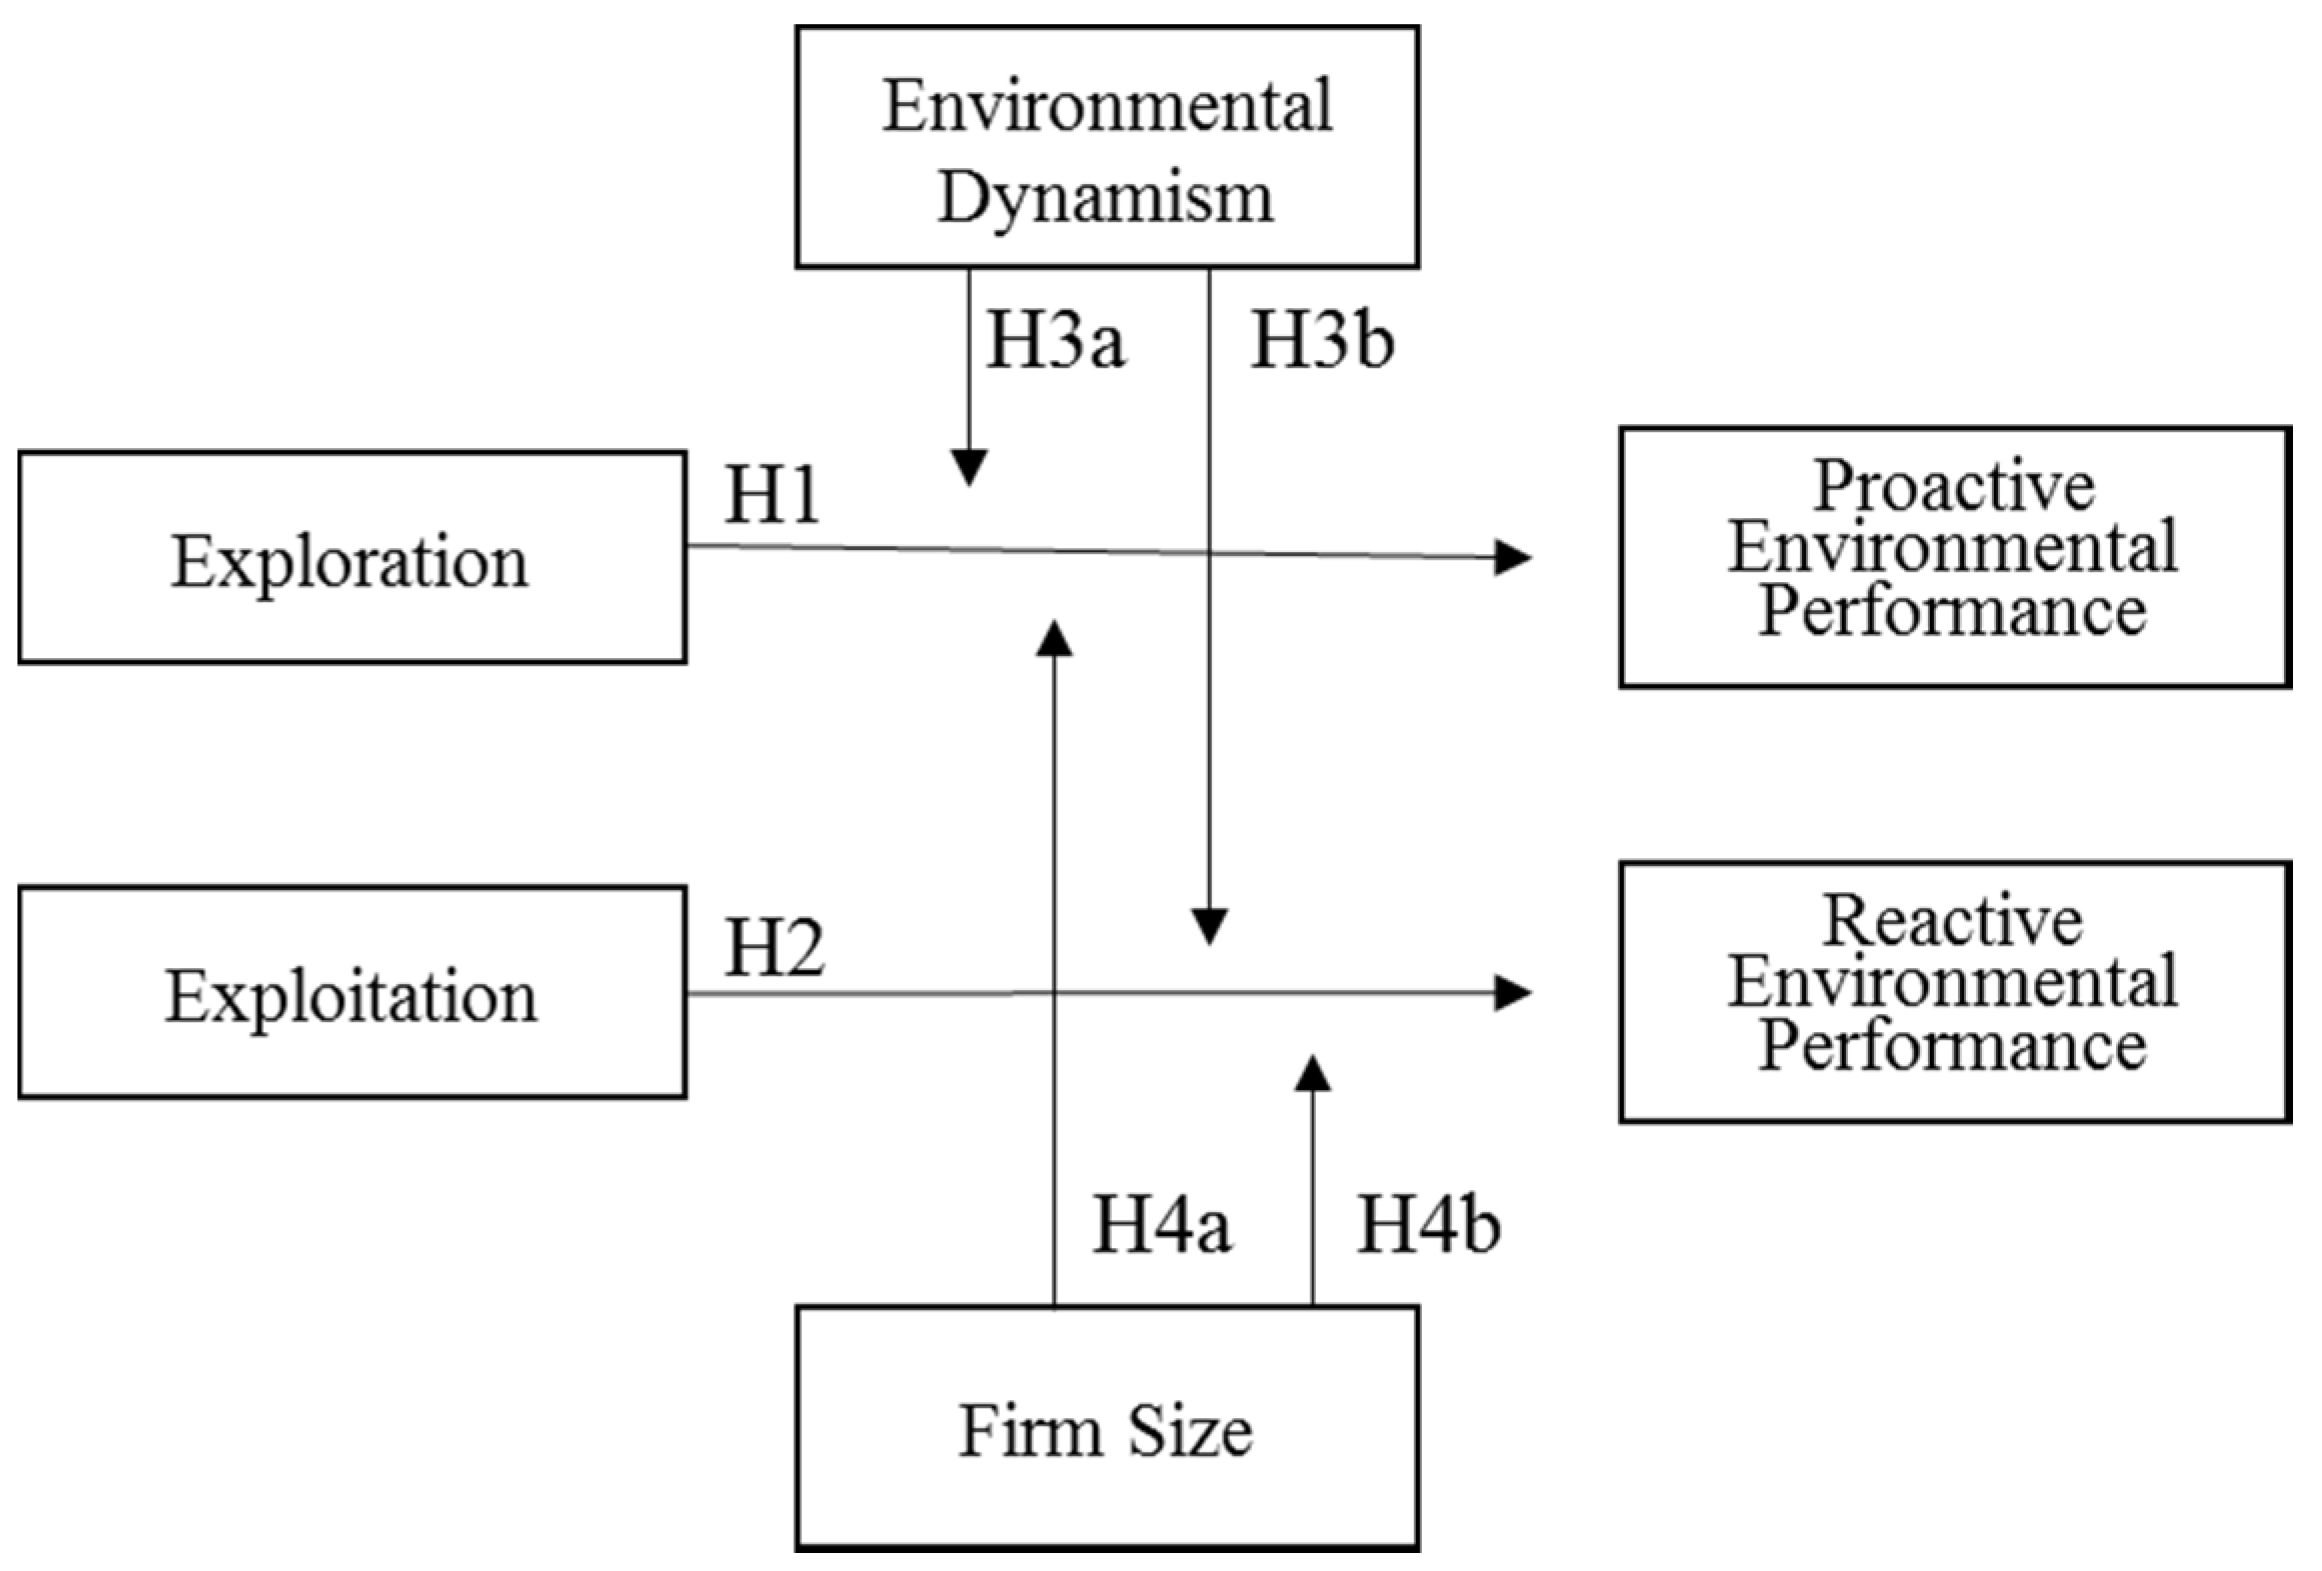
2. Background and Hypotheses

Researchers identify several drivers of environmental performance, including internal capabilities and external factors [3,9,10]. In this study, we focus on the innovation aspect because promoting the development of environmentally friendly products and installing pollution-reducing production facilities through innovative activities increase in importance. Taking a resource-based view, innovation is suggested as an intangible resource to strengthen firm environmental performance [9]. Growing concerns about environmental protection encourage firms to be innovative in using energy or materials efficiently [11].
Most studies on environmental innovation focus on the consequences of environmental innovation, which aim to improve or reinvent products and services to enhance environmental performance and raise economic performance [12]. Ample evidence suggests the positive relationship between environmental innovation and environmental performance. For instance, the adoption of new environmental technology can reduce firm pollution emissions and improve fuel efficiency [5,6,7]. Enhancements to manufacturing process and productivity also help firms improve environmental performance [13]. Although existing studies contribute to a better understanding of the role of environmental innovation in environmental performance, few studies draw on traditional innovation literature [14]. Although we admit that environmental pressures from diverse stakeholders force firms to incorporate environmental aspects into innovation, we also point out that the main purpose of innovation is to develop new products or services to satisfy consumers’ needs. Such innovation can lead to improved environmental performance [15]. For example, in 2006, Siemens developed a new computer tomograph (CT) scanner using the dual source system (two radiators and two detectors). Initially, the focus was given to image sharpness. However, Siemens found that the dual source system could enhance environmental performance significantly: halving the radiation used during a heart scan, 30% energy savings during an examination, and 80% reduction of lead used in the scanner [16]. Thus, we investigate the effect of firm innovative capabilities rather than environmentally innovative capabilities on environmental performance because traditional innovation literature can assist us in understanding the effect of innovation activities, which include environmental innovation.
In addition, previous studies suggest that environmental performance be categorized into two distinct types: proactive environmental performance beyond compliance-centered environmental activities and reactive environmental performance that conforms to current regulations. The two are entirely different constructs and need to be examined separately [17,18,19,20]. Thus, we delineate the relationship between two types of innovation and two types of environmental performance.

2.1. Exploration and Exploitation as an Antecedent of Environmental Performance

Researchers of environmental performance agree on the positive effect of innovation on environmental performance. Innovative firms that invest in R & D and attempt to adopt new manufacturing systems or processes tend to have higher environmental performance [21,22]. In addition, firms with proactive strategies toward environmental performance develop product and process innovation capabilities that go beyond the mere compliance of changing environmental needs [9]. However, definitions of innovation in the environmental innovation literature are relatively wide ranging, although innovation can be categorized into distinct types. In this study, we adopt the notion of exploration and exploitation introduced by March [23] to classify the type of innovation because the two concepts are mutually exclusive and comprehensive, and their effects on firm performance are significantly different.
The concept of environmental performance is a multi-dimensional construct that needs to be refined by categorization [24]. Proactive environmental performance aims to develop fundamental strategic capabilities to enhance environmental performance, including development of capabilities for environmentally friendly products and services and pollution prevention [20]. In contrast, reactive environmental performance is pursued when a firm cannot violate current regulations in terms of hazardous waste and chemical emissions. Thus, it is important to examine the complex effects of exploration and exploitation on proactive and reactive environmental performance separately.
In the innovation literature, exploration and exploitation represent the scope of the boundary from which a firm searches for knowledge [25,26,27,28]. Exploration denotes a knowledge search outside the firm, whereas exploitation represents a search for knowledge within the firm [27]. Similarly, some researchers define exploitation as minor changes to existing products and exploration as major changes to existing products or wholly newly developed products [29,30,31,32]. For example, Apple improved the interface system, battery life, and screen resolution of the iPhone product line. These improvements are categorized as exploitation. On the other hand, projects related to completely new products whose product line is out of the existing Apple product line (e.g., iPod in 2001, iPhone in 2007, iPad in 2010, Apple electric car project in 2016) are considered exploration. The distinctive characteristics of exploration and exploitation have different effects on environmental performance. We delineate the nature of exploration and exploitation and its relationship with the two types of environmental performance.
We compare exploration and exploitation in two dimensions: degree of readiness for environmental change and internal characteristics of a firm to implement exploration and exploitation. Although both exploration and exploitation are innovation activities, they have quite different goals. A firm tends to pursue exploration when it needs to escalate its ability to adapt to a changing environment, whereas a firm pursues exploitation to increase the stability of its daily operations [33,34,35]. Thus, the pursuit of exploration helps firms scan and respond to external environments. In contrast, seeking exploitation helps firms increase internal efficiency. The need toward environmental performance usually comes from external stakeholders rather than internal ones [36,37]. For example, governments play a key role in creating incentives or penalties to boost environmental performance by enacting laws [3]. Thus, a firm pursuing exploration is capable of working with changes associated with environmental issues with ease to achieve higher proactive environmental performance. In contrast, a firm that chooses exploitation is less likely to be sensitive to changes in environmental issues, while such choice enables a firm to be efficient in coping with current environmental issues.
Internal characteristics of a firm also differ when the firm implementing either exploration or exploitation. Exploitation is about refining existing knowledge, whereas exploration is about developing new knowledge [30,38,39]. A firm that emphasizes exploration tends to have a more flexible organizational structure, whereas one that stresses exploitation tends to have more organizational inertia [8]. Therefore, flexibility in organizational structure assists in reacting to changing envir7onmental issues appropriately. In contrast, a more stable organizational structure allows a firm to respond to current environmental issues. In summary, a firm proactively reacts to environmental change when it has a high level of exploration that is attributable to increased adaptability and organizational flexibility. In contrast, a firm can respond efficiently to current environmental issues when it has a high level of exploitation that is attributable to organizational stability.
Hypothesis 1:
Exploration is positively associated with proactive environmental performance.
Hypothesis 2:
Exploitation is positively associated with reactive environmental performance.

2.2. Moderating the Effects of a Firm’s External and Internal Characteristics

The relationship between the two types of innovation and two types of environmental performance are also moderated by external and internal firm characteristics. First, the positive effects of exploration on proactive environmental performance and the positive effects of exploitation on reactive environmental performance are intensified when technological dynamism is high. Dess and Beard [40] define technological dynamism as the extent of unpredictable changes in diverse environmental dimensions, such as customer preferences (market demand) and technologies. Firms with high levels of technological dynamism are exposed to higher pressures for technological development. The value of innovation (exploration and exploitation) increases under such condition because innovation endeavors enable firms to achieve competency against its competitors. Thus, the benefits of innovation activities (both exploration and exploitation) increase under such environments [41]. Therefore, the positive relationship between exploration (exploitation) and proactive (reactive) environmental performance intensifies under high levels of technological dynamism.
Hypothesis 3a:
Technological dynamism moderates the relationship between exploration and proactive environmental performance such that the positive effect of exploration on proactive environmental performance intensifies under high levels of technological dynamism.
Hypothesis 3b:
Technological dynamism moderates the relationship between exploitation and reactive environmental performance such that the positive effect of exploitation on reactive environmental performance intensifies under high levels of technological dynamism.
We also suggest that firm size (internal characteristic) has an important moderating effect on the exploration and exploitation on environmental performance. The literature on innovation finds that large firms are usually characterized as having more slack resources—defined as excess resources above those required for regular operations [42]. Slack resources enable firms to be actively involved in developing new technologies [43]. Furthermore, exploration tends to show higher failure rates than exploitation [8]. Slack resources can mitigate higher failure rates of exploration [44,45]. Large firms are also less likely to default [46] and are better able to endure long periods until exploration activities result in success. Therefore, firms can endure risky investments in exploration to increase the chances that the exploration succeeds. Large firms can also incorporate slack resources into their exploration activities and magnify the effects on proactive environmental performance. This rationale suggests that firm size positively moderates the relationship between exploration and proactive environmental performance.
However, firm size may affect the influence of exploration in different ways. The literature suggests that large firms are more bureaucratic and more formalized than are smaller organizations [47,48]; thus, they make standardized decisions [49]. Organizational bureaucracy promotes structural inertia [50,51] and a lack of firm flexibility in large firms. Structural inertia creates the decision-making tendency to produce institutionalized rules and regulations that reinforce established organizational routines [26]. Such structural inertia helps firms execute exploitation in a stable manner, which prohibits them from pursuing exploration. If this situation exists in firms, an exploration strategy employed by large firms will be deterred; thus, it is possible that firm size negatively moderates the relationship between exploration and environmental performance. We propose a set of competing hypotheses on the moderating effect of firm size on the relationship between exploration and proactive environmental performance.
Regarding exploitation, if a large firm pursues an exploitation strategy, its slack resources facilitate exploitation activities. Additionally, the structural inertia of large firms expedites exploitation. Therefore, we hypothesize that firm size positively moderates the relationship between exploitation and reactive environmental performance.
Hypothesis 4a:
Firm size positively (negatively) moderates the relationship between exploration and proactive environmental performance.
Hypothesis 4b:
Firm size positively moderates the relationship between exploitation and reactive environmental performance.
The hypotheses are illustrated in Figure 1 to conceptualize our predictions.

3. Methods

3.1. Data and Summary Statistics

Our initial sample is built on 18,122 firm-year observations from the KLD database between 1996 and 2006. KLD appraises U.S. publicly traded firms for social and environmental performance. Independent analysts conducted extensive research and generated the KLS ratings for KLD to use for investment decisions and advice [52]. Practitioners and academics from diverse fields use this database extensively [53,54,55].
We combined KLD data with Standard and Poor’s Compustat data to obtain financial data, such as R&D expenditure, sales volume, and debt ratio. KLD data are also combined with patent data from the National Bureau of Economic Research (NBER) to obtain exploration and exploitation data. We reduce the sample to 2060 firm-year observations during a 12-year period. The sample, which covers various industries, can minimize potential industry biases related to the manufacturing, and service industries.
Descriptive statistics of variables and their correlations are reported in Table 1. Interestingly, we find that proactive environmental performance is positively correlated (37%) with reactive environmental performance. This result implies that firms which pursue reactive environmental performance may have incentives to promote proactive environmental performance. R & D expenditures are positively correlated with proactive and reactive environmental performance. We also find that exploration is highly and positively correlated (78%) with exploitation. Thus, we calculate Variance inflation factors (VIF) of all regression models to check for multicollinearity (VIF is not available in the random effect model; thus, the VIF values were obtained using ordinary least square (OLS) regression model). The range of VIF is between 2.72 and 7.13, which is below the typical cut-off of 10.
Demographics of the key variables are provided in Table 2. Most of the firms are in the manufacturing (82.7%) and service (13.4%) industries. Proactive environmental performance ranges from zero to four and reactive environmental performance ranges from zero to six. Firms reporting at least one proactive (reactive) environmental performance account for 24.55% (21.08%), which is similar to previous studies (e.g., Walls et al. [24]).

3.2. Research Design

We employ a random effects panel regression model to control unobserved firm-specific heterogeneity and to deal with a possible autocorrelation problem. A Poisson regression is usually used when the dependent variable represents count data without over dispersion [56,57]. However, one of our main interests was to examine the interaction effects between types of innovation (exploration and exploitation) and external and internal firm characteristics. Analyzing interaction effects in a non-linear model, such as the Poisson model, is complicated to estimate and interpret. Thus, we employ a random effects panel regression model following Walls et al. [24] and transform our dependent variables by taking the square root to make them usable in the random effects panel regression model. The random effects panel data model has advantages over the fixed effects panel data model because it allows the firm specific factor to vary over time.
Dependent variable: Environmental performance (Environmental strengths and Environmental concerns). Firms are evaluated in several categories of environmental strengths to measure proactive environmental performance and concerns to measure reactive environmental performance [17]. The values of the strength and concern items are summed to measure proactive environmental performance (Environmental strengths) and reactive environmental performance (Environmental concerns), respectively [24]. We adopt the approach of Walls et al. [24], which differs from previous studies that combine environmental strengths and concerns into a single measure [58,59]. The combined measure counterbalances strengths and concerns, which leads to non-significant results. In addition, the KLD measures of strengths and concerns are distinct in terms of theoretical background [18,19]. Environmental strengths refer to the strategic capabilities of a firm to improve its environmental performance, including beneficial products/services, pollution prevention, recycling, and clean energy [20]. In contrast, environmental concerns capture the level of pollution of a firm [17]. Our focus is on investigating the effects of exploration and exploitation on the two different types of environmental performance.
Independent variables: Exploration and Exploitation. Patent data is extensively used to measure exploration and exploitation [27,60,61,62]. The National Bureau of Economic Research (NBER) provides a database of information such as patent year, characteristics of citations, and other details. We measure the exploration of each firm for each year using the count of prior citations outside the accumulated focal domains in patents applications of a firm, whereas exploitation uses the count of prior citations within the accumulated focal domain of a firm [62]. Following previous studies [27,57], we use the three-digit primary patent class provided by the U.S. Patent Office to define a firm technology domain. The two independent variables are logged to avoid skewing the data distribution. We do not place a lag between the dependent and independent variables. We use patent data for when the patent is granted, not when it is applied. Thus, patents are regarded as intermediate outcomes that would result in firm performance. The activities of those patents already influence firm performance.
Moderating Variables. We include the Technological dynamism moderator as an external firm characteristic. We create this variable using industry R & D intensity, and measured it by taking the logarithm of the industry total R & D expenditures divided by total sales following prior studies [41,63,64]. We create the Firm size variable by logging the total assets as the second moderator, which also follows prior studies [65,66].
Control Variables. We include several variables to control for internal firm characteristics following previous studies on environmental performance [24]. First, we control for debt financing capability (Leverage) to pursue exploration and exploitation by introducing firm leverage into the model measured using the ratio of long-term debt to total assets [67]. Second, we include sales growth (Sales growth) as a control variable because previous studies report that high-growth firms tend to increase the portion of exploration [66]. Last, we include R & D expenditures (R & D) as a control variable for overall investment in innovation following Padgett and Galan [68] and Yu and Rhee [69]. We also include industry dummies (ΣIND) and year dummies (ΣYEAR) to control for industry and year fixed effects. Using these variables, we estimated the following regression equations with αit as an unknown time varying firm specific factor. The detailed definitions of variables are provided in Appendix.
We used the following equation to test Hypothesis 1:
Environmental strengthsit= β0 + β1 Explorationit + β2 Exploitationit + β3 Technological dynamismit
+ β4 Firm sizeit + β5 Leverageit + β6 Sales growthit + β7 R & Dit
+ ΣIND + ΣYEAR + αit + εit.
To test Hypothesis 2, we estimated the following regression equation:
Environmental concernsit= β0 + β1 Explorationit + β2 Exploitationit + β3 Technological dynamismit
+ β4 Firm sizeit + β5 Leverageit + β6 Sales growthit + β7 R & Dit
+ ΣIND + ΣYEAR + αit + εit.
To test Hypothesis 3a, we estimated the following regression equation with interaction terms between innovation type variables (Exploration and Exploitation) and Technological dynamism:
Environmental strengthsit= β0 + β1 Explorationit + β2 Exploitationit + β3 Technological dynamismit
+ β4 Firm sizeit + β5 Explorationit × Technological dynamismit
+ β6 Exploitationit × Technological dynamismit + β7 Leverageit
+ β8 Sales growthit + β9 R & Dit + ΣIND + ΣYEAR + αit + εit.
To test Hypothesis 3b, we estimated the following regression equation with interaction terms between innovation type variables (Exploration and Exploitation) and technological dynamism (R & D intensity):
Environmental concernsit= β0 + β1 Explorationit + β2 Exploitationit + β3 Technological dynamismit
+ β4 Firm sizeit + β5 Explorationit × Technological dynamismit
+ β6 Exploitationit × Technological dynamismit + β7 Leverageit
+ β8 Sales growthit + β9 R & Dit + ΣIND + ΣYEAR + αit + εit.
To test Hypothesis 4a, we estimated the following regression equation with interaction terms between innovation type variables (Exploration and Exploitation) and firm size (Firm Size):
Environmental strengthsit= β0 + β1 Explorationit + β2 Exploitationit + β3 Technological dynamismit
+ β4 Firm sizeit + β5 Explorationit × Firm sizeit
+ β6 Exploitationit × Firm sizeit + β7 Leverageit + β8 Sales growthit
+ β9 R & Dit + ΣIND + ΣYEAR + αit + εit.
To test Hypothesis 4b, we estimated the following regression equation with interaction terms between innovation type variables (Exploration and Exploitation) and firm size (Firm Size):
Environmental concernsit= β0 + β1 Explorationit + β2 Exploitationit + β3 Technological dynamismit
+ β4 Firm sizeit + β5 Explorationit × Firm sizeit
+ β6 Exploitationit × Firm sizeit + β7 Leverageit + β8 Sales growthit
+ β9 R & Dit + ΣIND + ΣYEAR + αit + εit.

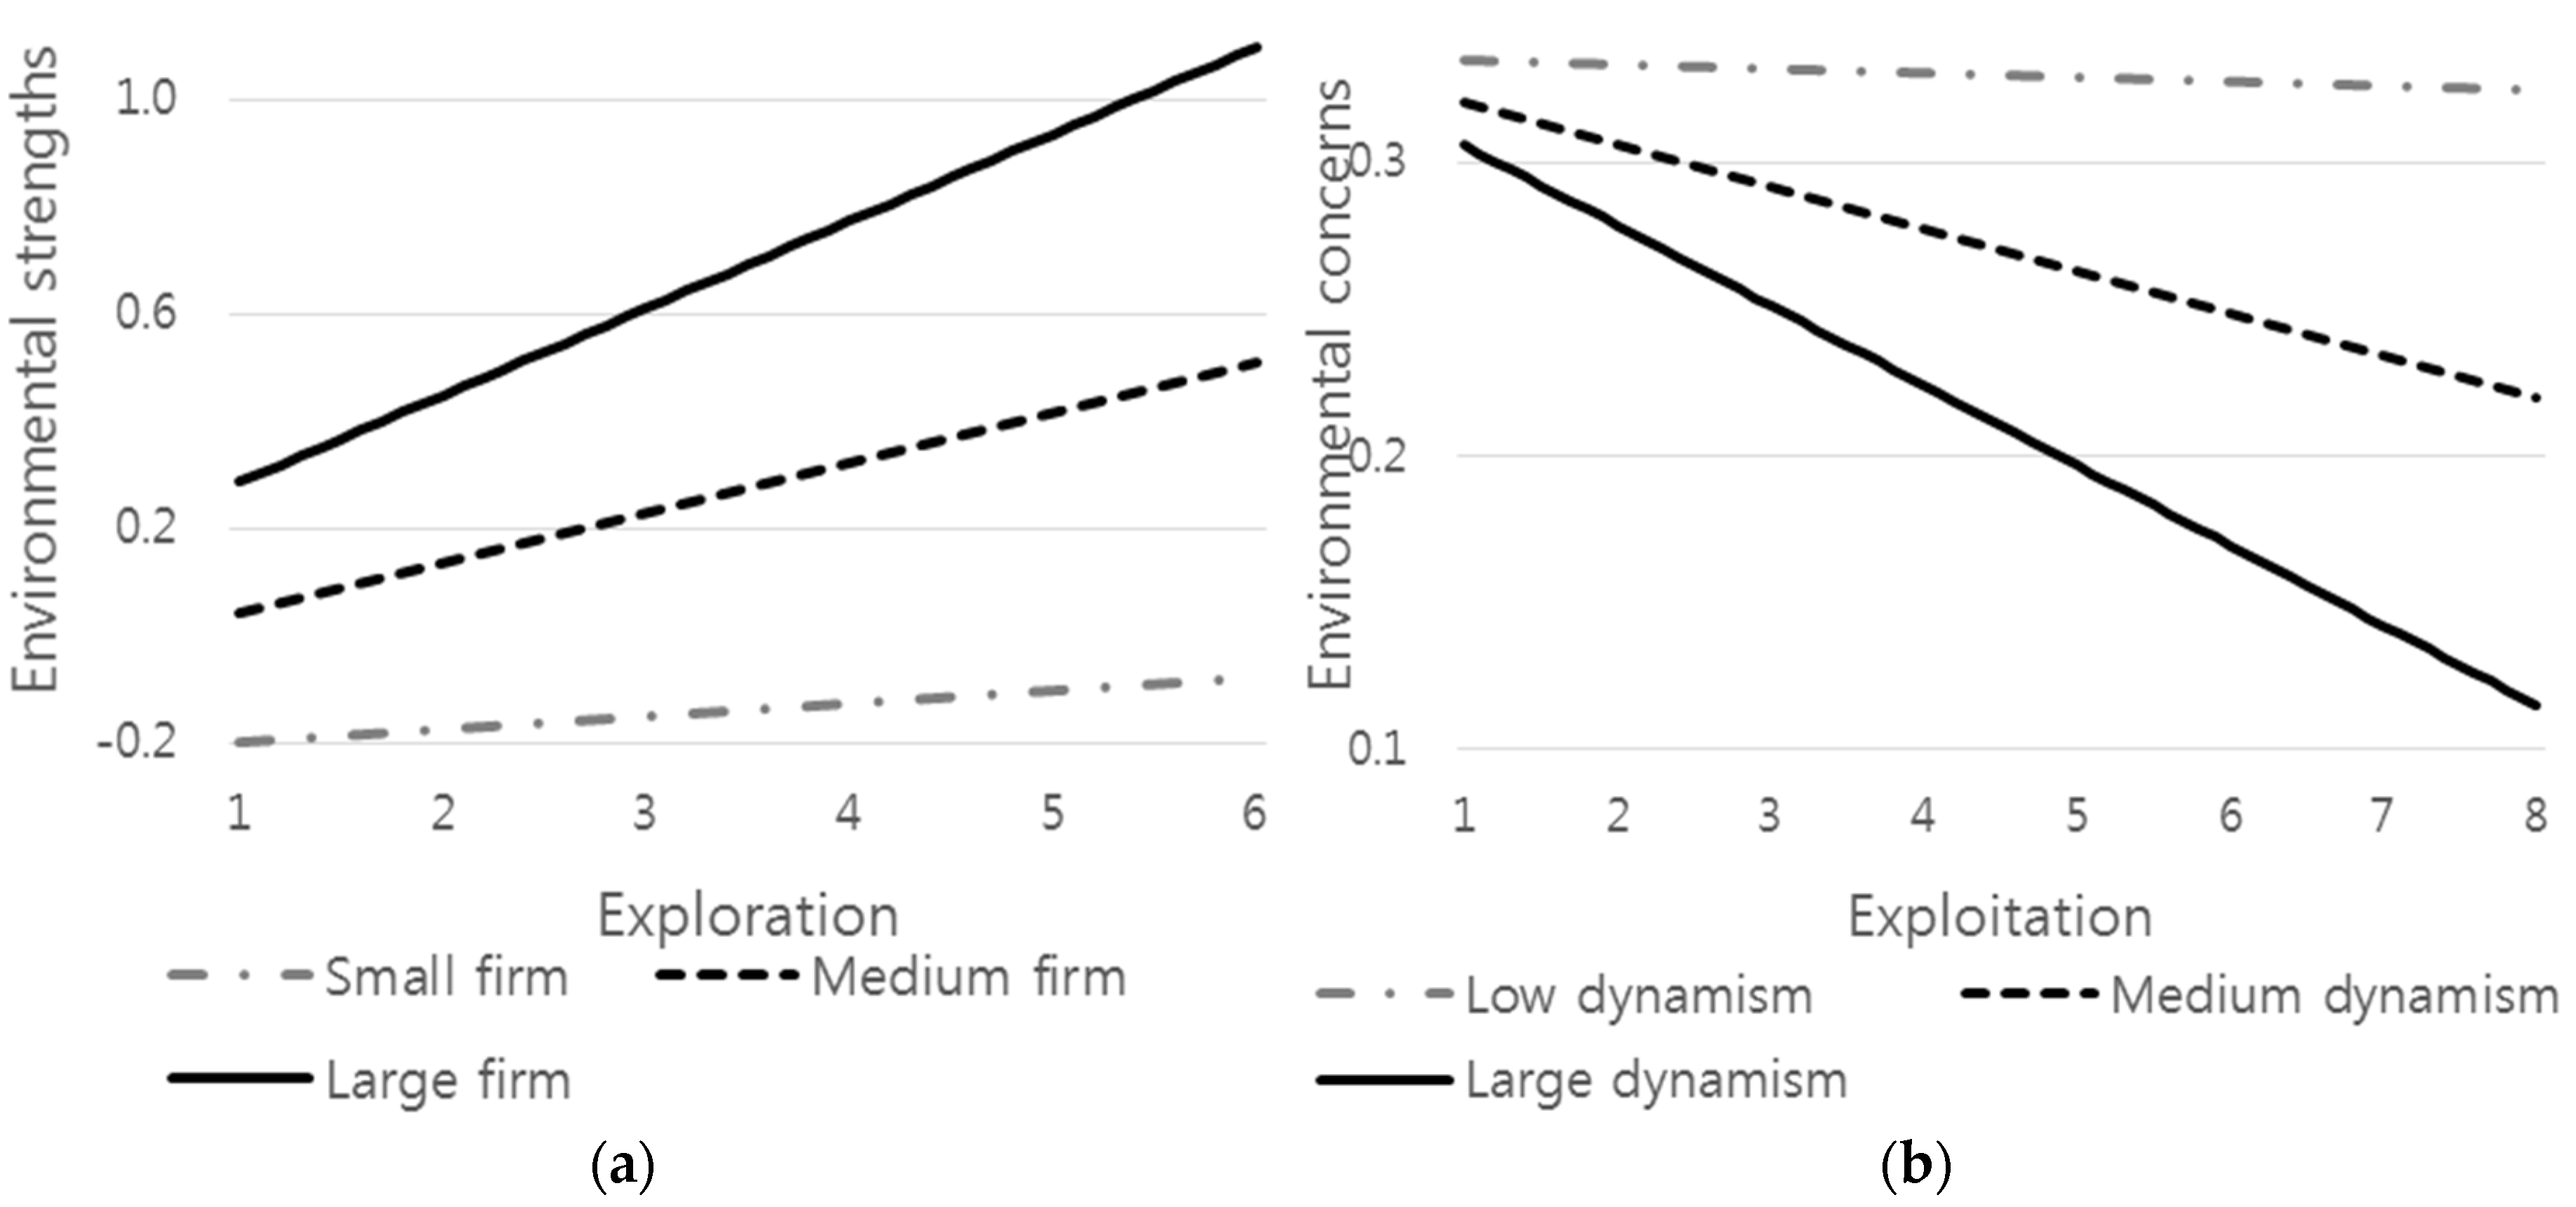
4. Results of the Multivariate Analysis

Table 3 shows the multivariate regression results of proactive environmental performance and reactive environmental performance. Models 1 through 4 show the effects of exploration and exploitation on proactive environmental performance. Models 5 through 8 display the effects on reactive environmental performance. Model 1 estimates the coefficients of the control and moderating variables only. This estimation includes variables for internal (Firm size) and external (Technological dynamism) firm characteristics. The coefficient of Firm Size is positive (β = 0.062) and statistically significant at the 1% level, which implies that the stability and plentiful resources of large firms help increase proactive environmental performance. In addition, the coefficient for Technological dynamism is negative and statistically significant (β = −2.723, p < 0.01), which implies that high technological dynamism is correlated with low proactive environmental performance. Interestingly, Firm size has a positive effect on Reactive environmental performance (β = 0.158, p < 0.01), whereas Technological dynamism has a negative effect (β = −3.075, p < 0.01), as shown in Model 5.
We examine the effects of exploration and exploitation on proactive and reactive environmental performance in Models 2 and 6, respectively. Model 2 confirms Hypothesis 1. Exploration has a positive effect on Proactive environmental performance (β = 0.020, p < 0.05). We also find that Exploitation has a negative effect on Proactive environmental performance (β = −0.021, p < 0.05). Model 6 shows that Exploitation has a significantly negative effect on Reactive environmental performance (β = −0.017, p < 0.05), which means exploitation has a positive effect on reactive environment performance. These results show that exploration is associated with an increase in proactive environmental performance, whereas exploitation is associated with an increase in reactive environmental performance, which confirms Hypothesis 2.
We further investigate the effects of exploration and exploitation on the two types of environmental performance in association with internal and external firm characteristics. We estimate the interaction effects of Exploration with Technological dynamism in Model 3 and find no significant interaction effects on Proactive environmental performance. However, the interaction effect of Exploitation with Technological dynamism is significantly negative (β = −0.956, p < 0.01), as shown in Model 7. This result implies that the concern-reducing effects of exploitation primarily arise from industries with high technological dynamism, and exploitation itself reduces reactive environmental concerns when the interaction effect is controlled. These results imply that exploration supports proactive environmental performance without regard to technological dynamism, whereas exploitation works to increase reactive environmental performance only when technological dynamism is high. Thus, Hypothesis 3a is not supported, whereas Hypothesis 3b is supported. From these results, we conjecture that under high levels of technological dynamism, firms need to concentrate their resources on core technologies to manage dynamic changes in the environment. Thus, firms can focus on reactive environmental performance, which requires fewer resources.
Models 4 and 8 examine the interaction effects of exploration and exploitation with firm size on proactive and reactive environmental performance, respectively. The strength-increasing effects of exploration are partly concentrated on large firms. The coefficient of the interaction between Exploration and Firm size is significantly positive (β = 0.012, p < 0.1). However, the interaction effect between Exploitation and Firm size on Environmental concerns is not statistically significant. These results support the view that large firms have good resources to promote strategic environmental visions in association with Hypothesis 4a. Therefore, the results only support the positive moderating effect of firm size on the effect of exploration regarding proactive environmental performance. The coefficient of the interaction between Exploration and Firm size is negative but insignificant; therefore, Hypothesis 4b is not supported.
Figure 2a illustrates the moderating effect of firm size on the relationship between exploration and proactive environmental performance: The positive effect of exploration on proactive environmental performance intensifies as firm size increases. Figure 2b illustrates the relationship between exploitation and reactive environmental performance under three different levels of technological dynamism. The positive effect of exploitation on reactive environmental performance strengthens as the level of dynamism increases, which shows the moderating effect of technological dynamism on the relationship between exploitation and reactive environmental performance.

5. Conclusions

We aim to discover the effects of exploration and exploitation on the two types of environmental performance by adopting the traditional innovation literature perspective beyond the environmental innovation literature perspective. Previous studies on environmental performance help us understand drivers or consequences of environmental performance, including environmental innovation and firm financial performance. However, few studies rely on existing innovation literature, although traditional innovation literature provides a more comprehensive understanding of drivers of environmental performance [14]. This study draws its implications from existing innovation literature to understand the drivers of environmental performance by introducing the concepts of exploration and exploitation.
We report that exploration is positively associated with proactive environmental performance measured by environmental strengths (H1), whereas exploitation is positively related to reactive environmental performance measured by environmental concerns (H2). These results are in line with the argument that the enhancement of current technology to comply with current regulations is associated with reactive environmental performance. Conversely, exploration, which includes much broader strategic activities, is associated with proactive environmental performance [24]. We also report moderating effects of internal and external firm characteristics. Technological dynamism, an external characteristic, positively moderates the relationship between exploitation and reactive environmental performance (H3b). Firm size, an internal characteristic, positively moderates the relationship between exploration and proactive environmental performance (H4a).
We contribute to the current literature on environmental performance in two ways. First, considering innovation literature (beyond environmental innovation literature) enhances our understanding of environmental performance. The main purpose of firm innovation is to develop new products and services to meet customer demands and to manage changes in the environment, including environmental protection [14]. To understand the implication of innovative capabilities on environmental performance, we propose the concepts of exploration and exploitation and investigate the effects of the two. Second, we seek to find the conditions in which such effects are intensified or weakened by considering internal and external firm characteristics. Specifically, the positive effect of exploration on proactive environmental performance strengthens when a firm is large. In contrast, the positive effect of exploitation on reactive environmental performance intensifies when technological dynamism is high. The findings on the moderating effects of exploration and exploitation open an agenda for other moderating conditions.
Our findings also have limitations. First, although the patent dataset is extensively used to measure exploration and exploitation, it is limited [27,60,61]. Not all firms hold patents to protect their knowledge or technology [70]. Therefore, the results may not be generalizable. Second, our sample is limited to relatively large firms in the United States given the availability of data on environmental performance. Large firms are more likely to be evaluated more highly on both good and bad environmental performance scores because of visibility to stakeholders [24]. Small- and medium-sized firms may show different visibility and have different score tendencies. We recommend using a more comprehensive measure for environmental performance to generalize these findings.

Acknowledgments

Hojin Jung’s work was supported by the Hongik University new faculty research support fund. Kyoung-Min Kwon’s work was supported by 2014 Hongik University Research Fund.

Author Contributions

The authors have contributed equally in the research design and development, the data analysis and the writing of the paper. The authors have read and approved the final manuscript.

Conflicts of Interest

The authors declare no conflict of interest.

Appendix

Table A1. Description of Variables.
NoVariableMeasurement
1Environmental strengthsSum of the values of four items: 1 if firm activity has the following strengths: beneficial products and service, pollution prevention, recycling, clean energy. Otherwise, 0.
2Environmental concernsSum of the values of six items: 1 if firm activity addresses the following concerns: hazardous waste, regulation problem, Ozone depleting chemicals, substantial emissions, agriculture chemicals, climate change. Otherwise, 0.
3ExplorationThe count of prior citations outside the accumulated focal firm domains in patent applications.
4ExploitationThe count of prior citations within the accumulated focal firm domain.
5Technological dynamismThe logarithm of industry total R & D expenditures divided by industry total sales.
6Firm sizeThe logarithm of total assets (in millions of dollars).
7LeverageThe ratio of long-term debt to total assets.
8Sales growth(Sale t − Salet−1)/Salet1
9R & DR & D expenditures (in millions of dollars).

References

  1. Buysse, K.; Verbeke, A. Proactive environmental strategies: A stakeholder management perspective. Strateg. Manag. J. 2003, 24, 453–470. [Google Scholar] [CrossRef]
  2. Kassinis, G.; Vafeas, N. Stakeholder pressures and environmental performance. Acad. Manag. J. 2006, 49, 145–159. [Google Scholar] [CrossRef]
  3. Hart, S.L. A natural-resource-based view of the firm. Acad. Manag. Rev. 1995, 20, 986–1014. [Google Scholar]
  4. Berrone, P.; Gomez-Mejia, L.R. Environmental performance and executive compensation: An integrated agency-institutional perspective. Acad. Manag. J. 2009, 52, 103–126. [Google Scholar] [CrossRef]
  5. Carrión-Flores, C.E.; Innes, R. Environmental innovation and environmental performance. J. Environ. Econ. Manag. 2010, 59, 27–42. [Google Scholar] [CrossRef]
  6. Dean, T.J.; Brown, R.L. Pollution regulation as a barrier to new firm entry: Initial evidence and implications for future-research. Acad. Manag. J. 1995, 38, 288–303. [Google Scholar] [CrossRef]
  7. Weng, H.-H.; Chen, J.-S.; Chen, P.-C. Effects of green innovation on environmental and corporate performance: A stakeholder perspective. Sustainability 2015, 7, 4997–5026. [Google Scholar] [CrossRef]
  8. Lavie, D.; Stettner, U.; Tushman, M.L. Exploration and exploitation within and across organizations. Acad. Manag. Ann. 2010, 4, 109–155. [Google Scholar] [CrossRef]
  9. Russo, M.V.; Fouts, P.A. A resource-based perspective on corporate environmental performance and profitability. Acad. Manag. J. 1997, 40, 534–559. [Google Scholar] [CrossRef]
  10. Sharfman, M.P.; Shaft, T.M.; Tihanyi, L. A model of the global and institutional antecedents of high-level corporate environmental performance. Bus. Soc. 2004, 43, 6–36. [Google Scholar] [CrossRef]
  11. Shrivastava, P. Ecocentric management for a risk society. Acad. Manag. Rev. 1995, 20, 118–137. [Google Scholar]
  12. Bos-Brouwers, H.E.J. Corporate sustainability and innovation in smes: Evidence of themes and activities in practice. Bus. Strateg. Environ. 2010, 19, 417–435. [Google Scholar] [CrossRef]
  13. Montabon, F.; Sroufe, R.; Narasimhan, R. An examination of corporate reporting, environmental management practices and firm performance. J. Oper. Manag. 2007, 25, 998–1014. [Google Scholar] [CrossRef]
  14. Berchicci, L.; Bodewes, W. Bridging environmental issues with new product development. Bus. Strateg. Environ. 2005, 14, 272–285. [Google Scholar] [CrossRef]
  15. Krishnan, V.; Ulrich, K.T. Product development decisions: A review of the literature. Manag. Sci. 2001, 47, 1–21. [Google Scholar] [CrossRef]
  16. Loew, T.; Clausen, J.; Hall, M.; Loft, L.; Braun, S. Case Studies on CSR and Innovation: Company Cases from Germany and the USA; Institute 4 Sustainability: Berlin, Germany, 2009. [Google Scholar]
  17. Chatterji, A.K.; Levine, D.I.; Toffel, M.W. How well do social ratings actually measure corporate social responsibility? J. Econ. Manag. Strateg. 2009, 18, 125–169. [Google Scholar] [CrossRef]
  18. Mattingly, J.E.; Berman, S.L. Measurement of corporate social action. Bus. Soc. 2006, 45, 20–46. [Google Scholar] [CrossRef]
  19. Strike, V.M.; Gao, J.J.; Bansal, P. Being good while being bad: Social responsibility and the international diversification of us firms. J. Int. Bus. Stud. 2006, 37, 850–862. [Google Scholar] [CrossRef]
  20. Walls, J.L.; Phan, P.H.; Berrone, P. Measuring environmental strategy: Construct development, reliability, and validity. Bus. Soc. 2011, 50, 71–115. [Google Scholar] [CrossRef]
  21. Florida, R.; Davison, D. Gaining from green management: Environmental management systems inside and outside the factory. Calif. Manag. Rev. 2001, 43, 64–84. [Google Scholar] [CrossRef]
  22. Mazzanti, M.; Zoboli, R. Economic instruments and induced innovation: The european policies on end-of-life vehicles. Ecol. Econ. 2006, 58, 318–337. [Google Scholar] [CrossRef]
  23. March, J.G. Exploration and exploitation in organizational learning. Organ. Sci. 1991, 2, 71–87. [Google Scholar] [CrossRef]
  24. Walls, J.L.; Berrone, P.; Phan, P.H. Corporate governance and environmental performance: Is there really a link? Strateg. Manag. J. 2012, 33, 885–913. [Google Scholar] [CrossRef]
  25. Cohen, W.M.; Levinthal, D.A. Innovation and learning: The two faces of R & D. Econ. J. 1989, 569–596. [Google Scholar]
  26. Nelson, R.R.; Winter, S.G. The schumpeterian tradeoff revisited. Am. Econ. Rev. 1982, 114–132. [Google Scholar]
  27. Rosenkopf, L.; Nerkar, A. Beyond local search: Boundary-spanning, exploration, and impact in the optical disk industry. Strateg. Manag. J. 2001, 22, 287–306. [Google Scholar] [CrossRef]
  28. Stuart, T.E.; Podolny, J.M. Local search and the evolution of technological capabilities. Strateg. Manag. J. 1996, 17, 21–38. [Google Scholar] [CrossRef]
  29. Atuahene-Gima, K. Resolving the capability-rigidity paradox in new product innovation. J. Mark. 2005, 69, 61–83. [Google Scholar] [CrossRef]
  30. Benner, M.J.; Tushman, M.L. Exploitation, exploration, and process management: The productivity dilemma revisited. Acad. Manag. Rev. 2003, 28, 238–256. [Google Scholar]
  31. Danneels, E. The dynamics of product innovation and firm competences. Strateg. Manag. J. 2002, 23, 1095–1121. [Google Scholar] [CrossRef]
  32. Holmqvist, M. Experiential learning processes of exploitation and exploration within and between organizations: An empirical study of product development. Organ. Sci. 2004, 15, 70–81. [Google Scholar] [CrossRef]
  33. Brown, S.L.; Eisenhardt, K.M. Product development—Past research, present findings, and future-directions. Acad. Manag. Rev. 1995, 20, 343–378. [Google Scholar]
  34. Probst, G.; Raisch, S. Organizational crisis: The logic of failure. Acad. Manag. Executive 2005, 19, 90–105. [Google Scholar] [CrossRef]
  35. Volberda, H.W. Toward the flexible form: How to remain vital in hypercompetitive environments. Organ. Sci. 1996, 7, 359–374. [Google Scholar] [CrossRef]
  36. Ambec, S.; Lanoie, P. Does it pay to be green? A systematic overview. Acad. Manag. Perspect. 2008, 22, 45–62. [Google Scholar]
  37. Banerjee, S.B.; Iyer, E.S.; Kashyap, R.K. Corporate environmentalism: Antecedents and influence of industry type. J. Mark. 2003, 67, 106–122. [Google Scholar] [CrossRef]
  38. Gupta, A.K.; Smith, K.G.; Shalley, C.E. The interplay between exploration and exploitation. Acad. Manag. J. 2006, 49, 693–706. [Google Scholar] [CrossRef]
  39. He, Z.L.; Wong, P.K. Exploration vs. Exploitation: An empirical test of the ambidexterity hypothesis. Organ. Sci. 2004, 15, 481–494. [Google Scholar] [CrossRef]
  40. Dess, G.G.; Beard, D.W. Dimensions of organizational task environments. Adm. Sci. Q. 1984, 29, 52–73. [Google Scholar] [CrossRef]
  41. Baysinger, B.; Hoskisson, R.E. Diversification strategy and R & D intensity in multiproduct firms. Acad. Manag. J. 1989, 32, 310–332. [Google Scholar]
  42. Nohria, N.; Gulati, R. Is slack good or bad for innovation? Acad. Manag. J. 1996, 39, 1245–1264. [Google Scholar] [CrossRef]
  43. Cyert, R.M.; March, J.G. A Behavioral Theory of the Firm; Elsevier B.V.: Englewood Cliffs, NJ, USA, 1963. [Google Scholar]
  44. Bourgeois, L.J., III. On the measurement of organizational slack. Acad. Manag. Rev. 1981, 6, 29–39. [Google Scholar]
  45. Thompson, J.D. Organizations in Action; McGraw-Hill: New York, NY, USA, 1967. [Google Scholar]
  46. Vassalou, M.; Xing, Y. Default risk in equity returns. J. Financ. 2004, 59, 831–868. [Google Scholar] [CrossRef]
  47. Child, J. Organizational structure, environment and performance: The role of strategic choice. Sociology 1972, 6, 1–22. [Google Scholar] [CrossRef]
  48. Weber, M. Economy and Society: An Outline of Interpretive Sociology; University of California Press: Oakland, CA, USA, 1978. [Google Scholar]
  49. Baker, D.D.; Cullen, J.B. Administrative reorganization and configurational context: The contingent effects of age, size, and change in size. Acad. Manag. J. 1993, 36, 1251–1277. [Google Scholar] [CrossRef]
  50. Hannan, M.T.; Freeman, J. The population ecology of organizations. Am. J. Sociol. 1977, 82, 929–964. [Google Scholar] [CrossRef]
  51. Hannan, M.T.; Freeman, J. Structural inertia and organizational change. Am. Sociol. Rev. 1984, 49, 149–164. [Google Scholar] [CrossRef]
  52. Harrison, J.S.; Freeman, R.E. Stakeholders, social responsibility, and performance: Empirical evidence and theoretical perspectives. Acad. Manag. J. 1999, 42, 479–485. [Google Scholar] [CrossRef]
  53. Agle, B.R.; Mitchell, R.K.; Sonnenfeld, J.A. Who matters to ceos? An investigation of stakeholder attributes and salience, corporate performance, and ceo values. Acad. Manag. J. 1999, 42, 507–525. [Google Scholar] [CrossRef]
  54. Cho, C.H.; Patten, D.M. The role of environmental disclosures as tools of legitimacy: A research note. Account. Organ.Soc. 2007, 32, 639–647. [Google Scholar] [CrossRef]
  55. Mahoney, L.; Roberts, R.W. Corporate social performance, financial performance and institutional ownership in canadian firms. Account. Forum 2007, 31, 233–253. [Google Scholar] [CrossRef]
  56. Cameron, A.C.; Trivedi, P.K. Regression Analysis of Count Data; Cambridge University Press: New York, NY, USA, 1998. [Google Scholar]
  57. Jaffe, A.B.; Trajtenberg, M.; Henderson, R. Geographic localization of knowledge spillovers as evidenced by patent citations. Q. J. Econ. 1993, 108, 577–598. [Google Scholar] [CrossRef]
  58. Berman, S.L.; Wicks, A.C.; Kotha, S.; Jones, T.M. Does stakeholder orientation matter? The relationship between stakeholder management models and firm financial performance. Acad. Manag. J. 1999, 42, 488–506. [Google Scholar] [CrossRef]
  59. Waddock, S.A.; Graves, S.B. The corporate social performance-financial performance link. Strateg. Manag. J. 1997, 18, 303–319. [Google Scholar] [CrossRef]
  60. Ahuja, G.; Katila, R. Technological acquisitions and the innovation performance of acquiring firms: A longitudinal study. Strateg. Manag. J. 2001, 22, 197–220. [Google Scholar] [CrossRef]
  61. Quintana-García, C.; Benavides-Velasco, C.A. Innovative competence, exploration and exploitation: The influence of technological diversification. Res. Policy 2008, 37, 492–507. [Google Scholar] [CrossRef]
  62. Wang, H.; Li, J. Untangling the effects of overexploration and overexploitation on organizational performance: The moderating role of environmental dynamism. J. Manag. 2008, 34, 925–951. [Google Scholar]
  63. Audretsch, D.B.; Feldman, M.P. R & D spillovers and the geography of innovation and production. Am. Econ. Rev. 1996, 630–640. [Google Scholar]
  64. Ito, K.; Pucik, V. R & D spending, domestic competition, and export performance of Japanese manufacturing firms. Strateg. Manag. J. 1993, 14, 61–75. [Google Scholar]
  65. McWilliams, A.; Siegel, D. Corporate social responsibility and financial performance: Correlation or misspecification? Strateg. Manag. J. 2000, 21, 603–609. [Google Scholar] [CrossRef]
  66. King, A.; Lenox, M. Exploring the locus of profitable pollution reduction. Manag. Sci. 2002, 48, 289–299. [Google Scholar] [CrossRef]
  67. Cheng, S. R & D expenditures and ceo compensation. Account. Rev. 2004, 79, 305–328. [Google Scholar]
  68. Padgett, R.; Galan, J. The effect of R & D intensity on corporate social responsibility. J. Bus. Ethics 2010, 93, 407–418. [Google Scholar]
  69. Yu, G.; Rhee, S.-Y. Effect of R & D collaboration with research organizations on innovation: The mediation effect of environmental performance. Sustainability 2015, 7, 11998–12016. [Google Scholar]
  70. Gittelman, M. A note on the value of patents as indicators of innovation: Implications for management research. Acad. Manag. Perspect. 2008, 22, 21–27. [Google Scholar] [CrossRef]
Figure 1. Relations predicted.
Sustainability 08 00200 g001
Figure 2. Interaction graph (a) Relationship between exploration (Exploration) and proactive environmental performance (Environmental strengths) and the moderating effect of firm size (Firm Size); (b) relationship between exploitation (Exploitation) and reactive environmental performance (Environmental concerns) and the moderating effect of technological dynamism (Technological dynamism).
Sustainability 08 00200 g002
Table 1. Means, standard deviations, and correlations.
No.VariableMeanS.D.123456789
1Proactive environmental performance0.280.501
2Reactive environmental performance0.270.550.37 *1
3Exploration3.531.550.14 *0.12 *1
4Exploitation4.512.110.09 *0.05 *0.78 *1
5Technological dynamism0.060.03−0.17 *−0.3 *0.12 *0.2 *1
6Firm size7.851.560.36 *0.48 *0.28 *0.26 *−0.3 *1
7Leverage0.240.110.11 *0.11 *0.08 *0.03 *−0.12 *0.17 *1
8Sales growth0.120.24−0.08 *−0.08 *−0.08 *−0.11 *0.03−0.09 *−0.09 *1
9R & D4.831.500.31 *0.36 *0.47 *0.5 *0.14 *0.8 *0.2 *−0.11 *1
* p < 0.05, N = 2060.
Table 2. Demographics of the sample firms.
VariableCategoryNRate (%)
IndustryAgriculture, Forestry, and Fishing50.2%
Mining432.1%
Manufacturing171482.7%
Transportation, Communications, Electric, Gas and Sanitary services90.4%
Wholesale Trade70.3%
Retail Trade90.4%
Finance, Insurance, and Real Estate40.2%
Services27813.4%
Non-classifiable40.2%
Firm size (the logarithm of total assets in million dollars)Less than 4.7241.2%
4.7 to 6.332115.5%
6.3 to 7.972635.0%
7.9 to 9.463330.5%
9.4 to 11.033316.1%
Over 11.0361.7%
Proactive environmental performance (environmental concerns)0156475.45%
138318.48%
2934.5%
3291.4%
440.2%
Reactive environmental performance (environmental Strengths)0163678.92%
122010.61%
21366.56%
3492.36%
4180.87%
5120.58%
620.1%
Note: “N” represents the total frequency of all respondents. “Rate” in % is the frequency divided by the total valid responses.
Table 3. Results of random effects least square regression.
DVEnvironmental StrengthsEnvironmental Concerns
Model 1Model 2Model 3Model 4Model 5Model 6Model 7Model 8
Exploration 0.020 *0.034−0.001 0.009−0.000−0.000
(0.01)(0.02)(0.02) (0.01)(0.02)(0.01)
Exploitation −0.021 *−0.022−0.018 −0.017 *0.043 *−0.015
(0.01)(0.02)(0.01) (0.01)(0.02)(0.01)
Exploration × Technological dynamism −0.226 0.153
(0.31) (0.28)
Exploitation × Technological dynamism 0.032 −0.956 ***
(0.27) (0.25)
Exploration × Firm size 0.012 † 0.004
(0.01) (0.01)
Exploitation × Firm size –0.002 −0.001
(0.00) (0.00)
Technological dynamism−2.723 ***−2.670 ***−2.068 *−2.493 ***−3.075 ***−3.035 ***−0.119−2.981 ***
(0.58)(0.59)(0.96)(0.59)(0.61)(0.61)(0.94)(0.62)
Firm size0.062 ***0.059 ***0.059 ***0.0300.158 ***0.157 ***0.156 ***0.150 ***
(0.02)(0.02)(0.02)(0.02)(0.02)(0.02)(0.02)(0.02)
Leverage−0.082−0.096−0.098−0.1640.0930.0900.0960.081
(0.10)(0.10)(0.10)(0.10)(0.10)(0.10)(0.10)(0.10)
Sales growth−0.057 †−0.063 †−0.063 †−0.063 †−0.014−0.020−0.021−0.020
(0.03)(0.03)(0.03)(0.03)(0.03)(0.03)(0.03)(0.03)
R & D0.050 **0.055 **0.055 **0.057 **−0.010−0.004−0.001−0.005
(0.02)(0.02)(0.02)(0.02)(0.02)(0.02)(0.02)(0.02)
Constant−0.364 ***−0.334 **−0.374 **−0.115−0.736 ***−0.709 ***−0.895 ***−0.651 ***
(0.11)(0.11)(0.12)(0.14)(0.11)(0.11)(0.12)(0.14)
Year fixed effectsYesYesYesYesYesYesYesYes
Industry fixed effectsYesYesYesYesYesYesYesYes
chi2309.339315.940316.453325.597437.711444.124472.510448.971
N20602060206020602060206020602060
p < 0.1, * p < 0.05, ** p < 0.01, *** p < 0.001. Standard errors are in parentheses.

