Article

Factors Affecting Rural Households’ Resilience to Food Insecurity in Niger

by
Aboubakr Gambo Boukary
1,2,*,
Adama Diaw
3,† and
Tobias Wünscher
4,†
1
Faculté des Sciences Economiques et de Gestion, Université Cheikh Anta Diop, Dakar, Senegal
2
West African Science Service Center on Climate Change and Adapted Land Use (WASCAL), BP: 898, Niamey, Niger
3
Unité de Formation et de Recherche en Sciences Economiques et de Gestion, Université Gaston Berger, Saint-Louis, Sénégal
4
Zentrum für Entwicklungsforschung (ZEF), University of Bonn, Walter-Flex-Str. 3, 53113 Bonn, Germany
*
Author to whom correspondence should be addressed.
These authors contributed equally to this work.
Sustainability 2016, 8(3), 181; https://doi.org/10.3390/su8030181
Submission received: 18 November 2015 / Revised: 5 February 2016 / Accepted: 16 February 2016 / Published: 2 March 2016

Abstract

:
Niger faces many natural and human constraints explaining the erratic evolution of its agricultural production over time. Unfortunately, this is likely to cause a decline in the food supply. This study attempts to identify factors affecting rural households’ resilience to food insecurity in Niger. For this, we first create a resilience index by using principal component analysis and later apply structural equation modeling to identify its determinants. Data from the 2010 National Survey on Households’ Vulnerability to Food Insecurity done by the National Institute of Statistics is used. The study shows that asset and social safety net indicators are significant and have a positive impact on households’ resilience. Climate change approximated by long-term mean rainfall has a negative and significant effect on households’ resilience. Therefore, to strengthen households’ resilience to food insecurity, there is a need to increase assistance to households through social safety nets and to help them gather more resources in order to acquire more assets. Furthermore, early warning of climatic events could alert households, especially farmers, to be prepared and avoid important losses that they experience anytime an uneven climatic event occurs.

1. Introduction

Niger belongs to one of the hottest areas of the planet where rainfall is characterized by high inter-annual and space-time variability. Like other Sahelian countries, Niger faces many natural constraints such as desertification, silting of water resources, and erosion. In addition to all these challenges, Niger is facing demographic pressure with a population growth rate of 3.9% per year, and an average fertility index of 7.6 children per woman [1] (p. 32). This involves pressure on land use, cultivation of the marginal lands of the northern part of the country and reduction in available grazing areas in the intermediate zone. These natural and human constraints explain the erratic evolution of the country’s agricultural production (characterized by a deficit almost every two years) over the past 20 years.
For Ericksen [2], concern about the global environmental change for food systems is based on the following remarks: (i) the persistence of chronic food insecurity in parts of the world; (ii) the increasing impact of natural hazards and shocks on food, income and environmental security; (iii) the ecosystem services enabling food production systems being eroded via environmental trends such as changes in nutrient cycles, changes in hydrological cycles, changes in vegetation cover and composition, and pollution; and (iv) the inadequacy to substitute for ecosystem services.
Like many African countries, Niger is extremely sensitive to changes in climate variables, especially rainfall. Since the 1970s, the decline in average rainfall, combined with a large inter-annual variability and rapid population growth, has led to several food crises [3].
Moreover, the fourth Assessment Report of the Intergovernmental Panel on Climate Change (IPCC) states that the rain-fed crop yields in some African countries could be reduced by more than 50% [4]. The decline is already perceptible in Niger where the millet yield has been lower than average between 1970 and 2000. Therefore, maintaining a decreasing trend in a country where the population doubles every 20 years is a sign of serious concern for the coming years.
Furthermore, climate change and food security have multiple interrelated risks and uncertainties for societies and ecologies. The complexity of global food security is illustrated by the United Nations’ Food and Agricultural Organization (FAO) definition: “(i) the availability of sufficient quantities of food of appropriate quality, supplied through domestic production or imports; (ii) access by individuals to adequate resources for acquiring appropriate foods for a nutritious diet; (iii) utilization of food through adequate diet, clean water, sanitation, and health care to reach a state of nutritional well-being where all physiological needs are met; and (iv) stability, because to be food secure, a population, household or individual must have access to adequate food at all times” [5,6].
In addition, the African Union Maputo Declaration of 2003 recommends keeping expenditure on agriculture to at least 10% of the national budget by 2008. Even though Niger has surpassed this share, the problem of food security still lingers. Therefore, it is of great relevance to identify key factors affecting households’ resilience to food insecurity in order to better face the adverse effect of climatic shocks. Indeed, resilience is “the capacity to endure shocks and stresses and bounce back” [7]. It is therefore, the ability to persist in an uncertain world. The concept has been developed in a collaboration between natural and social scientists [8].
To complement the Early Warning System (EWS) approach, scholars, practitioners and international organizations such as the FAO have proposed to apply the concept of resilience to the food security issue. In this vein, Alinovi et al. [9] propose a methodology for measuring a household’s resilience to food insecurity as a solid basis for vulnerability analysis. Basically, the concept goes beyond the ability to maintain or return to a previous state. It deals with adapting and learning to live with changes and uncertainty. Three capacities comprise a resilience framework that can be used to design development policy and practice [10].
(1)
Absorptive capacity: the ability to cope with and absorb the effects of shocks and stresses.
(2)
Adaptive capacity: the ability of individuals or societies to adjust and adapt to shocks and stresses, but keep the overall system functioning in quite the same manner.
(3)
Transformative capacity: the ability to change the system fundamentally when how it works is no longer viable.
The relatively recent interest in resilience is based on the need to control risk and prepare against the effects of emergencies. In Niger, for instance, most food security−related studies focus on measuring vulnerability, thus we use a post hoc approach. Therefore, since high or low resilience, respectively, reduce or increase vulnerability, it is relevant to determine which categories of the population have low or high resilience as well as which factors govern households’ resilience to food insecurity in this country.

2. Materials and Methods

2.1. Data Collection

A two-stage stratified random sampling approach was adopted, where structured questionnaires were administered through individual interviews with the heads of the households within seven regions of Niger (Diffa, Dosso, Maradi, Tahoua, Tillabery, Zinder and Niamey) in December 2010. Households from both urban and rural areas were involved in the survey. The sample was first stratified into regions and then into departments. Later, each department has been stratified into rural and urban area.
In the first stage and in each stratum created, enumeration areas have been drawn proportionally to their size in terms of number of households from the 2001 census. For the rural areas, 421 enumeration areas were drawn randomly within 37 departments. In the second stage, households were drawn systematically from the ones of each selected enumeration area.
Finally, 9354 rural households have been surveyed and collected data were related to: demographic characteristics, occupational and educational status; assistance; coping strategies; shocks; children; crops and livestock production and other relevant information.
The survey has been conducted by the National Institute of Statistics.
Climate data were collected from the national stations measurements of rainfall, from 1970 to 2010.

2.2. Empirical Model

Measuring resilience is highly variable, based on the understanding and weight given to concepts such as coping, capacity, vulnerability and adaptive capacity. Few studies quantitatively assessed households’ resilience to food insecurity due to the fact that resilience is not observed per se. To overcome this limitation, authors model resilience as a latent variable [9,11,12,13] or use an observable variable as its proxy [14,15].
To build resilience at a significant level (household, community and national), we need empirical evidence showing which factors contribute to resilience, to which types of shocks and in which context. For this and following Keil et al., Lokosang et al., and Demeke and Tefera [15,16,17], we create a resilience index by using principal component analysis (PCA) on the following variables: income, food expenditure, duration of grain held in stock, livestock units owned by the household calculated as Tropical Livestock Units (TLU) (a measure used in the tropics equivalent to an animal of 250 kilograms) and number of farms exploited. The rationale of choosing these variables is explained in Table 1.
PCA is about reducing the dimensionality of a data set consisting of a large number of interrelated variables while retaining the variation present in the data set as much as possible. This is achieved by transforming to a new set of variables, the principal components, which are uncorrelated, and which are ordered so that the first few retain most of the variation present in all of the original variables [18].
In our analysis, two components have eigenvalues greater than 1; therefore, according to Kaiser’s rule, they are retained. These two components explain 47% of the total variation in the data set. The resilience index is the average of these two principal components.
Higher values of the resilience index show more resilient households and vice versa.
Estimating the Kaiser-Meyer-Olkin (KMO) measure of sampling adequacy, we found that the variables used for the PCA are relevant (KMO = 0.5576, above the recommended value of 0.5).
However, to identify factors affecting households’ resilience to food insecurity, we apply the structural equation modeling approach by using a revised version of the methodology proposed by Alinovi et al. [9,11]. This methodology is based on the assumption that at a given point in time T0, the resilience of a given household depends primarily on the options available to that household to make a living. These options can be access to assets, income-generating activities, basic services, and social safety nets.
Algebraically, the resilience index for a household i is expressed as follows:
R i = f ( A i , A C i , S S N i , C C )
where R is resilience, A is asset, AC is the adaptive capacity, SSN represents social safety nets and CC stands for climate change.
In our analysis, resilience is no longer a latent variable, but is approximated via the index created using PCA. The explanatory variables, except the climate change indicator, are, however, latent indicators.
The structural equation modeling approach uses a factor analysis-type model to measure the latent variables via observed variables, simultaneously using a regression-type model for the relationship among the latent variables [9,19]. It allows latent and observed variables, random and non-random errors, errors in variable regressions, multiple indicators, linear and non-linear restrictions on parameters, tests of model fit, non-normal variables and categorical outcomes (dichotomous, ordinal…).
Details on the explanatory variables are given below:
Asset (A): Assets availability is an important coping mechanism during periods of hardship as they are part of the household’s capital. In this study, we use the following types of goods: jewelry, telephone, television, plough, bike, table, radio.
Any of these variables equals 1 if a household owns such goods and 0 otherwise.
Adaptive capacity (AC): This indicator shows a household’s capacity to cope with and adapt to certain shocks, enabling that household to keep performing its key functions. The main determinants of a household, community or region’s adaptive capacity include economic wealth, technology, information and skills, infrastructure, institutions, and equity [20].
The following variables are used for this indicator:
Perception: Dummy variable based on a household’s perception of its own capacity to keep up in the future.
Incsource: A count variable accounting for the number of household’s income sources. The idea is that the ability of a household to adapt to a given shock is high with diversified income sources.
Migration: Dummy variable indicating whether a household member had recourse for migration in order to deal with food shortage.
Credit: Dummy variable indicating whether a household has borrowed money over the observation period, irrespective of the credit source (formal or informal) and nature (in cash or in kind).
Social safety nets (SSN): They are important means of mitigating crises. Nowadays, rural households are becoming more and more dependent on assistance from national government, international agencies, charities and non-governmental organizations (NGOs). They also receive help from friends and relatives. In this work, we use the following variables showing assistance received by the households: free food distribution, food sale at moderate price, cash transfers, grain bank, and donations.
Any of these variables equals 1 if a household has received such assistance and 0 otherwise.
Climate Change (CC): Climate change in the IPCC usage refers to any change in climate over time, whether due to natural variability or as a result of human activity. In this work, it is approximated through long-term mean rainfall from 1970 to 2010.

3. Results

3.1. Descriptive Statistics

The average monthly income of the surveyed households equals 62.050 FCFA (FCFA is the currency used in Niger and 1 € = 655.957 FCFA). The percentage of households that reported an income decrease, sickness/exceptional expenses and an increase in food price as shocks over the prior 12 months were 41.73%, 44.77%, and 46.64%, respectively (Table 2). The relatively high frequency of increase in food price is consistent with the fact that in Niger, domestic supply does not cover domestic needs. Based on this, speculation is frequent and this leads to a food price spike.
Social safety net programs are an important way to deal with shocks. Indeed, cereal banks, free distribution of food, grain sale at moderate prices, cash for work and donations/zakat are the most common types of assistance received by the rural households (Table 3).

3.2. Measuring Resilience

Figure 1 show that the regions relatively more resilient to food insecurity are Diffa, Dosso and Tillabery, whereas Maradi, Tahoua, Zinder and Niamey are the less resilient ones. The higher resilience of Diffa, Dosso and Tillabery can be explained by their highest irrigation potential.
However, Maradi, Tahoua, Zinder and Niamey are highly populated regions which rely mainly on rain-fed agriculture. In addition, their high level of poverty explains their low adaptive capacity, and hence their vulnerability to uneven events such as food shortages. The low resilience of Niamey can be explained by its high level of inequality between urban and rural areas, despite the relatively good access to technology, institutions, infrastructures, health services, and food markets.
This confirms that differential vulnerabilities of communities are based on socio-demographics, health and water security, natural disasters and climate variability [21].
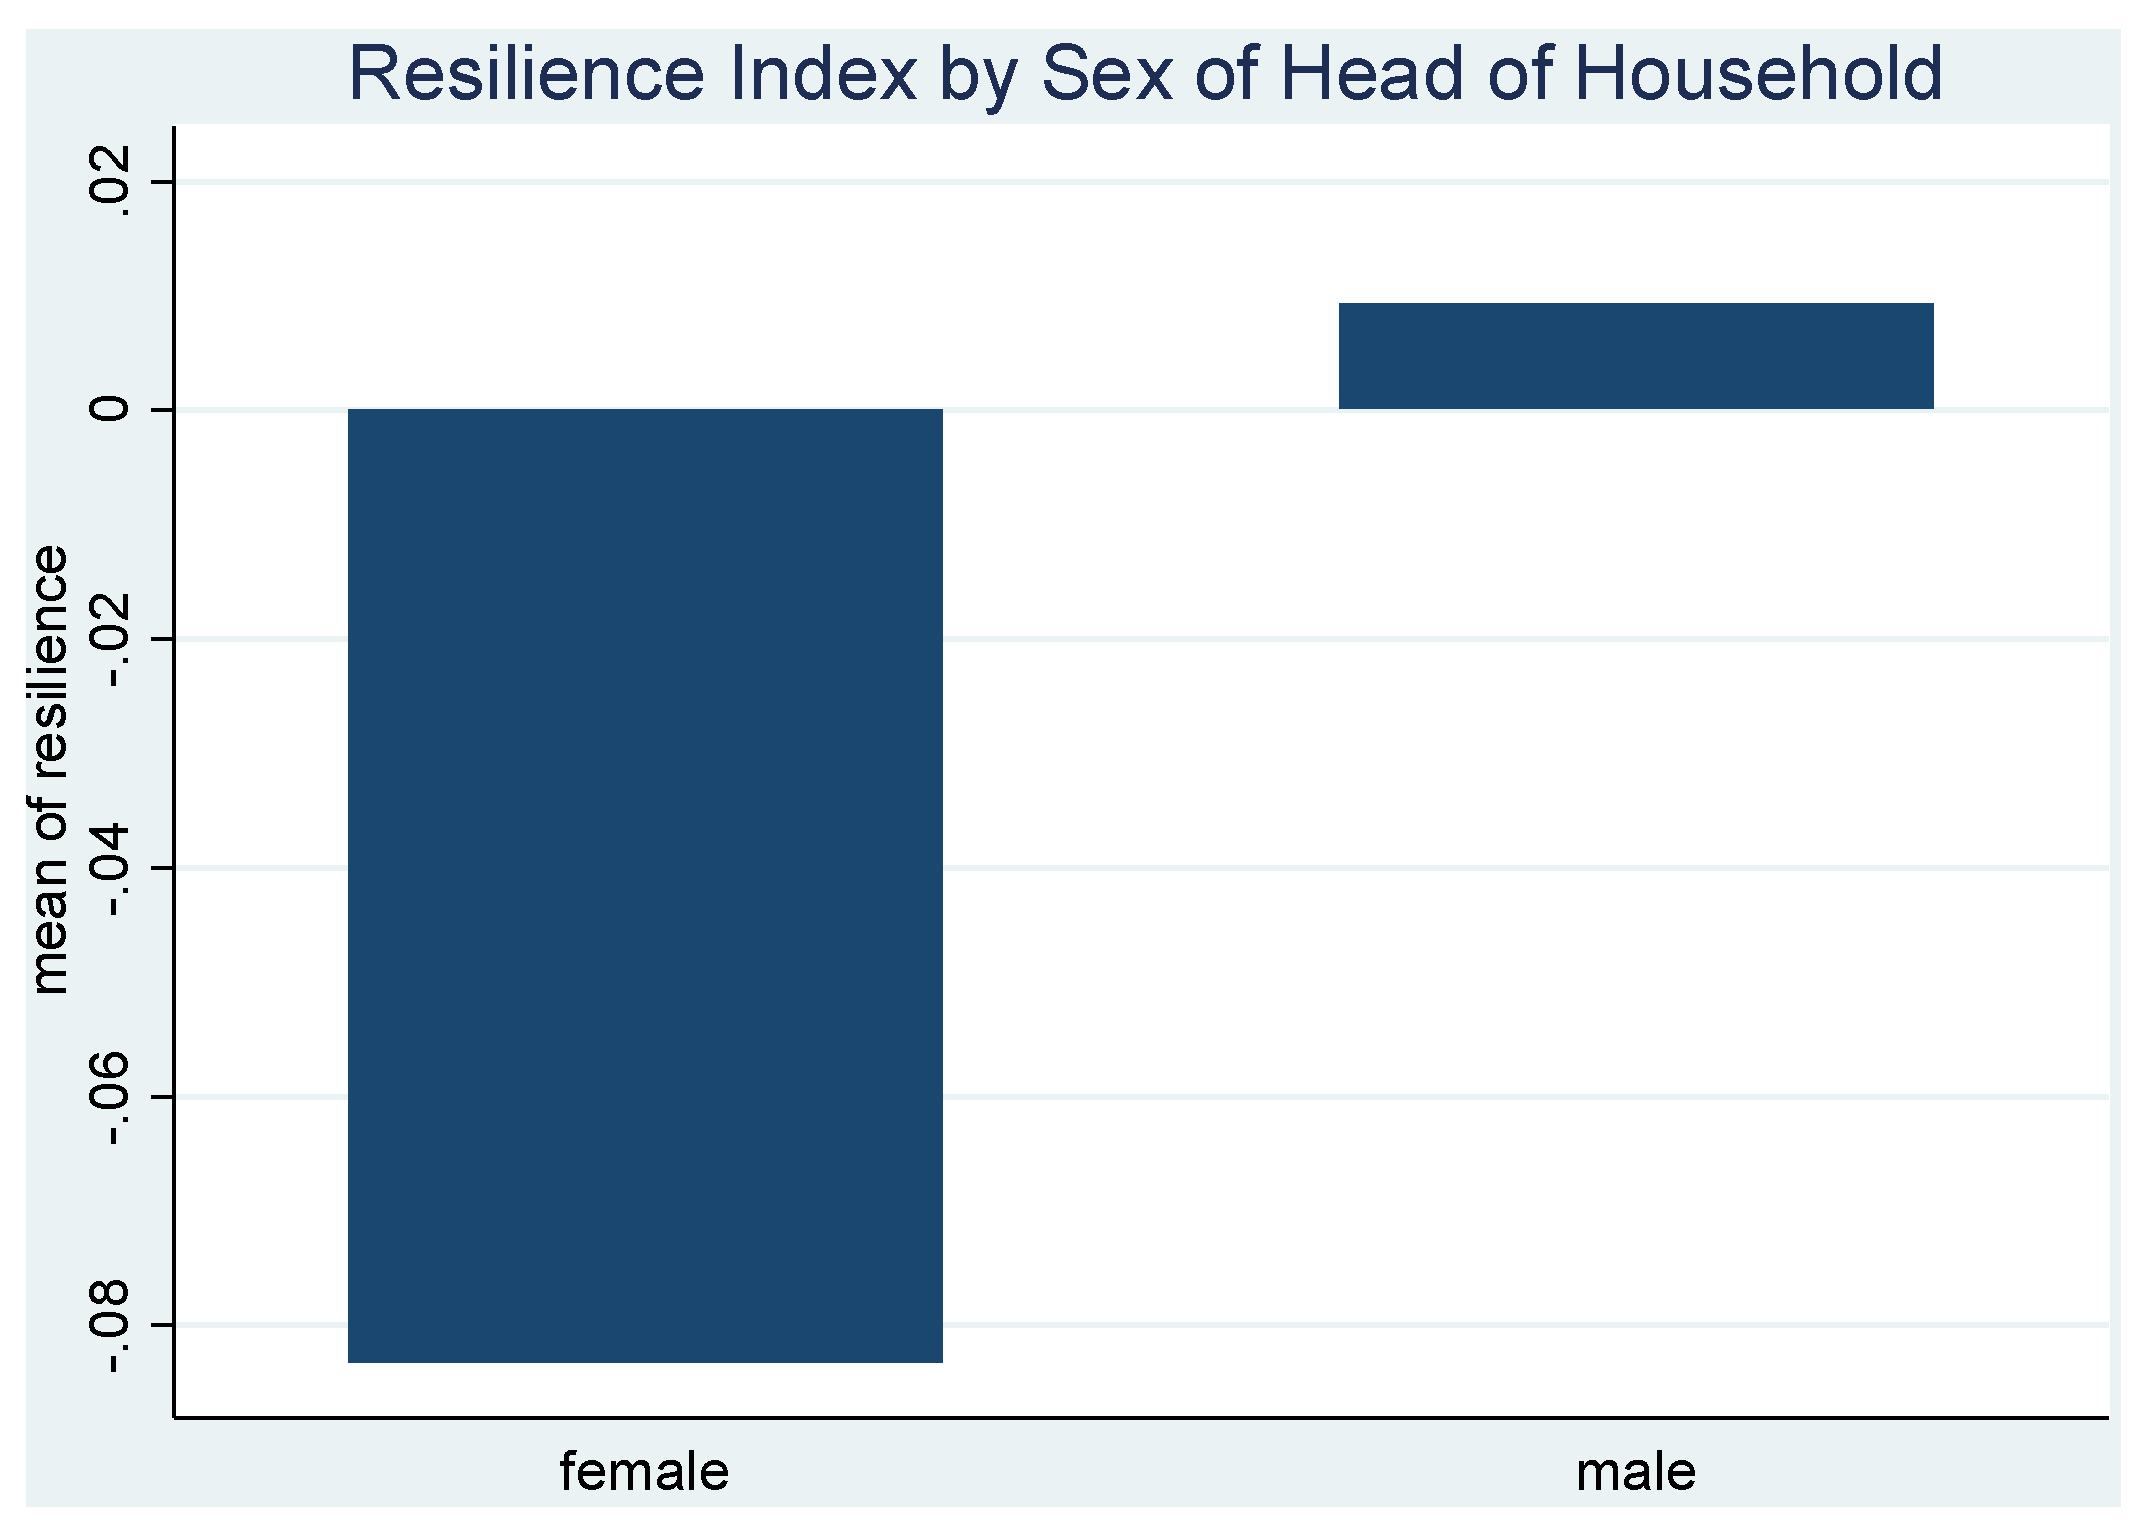
However, when analyzing resilience by sex of the household head, we notice that male-headed households are more resilient than female-headed ones (Figure 2). Indeed, this is linked to the low adaptive capacity of females, lack of assets, and vulnerability. Indeed, female-headed households are marginally more vulnerable than male-headed households [21]. These results are in line with the findings of Haque et al. and Kartiki [22,23] in Bangladesh, who found that female-headed households are less resilient. However, Demetriates and Esplen and Below et al. [24,25] have showed the contrary in sub-Saharan African contexts.
To account for this female vulnerability, the national government and NGOs are helping women to create income-generating activities. A relevant effort is the improvement of land tenure. Indeed, in the past years in many communities, a woman has not been able to inherit farm. Therefore, without any income source, a household headed by a woman is more likely to suffer in case of food shortages, especially in rural areas. Indeed, one important factor influencing household food security comes when no household member earns an income from outside the community [26]. In addition, to allow households to have an alternative source of income that is potentially less impacted in case of agricultural losses, it is preferable that this supplementary income source comes outside of a natural resource-dependent activity [26].

3.3. Determinants of Resilience

Based on structural equation modeling (SEM) approach, we empirically assess rural households’ resilience to food insecurity in Niger.
The results (Table 4) show that Asset and Social Safety Nets indicators have positive and significant impact on households’ resilience to food insecurity, as expected.
This confirms the hypothesis that the more assets a household owns, the higher its level of resilience is. Indeed, such assets can be used to buffer shocks. The importance of assets has been showed by Szabo et al. [27]. In their study in the southwest coast of Bangladesh, they investigate the effect of soil salinity and wealth on household food security and find that the impact of household wealth is strong, in particular when considering the richest strata of the society (the effect of household wealth is approximated by an asset index constructed using PCA). Ceteris paribus, the odds of being food-insecure for the richest households are approximately 0.26 times the odds for poorest households [27].
Our study confirms also the finding of Lokosang et al. [16] that resilience to food insecurity is a property of wealth and thus its proxy.
Furthermore, benefitting from social safety nets provides support for individuals. In this vein, Szabo et al. [27] find that remittances positively impact a household’s food security status. In their study, the odds of being food-insecure for households that have been receiving remittances are around 0.63 times the odds of being food-insecure for households that have not been receiving any remittances. A positive relationship has been found between households who received government assistance and the level of food security [26].
Moreover, depending upon the profile of the community, the use of one or more instruments of social protection at the same time may reduce household vulnerability to climate change [28].
The climate change indicator approximated by long-term average rainfall has a negative and significant effect on rural households’ resilience to food insecurity. Indeed, in Niger, any lack or delay of rainfall is likely to lead to a decline in the food production. The country is climate-sensitive and relies strongly on rain-fed agriculture. Therefore, any climatic shocks disturb the food production. Indeed, in the face of climatic change, several factors which would have contributed a measure of resilience (by increasing food security) are weakened, putting households at a food security risk [26]
However, adaptive capacity (AC) negatively affects resilience, even though it is assumed that a household with high adaptive capacity will have a great level of resilience. In rural areas, this can be explained by their low access to credit and limited number of income sources. For instance, 34.42% of the surveyed households reported having only one income source, 48.79% reported two income sources and 15% reported three income sources. In addition, 52.44% of the surveyed households used friends and their family network to borrow money in cash or in kind.
To see how well our model fits the data, we notice that chi2 (118) = 1535.39, Prob > chi2 = 0.00, meaning that our model fully accounts for all the variances and covariances.
A good fitting model is reasonably consistent with the data; hence, it does not necessarily require re-specification. However, a good fitting model is not necessarily a valid model.
Many tests exist to measure model fit and we display results from the common ones:
(1)
Root Mean Square Error of Approximation (RMSEA). It is a measure showing if the population approximately or closely fits the model. A RMSEA value less than 0.05 is considered to indicate a good fit. A RMSEA of 0.1 or more is often taken to indicate a poor fit. In our analysis, the RMSEA equals 0.03, meaning a reasonably good fit.
(2)
Standardized Root Mean Residual (SRMR). It is an index of how well our model fits. More precisely, it is a measure of how close we come to reproducing each correlation on average. Our SRMR of 0.03 means that, on average, we come within 0.03 of reproducing each correlation among the three latent indicators. The recommended value is less than 0.08 [29].
(3)
Comparative Fit Index (CFI). It is a widely used measure to examine how closely a model comes to fitting the data. It compares the model with a baseline model that assumes there is no relationship among the observed indicators variables. In other words, the CFI reported indicates that our model does 77.2% better than a null model in which we assume the items are all unrelated to each other.
Considering the model with categorization based on the sex of the household’s head (Table 5), we notice that Asset has a positive and significant impact on households’ resilience to food insecurity for both categories. The Social Safety Nets indicator has a positive impact for both categories, but no statistically significant relationship is found for female-headed households.
However, the adaptive capacity indicator has a negative effect on households’ resilience for both categories.

4. Conclusions

Based on household level survey data from seven regions in Niger, we use an updated version of the methodology developed by Alinovi et al. [9,11] to estimate resilience to food insecurity. We apply principal component analysis to create a resilience index and later use structural equation modeling to identify factors governing rural households’ resilience to food insecurity.
The study shows that Diffa, Dosso and Tillabery are more resilient regions to food insecurity. This is associated with their irrigation potential and their relatively low reliance on rain-fed agriculture.
When analyzing resilience by sex of the household head, we notice that male-headed households are more resilient than female-headed ones. This is associated with female low adaptive capacity, lack of assets, and their vulnerability.
The study also shows that Asset and Social Safety Nets positively and significantly affect households’ resilience to food insecurity. In addition, the climate change indicator approximated by long-term average rainfall has a negative and significant effect on households’ resilience to food insecurity.
Notably, these results indicate that to strengthen households’ resilience to food insecurity, there is a need to help them gather more resources in order to acquire more assets. They also need assistance through social safety nets, especially for women. In addition, early warnings of climatic events could alert households, especially farmers, to be prepared and avoid important losses that they experience anytime an uneven climatic event occur.
A further useful analysis will be examining the effect of resilience on households’ vulnerability to food insecurity, or more precisely analyzing whether a resilient household today will be less vulnerable tomorrow. For this kind of analysis, we need true panel data, which our data does not allow us to do.

Acknowledgments

The authors are grateful to the West African Science Service Center on Climate Change and Adapted Land Use (WASCAL)—an initiative of the German Federal Ministry of Education and Research (BMBF)—for the funding that helped to produce this article.

Author Contributions

Adama Diaw and Tobias Wünscher supervised this work as respectively my first and second Ph.D. Thesis supervisor.

Conflicts of Interest

The authors declare no conflict of interest.

References

  1. Institut National de la Statistique (INS). Le Niger en Chiffres 2014. Available online: http://www.stat-niger.org/statistique/file/Affiches_Depliants/Nigerenchiffres2014def.pdf (accessed on 17 February 2016).
  2. Ericksen, P.J. What is the vulnerability of a food system to global environmental change? Ecol. Soc. 2008, 13, 14. [Google Scholar]
  3. Biasutti, M.; Giannini, A. Robust Sahel drying in response to late 20th century forcing. Geophys. Res. Lett. 2006. [Google Scholar] [CrossRef]
  4. Solomon, S. IPCC, 2007: Climate Change 2007: The Physical Science Basis. Contribution of Working Group I to the Fourth Assessment Report of the Intergovernmental Panel on Climate Change; Intergovernmental Panel on Climate Change (IPCC): New York, NY, USA, 2007. [Google Scholar]
  5. Food and Agriculture Organization of the United Nations (FAO). Rome Declaration on World Food Security and World Food Summit Plan of Action. In Proceeding of the World Food Summit Plan of Action, Rome, Italy, 13–17 November 1996.
  6. Wheeler, T.; von Braun, J. Climate Change Impacts on Global Food Security. Science 2013, 341, 508–513. [Google Scholar] [CrossRef] [PubMed]
  7. Pasteur, K. From Vulnerability to Resilience: A Framework for Analysis and Action to Build Community Resilience; Practical Action Publishing: Rugby, UK, 2011. [Google Scholar]
  8. Adger, N.W. Social and ecological resilience: Are they related? Progr. Hum. Geogr. 2000, 24, 347–364. [Google Scholar] [CrossRef]
  9. Alinovi, L.; Mane, E.; Romano, D. Measuring Household Resilience to Food Insecurity: Application to Palestinian Households; John Wiley & Sons, Ltd.: Chichester, UK, 2010. [Google Scholar]
  10. Béné, C.; Godfrey-Wood, R.; Newsham, A.; Davies, M. Resilience: New Utopia or New Tyranny? Reflection about the Potentials and Limits of the Concept of Resilience in Relation to Vulnerability Reduction Programmes; IDS Working Paper 405; Institute of Development Studies: Brighton, UK, 2012. [Google Scholar]
  11. Alinovi, L.; D’Errico, M.; Mane, E.; Romano, D. Livelihoods Strategies and Household Resilience to Food Insecurity: An Empirical Analysis to Kenya; Food and Agriculture Organization of the United Nations (FAO): Rome, Italy, 2010. [Google Scholar]
  12. Tefera, N.; Kayitakire, F. Household Resilience for Food and Nutrition Security: Empirical Evidence from Rural Household in Ethiopia. Available online: https://www.researchgate.net/publication/269872488_Household_Resilience_for_Food_and_Nutrition_Security_Empirical_Evidence_from_Rural_Household_in_Ethiopia (accessed on 17 February 2016).
  13. Ciani, F.; Romano, D. Testing for Household Resilience to Food Insecurity: Evidence from Nicaragua. Available online: http://ageconsearch.umn.edu/bitstream/182717/2/Romano-Testing_for_household_resilience_to_food_insecurity-380_a.pdf (accessed on 17 February 2016).
  14. Carter, M.R.; Little, P.D.; Mogues, T.; Negatu, W. Shocks, Sensitivity and Resilience: Tracking the Economic Impacts of Environmental Disaster on Assets in Ethiopia and Honduras; Development Strategy and Governance Division (DSGD) Discussion Paper, No. 32; International Food Policy Research Institute (IFPRI): Washington, DC, USA, 2006. [Google Scholar]
  15. Keil, A.; Zeller, M.; Wida, A.; Sanim, B.; Birner, R. What Determines Farmers’ Resilience towards ENSO Related Drought? An Empirical Assessment in Central Sulawesi, Indonesia. Climate Change 2008, 86, 291–307. [Google Scholar] [CrossRef]
  16. Lokosang, L.B.; Ramroop, S.; Zewotir, T. Indexing household resilience to food insecurity shocks: The case of South Sudan. Agrekon 2014, 53, 137–159. [Google Scholar] [CrossRef]
  17. Demeke, M.; Tefera, N. Sustainable Resilience for Food and Nutrition Security: The Case of Farming Rural Households in Ethiopia; Agricultural Development and Economics Division (ESA), Food and Agricultural Organization (FAO): Rome, Italy, 2013. [Google Scholar]
  18. Jolliffe, I.T. Principal Component Analysis, Second Edition; Springer Science + Business Media: Medford, MA, USA, 2002. [Google Scholar]
  19. Bollen, K.A. Structural Equations with Latent Variables; Wiley and Sons: New York, NY, USA, 1989. [Google Scholar]
  20. Intergovernmental Panel on Climate Change. Climate Change 2001: Impacts, Adaptation, and Vulnerability; IPCC: New York, NY, USA, 2001. [Google Scholar]
  21. Shah, K.; Dulal, H.; Johnson, C.; Baptiste, A. Understanding livelihood vulnerability to climate change: Applying the livelihood vulnerability index in Trinidad and Tobago. Geoforum 2013, 47, 125–137. [Google Scholar] [CrossRef]
  22. Haque, M.; Yamamoto, S.; Malik, A.; Sauerborn, R. Households’ perception of climate change and human health risks: A community perspective. Environ. Health 2012, 11, 1. [Google Scholar] [CrossRef] [PubMed]
  23. Kartiki, K. Climate change and migration: A case study from rural Bangladesh. Gender Dev. 2011, 19, 23–38. [Google Scholar] [CrossRef]
  24. Demetriades, J.; Esplen, E. The gender dimensions of poverty and climate change adaptation. IDS Bulletin 2008, 39, 24–31. [Google Scholar] [CrossRef] [Green Version]
  25. Below, T.; Mutabazi, K.; Kirschke, D.; Franke, C.; Sieber, S.; Siebert, R.; Tscherning, K. Can farmers’ adaptation to climate change be explained by socio-economic household-level variables? Glob. Environ. Change 2012, 22, 223–235. [Google Scholar] [CrossRef]
  26. Shah, K.U.; Dulal, H.B. Household capacity to adapt to climate change and implications for food security in Trinidad and Tobago. Reg. Environ. Change 2015, 15, 1379–1391. [Google Scholar] [CrossRef]
  27. Szabo, S.; Hossain, M.S.; Adger, W.N.; Matthews, Z.; Ahmed, S.; Lazar, A.N.; Ahmad, S. Soil Salinity, Household Wealth and Food Insecurity in Tropical Deltas: Evidence from South-West Coast of Bangladesh; Springer Japan: Tokyo, Japan, 2015. [Google Scholar]
  28. Dulal, H.; Shah, K.U. ‘Climate-Smart’ Social Protection: Can it be achieved without a targeted household approach? Environ. Dev. 2014, 10, 16–35. [Google Scholar] [CrossRef]
  29. Alan, C.A. Discovering Structural Equation Modeling Using Stata, Revised Edition; Stata Press: College Station, TX, USA, 2013. [Google Scholar]
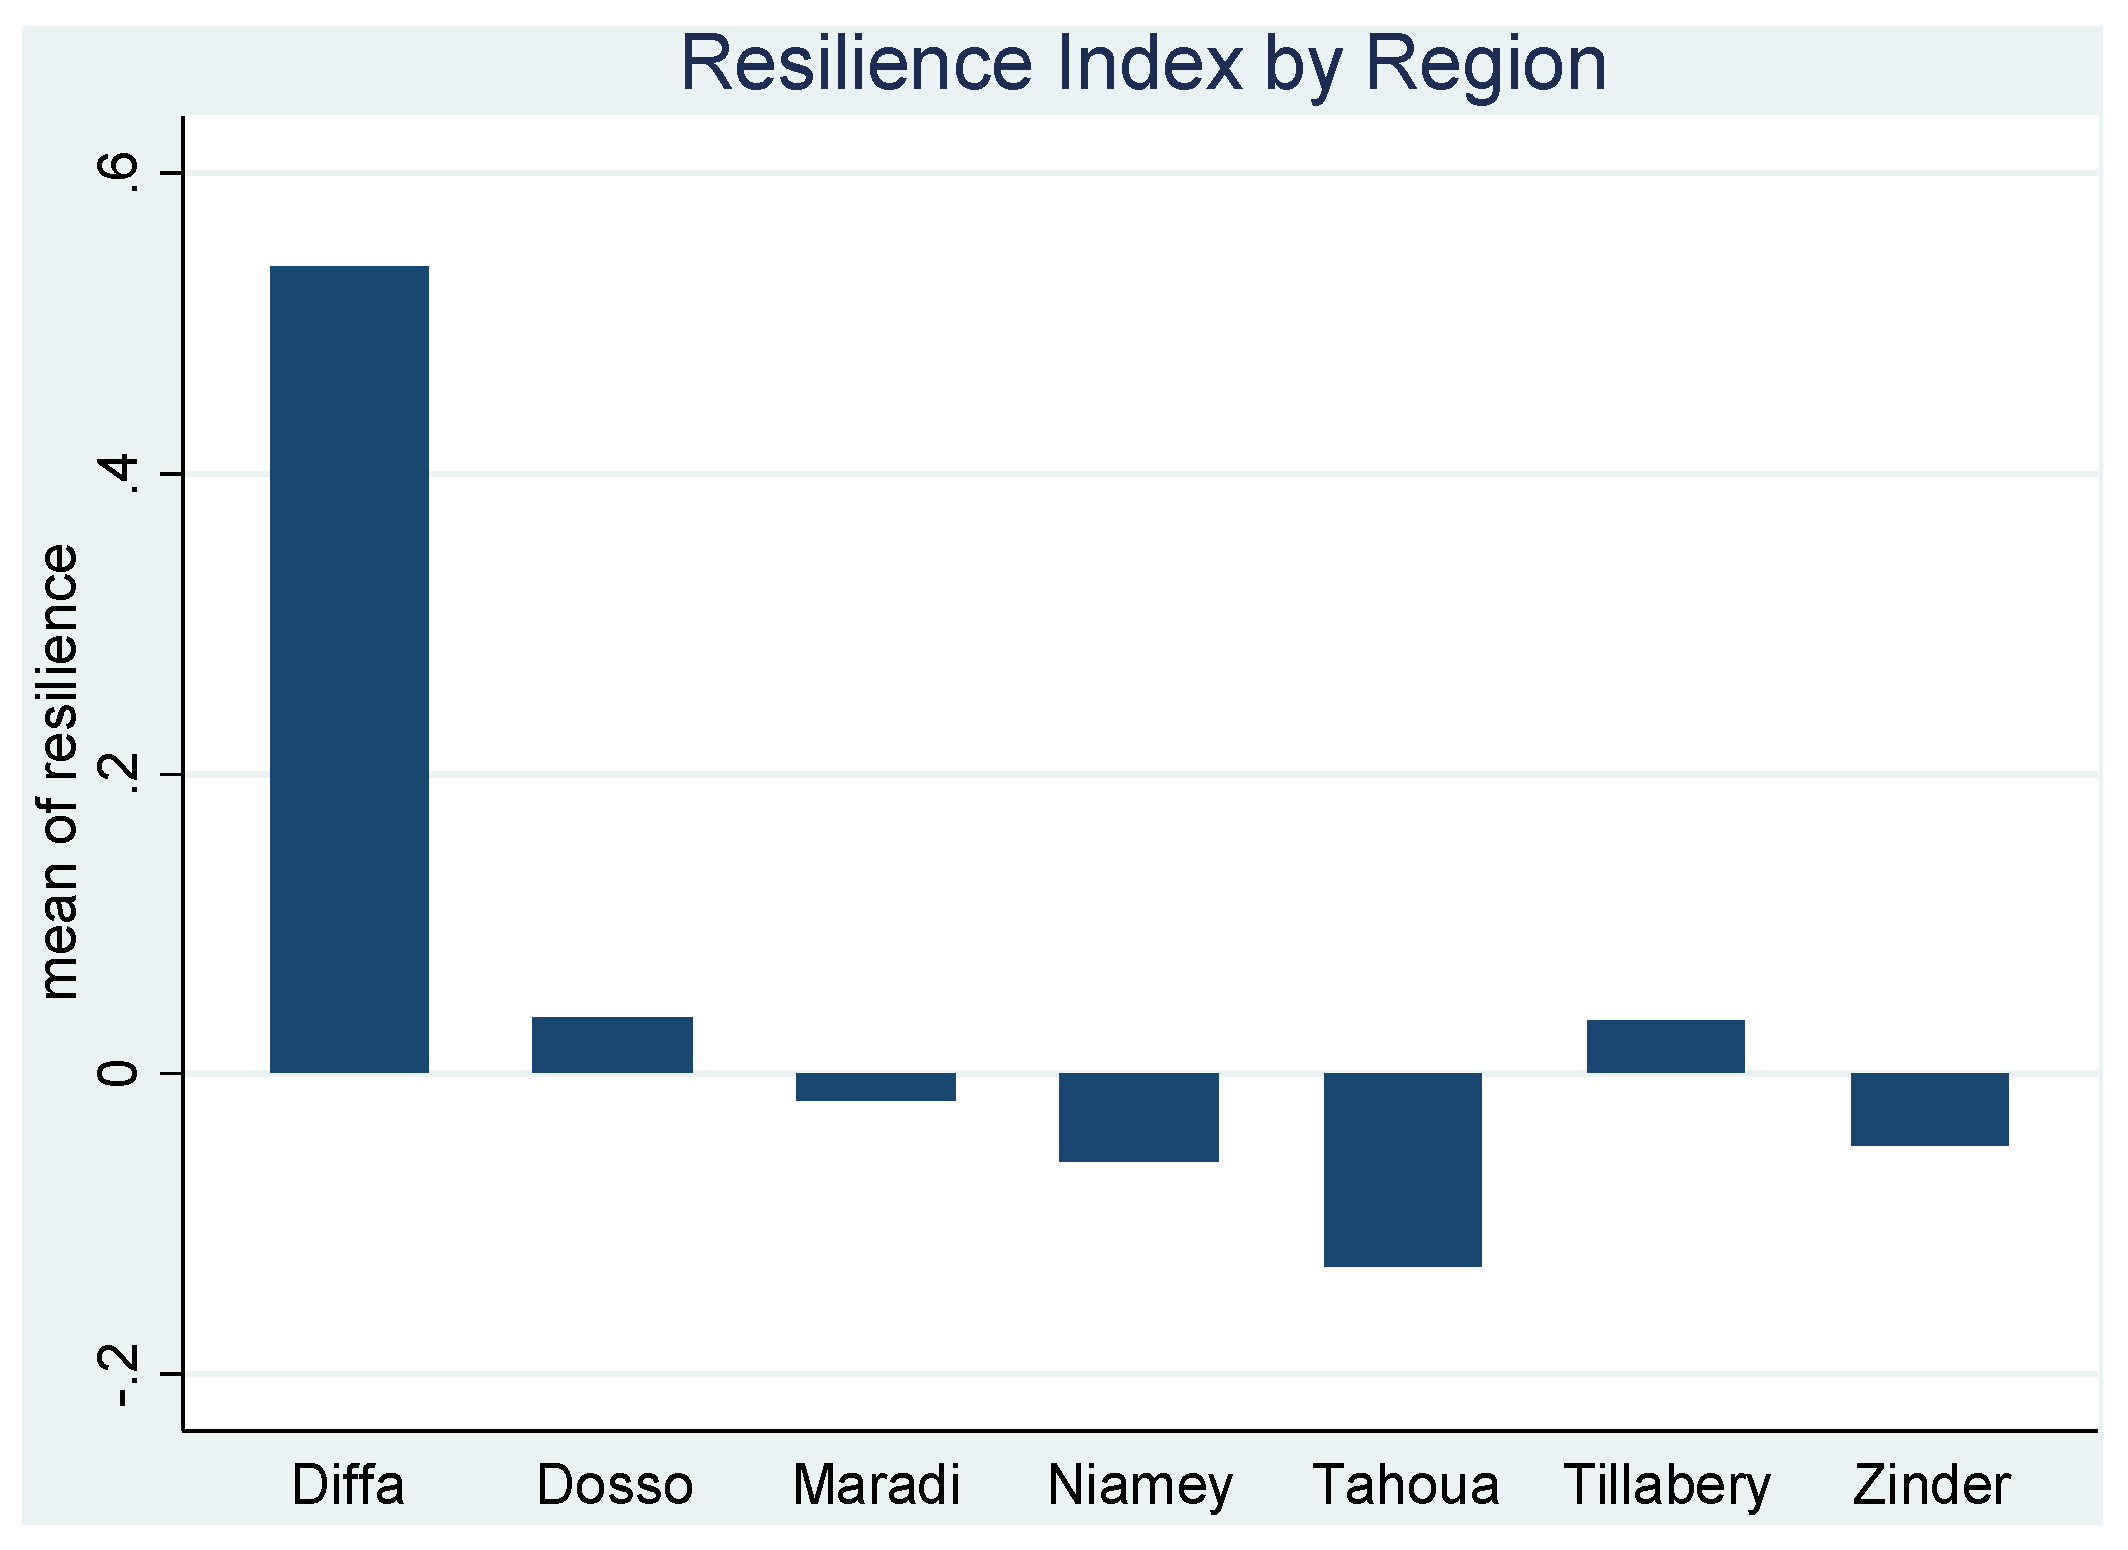
Figure 1. Resilience index by region.
Sustainability 08 00181 g001
Figure 2. Resilience index by sex of head of household.
Sustainability 08 00181 g002
Table 1. Resilience variables, units of measurement and expected direction with respect to resilience.
VariablesUnit of MeasurementHypothesized Relationship with Resilience
IncomeAmount of income earned by a householdThe higher a household income is, the greater its level of resilience is supposed to be.
Food ExpenditureAmount of money spent on purchasing foodSpending more on food consumption is a sign of household’s wealth, even though in most rural areas buying food means lack of food production.
FarmNumber of farms exploited by the household during the rainy season.Exploiting more farms may increase a household’s food availability or income that the activity may generate, thus increasing its resilience to food insecurity.
TLULivestock size in Tropical Livestock Units.This is a materialized asset owned by a household and having more assets may increase a household’s resilience to uneven shock.
StockDuration of grain held in stockThe longer grain held in stock lasts, the greater a household’s adaptive capacity to food shortage is.
Table 2. Major shocks encountered by surveyed households.
ShocksNumber of HouseholdsPercent of Surveyed Households
Job loss2442.67
Income decrease382341.73
Sickness/exceptional expenses410844.77
Family member death124013.6
Increase of food price428146.64
Increase of fuel price/transport price2833.1
Increase of rent670.73
Increase of agricultural inputs price9099.96
Power cut1271.39
Insecurity/robbery3774.13
Debt reimbursement138715.18
Long-term unemployment3173.48
Natural hazards (floods, fire, winds...)186020.35
Rainfall irregularity122613.44
Source: Author’s calculations based on the survey data.
Table 3. Types of assistance received.
Assistance ProgramsNumber of HouseholdsPercent of Household
Cereal bank235625.19
Free distribution of food465949.81
Grain sale at moderate price286930.67
Food for work111811.95
Cash for work197221.08
Protection allowance132114.12
Donation/zakat218723.38
Blanket feeding106911.43
Complementary allowance to pregnant and nursing women127113.59
Agricultural inputs (fertilizers, seeds...)102410.95
Cash transfers98910.57
Source: Author’s calculations based on the survey data.
Table 4. SEM estimation results.
Resilience IndicatorsUnstandardized EstimatesStandardized Estimates
Coefficientp-ValueCoefficientp-Value
Asset0.030.000 ***0.250.000 ***
Adaptive Capacity −0.010.000 **−0.060.009 **
Social Safety Nets0.010.005 ***0.050.004 **
Climate Change (CC)−5.860.005 **−0.030.005 **
Constant441.040.000 ***3.010.000 ***
Notes: p-values: * p < 0.05, ** p < 0.01, *** p < 0.001. Source: Author’s estimation from Stata.
Table 5. Estimation results by sex of head of household.
Resilience IndicatorsMaleFemale
Standardized EstimatesStandardized Estimates
Coefficientp-ValueCoefficientp-Value
Asset (A)0.250.000 ***0.370.000 ***
Adaptive Capacity (AC)−0.060.010 **−0.060.256
Social safety Nets (SSN)0.050.006 **0.040.474
Climate Change (CC)−0.030.002 **−0.020.003 **
Constant3.020.000 ***2.890.000 ***
Notes: p-values: * p < 0.05, ** p < 0.01, *** p < 0.001. Source: Author’s estimation from Stata.