
Ecological Security Pattern Analysis Based on InVEST and Least-Cost Path Model: A Case Study of Dongguan Water Village


Abstract
:1. Introduction
2. Materials and Methods
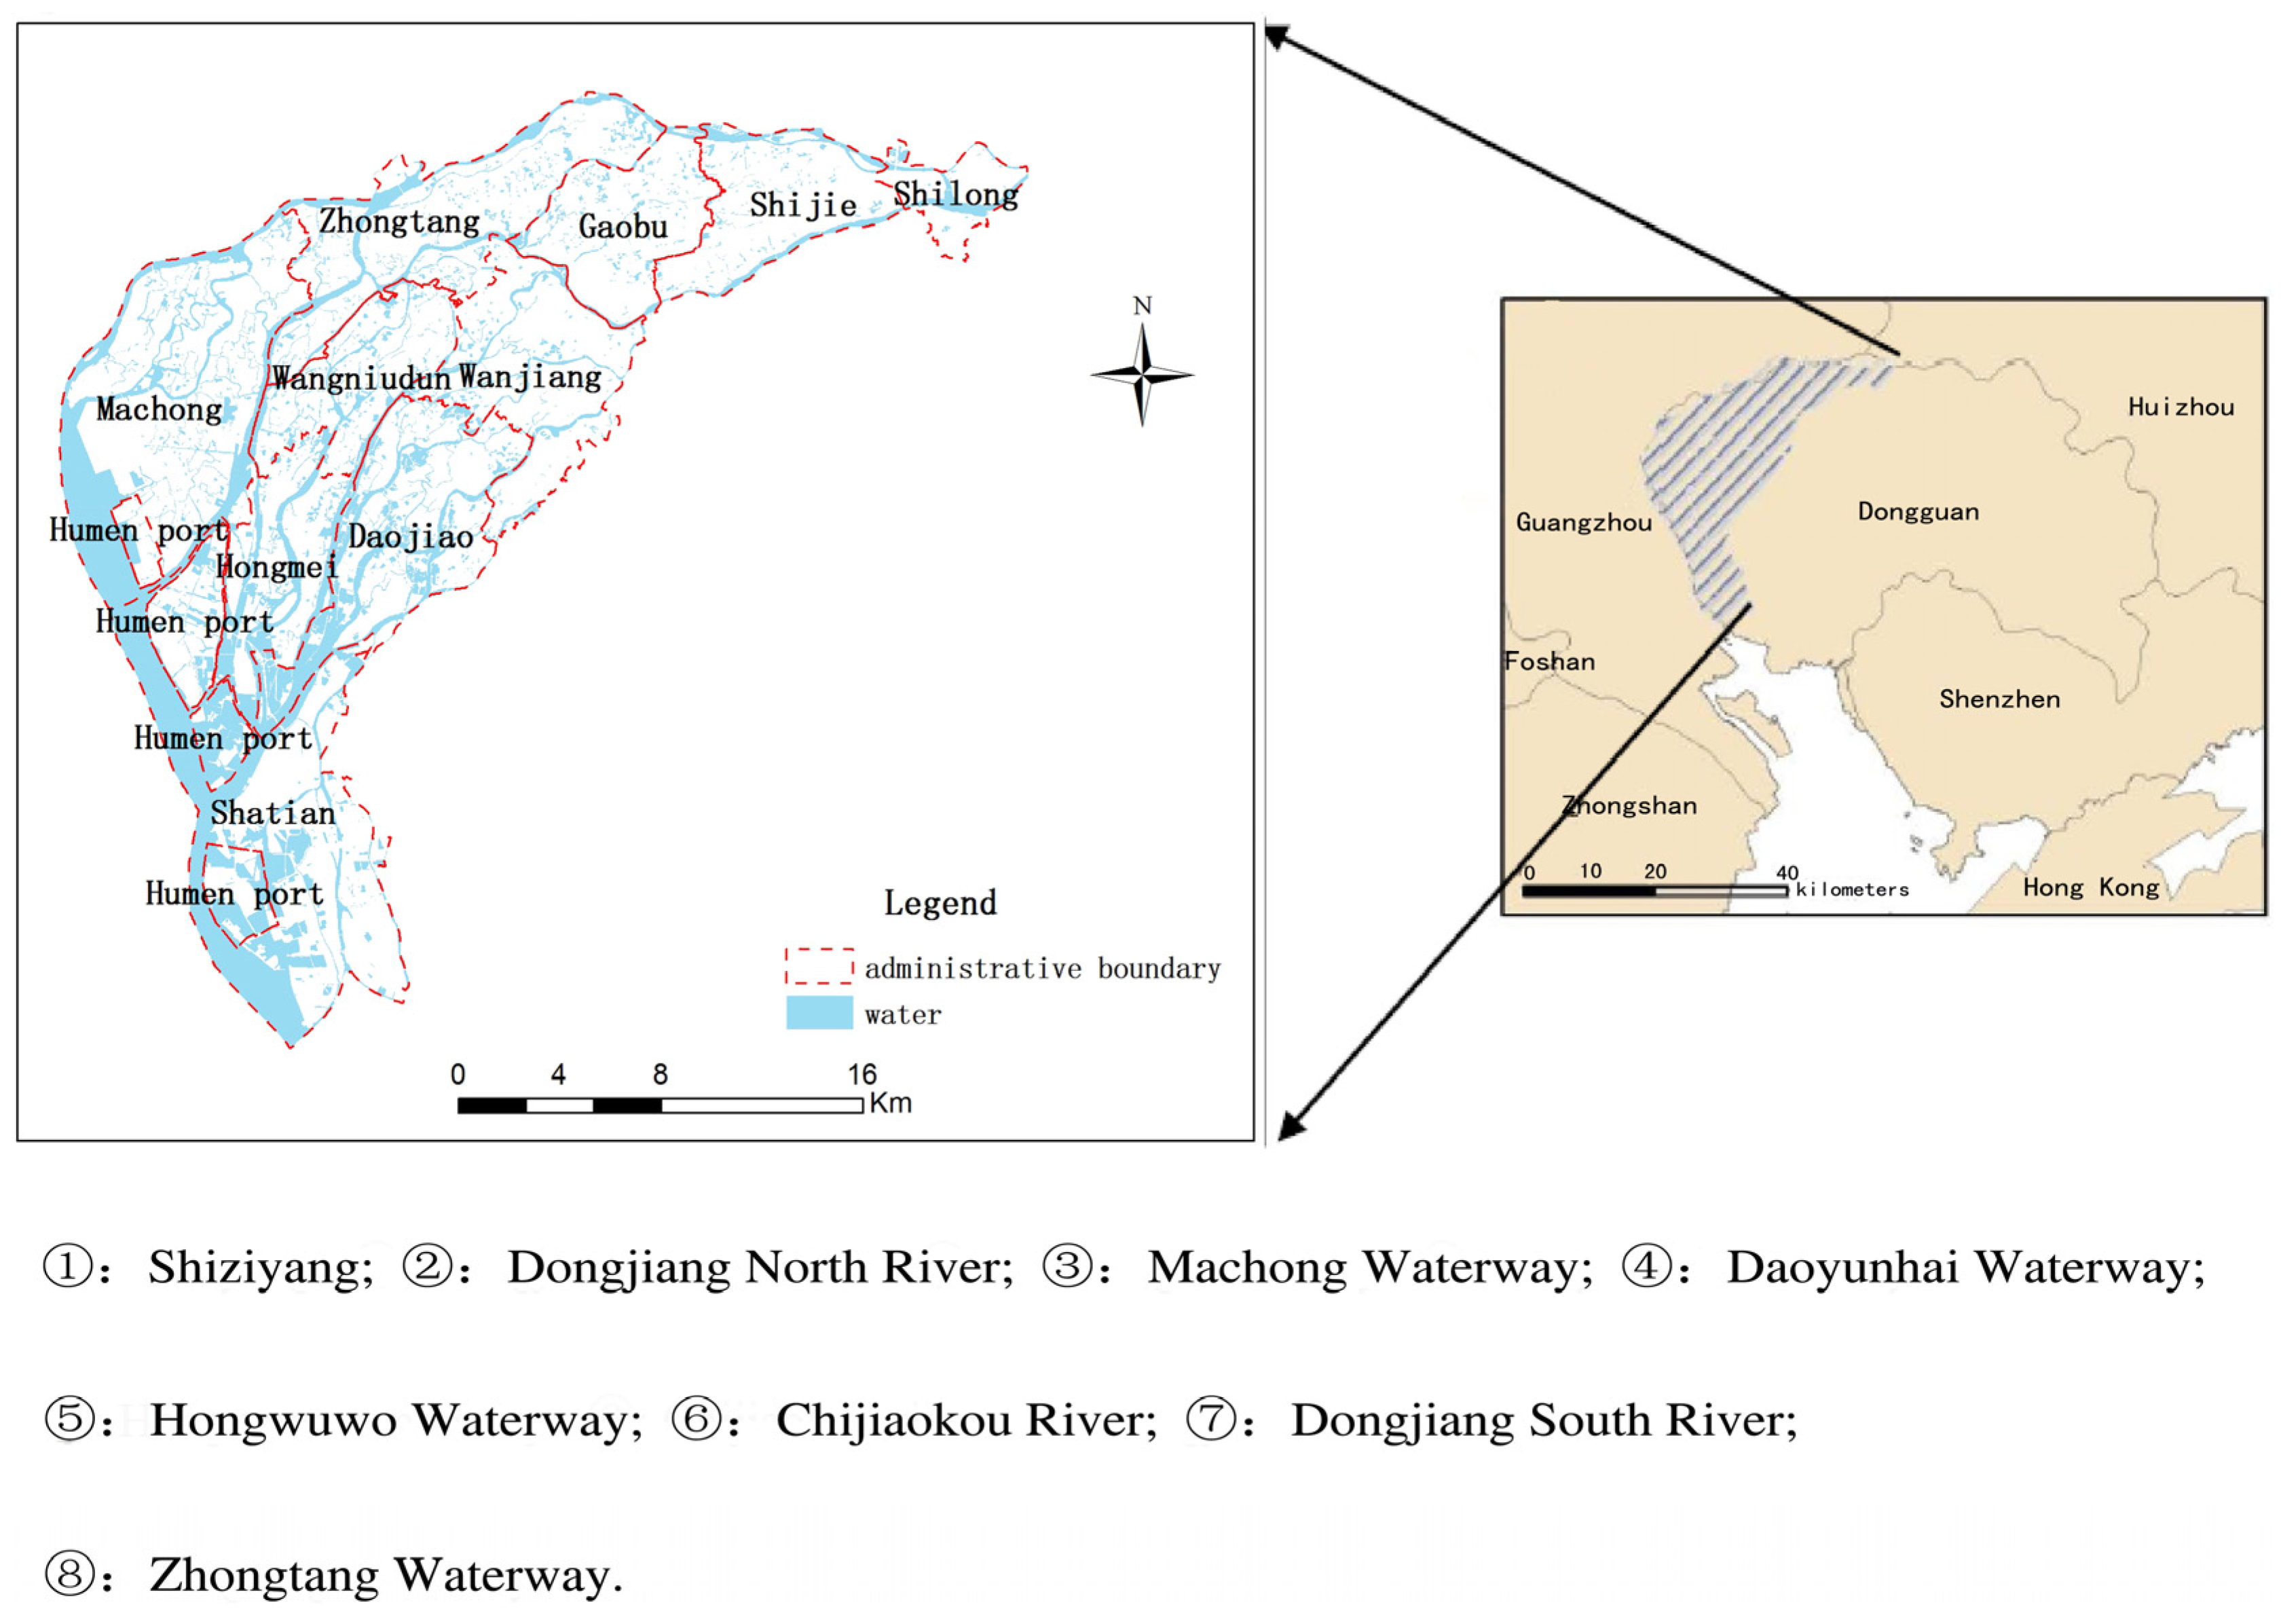
2.1. Study Area
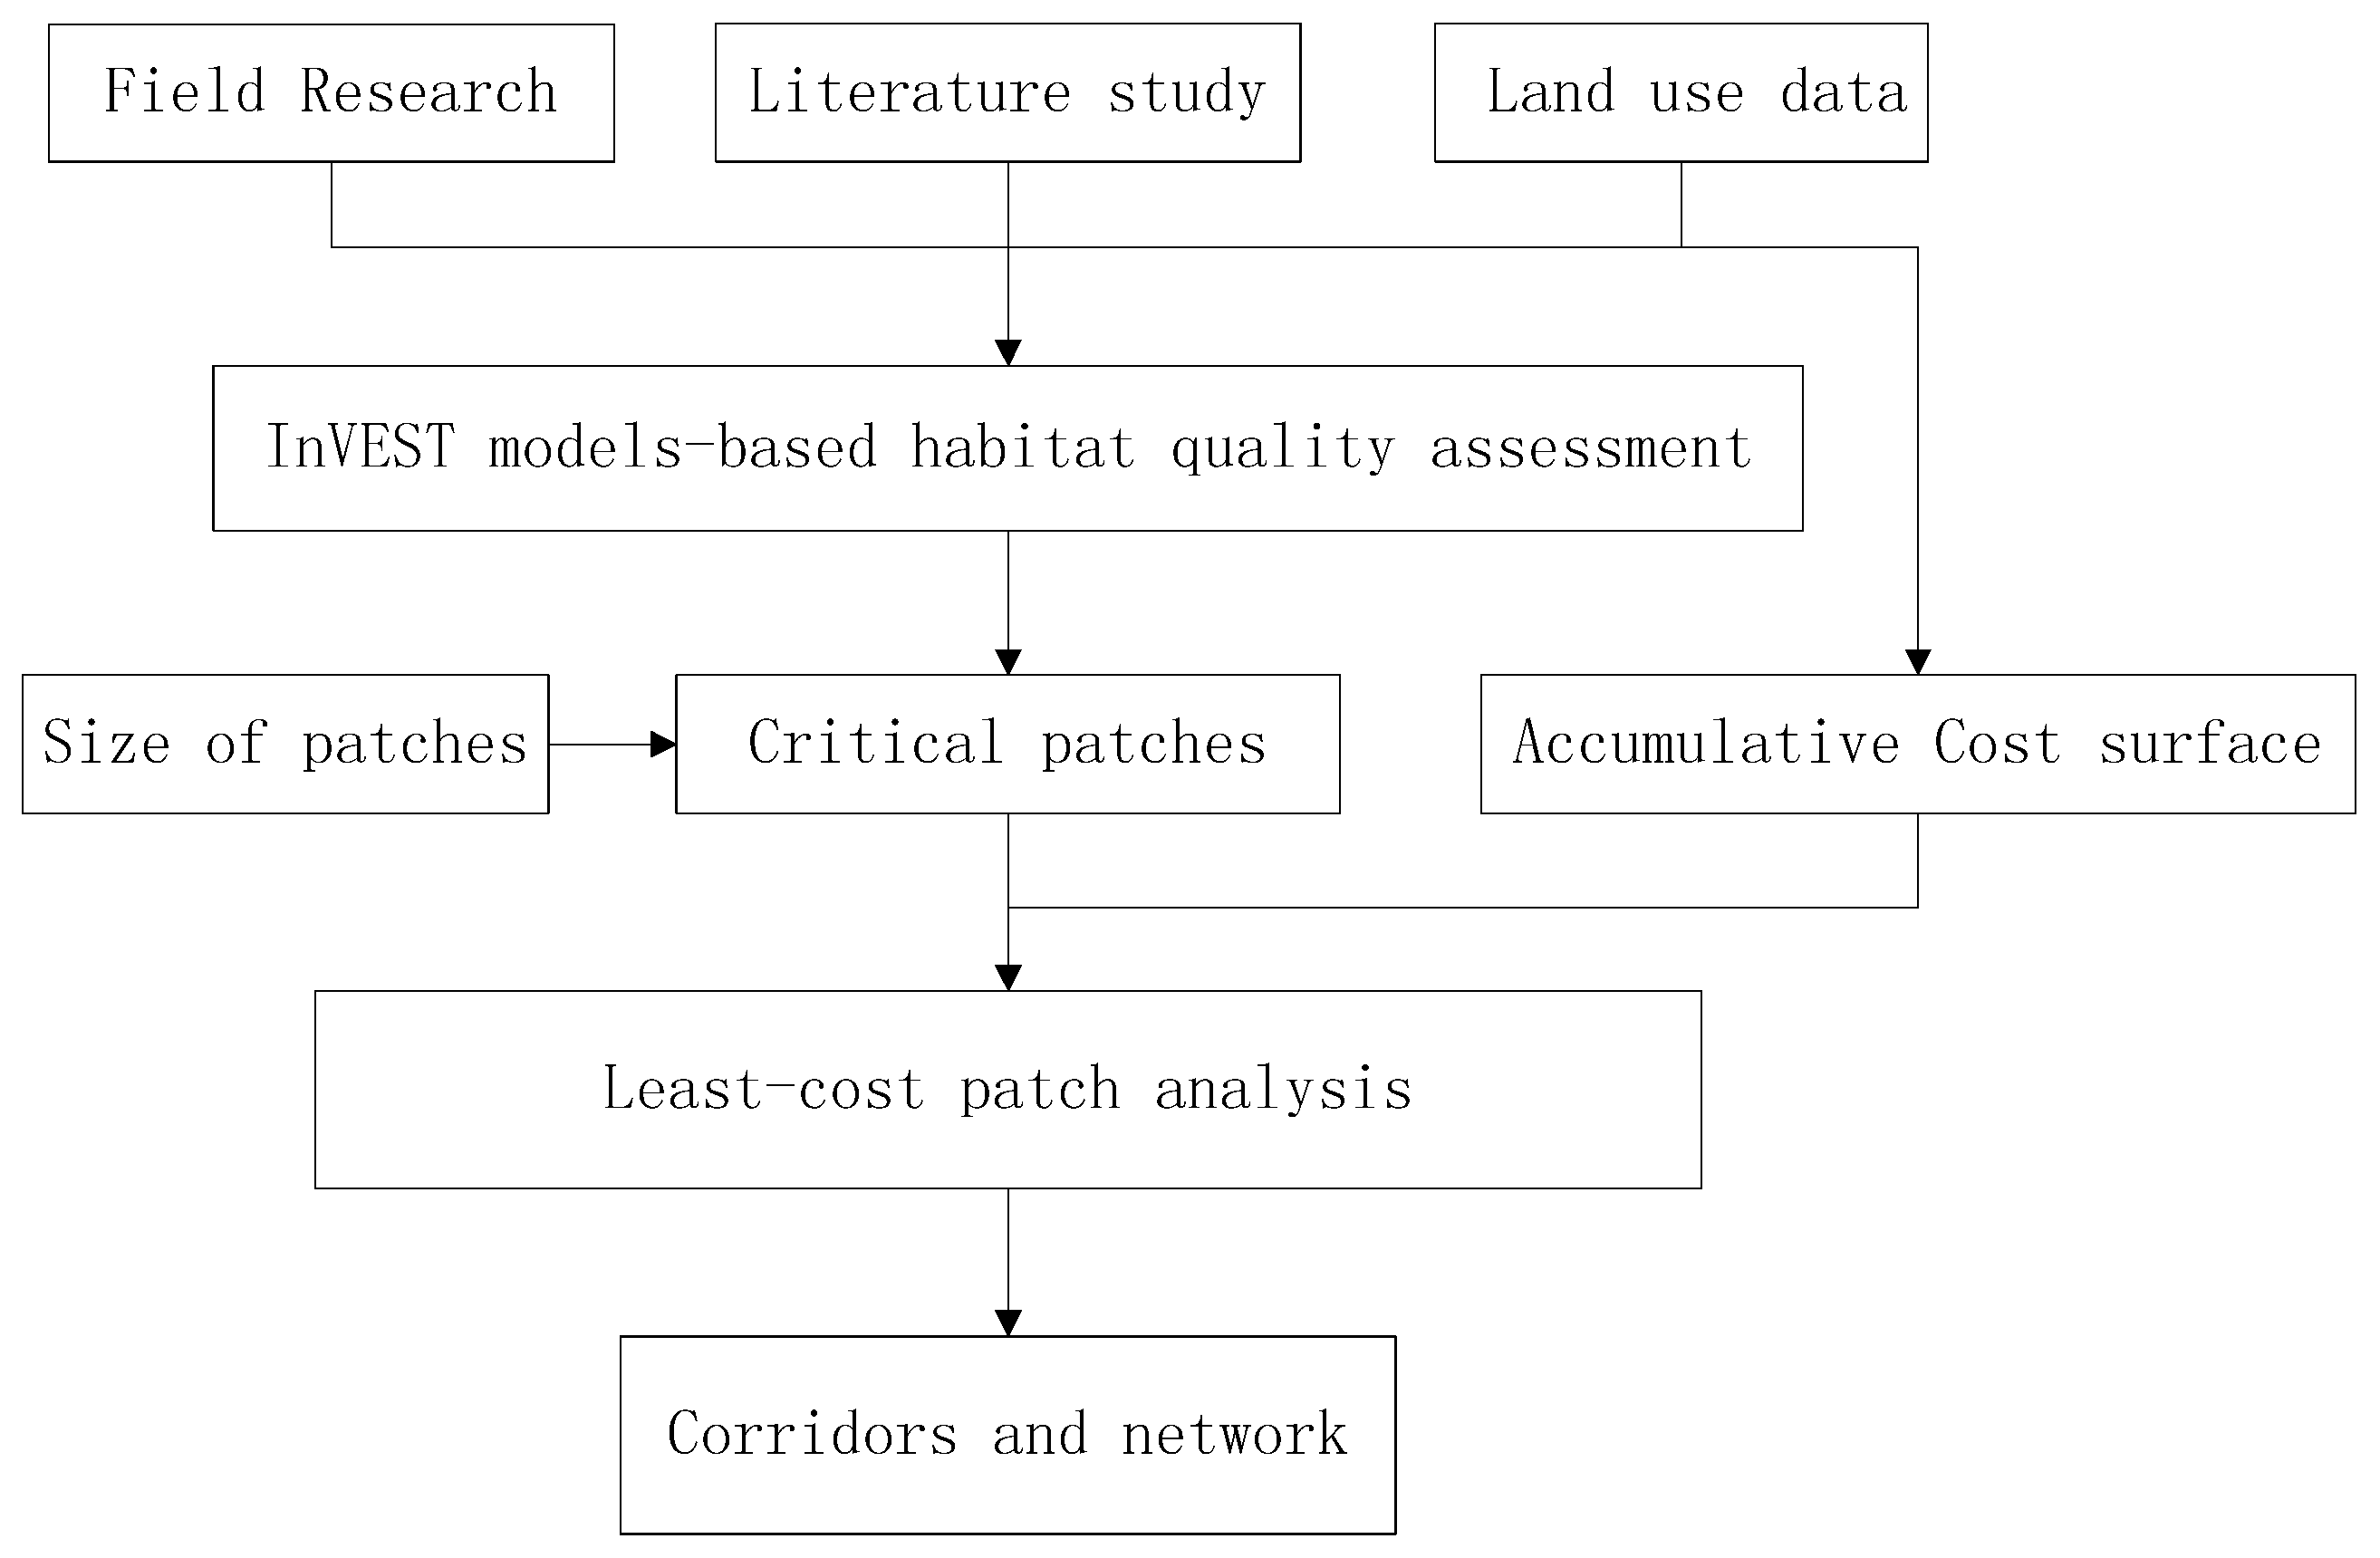
2.2. Methods
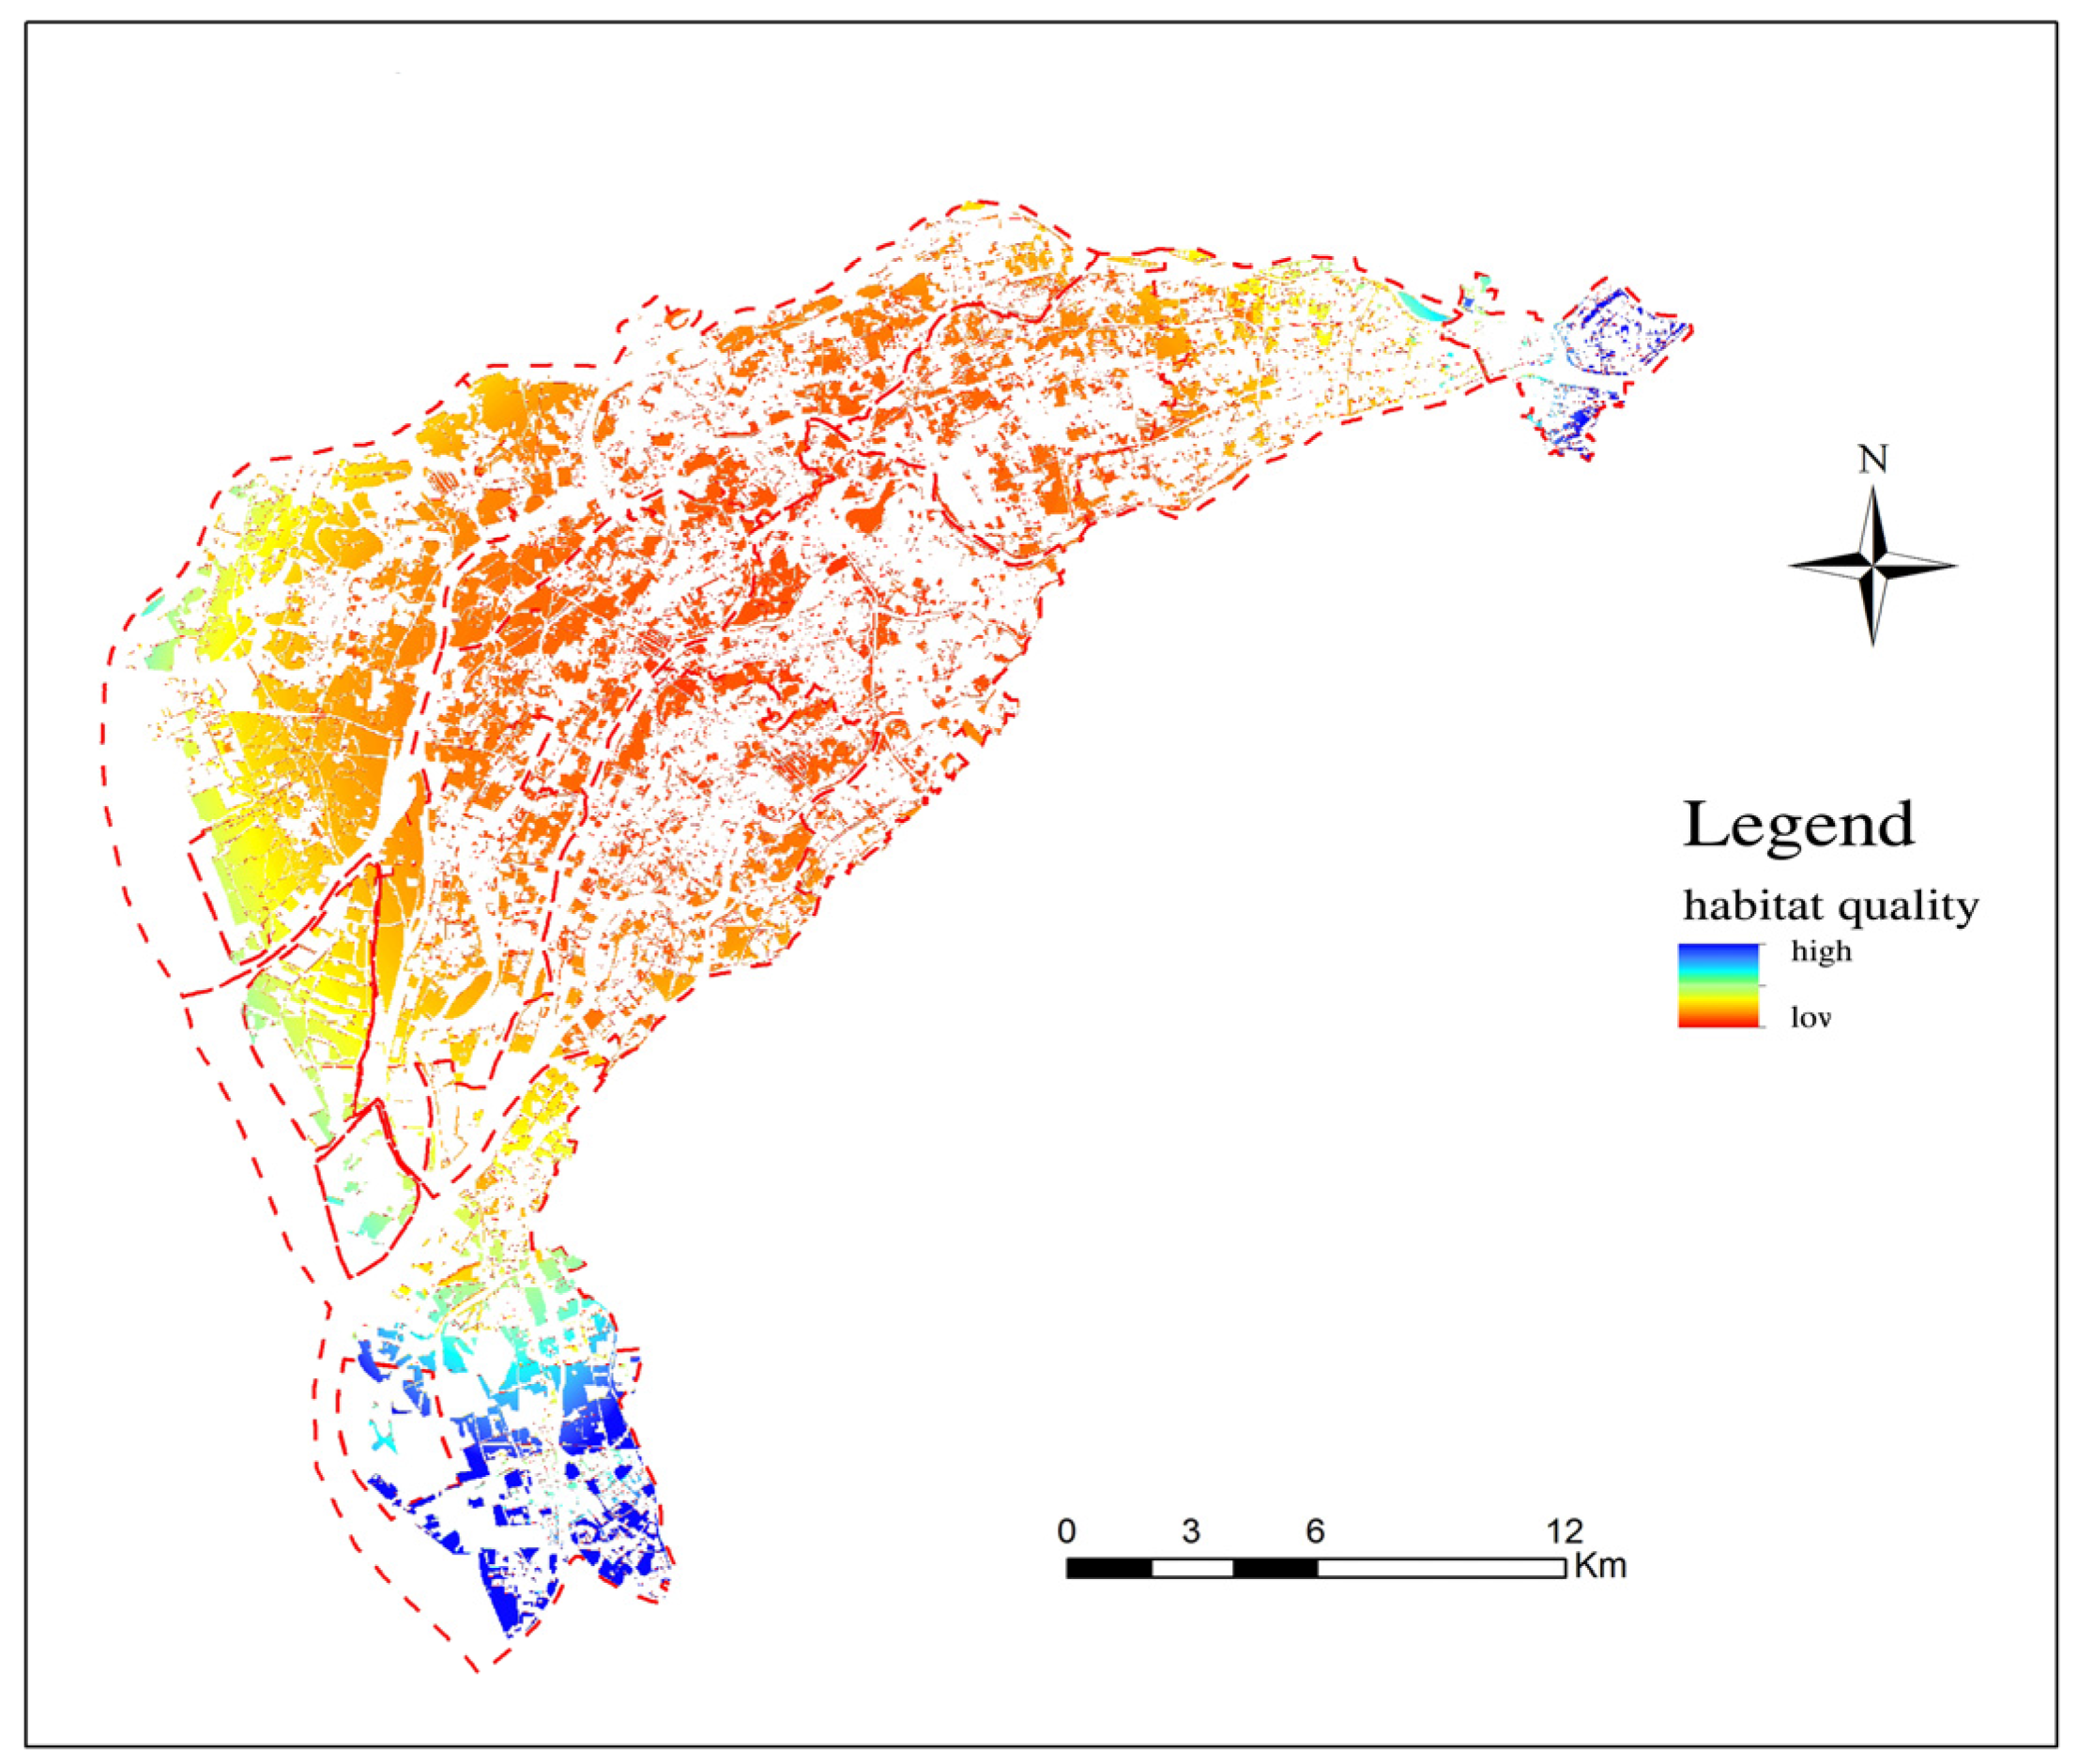
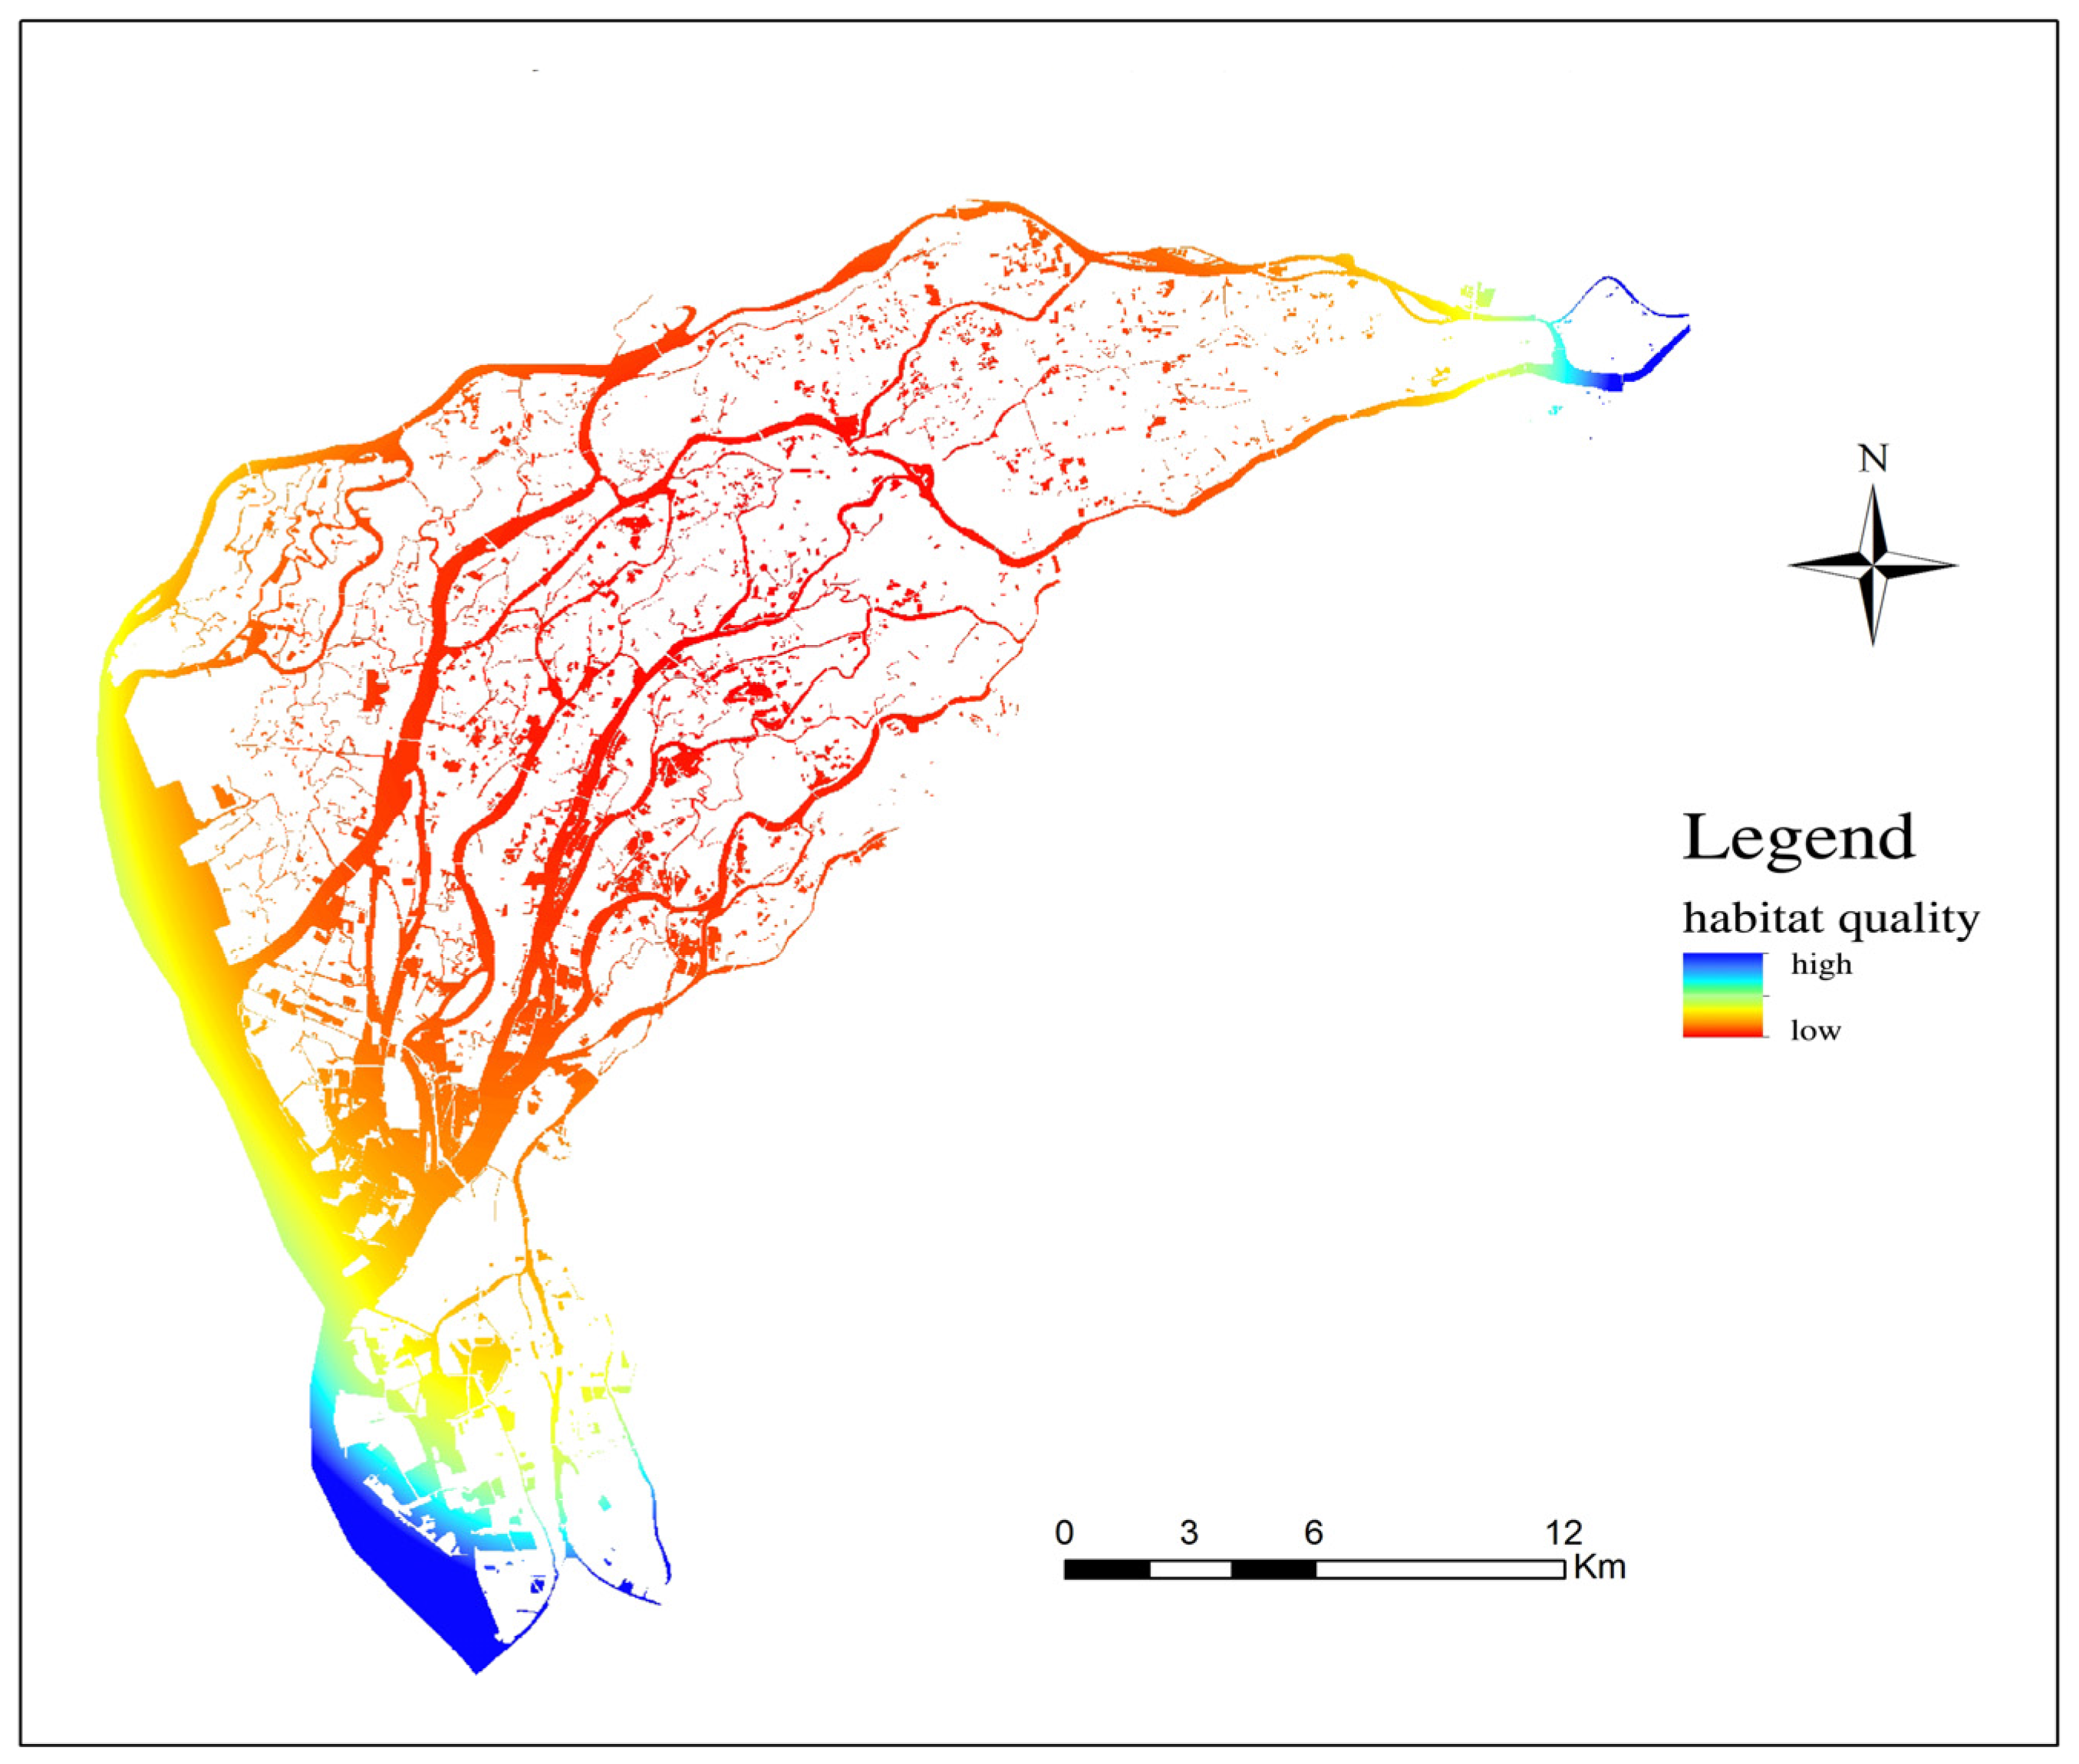
2.2.1. InVEST Model-Based Habitat Quality Estimation and Identification of Critical Patches
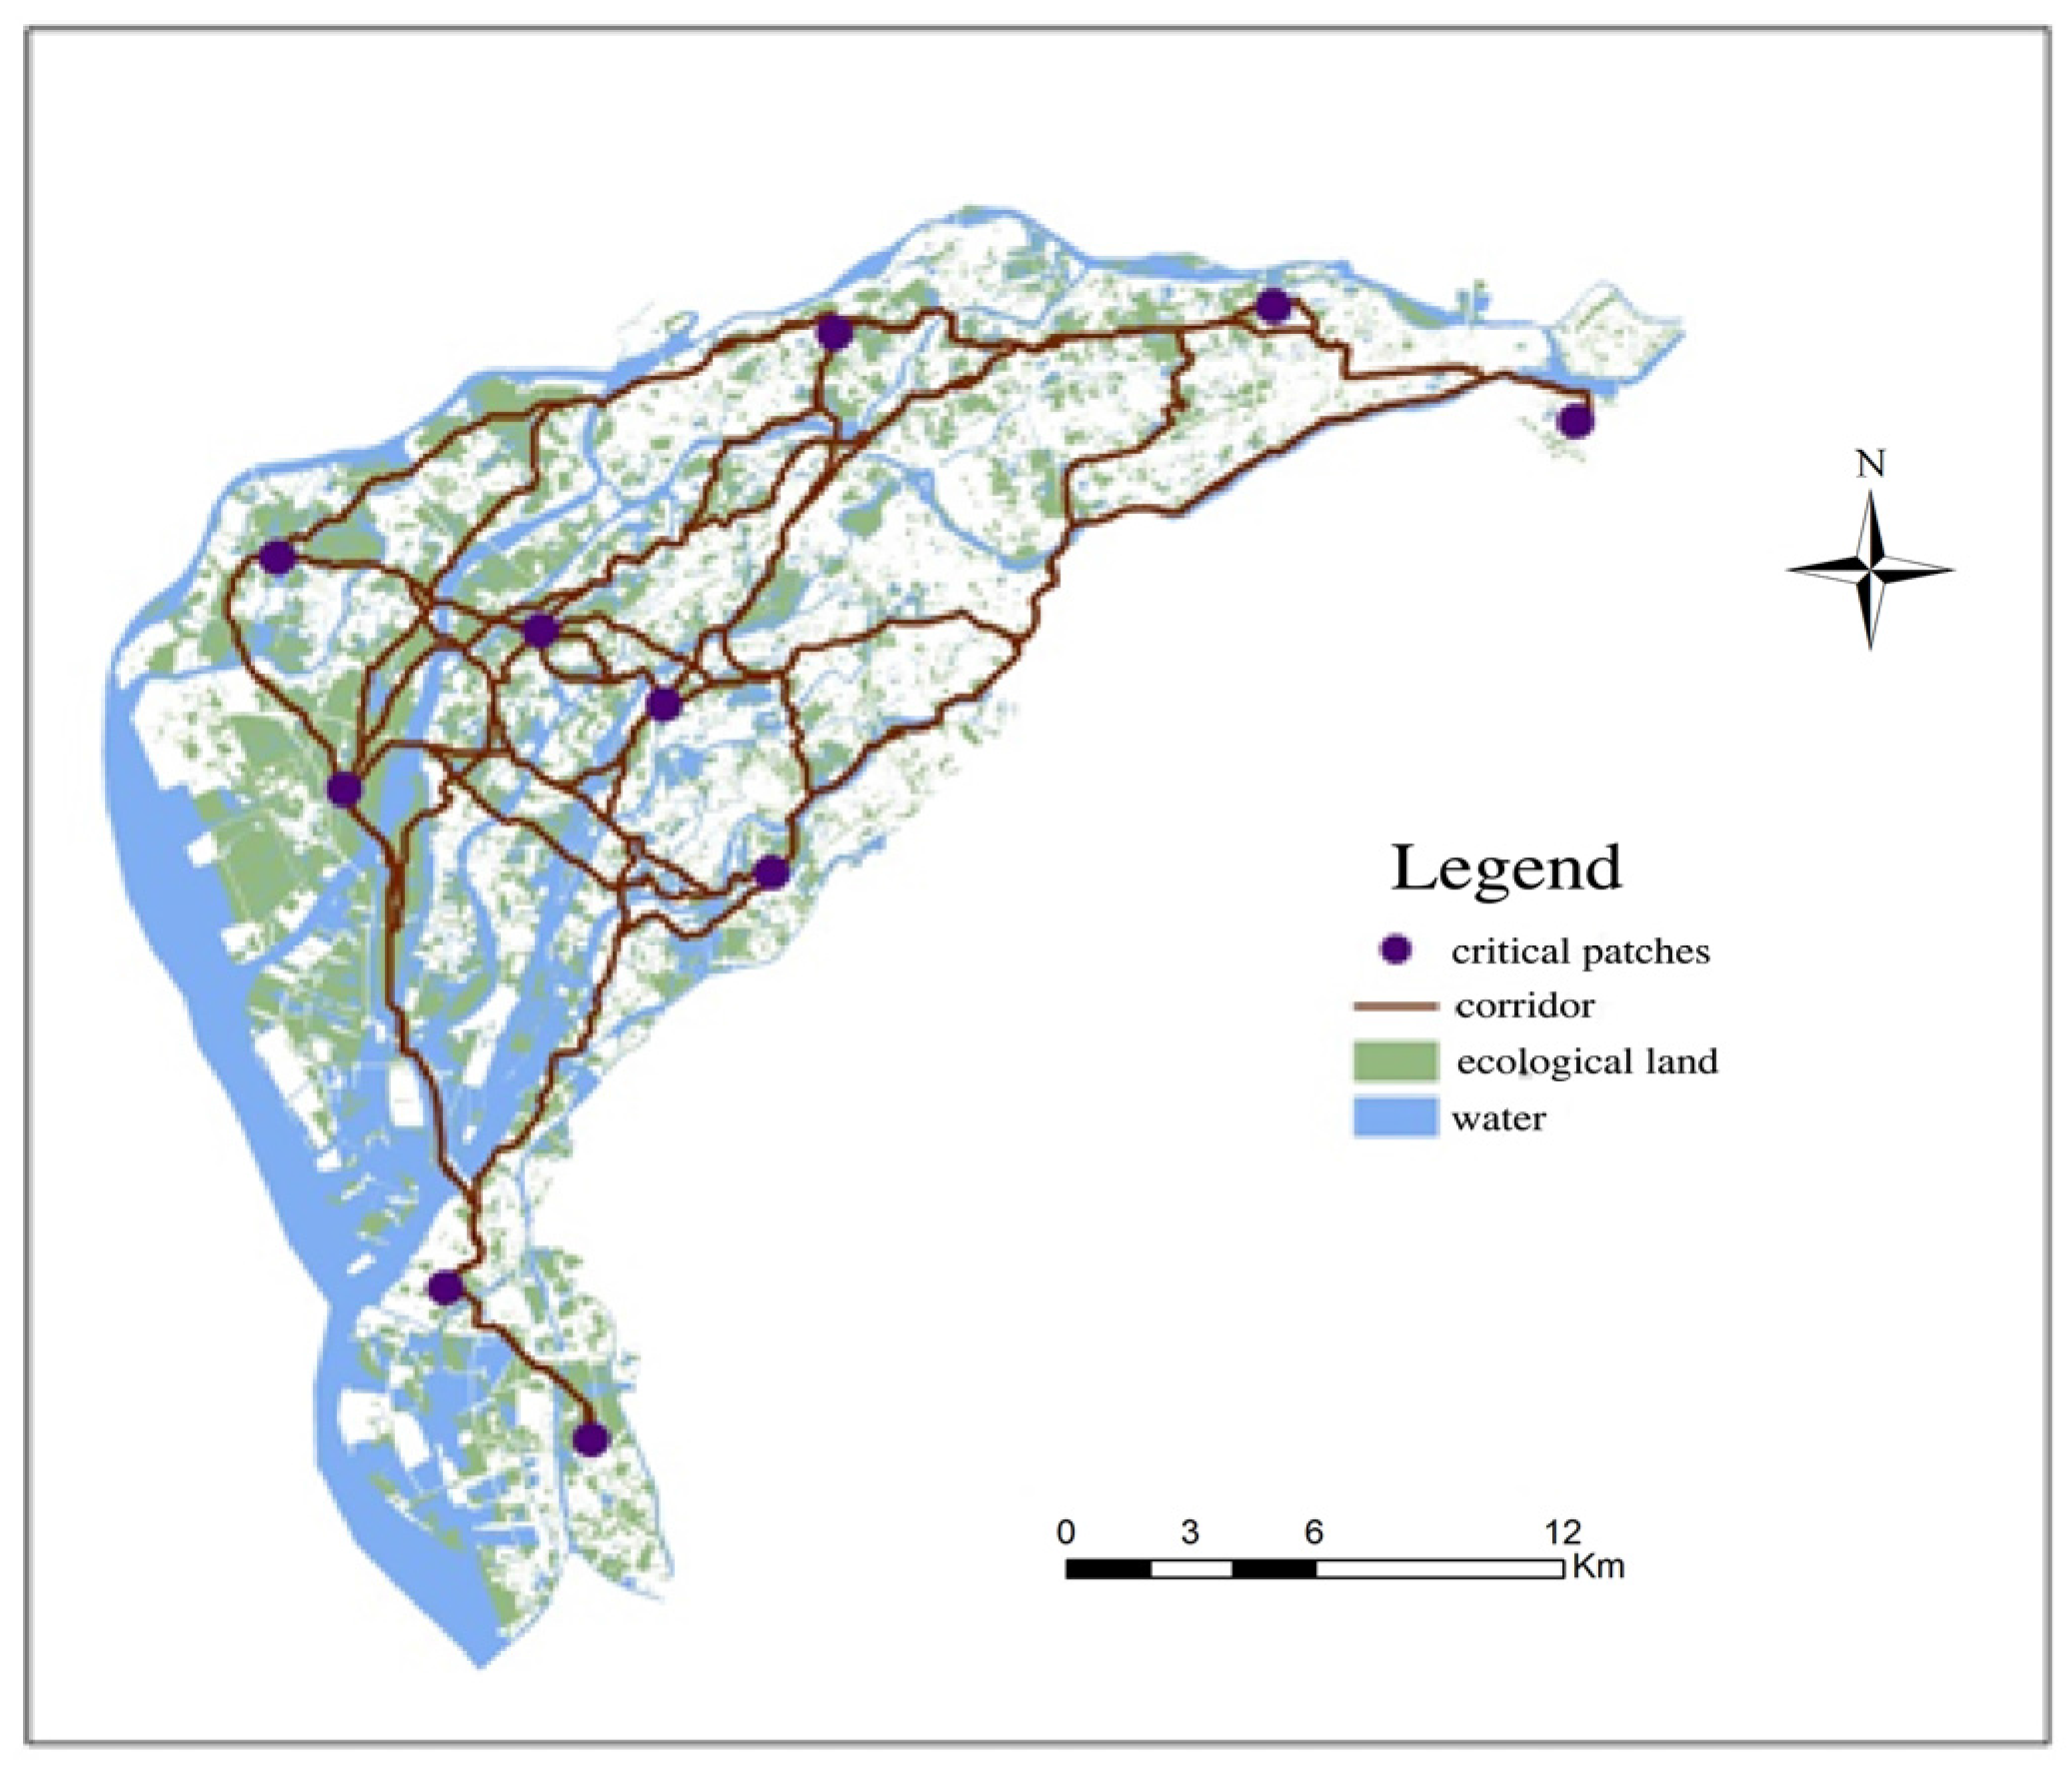
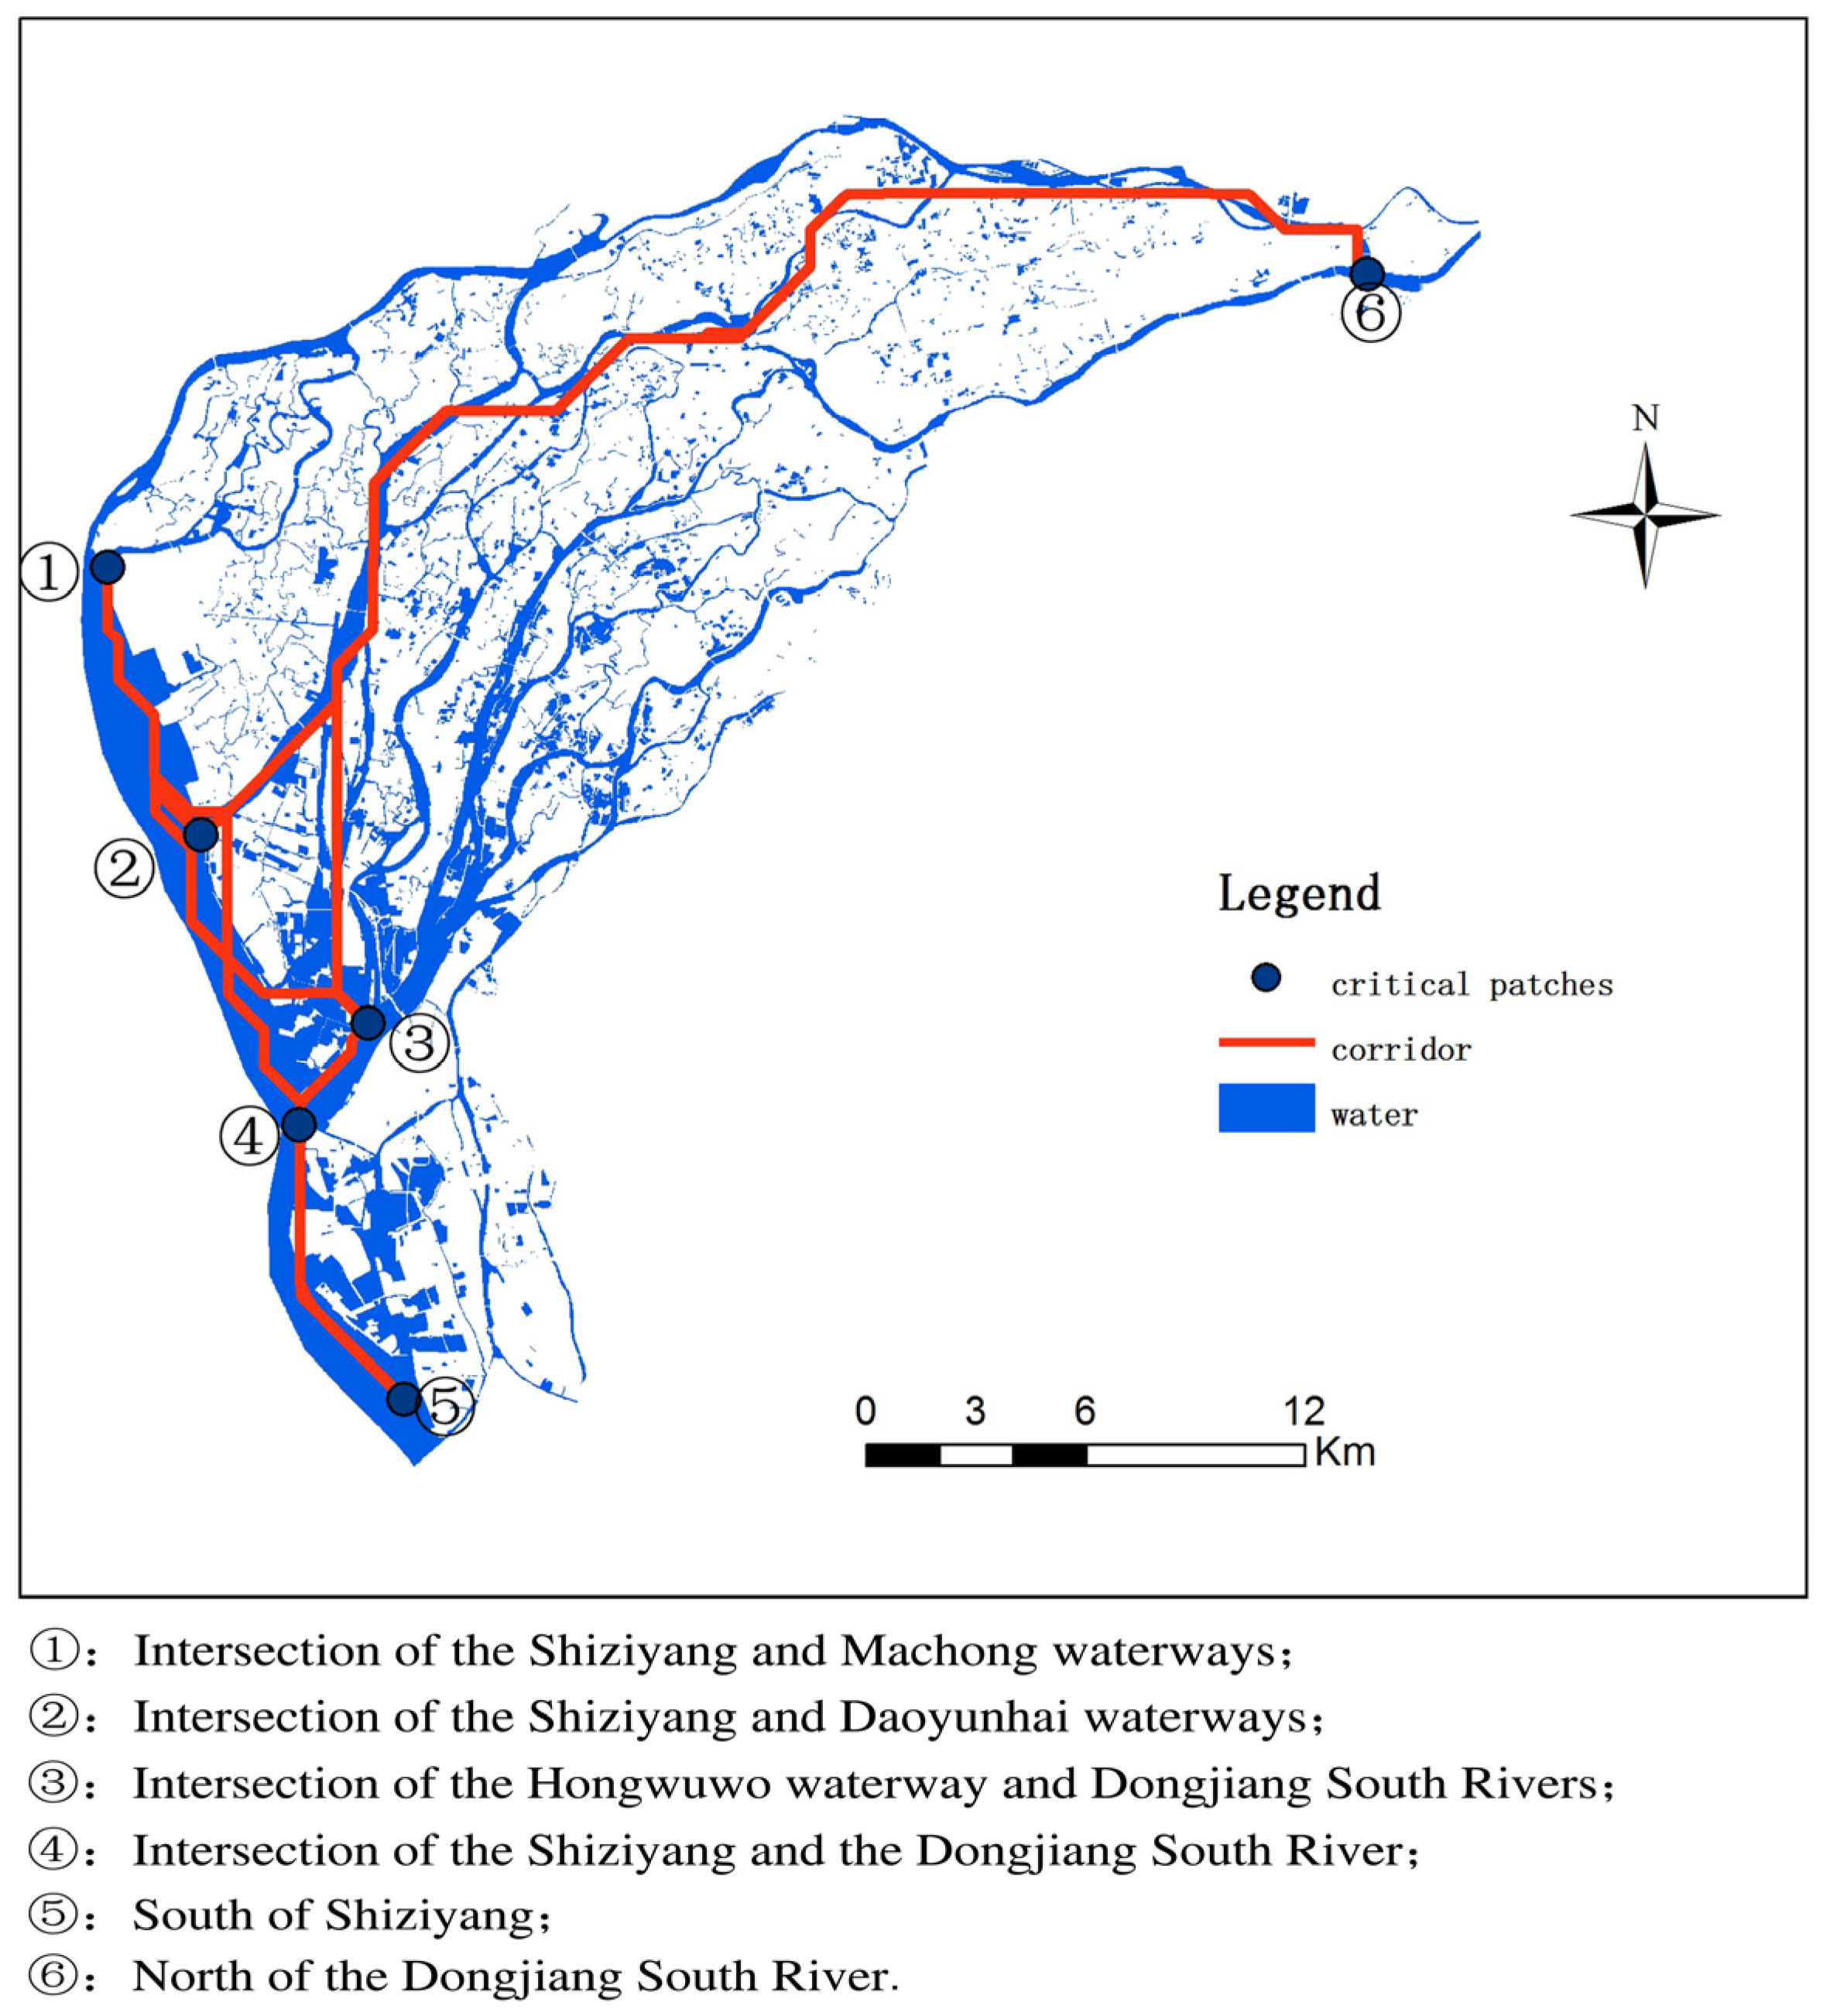
2.2.2. LCP Model-Based Identification of Corridors
3. Results
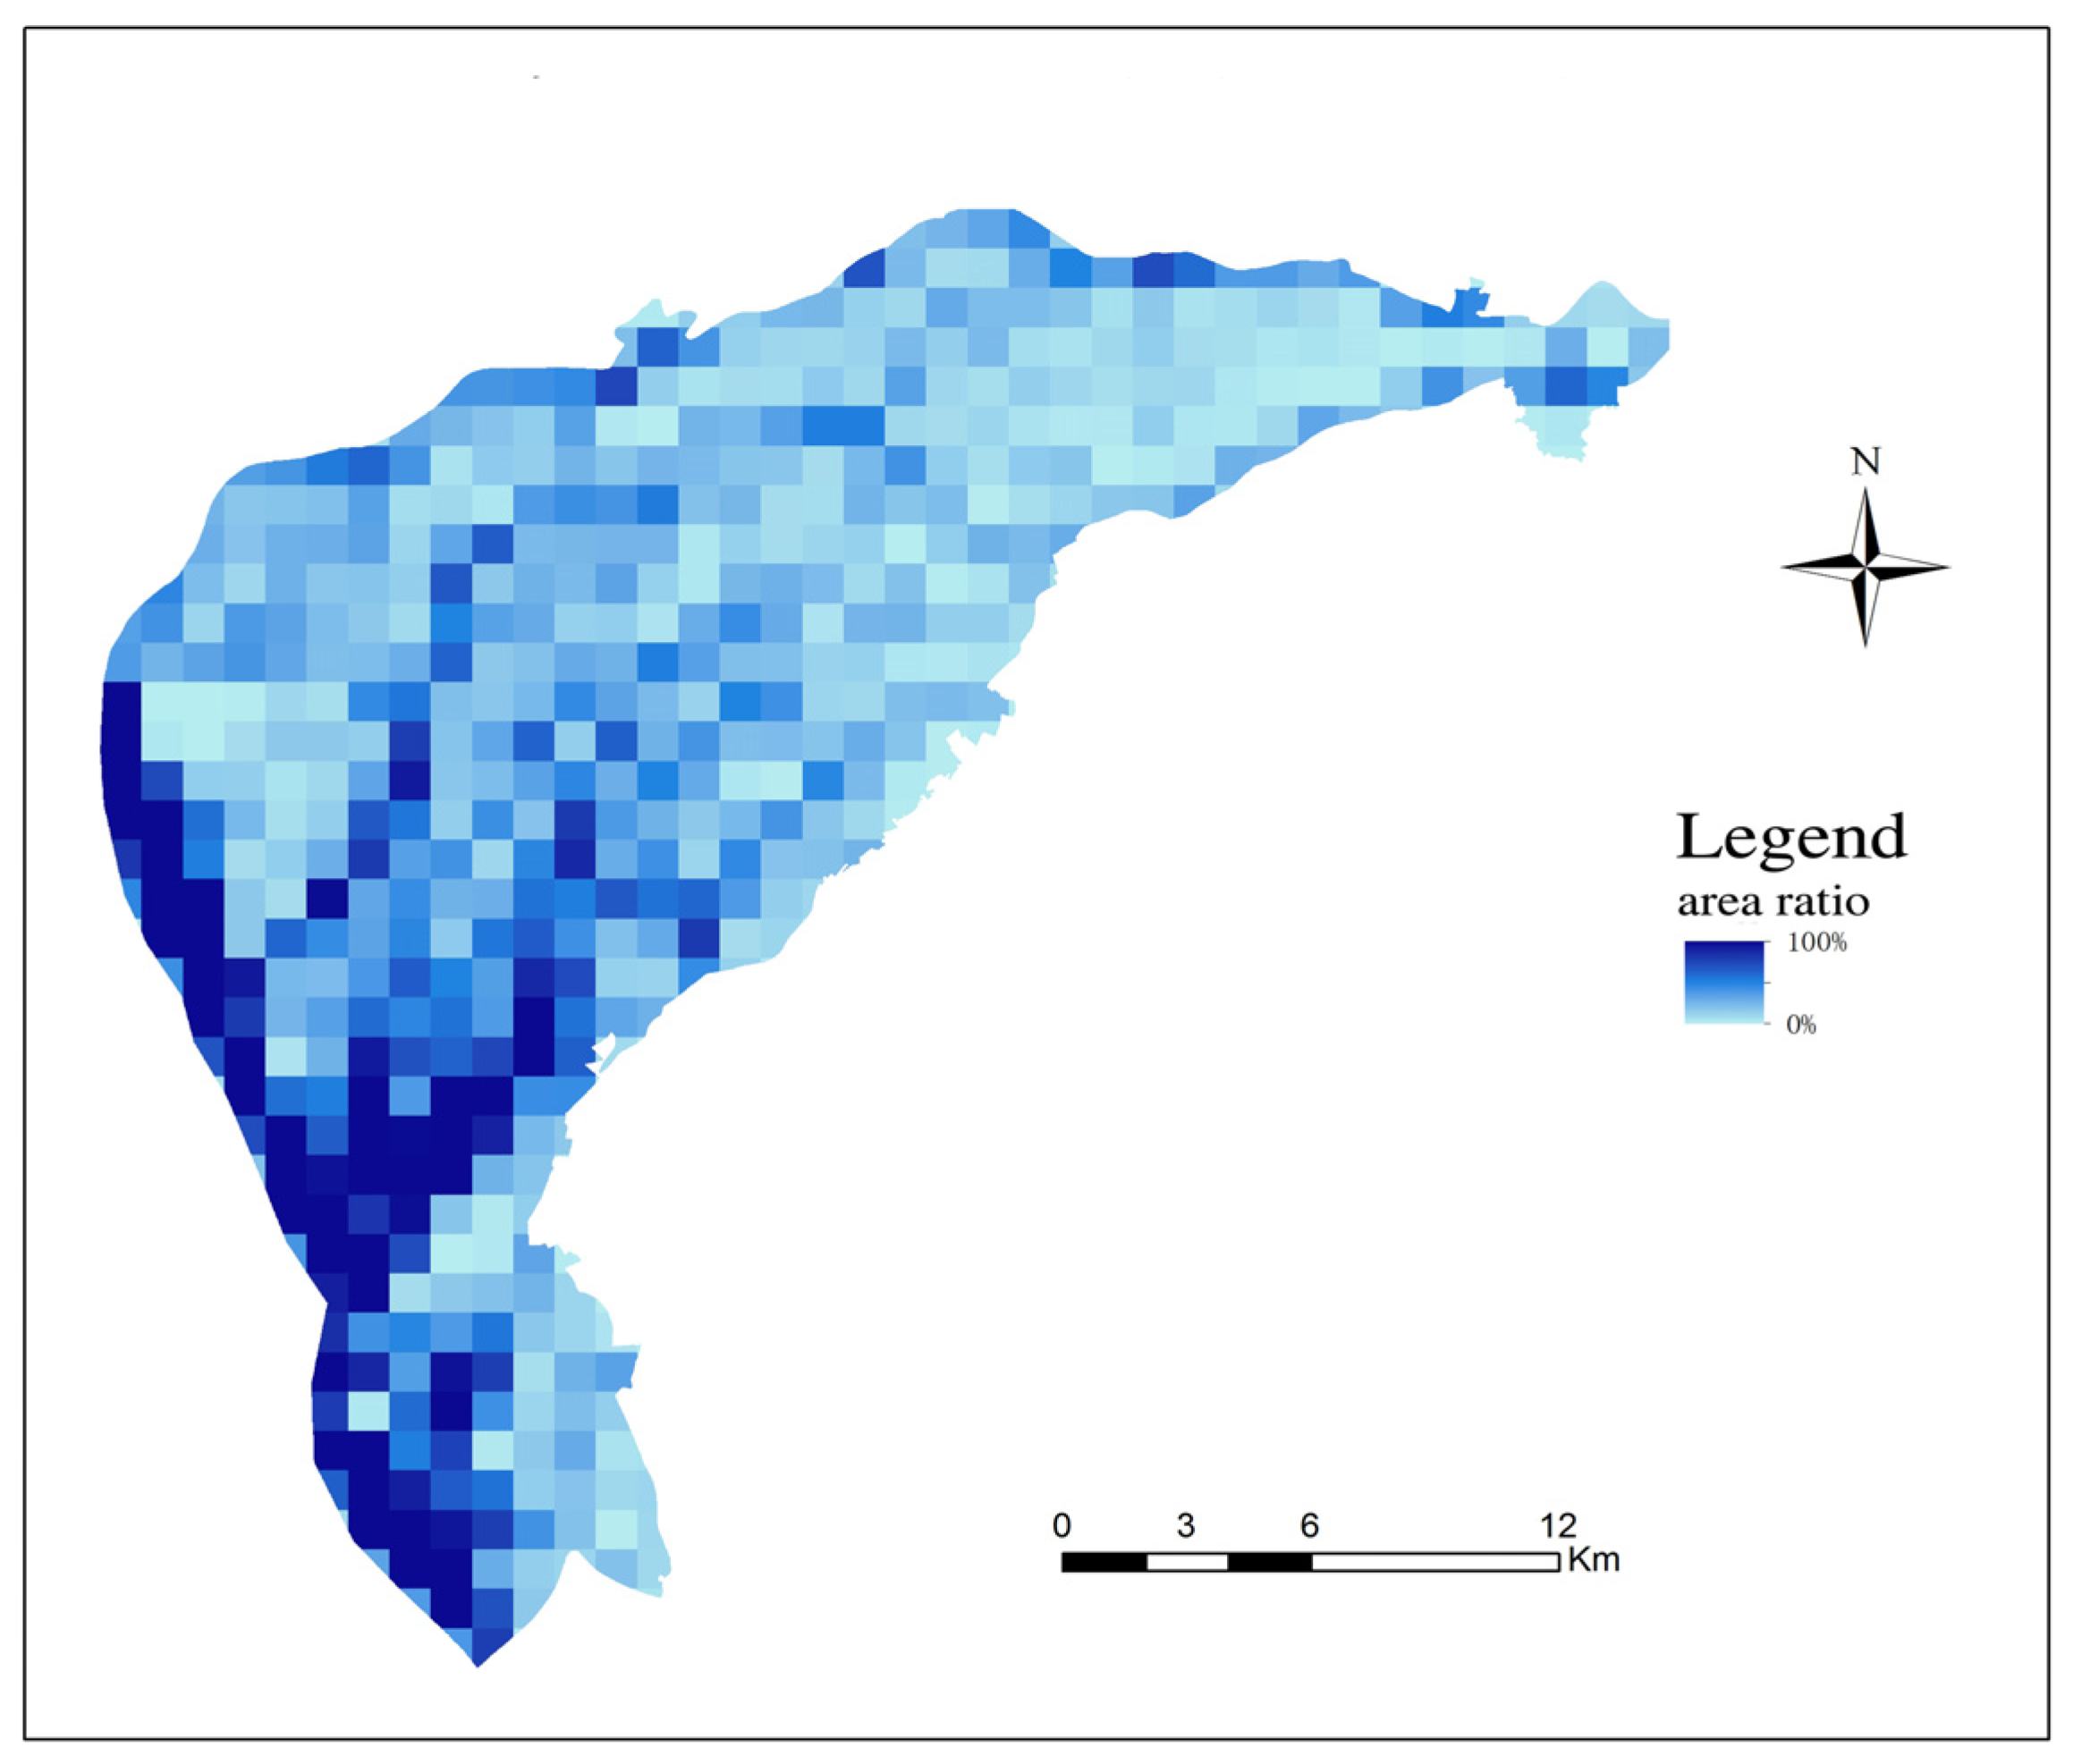
3.1. The Ecological Network of the Blue Landscape
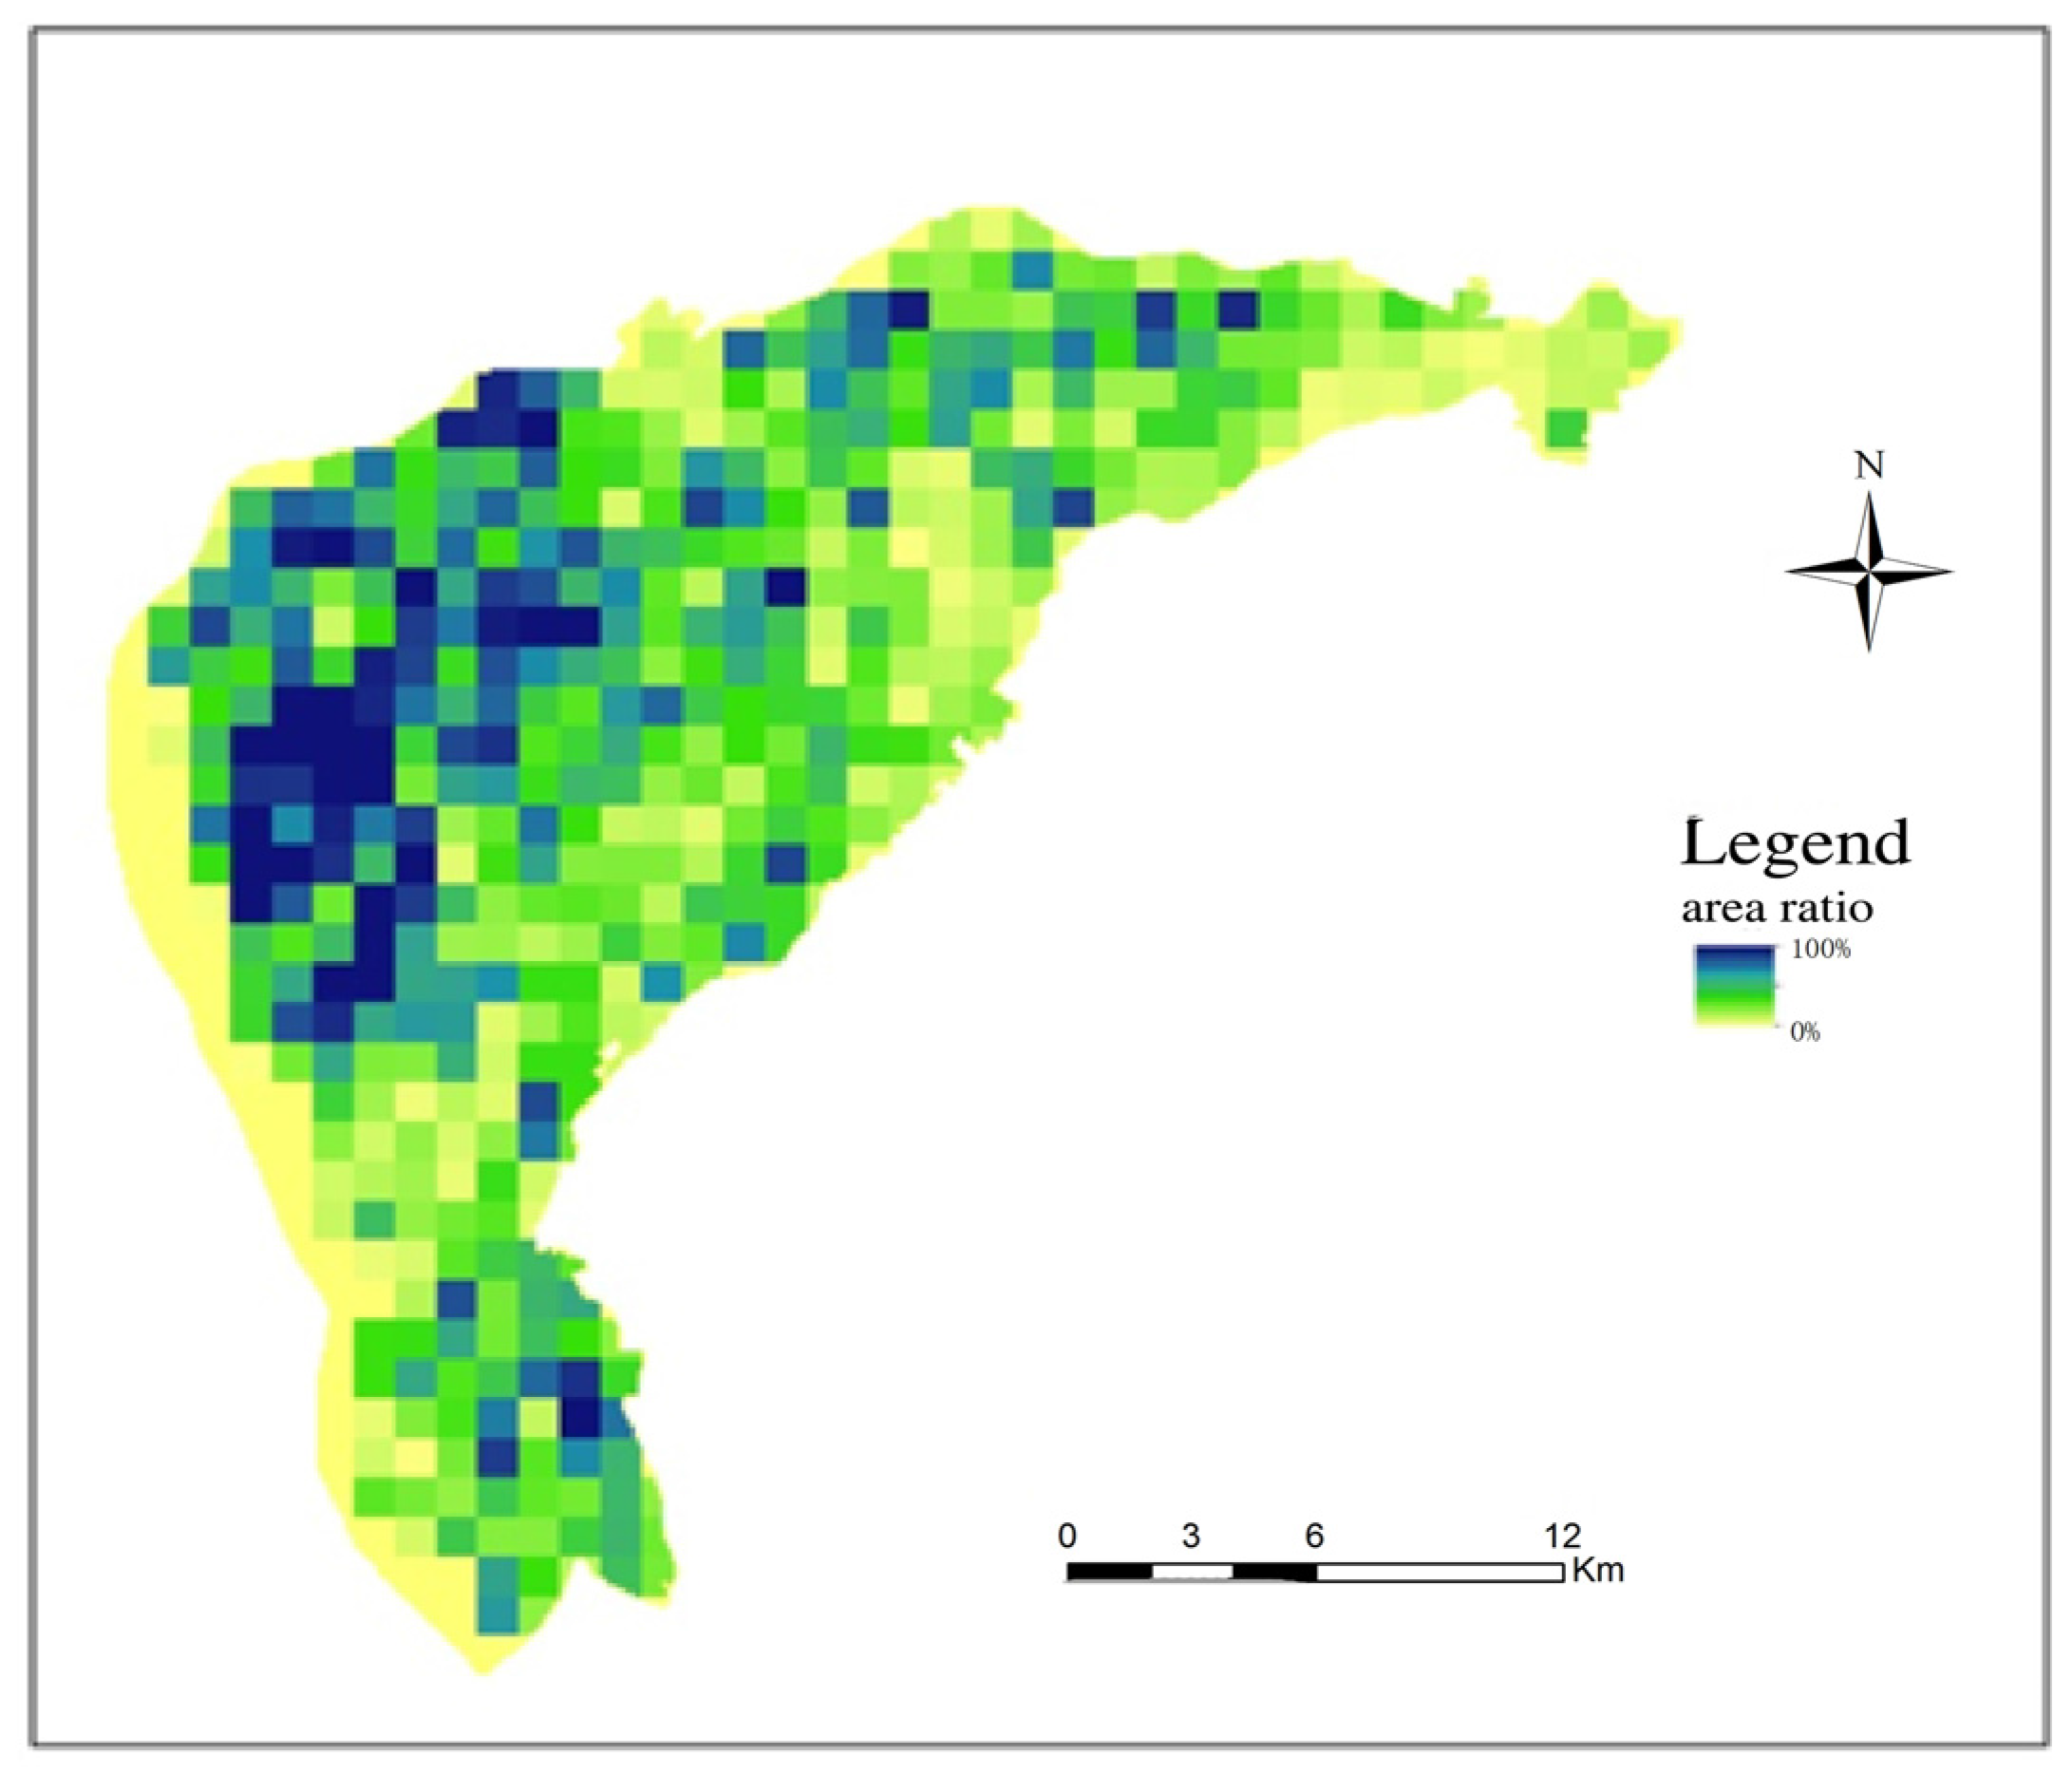
3.2. The Ecological Network Patterns of the Green Landscape
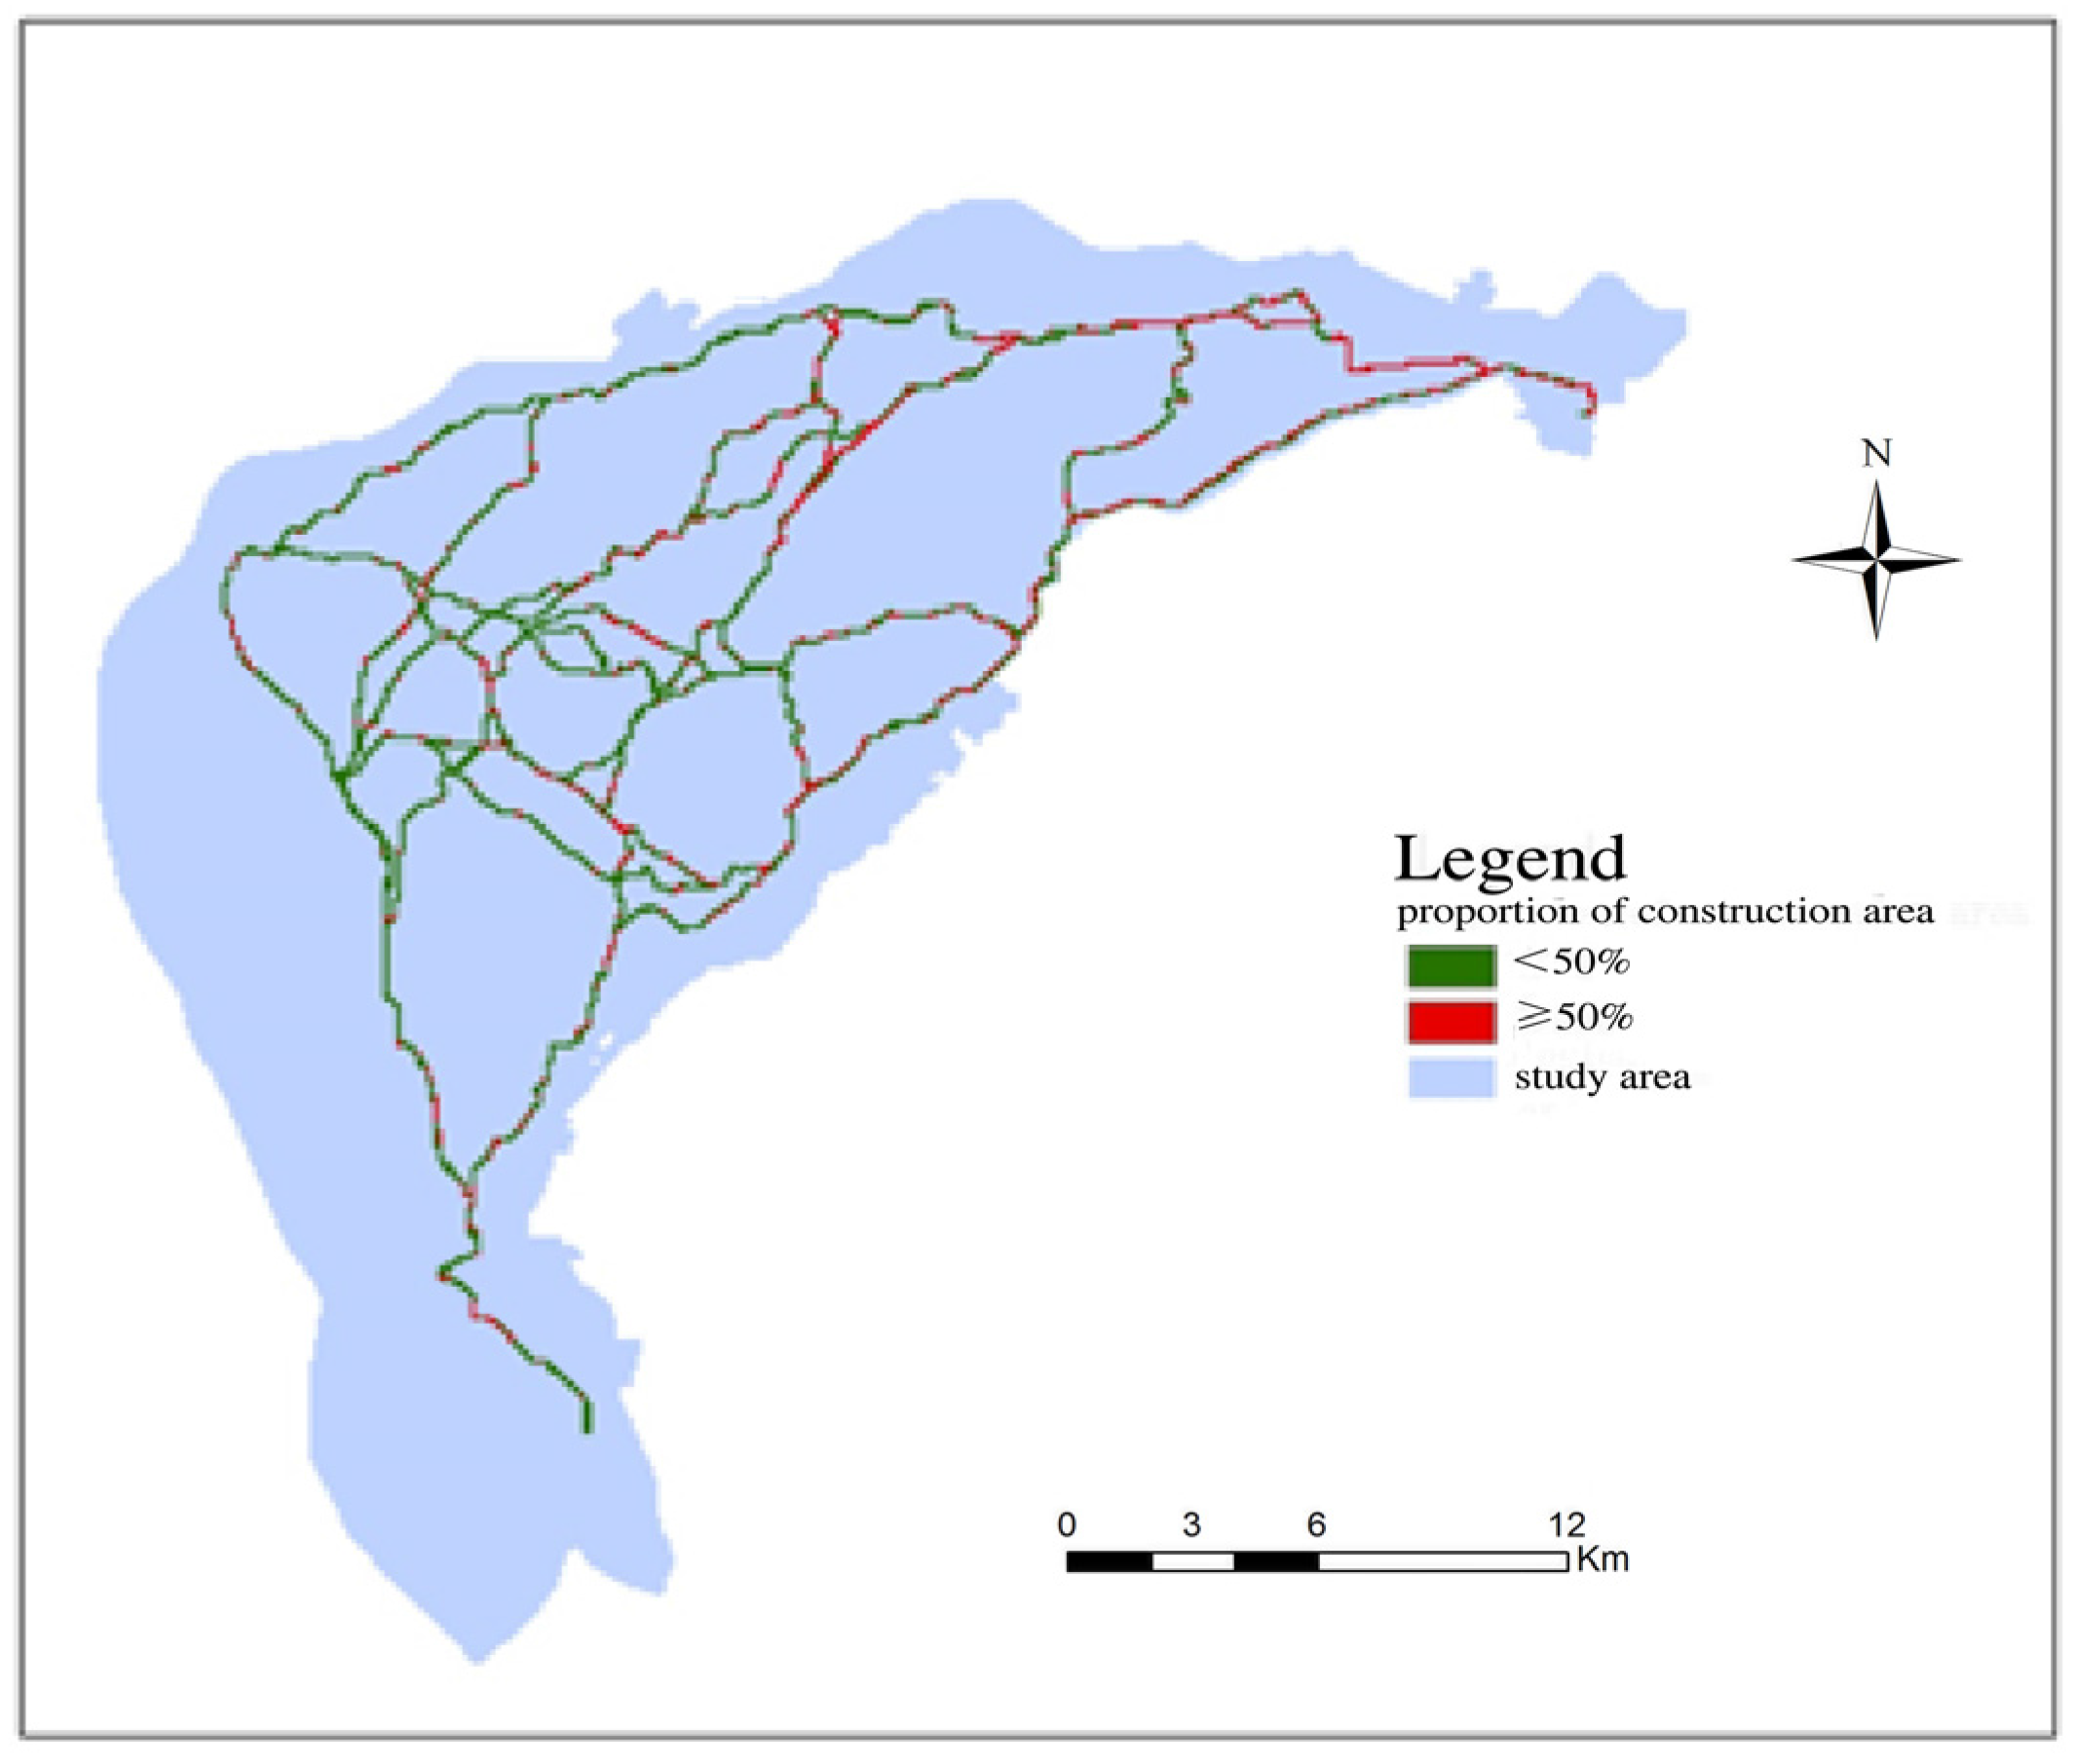
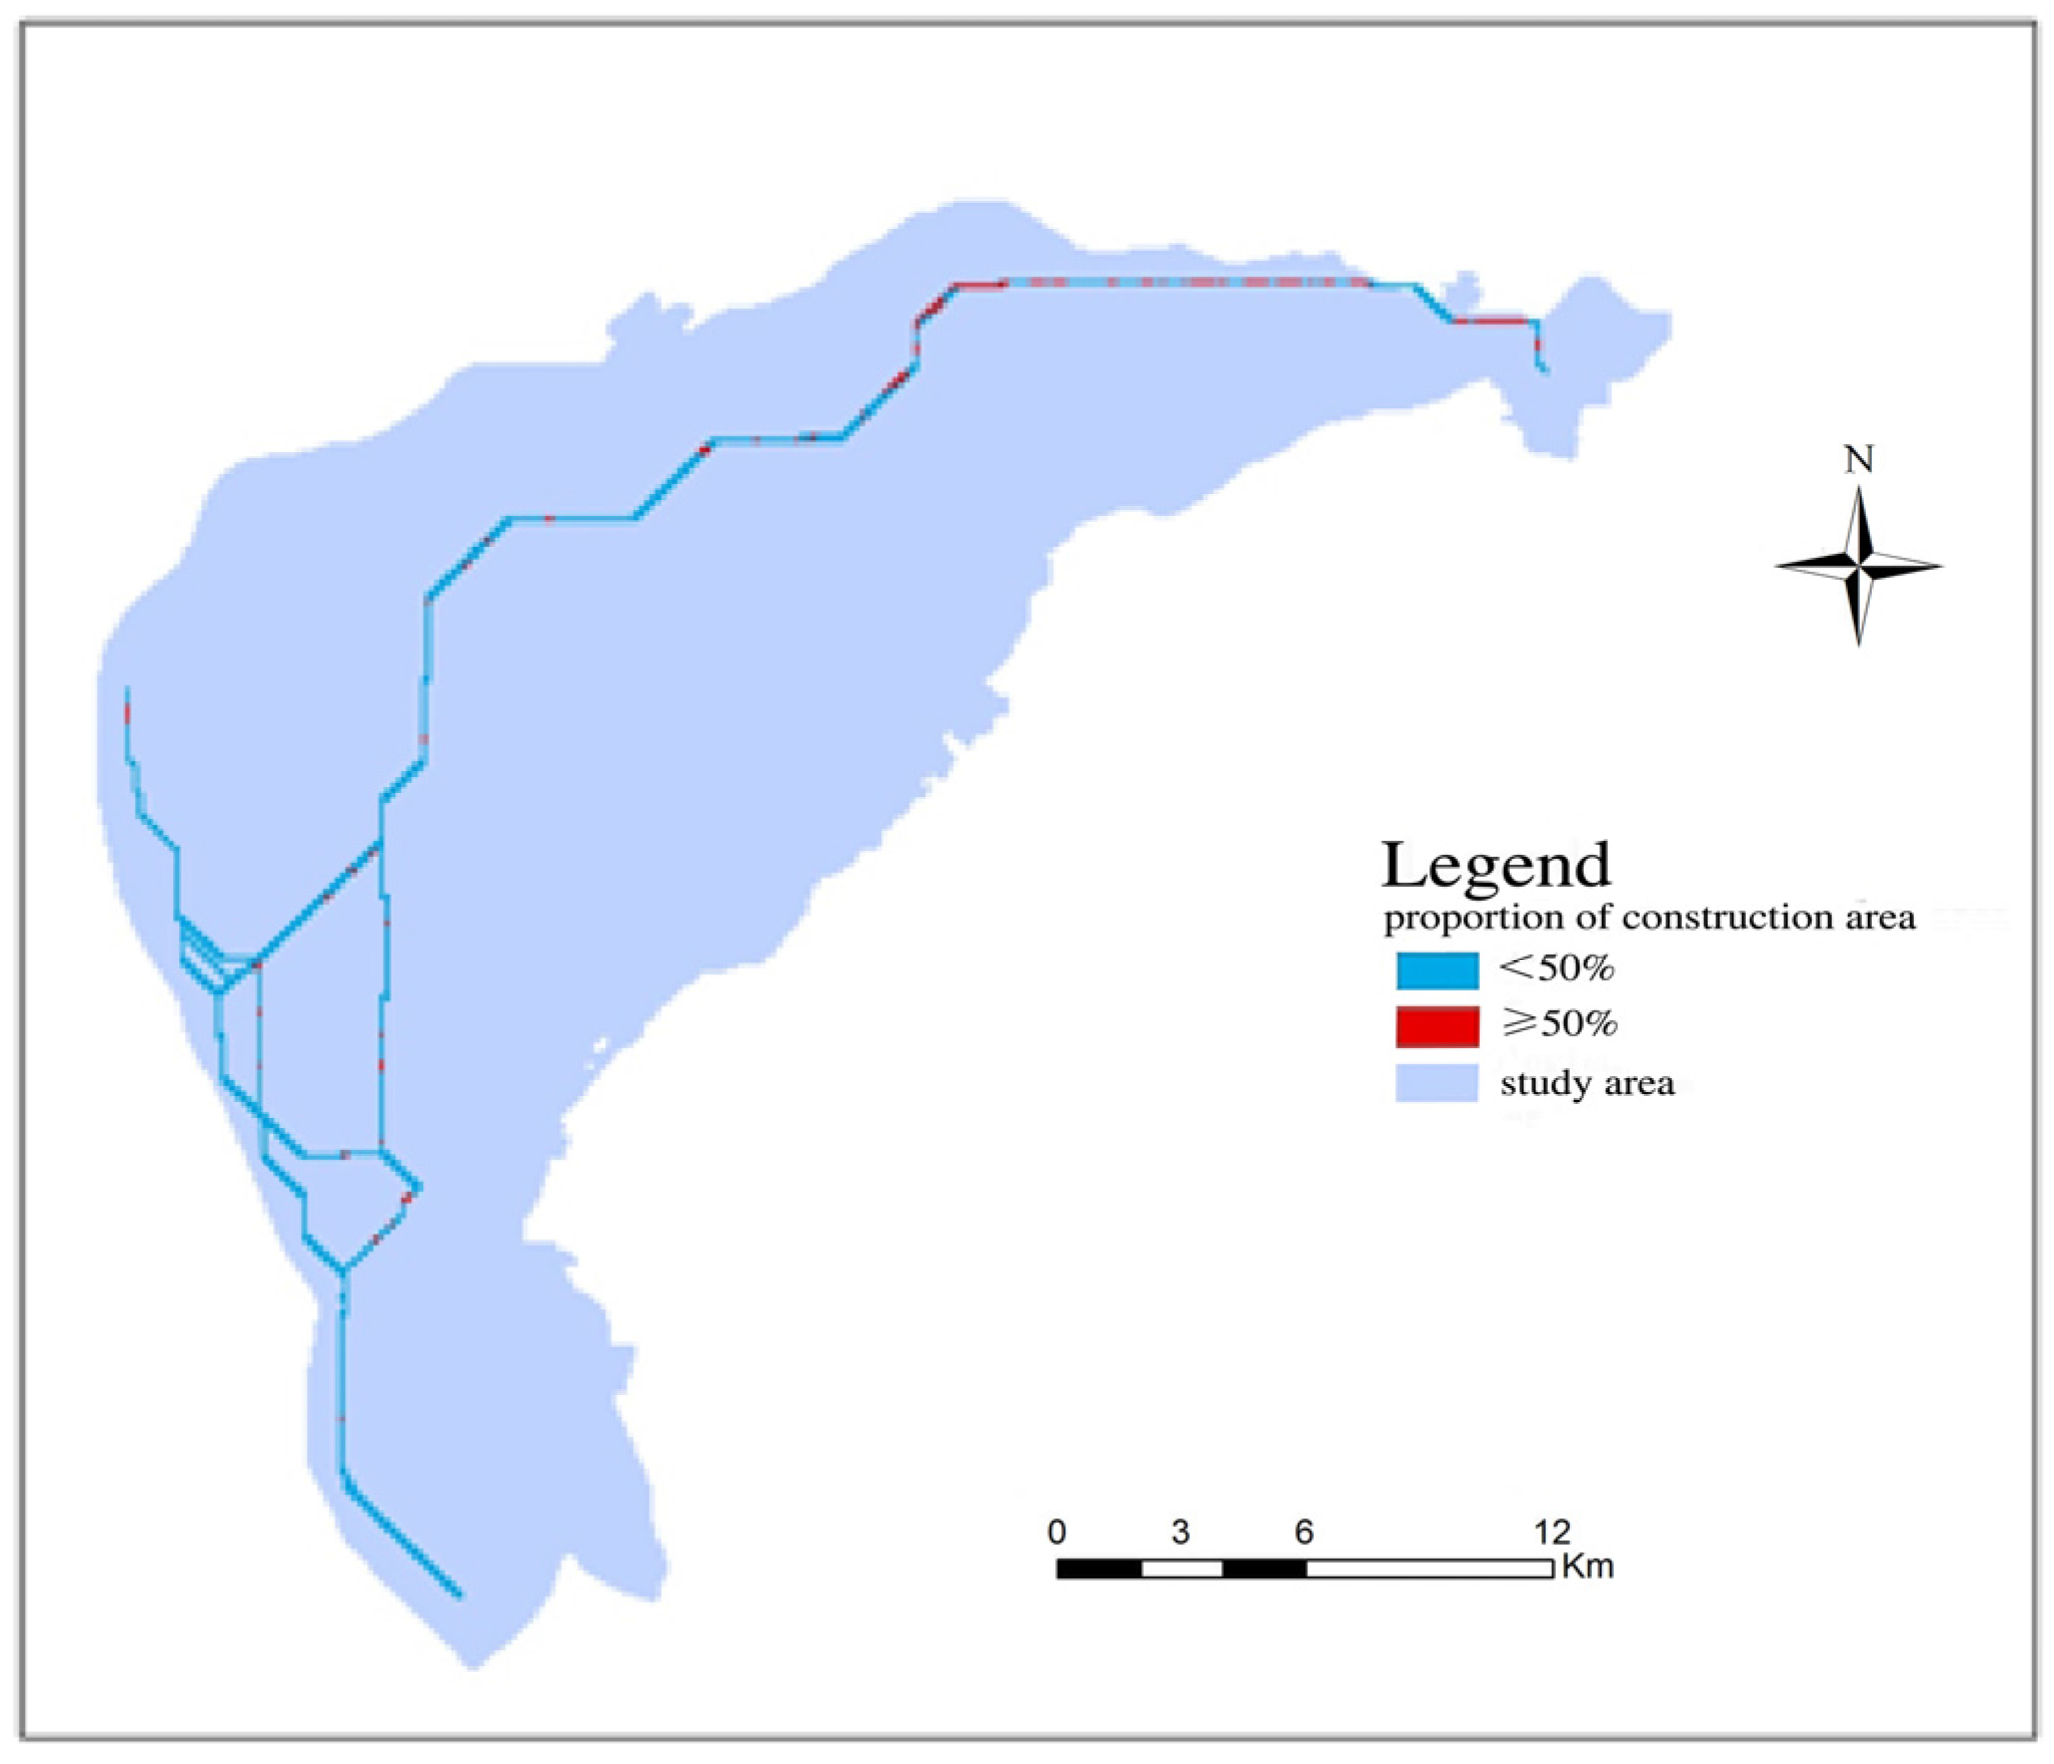
3.3. Identification of Ecologically Fragile Areas Impacted by Human Activities
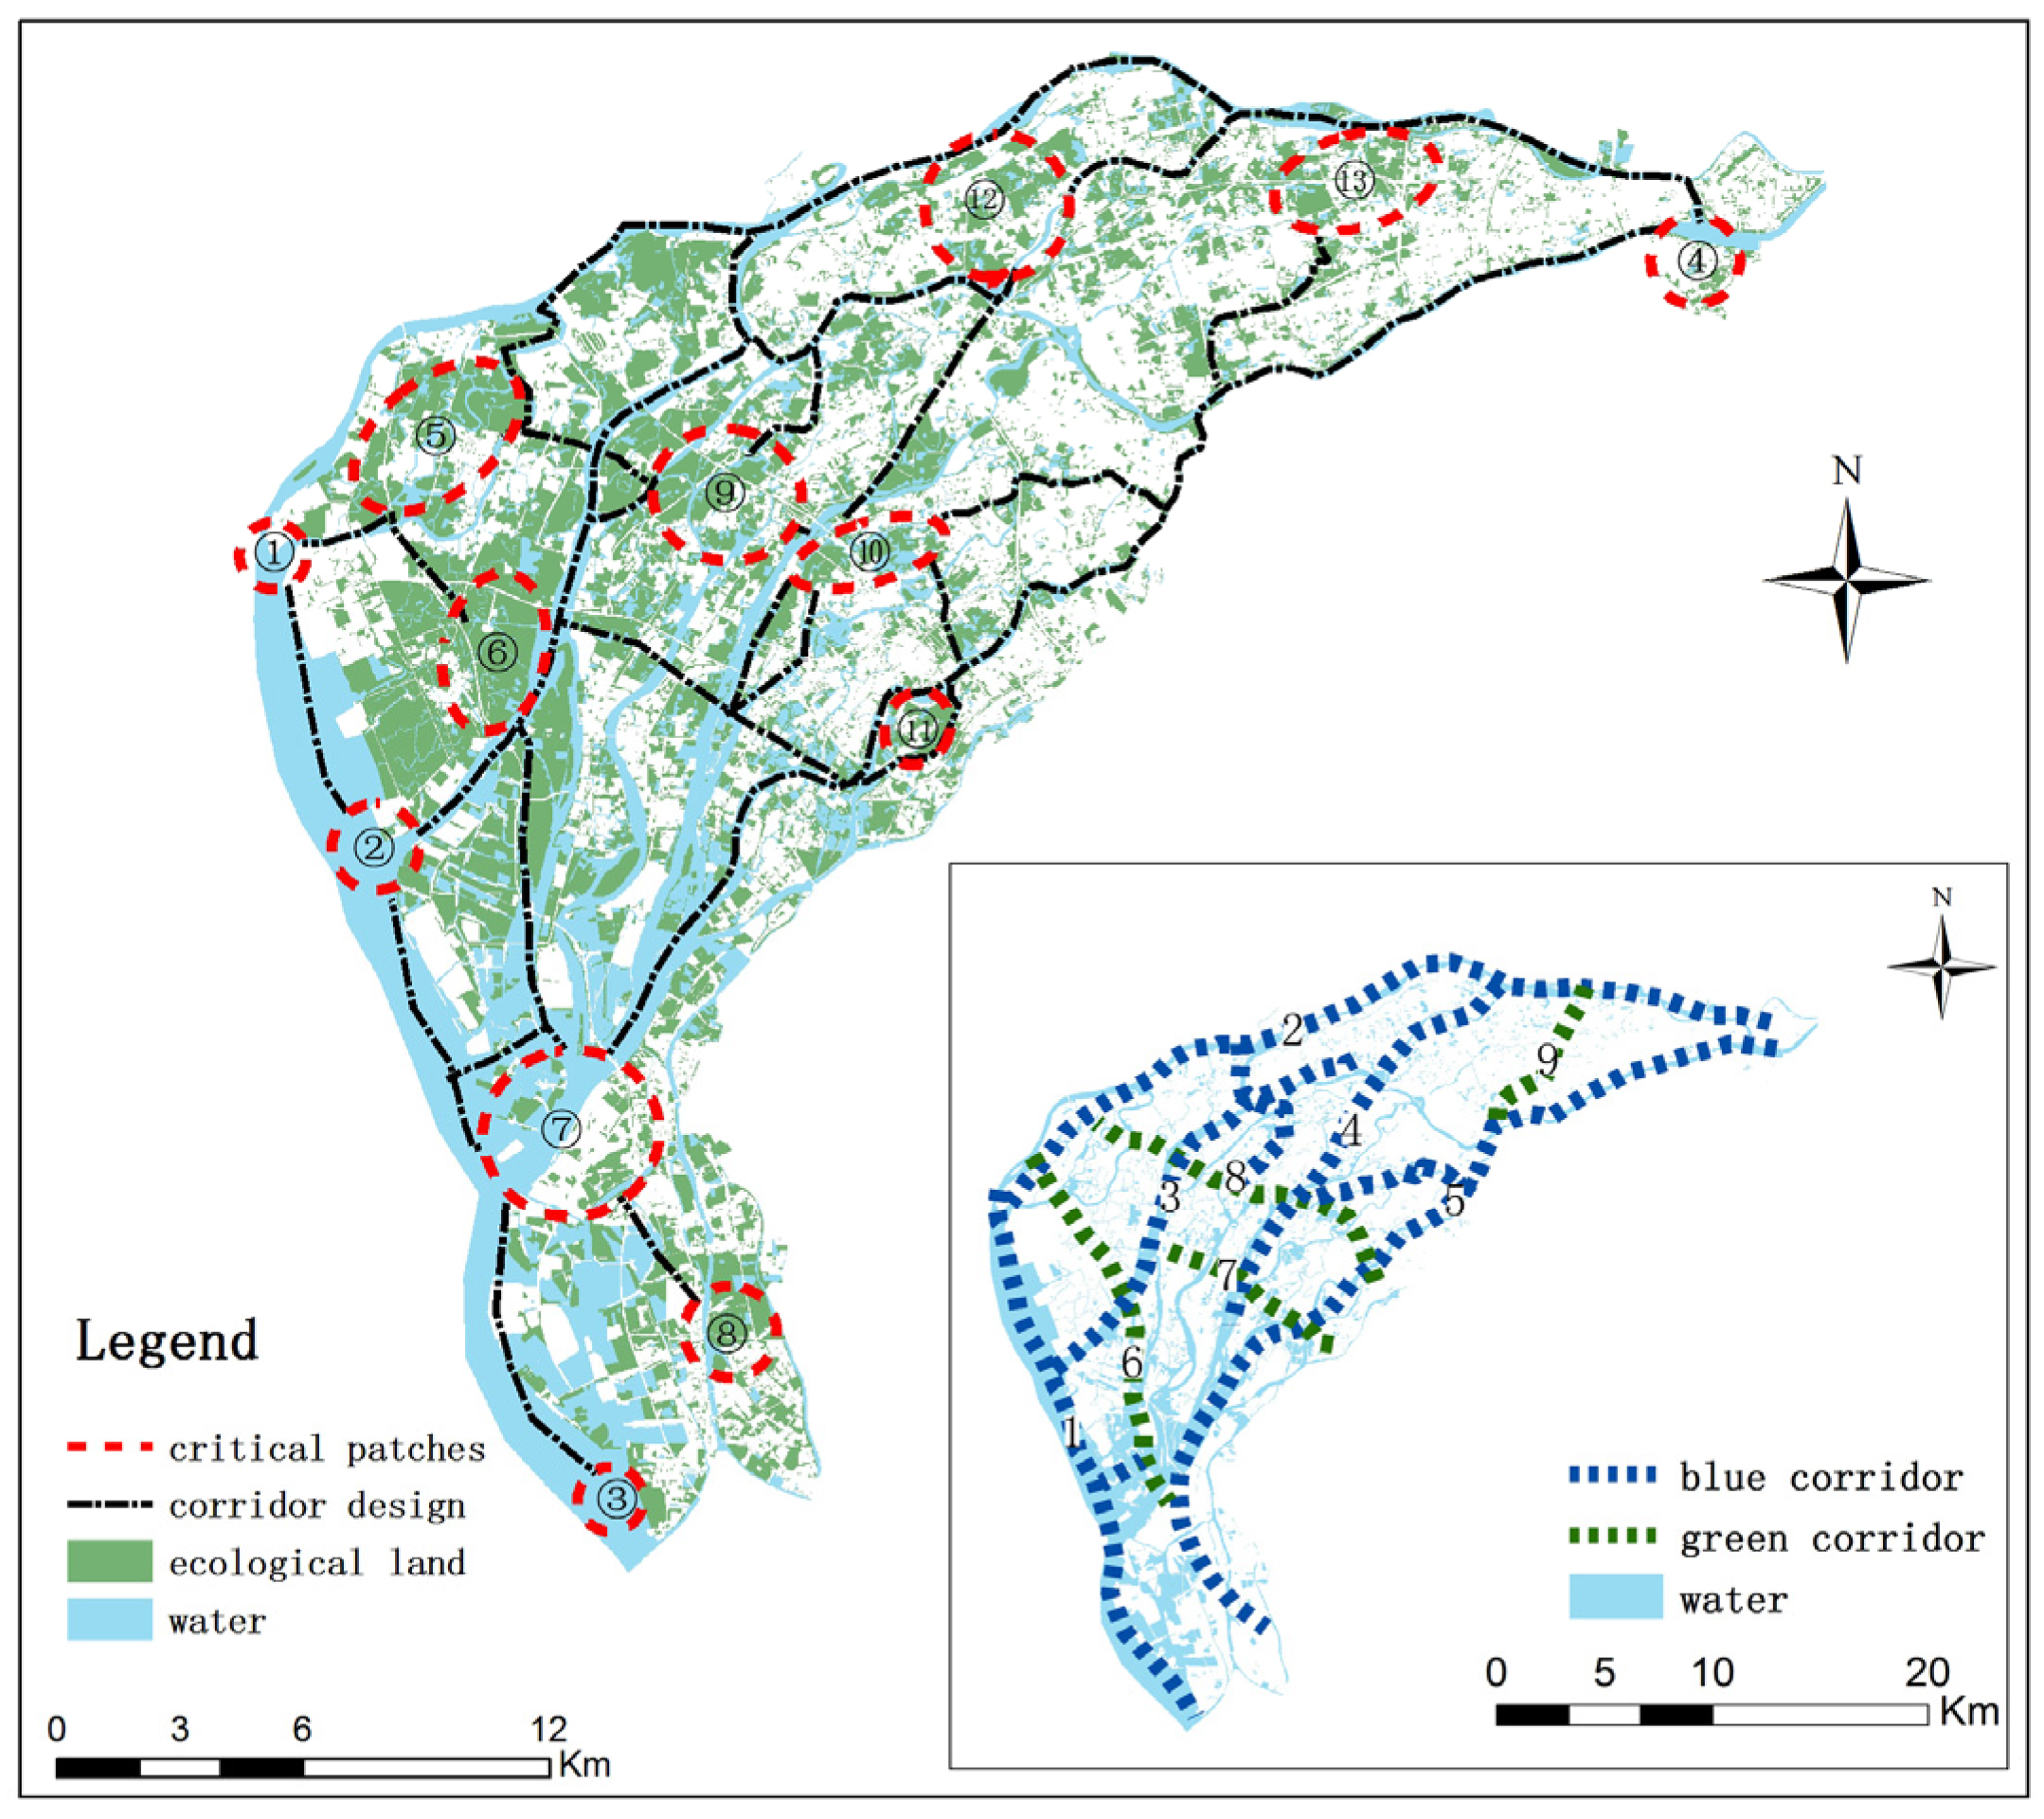
3.4. Design and Suggestions for the Balance of Ecological Protection and Urban Development
4. Discussion
4.1. Advantage of the Method
4.2. Evaluation of the Results
4.3. Prospects
5. Conclusions
Acknowledgments
Author Contributions
Conflicts of Interest
References
- Johnson, E.A.; Klemens, M.W. Nature in Fragments: The Legacy of Sprawl; Columbia University Press: New York, NY, USA, 2005; p. 400. [Google Scholar]
- Van Calster, H.; Vandenberghe, R.; Ruysen, M.; Verheyen, K.; Hermy, M.; Decocq, G. Unexpectedly high 20th century floristic losses in a rural landscape in northern France. J. Ecol. 2008, 96, 927–936. [Google Scholar] [CrossRef]
- Foley, J.A.; DeFries, R.; Asner, G.P.; Barford, C.; Bonan, G.; Carpenter, S.R.; Chapin, F.S.; Coe, M.T.; Daily, G.C.; Gibbs, H.K.; et al. Global consequences of land use. Science 2005, 309, 570–574. [Google Scholar] [CrossRef] [PubMed]
- Xiang, W.N.; Stuber, R.M.B.; Meng, X. Meeting critical challenges and striving for urban sustainability in China. Landsc. Urban Plan. 2011, 100, 418–420. [Google Scholar] [CrossRef]
- Qu, G.P. Strategic points and countermeasures of ecological safety in China. Environ. Prot. 2002, 8, 3–5. (In Chinese) [Google Scholar]
- Yang, Y.Y.; Zhang, S.W.; Wang, D.Y.; Yang, J.C.; Xing, X.S. Spatiotemporal changes of farming-pastoral ecotone in Northern China, 1954–2005: A case study in Zhenlai County, Jilin Province. Sustainability 2015, 7, 1–22. [Google Scholar] [CrossRef]
- Cen, X.T.; Wu, C.F.; Xing, X.S.; Fang, M.; Garang, Z.; Wu, Y.Z. Coupling intensive land use and landscape ecological security for urban sustainability: An integrated socioeconomic data and spatial metrics analysis in Hangzhou city. Sustainability 2015, 7, 1459–1482. [Google Scholar] [CrossRef]
- Forman, R.T.T.; Collinge, S.K. Nature conserved in changing landscapes with and without spatial planning. Landsc. Urban Plan. 1997, 37, 129–135. [Google Scholar] [CrossRef]
- Gong, J.Z.; Liu, Y.S.; Xia, B.C.; Zhao, G.W. Urban ecological security assessment and forecasting, based on a cellular automata model: A case study of Guangzhou, China. Ecol. Model. 2009, 220, 3612–3620. [Google Scholar] [CrossRef]
- Li, Y.F.; Sun, X.; Zhu, X.D.; Cao, H.H. An early warning method of landscape ecological security in rapid urbanizing coastal areas and its application in Xiamen, China. Ecol. Model. 2010, 221, 2251–2260. [Google Scholar] [CrossRef]
- Zhou, K.H.; Liu, Y.L.; Tan, R.H.; Song, Y. Urban dynamics, landscape ecological security, and policy implications: A case study from the Wuhan area of central China. Cities 2014, 41, 141–153. [Google Scholar] [CrossRef]
- Peng, J.; Zong, M.L.; Hu, Y.N.; Liu, Y.X.; Wu, J.S. Assessing landscape ecological risk in a mining city: A case study in Liaoyuan city, China. Sustainability 2015, 7, 8312–8334. [Google Scholar] [CrossRef]
- Zuo, W.; Zhou, H.Z.; Wang, Q. Conceptual framework for selection of anindicator system for assessment of regional ecological safety. Soil 2003, 1, 2–7. (In Chinese) [Google Scholar]
- Kong, H.M.; Zhao, J.Z.; Ji, L.Z.; Lu, Z.H.; Deng, H.B.; Ma, K.M.; Zhang, P. Assessment method of ecological health. Chin. J. Appl. Ecol. 2002, 13, 486–490. (In Chinese) [Google Scholar]
- Xiao, D.N.; Chen, W.B.; Guo, F.L. On the basic concepts and contents of ecological security. Chin. J. Appl. Ecol. 2002, 13, 354–358. (In Chinese) [Google Scholar]
- Zhao, Y.Z.; Zou, X.Y.; Cheng, H.; Jia, H.K.; Wu, Y.Q.; Wang, G.Y.; Zhang, C.L.; Gao, S.Y. Assessing the ecological security of the Tibetan plateau: Methodology and a case study for Lhaze County. J. Environ. Manag. 2006, 80, 120–131. [Google Scholar] [CrossRef] [PubMed]
- Gao, Y.; Wu, Z.F.; Lou, Q.S.; Huang, H.M.; Cheng, J.; Chen, Z.L. Landscape ecological security assessment based on projection pursuit in Pearl River Delta. Environ. Monit. Assess. 2012, 184, 2307–2319. [Google Scholar] [CrossRef] [PubMed]
- Chang, H.; Li, Z.; Wang, R.; Wang, Y.; Li, F.; Xiong, X. Study on Network Analysis for Urban Ecological Security Pattern in Changzhou City. Acta Sci. Nat. Univ. Pekin. 2009, 45, 728–736. [Google Scholar]
- Guo, X.; Yang, J.; Mao, X. Primary studies on urban ecosystem health assessment. China Environ. Sci. 2002, 22, 525–529. (In Chinese) [Google Scholar]
- Xie, H.; Li, B. A Study on Indices System and Assessment Criterion of Ecological Security for City. J. Beijing Norm. Univ. 2004, 40, 705–710. (In Chinese) [Google Scholar]
- Yu, K.; Wang, S.; Li, D. The function of ecological security patterns as an urban growth framework in Beijing. Acta Ecol. Sin. 2009, 29, 1189–1204. (In Chinese) [Google Scholar]
- Liu, Y.; Meng, J.; Zhu, L. Progress in the research on regional ecological security pattern. Acta Ecol. Sin. 2010, 30, 6980–6989. (In Chinese) [Google Scholar]
- Ma, K.; Fu, B.; Li, X.; Guang, W. The regional pattern for ecological security: The concept and theoretical basis. Acta Ecol. Sin. 2004, 24, 761–768. (In Chinese) [Google Scholar]
- Chang, H.; Li, F.; Li, Z.G.; Wang, R.S.; Wang, Y.L. Urban landscape pattern design from the viewpoint of networks: A case study of Changzhou city in Southeast China. Ecol. Complex. 2011, 8, 51–59. [Google Scholar] [CrossRef]
- Jepsen, J.U.; Baveco, J.M.; Topping, C.J.; Verboom, J.; Vos, C.C. Evaluating the effect of corridors and landscape heterogeneity on dispersal probability: A comparison of three spatially explicit modelling approaches. Ecol. Model. 2005, 181, 445–459. [Google Scholar] [CrossRef]
- Xiong, J.X. Superior strategies and analysis on integrity of urban eco-network construction regions around lake-take ChangDe city of west DongTing lake region as an example. Econ. Geogr. 2008, 28, 752–756. (In Chinese) [Google Scholar]
- Zetterberg, A.; Mörtberg, U.M.; Balfors, B. Making graph theory operational for landscape ecological assessments, planning, and design. Landsc. Urban Plan. 2010, 95, 181–191. [Google Scholar] [CrossRef]
- Zhang, L.Q.; Wang, H.Z. Planning an ecological network of Xiamen Island (China) using landscape metrics and network analysis. Landsc. Urban Plan. 2006, 78, 449–456. [Google Scholar] [CrossRef]
- Yu, K.J.; Li, D.H.; Li, N.Y. The evolution of Greenways in China. Landsc. Urban Plan. 2006, 76, 223–239. [Google Scholar] [CrossRef]
- Dongguan Statistical Bureau. Statistical yearbook 2014 of Dongguan. Available online: http://tjj.dg.gov.cn/website/flaArticle/art_show.html?code=nj2014&fcount=2 (accessed on 16 February 2016). (In Chinese)
- Dongguan Statistical Bureau Statistical yearbook 1978–1990 of Dongguan. Available online: http://tjj.dg.gov.cn/ website/web/scan/PDF/1978-1990TJNJ.pdf (accessed on 16 February 2016). (In Chinese)
- Millennium Ecosystem Assessment. Ecosystems and human well-being: A framework for assessment. In Report of the Conceptual Framework Working Group of the Millennium Ecosystem Assessment; Island Press: Washington, DC, USA, 2003. [Google Scholar]
- Sharp, R.; Tallis, H.T.; Ricketts, T.; Guerry, A.D.; Wood, S.A.; Chaplin-Kramer, R.; Nelson, E.; Ennaanay, D.; Wolny, S.; Olwero, N.; et al. InVEST +VERSION+ User’s Guide. Available online: http://data.naturalcapitalproject.org/nightly-build/invest-users-guide/html/ (accessed on 16 February 2016).
- He, J.; Liu, J.; Yu, K.; Zhang, L.; Li, X.; Wang, D. Evaluation of change in the ecological quality for Minjiang River Basin based on the InVEST Biodiversity model. China Sci. Pap. 2015, 10, 1782–1788. (In Chinese) [Google Scholar]
- Pan, T.; Wu, S.; Dai, E.; Liu, Y. Spatiotemporal variation of water source supply service in Three Rivers source area of China based on InVEST model. Chin. J. Appl. Ecol. 2013, 24, 183–189. (In Chinese) [Google Scholar]
- Wu, J. Integrated Assessment of Ecosystem in Hainan Bamen Bay based on CA-Markov and InVEST Models; Hainan University: Haikou, China, 2012. (In Chinese) [Google Scholar]
- Bai, Y.; Zheng, H.; Zhuang, C.; Ouyang, Z.; Xu, W. Ecosystem services valuation and its regulation in Baiyangdian Basin: Based on InVEST model. Acta Ecol. Sin. 2013, 33, 711–717. (In Chinese) [Google Scholar]
- Wang, Y.; Sun, Y.; Lian, J.; Li, Y. Study on wetland ecological assessment of Honghe nature reserve. J. Cap. Norm. Univ. 2011, 32, 73–76. (In Chinese) [Google Scholar]
- Sun, Y.; Zhang, J. The ecological evaluation for north branch of Changjiang Estuary Wetland Nature Reserve. Wetl. Sci. Manag. 2011, 7, 25–28. (In Chinese) [Google Scholar]
- Nelson, E.; Mendoza, G.; Regetz, J.; Polasky, S.; Tallis, H.; Cameron, D.R. Modeling multiple ecosystem services, biodiversity conservation, commodity production, and tradeoffs at landscape scales. Front. Ecol. Environ. 2009, 7, 4–11. [Google Scholar] [CrossRef]
- Theobalda, D.M.; Crools, K.R.; Norman, J.B. Assessing effects of land use on landscape connectivity: Loss and fragmentation of western U.S. For. Ecol. Appl. 2011, 21, 2445–2458. [Google Scholar] [CrossRef]
- Petrosillo, I.; Zaccarelli, N.; Semerarn, T.; Zurlini, G. The effectiveness of different conservation policies on the security of natural capital. Landsc. Urban Plan. 2009, 89, 49–56. [Google Scholar] [CrossRef]
- Bélisle, M. Measuring landscape connectivity: The challenge of behavioral landscape ecology. Ecology 2005, 86, 1988–1995. [Google Scholar] [CrossRef]
- Calabrese, J.M.; Fagan, W.F. Acomparison-shopper’s guide to connectivity metrics. Front. Ecol. Environ. 2004, 2, 529–536. [Google Scholar] [CrossRef]
- Moílanen, A.; Nieminen, M. Simple connectivity measures in spatial ecology. Ecology 2002, 83, 1131–1145. [Google Scholar] [CrossRef]
- Bunn, A.G.; Urban, D.L.; Keitt, T.H. Landscape connectivity: A conservation application of graph theory. J. Environ. Manag. 2000, 29, 265–278. [Google Scholar] [CrossRef]
- Taylor, P.D.; Merriam, G. Connectivity is a vital element of landscape structure. Okios 1993, 68, 571–573. [Google Scholar] [CrossRef]
- Wu, C.; Zhou, Z.X.; Wang, P.C.; Xiao, W.F.; Teng, M.J.; Peng, L. Evaluation of landscape connectivity based on least-cost model. Chin. J. Appl. Ecol. 2009, 20, 2042–2048. (In Chinese) [Google Scholar]
- Foltête, J.C.; Berthier, K.; Cosson, J.F. Cost distance defined by a topological function of landscape. Ecol. Model. 2008, 210, 104–114. [Google Scholar] [CrossRef]
- Chardon, J.P.; Adriaensen, F.; Matthysen, E. Incorporating landscape elements into a connectivity measure: A case study for the Speckled wood butterfly (Parargeaegeria L.). Landsc. Ecol. 2003, 18, 561–573. [Google Scholar] [CrossRef]
- Adriaensen, F.; Chardon, J.P.; de Blust, G.; Adriaensen, F.; Chardon, J.P.; Blust, G.D.; Swinnen, E.; Villalba, S.; Gulinck, H. The application of ‘least-cost’ modelling as a functional landscape model. Landsc. Urban Plan. 2003, 64, 233–247. [Google Scholar] [CrossRef]
- Sutcliffe, O.L.; Bakkestuen, V.; Fry, G.; Stabbetorp, O.E. Modelling the benefits of farmland restoration: Methodology and application to butterfly movement. Landsc. Urban Plan. 2003, 63, 15–31. [Google Scholar] [CrossRef]
- Epps, C.W.; Wehausen, J.D.; Bleich, V.C.; Torres, S.G.; Brashares, J.S. Optimizing dispersal and corridor models using landscape genetics. J. Appl. Ecol. 2007, 44, 714–724. [Google Scholar] [CrossRef]
- Verbeylen, G.; Bruyn, D.L.; Adriaensen, F.; Matthysen, E. Does matrix resistance influence red squirrel (Sciurusvulganis L. 1758) distribution in an urban landscape? Landsc. Ecol. 2003, 18, 791–805. [Google Scholar] [CrossRef]
- Sun, D.F.; Dawson, R.; Li, H.; Wei, R.; Li, B. A landscape connectivity index for assessing desertification: A case study of Minqin County. China. Landsc. Ecol. 2007, 22, 531–543. (In Chinese) [Google Scholar] [CrossRef]
- Singleton, P.H.; Gaines, W.L.; Lehmkuhl, J.F. Landscape Permeability for Large Carnivores in Washington: A Geographic Information System Weighted-distance and Least-cost Corridor Assessment. Available online: http://rewilding.org/Singletonl.pdf (accessed on 15 October 2008).
- Li, J.H.; Liu, X.H. Research of the nature reserve zonation based on the least-cost distance model. J. Nat. Res. 2006, 21, 219–224. (In Chinese) [Google Scholar]
- Yu, K.J. Landscape Ecological Security Patterns in Biological Conservation. Acta Ecol. Sin. 1999, 19, 8–15. (In Chinese) [Google Scholar]


| Class | Constituents | Functional Characteristics [18,30] |
|---|---|---|
| Blue Landscape | Water such as rivers, lakes, seas. | Climate regulation, cleaning environment, water supply for agriculture and industry, navigation, aquatic production, entertainment, etc. |
| Green Landscape | Urban green spaces, gardens, woodlands, etc. | High ecosystem service value and function, carbon sequestration, oxygen releasing, soil and water conservation, cleaning environment, noise reduction. |
| Resistance Factor | Resistance Coefficient |
|---|---|
| Woodland, grass | 1 |
| Agricultural land | 50 |
| Urban green spaces, gardens | 70 |
| Unused land | 200 |
| Water, construction land | 300 |
© 2016 by the authors; licensee MDPI, Basel, Switzerland. This article is an open access article distributed under the terms and conditions of the Creative Commons by Attribution (CC-BY) license (http://creativecommons.org/licenses/by/4.0/).
Share and Cite
Lin, Q.; Mao, J.; Wu, J.; Li, W.; Yang, J. Ecological Security Pattern Analysis Based on InVEST and Least-Cost Path Model: A Case Study of Dongguan Water Village. Sustainability 2016, 8, 172. https://doi.org/10.3390/su8020172
Lin Q, Mao J, Wu J, Li W, Yang J. Ecological Security Pattern Analysis Based on InVEST and Least-Cost Path Model: A Case Study of Dongguan Water Village. Sustainability. 2016; 8(2):172. https://doi.org/10.3390/su8020172
Chicago/Turabian StyleLin, Qian, Jiaying Mao, Jiansheng Wu, Weifeng Li, and Jian Yang. 2016. "Ecological Security Pattern Analysis Based on InVEST and Least-Cost Path Model: A Case Study of Dongguan Water Village" Sustainability 8, no. 2: 172. https://doi.org/10.3390/su8020172
APA StyleLin, Q., Mao, J., Wu, J., Li, W., & Yang, J. (2016). Ecological Security Pattern Analysis Based on InVEST and Least-Cost Path Model: A Case Study of Dongguan Water Village. Sustainability, 8(2), 172. https://doi.org/10.3390/su8020172