1. Introduction
Chile is one of Latin America’s greatest industrial and agricultural exporters and has recently been appointed a new OECD member [
1]; nevertheless, environmental and social issues within the country remain highly problematic [
2,
3,
4]. In the central and northern regions, one such area of concern is exploitation of limited water resources [
5]. The central and northern regions of Chile are economically and socially important due to the presence of agriculture and mining operations [
4,
6,
7]. The arid northern regions of Chile are, however, some of the driest areas in the world and the operation of these industries puts great strain on local shared water resources [
5]. Water scarcity has led to conflicts between water users, damage to local ecosystems and a poor environmental reputation [
7,
8,
9,
10]. There has been a lack of research investigating regional water availability and demand in Chile, and the relevance of water consuming industries and solutions to water consumption has also received little interest. It is essential for the degree of water scarcity in each region to be calculated, to identify which sectors are responsible and which water management strategies would improve the situation. This objective of this manuscript is to accomplish these aims by determining the levels of water scarcity of the central and northern regions, identifying the impact of the water consuming sectors and investigating potential water management strategies applied to the sectors with the greatest consumption.
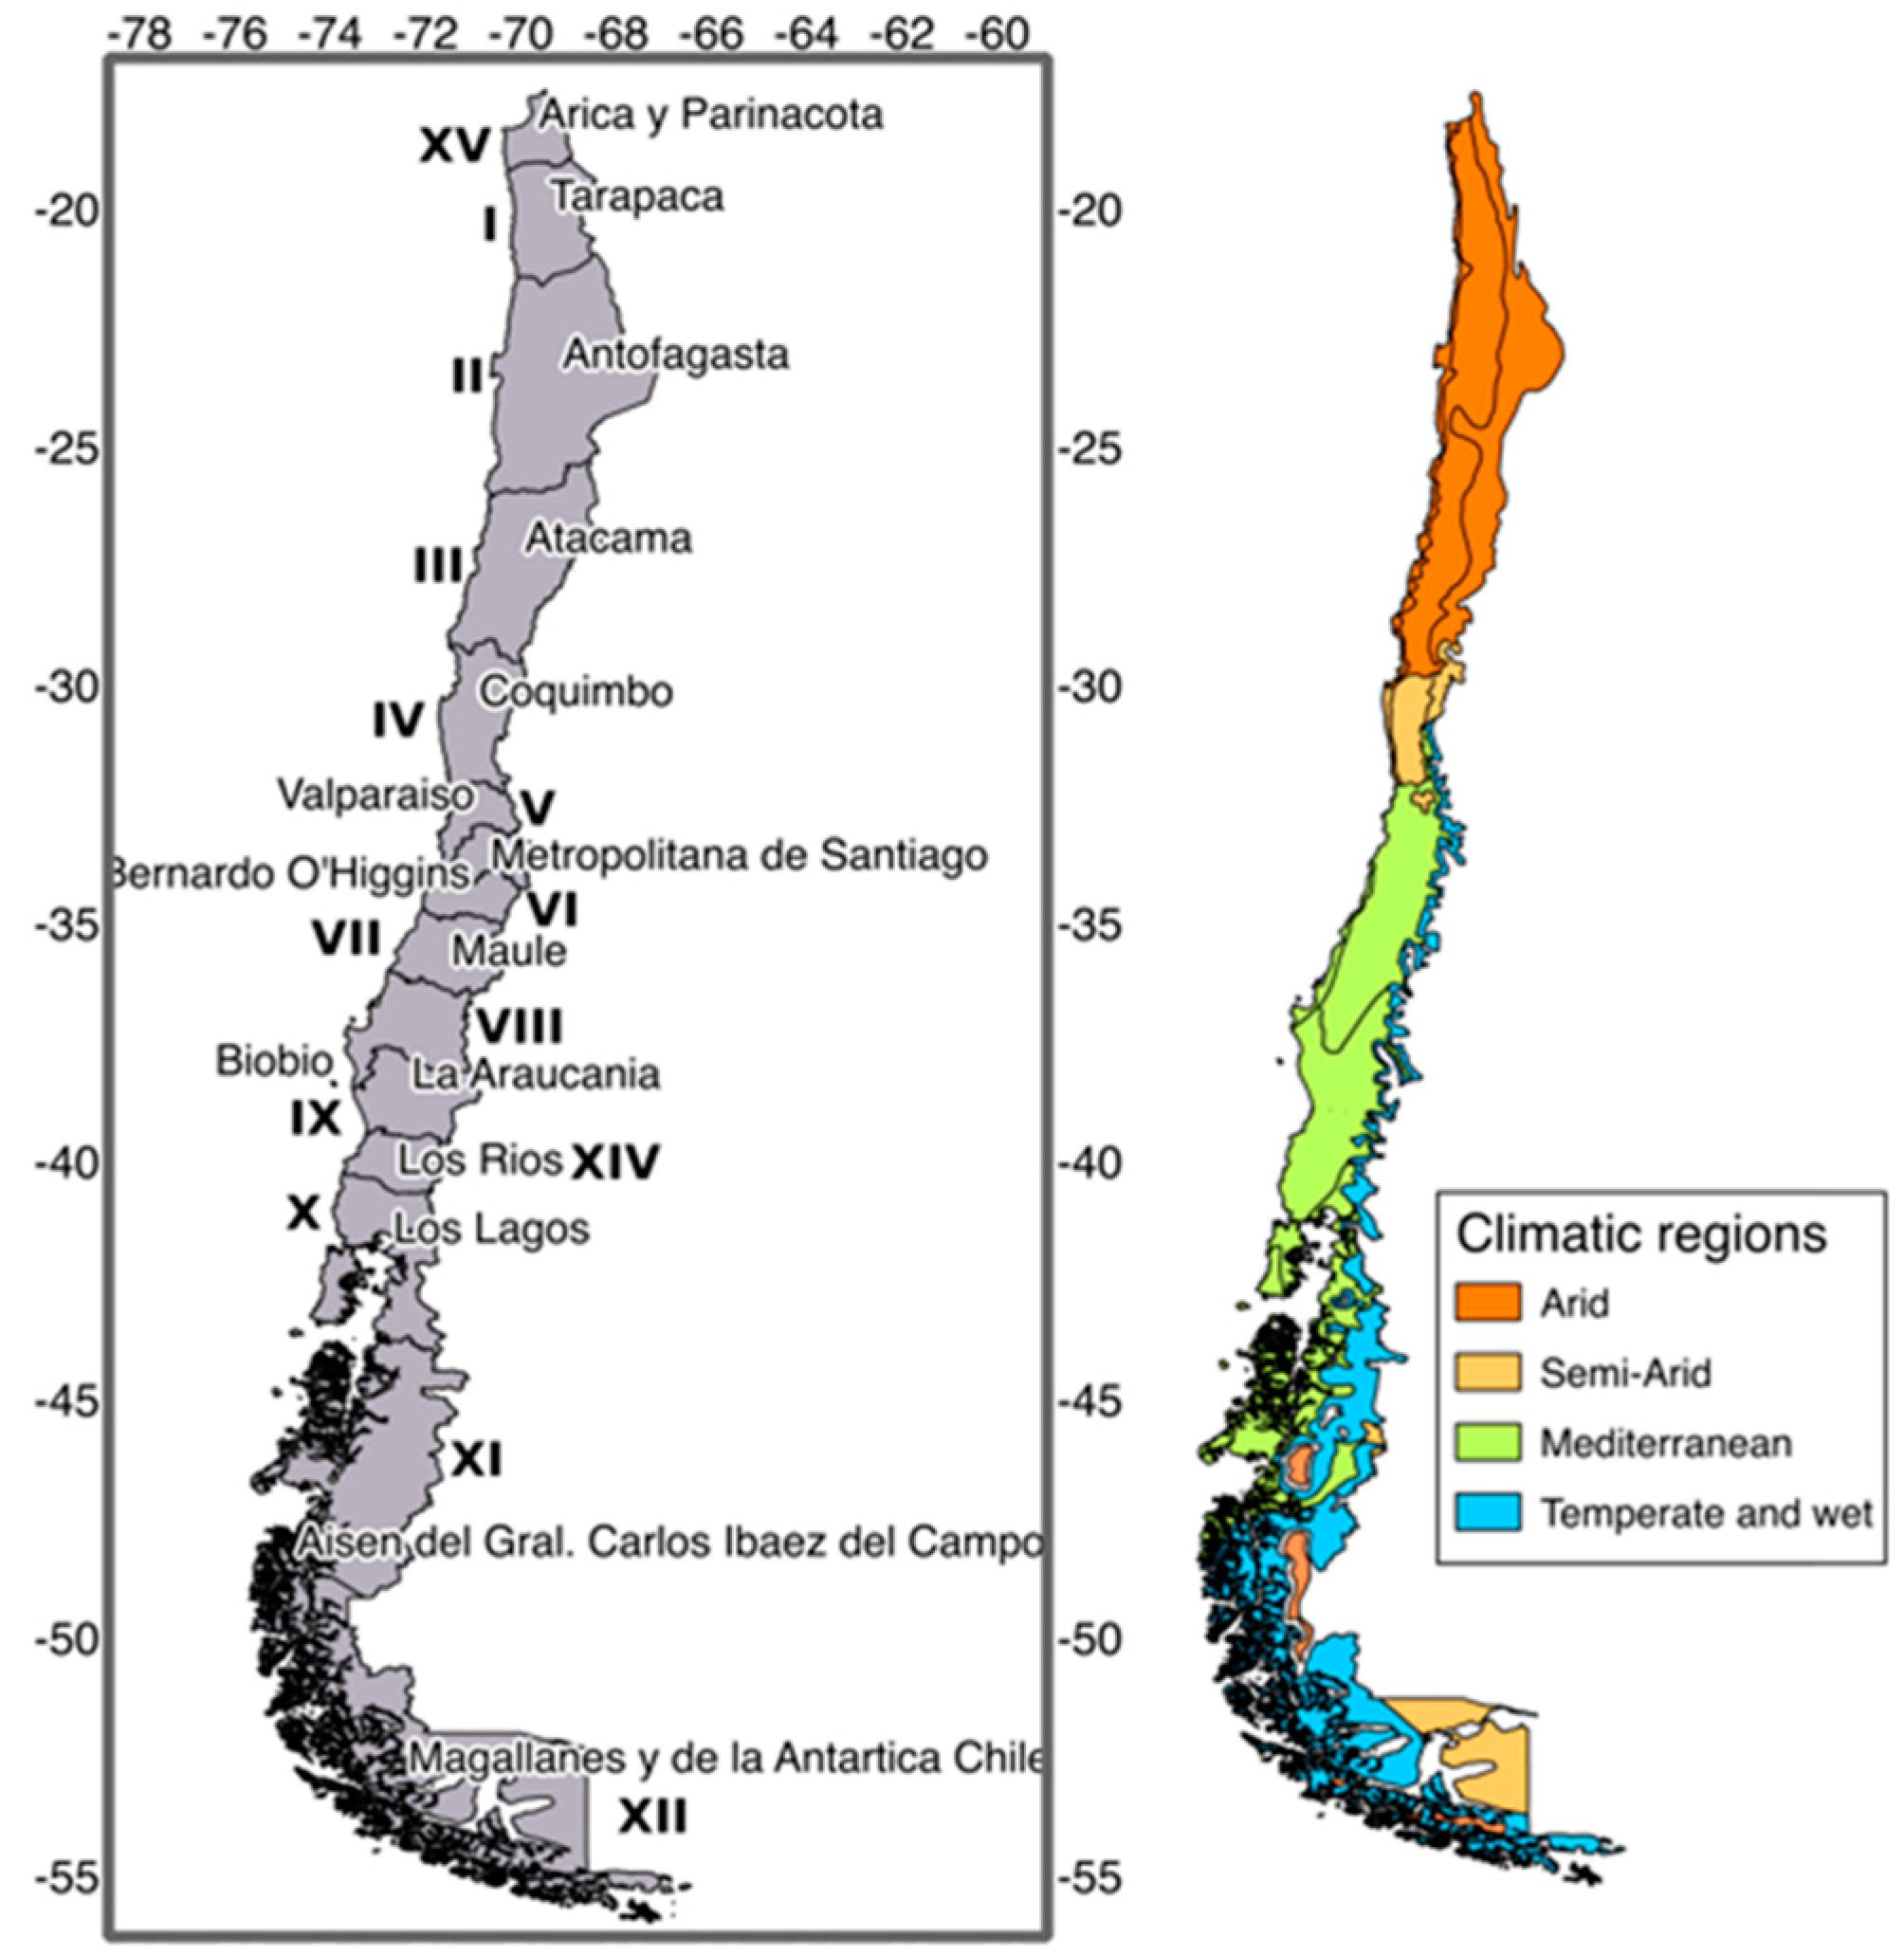
Chile has great climatic variation throughout the country, with the north being mostly arid desert, the south being temperate and wet, and the central zone having a more Mediterranean climate.
Figure 1 displays the name numbers of each of Chile’s administrative regions with the climatic regions displayed alongside.
Figure 1.
The names and numbers of all Chilean administrative regions and the climatic regions. Source: Prepared by the authors on the basis of official geographical data from the Chilean State Catalogue of Geospatial Data [
11].
Figure 1.
The names and numbers of all Chilean administrative regions and the climatic regions. Source: Prepared by the authors on the basis of official geographical data from the Chilean State Catalogue of Geospatial Data [
11].
Chile has a high overall average water runoff availability at around 53,952 m
3/hab/year although geographical distribution is highly unequal [
12]. The Aysen region (XI) in the south, for example, has a recorded availability of around 2,993,535 m
3/hab/year, whereas the value for the second region of Antofagasta region was recorded as 52 m
3/hab/year [
12]. Rainfall is the main primary water source in the south and central regions, whereas in the northern regions, rainfall is negligible and the main water sources are aquifers. The very low recharge rate of these aquifers, however, leaves them highly vulnerable to over-exploitation if extraction rates are higher than recharge rates [
13]. Artificial storage of water is also used in Chile to regulate water availability, the use of dams is more evident in the southern regions due to the higher availability of surface water. In the central and northern regions, the dam storage volumes have been decreasing as a result of lower rainfall and increased water consumption [
14]. Indeed, since 1996, each of the regions from the centre north (Metropolitan Region) to the far north of Chile (Region I and XV) have been in hydrological deficit,
i.e., demand is greater than availability [
12].
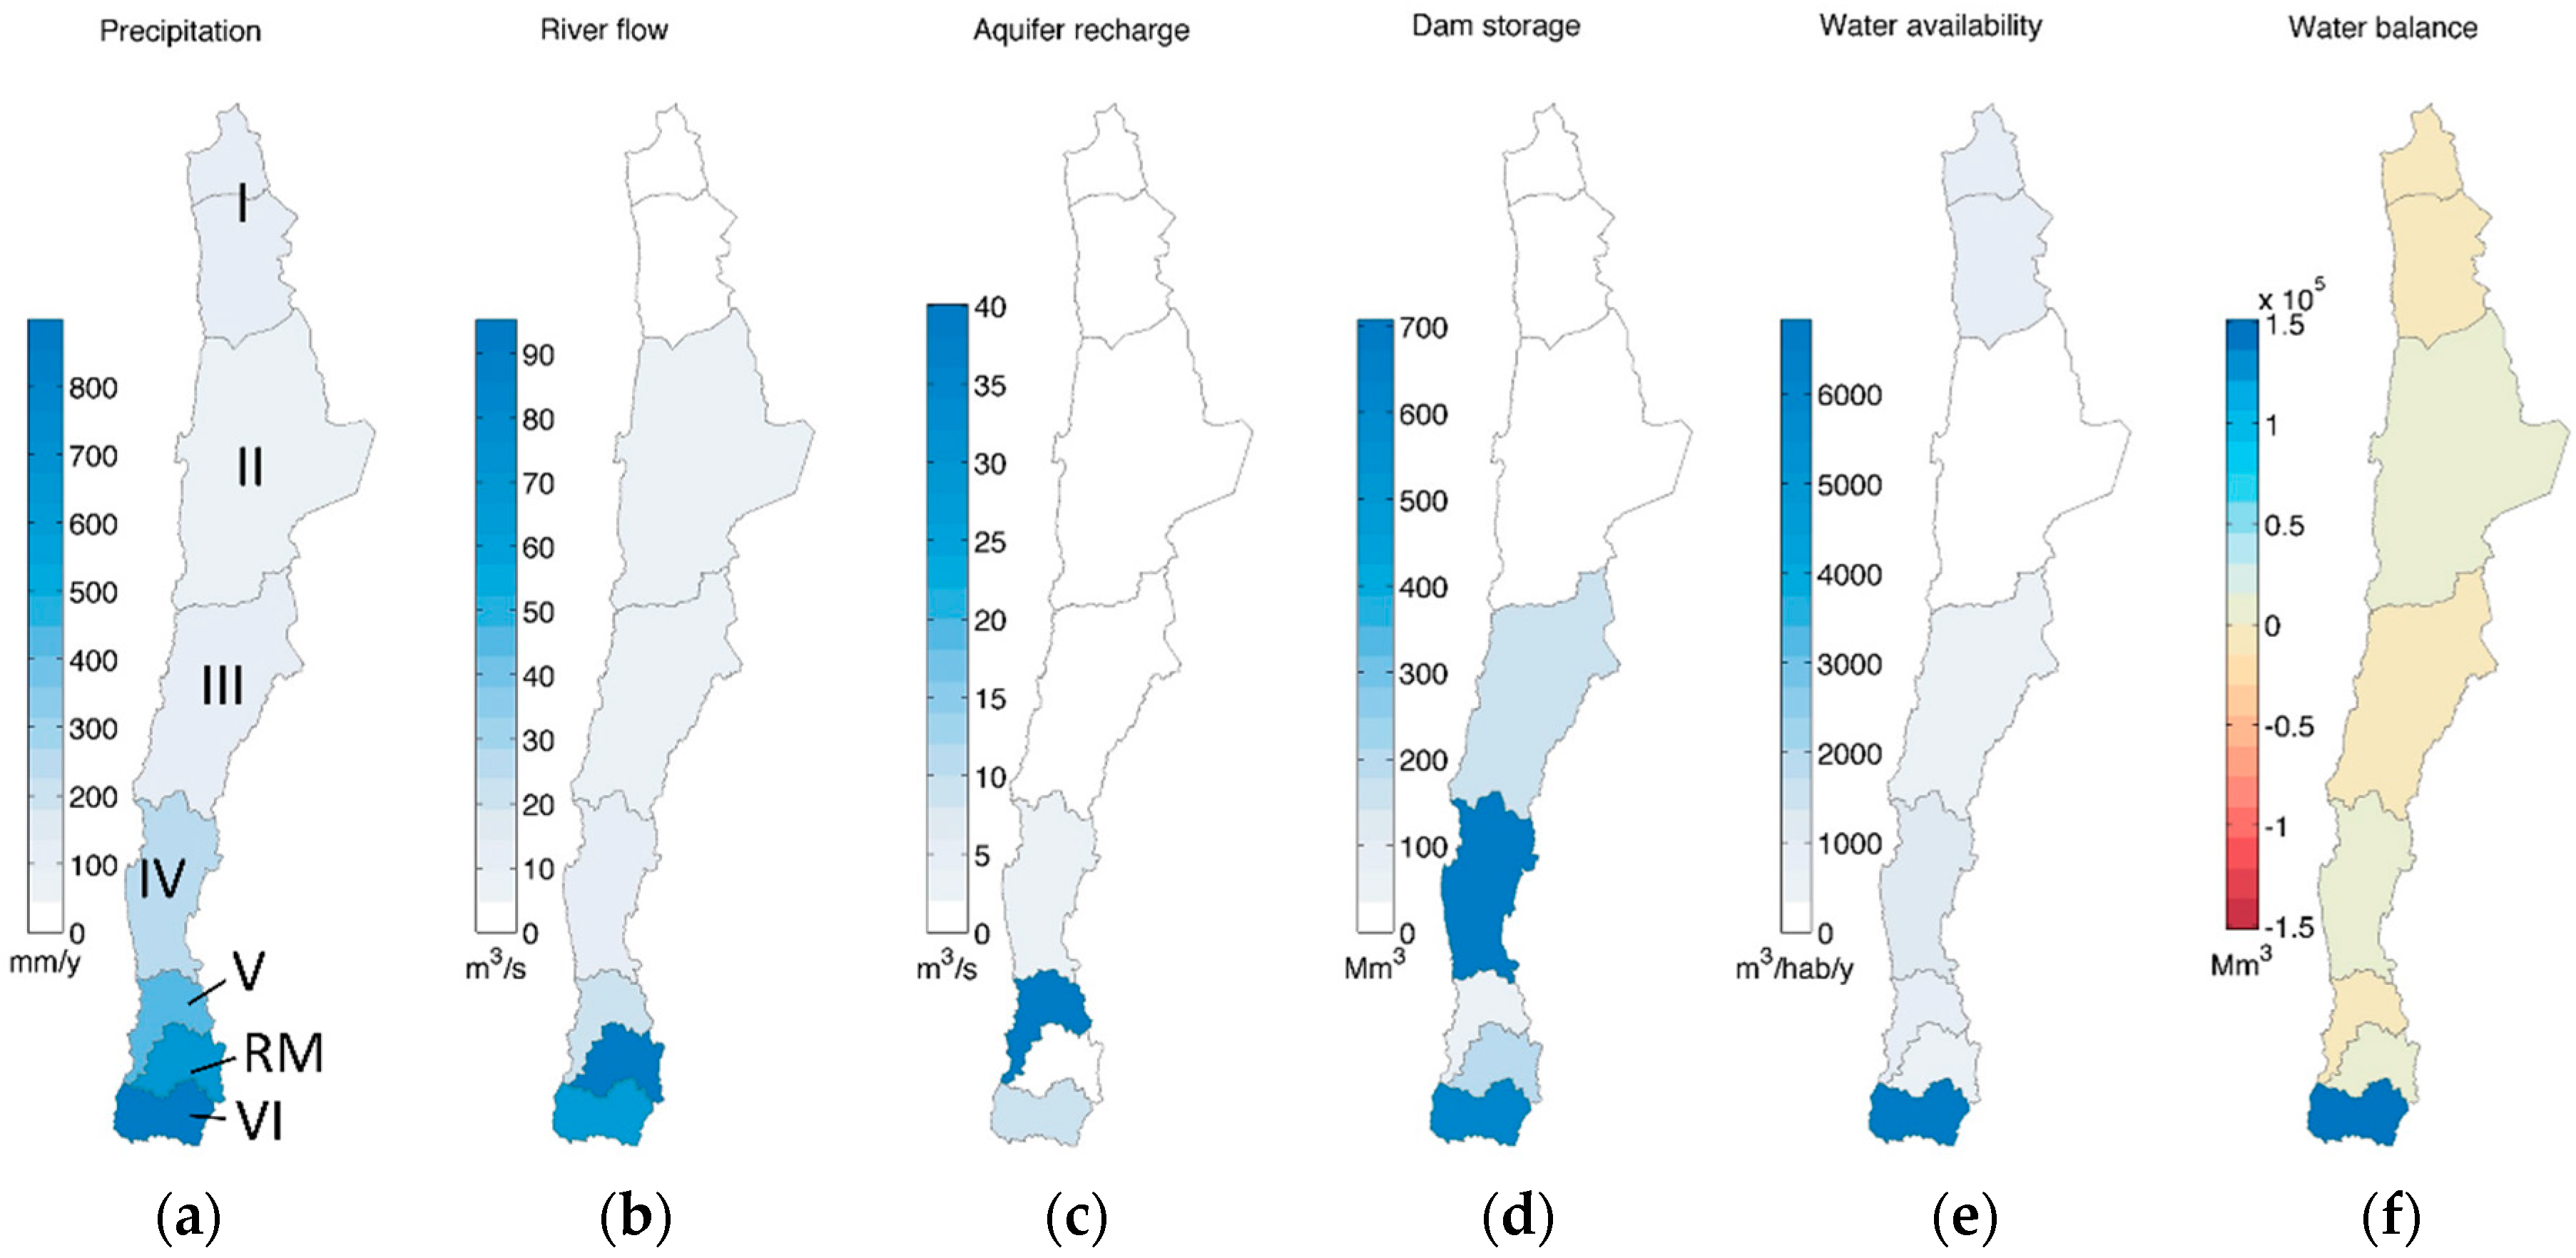
Figure 2 displays the annual rainfall, river flow, aquifer recharge, dam storage, water availability for the central and northern regions of Chile, the regions which are investigated in this study. The values of rainfall were mapped using data from the Ministry of the Environment [
15], the river flow data was obtained from the National Institute of Statistics [
14], the aquifer recharge rates and historic mean dam storage values were mapped using data reported by Valdés-Pineda
et al. [
12], and the water availability and water balance values were obtained from the World Bank [
16].
Figure 2.
Maps displaying the values of (
a) precipitation; (
b) river flow; (
c) aquifer recharge; (
d) dam storage; (
e) water availability and (
f) water balance by region. Source: Prepared by the authors on the basis of official geographical data from the Chilean State Catalogue of Geospatial Data [
11].
The regions from Region Metropolitan to the far north are of clear hydrological deficit. Historic mean dam storage values are lower than the deficit and with reducing rainfall and greater consumption it is forecast that the water balance deficit will increase considerably in each of the central and northern regions of Chile [
16]. In the Far North, the balance deficit is forecast to increase to −1602 MM m
3/year, −1299 MM m
3/year in the Near North and −2844 MM m
3/year in Central Chile [
16].
In terms of water consumption, agriculture accounts for around 77.8% of all consumptive water use, industry accounts for 9.1%, mining for 7.2% and drinking water for 5.9% [
12]. The proportions, however, vary greatly between regions depending upon the ecosystem services. Agriculture, for example, is mainly concentrated in the south and south central regions where there is high water availability whereas water use from heavier industries is more apparent in the central north and northern regions where minerals are more abundant [
12]. Using data from the 2007 water demand report of the Chilean Water Authority (Dirección General de Aguas, DGA) it was calculated that mining accounted for around 64.1% of the total water use in the region of Antofagasta [
17]. In the Atacama region, it was calculated to be 10.4% but due to the increasing expansion of mining in this region it is estimated that this will increase to 25.4% by 2032 putting additional stress on the region’s water resources [
17]. Water consumption of the mining industry is expected to increase in all regions due to an increase in mining developments and a reduction in ore concentration resulting in greater processing requirements [
18]. The water consumption of the copper mining industry in 2014 was estimated to be 14.8 m
3/s which is forecast to increase to around 24.6 m
3/s by 2025 [
18].
The imbalance between availability and demand is therefore increasing due to both natural and anthropogenic factors. The purpose of this paper is to consider the current water resource situation in Chile regarding availability and use from a regional viewpoint, and to test the potential impact of water conservation measures to reduce scarcity and improve the sustainability of the main water consuming industries. The study is important in a local context as it investigates the degree of water scarcity in regions of Chile which are large industrial contributors to the Chilean economy and are potentially at risk of water scarcity. There has been very little research conducted investigating the problem of water scarcity in Chile or even compiling relevant data. Furthermore, this study considers which sectors contribute the most to regional water demand, and mitigation strategies are proposed. This work can be used as an introductory study as much of the data used is slightly dated but should be developed when more recent data becomes available. In an international context, this study can be of interest to those working on similar studies in other water scarce regions of the world. To calculate water scarcity, data regarding water availability and water use was obtained from records published by the Chilean Water Authority, academic and corporate reports. The data sources are discussed in the first sub-sections of the Results and Discussion section. A picture of the overall availability, water use by sector and vulnerability was developed for each central and northern region. Using this information the water scarcity index (WSI) of each region was evaluated; the method is explained in the following section and discussed in
Section 3.3 of the Results and Discussion. Following calculation of the WSI values, the contribution of the mining and agricultural sectors were investigated and the impact of implementing water conservation was tested. It was found that implementing water saving strategies in the mining industry would greatly improve water scarcity in the most affected regions and where mining is a high water consumer.
2. Methodology
A water scarcity indicator value was calculated for each investigated region to quantitatively understand the degree of scarcity. The indicator used was based on the indicator developed by Smakhtin
et al. [
19], as the ratio of water withdrawals to water availability as the mean annual runoff (MAR), displayed below as Equation (1). Both withdrawals and mean annual runoff were measured in liters per second. To include environmental requirements the equation is modified by subtracting the environmental requirements from the mean annual runoff as shown in Equation (2). Both values were calculated for each region; the focus was however on the value without environmental requirements. The withdrawals include all non-returned extractions, MAR is the mean annual runoff and EWR is the environmental water requirements.
Table 1 below displays the indicator value categories as defined by Smakhtin
et al. [
19].
Regarding water availability, numerous studies have been published by the Chilean Water Authority investigating rainfall, evaporation and runoff in most watersheds in the country, such as the Altiplano [
20], the Rio Loa, the Rio Petorca and the Rio Ligua [
21]. Few studies have, however, compiled this data. One study is an official 1987 report by the Chilean Water Authority that recorded runoff values of each watershed for all regions from 1951 to 1980 [
22]. The values reported in that study were used as the mean annual runoff data set for this study.
Table 1.
Characterization of water scarcity indicator values as defined by Smakhtin
et al. [
19].
Table 1.
Characterization of water scarcity indicator values as defined by Smakhtin et al. [19].
| WSI | Degrees of Environmental Water Scarcity of River Basins |
|---|
| WSI > 1 | Overexploited (current water use is tapping into EWR)—environmentally water scarce basins |
| 0.6 ≤ WSI < 1 | Heavily exploited (0% to 40% of the utilizable water is still available in a basin before EWR are in conflict with other uses)—environmentally water stressed basins |
| 0.3 ≤ WSI < 0.6 | Moderately exploited (40 to 70% of the utilizable water is still available in a basin before EWR are in conflict with other uses) |
| WSI < 0.3 | Slightly exploited |
The water withdrawal values were obtained from a DGA document published in 2007 [
17,
23], the most recent such publication. This study investigated the water demand by sector for each watershed in Chile, for agriculture, energy production, mining, industry, forestry, tourism, contamination and environmental requirements. The values from each sector were totaled for all regions. Obviously water demand values will have changed slightly since the publication of the 2007 document, nevertheless, there has not been a more up to date compilation of data published recently. A further limitation of this study is that the values of water demand from the sectors included are related to water withdrawals and not consumption. As a result, it is likely that there is some degree of overestimation of water scarcity index values as it is possible consumption is lower than demand. As a focus of this study and due to greater data availability, more recent data for the mining industry was obtained and analyzed for comparison.
Where the environmental requirements were included, the values used were those reported in the DGA 2007 study [
17,
23]. The study included the environmental requirements for each watershed in Chile based on a minimum ecological river flow (10% of mean annual flow) and from specific studies from the Chilean Water Authority [
17]. The minimum flows were calculated using the head flows within watersheds prior to human interaction with the flow. It should be noted that a recent bill was signed by the Ministry of the Environment to increase the minimum ecological flow to 20% of monthly mean stream flow in some specific watersheds [
24]. Thus, future users will be faced with stricter regulations for improved conservation of aquatic ecosystems.
The calculated WSI values were compared with values reported by the World Resources Institute (WRI) who have conducted studies investigating water stress in all areas of the world [
25]. The datasets for water availability and use from this study were downloaded and the WSI values calculated for each region for comparison. The contribution of each industry to regional water scarcity was also investigated. Additional analysis considered the impact of water conservation strategies in the mining and agricultural industries where lower values of water use were tested based on these strategies. For clarity, it should be noted that Region I in this study considers both what is now Region I and Region XV (a separate region from 2007), as much of the obtained data was determined for the original region as a whole.
3. Results and Discussion
3.1. Water Availability
This section discusses the data obtained for the water availability of the regions under investigation. The northern regions of Tarapaca, Arica and Parinacota (Region I) contain two distinct geographical zones, the arid coastal zone (pp 0.5 mm/year) and the arid Altiplano zone (pp 100–300 mm/year) [
26]. The mean annual regional runoff reported by the 1987 DGA report was 11,900 L/s almost exclusively from the Altiplano watersheds. Recent river flow data from the National Institute of Statistics for the region suggests a reduction in flows, a five year mean from 2009 to 2013 was calculated to be 2652 L/s with high annual variability [
14]. Recent reduced flows are a result of reduced rainfall [
27,
28,
29,
30,
31] which has been attributed to climate change [
12,
27,
28,
29] which are expected to be further reduced in the future [
32,
33]. Similarly to Region I, the region of Antofagasta has a dry coastal area and a higher altitude area with the greatest rainfall [
34]. In this region there is very limited flow of surface water which is reflected in the mean annual regional runoff recorded by the DGA of 930 L/s. The runoff comes predominantly from the River Loa watershed [
22]. The river flow data published by the National Institute of Statistics has recently recorded high mean annual flows with a three year mean of 2110 L/s from 2011 to 2013 [
14]. As the water resources of the region of Antofagasta are highly dependent upon glacial melt it has been suggested that the recent higher flows in this region may be a result of the impact of climate change [
13]. The Atacama region has a slightly more varied hydrological system than the more northern regions with higher rainfall than region II [
14]. The greater volume of rainfall and snow in the Andes means there is surface water in the region throughout the year [
34]. The 1987 DGA study reported a total runoff of 1880 L/s almost exclusively from the Copiapo and Huasco watersheds [
22]. Similarly to the second region, the recent river flow data is greater than the historic mean annual runoff, with the watersheds being predominantly glacial fed, and the increase may also be explained by higher temperatures [
12].
The near-north region of Coquimbo, region IV, has a semi-arid climate with a wide variety of vegetation and an agricultural industry important to Chile [
35]. The 1987 DGA study reported a runoff of 22,200 L/s for this region, split evenly between the three main watersheds [
22]. The river flow data published by the INE has been comparatively low with a five year mean annual flow of 10,785 L/s from 2009 to 2013 and reduced considerably from 2009 to 2012 [
14]. The region of Coquimbo is considered to be at high risk of climate change in terms of lower precipitation and increased temperatures [
36]. The fifth region of Valparaiso has higher rainfall and consequently greater water resources than the more northerly regions [
12]. The 1987 DGA study reported the regional runoff to be 40,700 L/s [
22]. Similarly to the region of Coquimbo, however, mean annual river flows have reduced considerably in recent years [
14].
The Metropolitan region contains only one watershed, the Rio Maipo, which is also the most important river for the city of Santiago [
12]. The 1987 DGA study reported a runoff value of 103,000 L/s [
22]. The sixth region of O’Higgins has considerably higher rainfall and water availability than the regions to the north, and the 1987 DGA study reported a regional runoff of 205,000 L/s [
22]. Both regions have experienced considerable reduction in mean annual river flow of the main rivers. The five year mean annual flow for the Metropolitan Region was 83,648 L/s from 2009 to 2013 and 65,850 L/s for the region of O’Higgins.
3.2. Water Users and Demand
This section details the water use of each sector within the investigated regions. The data comes from a report published by the DGA investigating water demand by sector in Chile [
17,
23]. The data compiled in the report for each sector was obtained from censuses, industry wide surveys, data from government agencies and from previous water demand studies. The purpose of the report was to provide data regarding water demand to the appropriate authorities and any people or organizations with a stake in water resource management in Chile.
Table 2 below displays the values of water demand recorded by the DGA [
17,
23] for each sector within each region considered within this study, these values are reported in L/s.
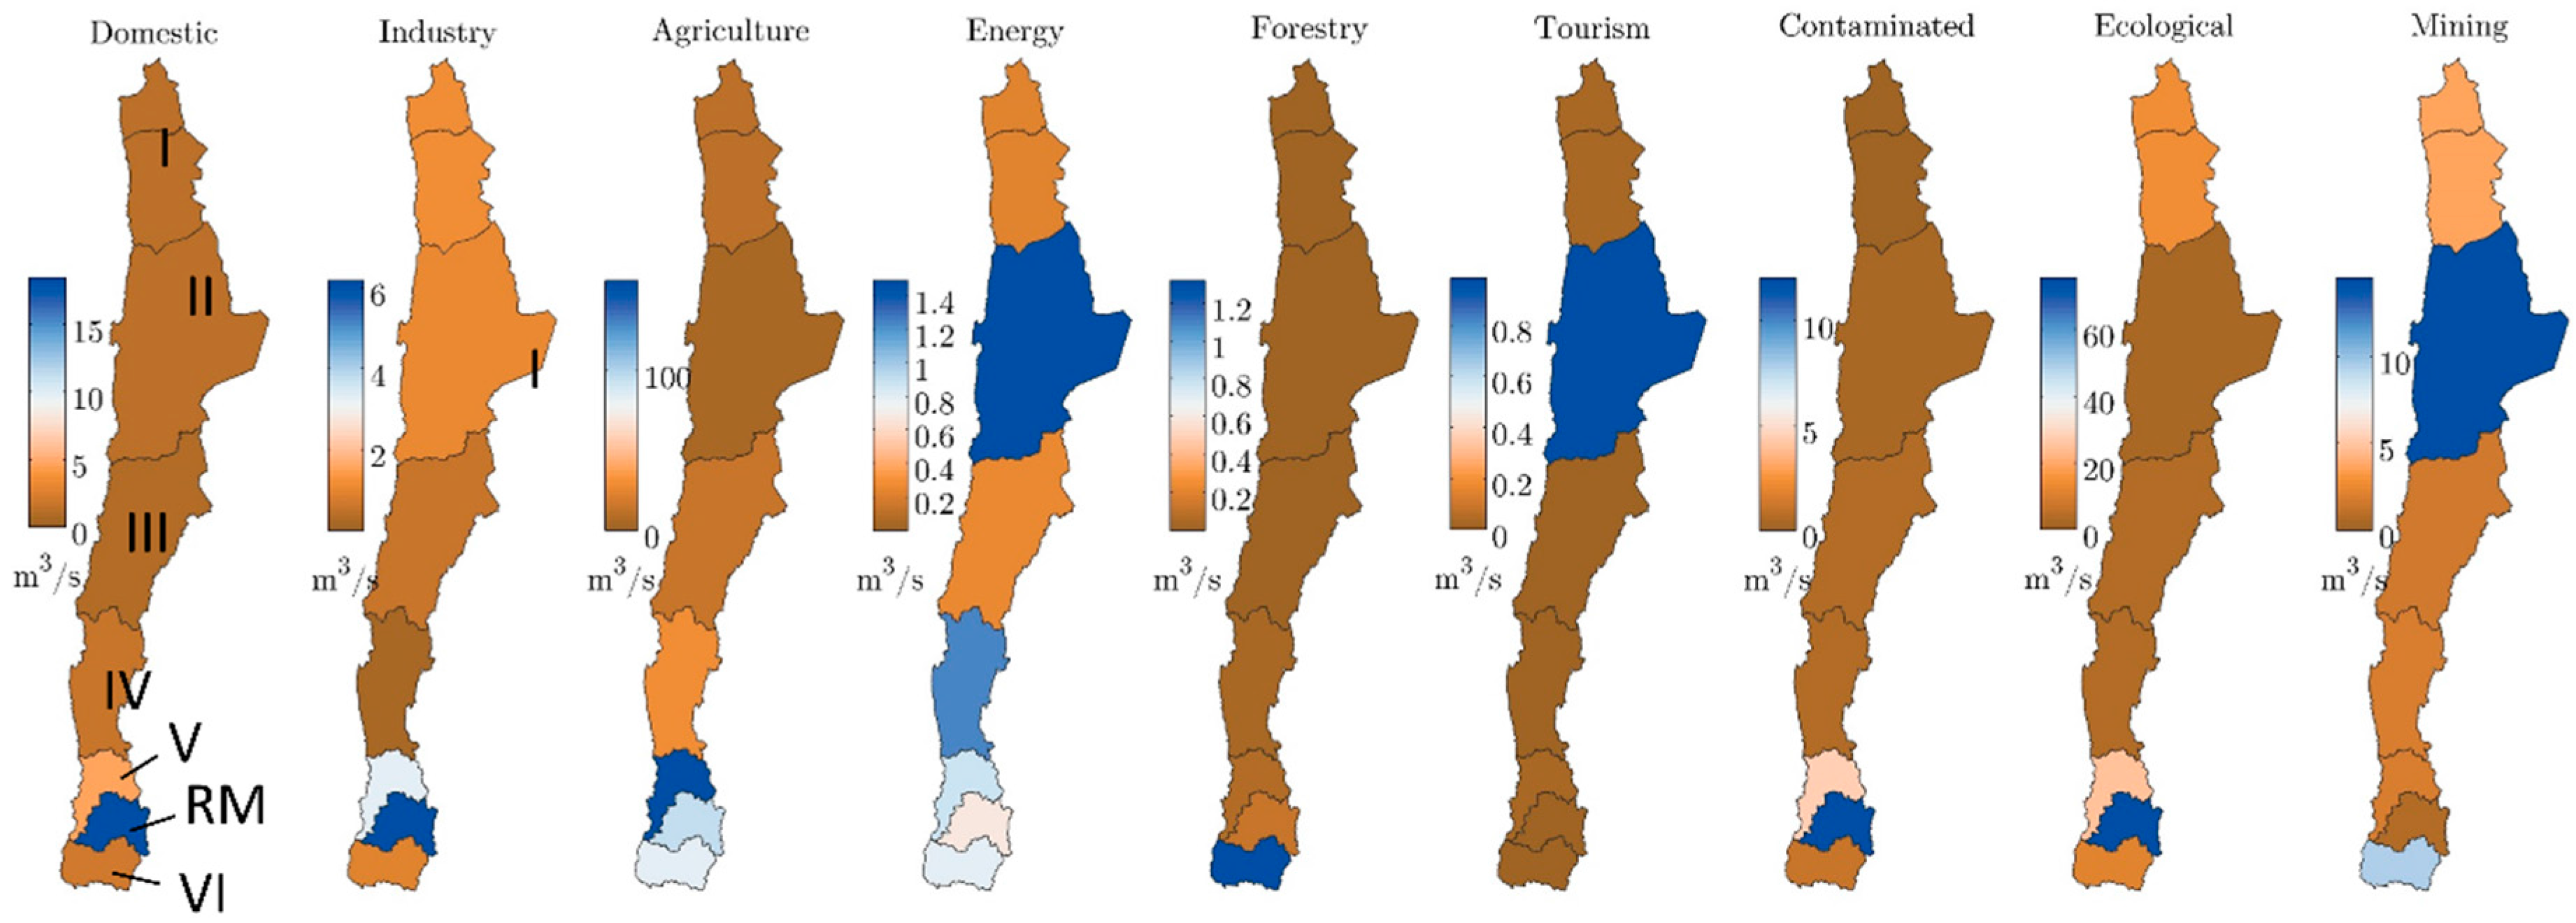
Figure 3 displays the water demand data graphically for each sector by region.
Table 2.
The water demand (L/s) of each sector by region.
Table 2.
The water demand (L/s) of each sector by region.
| Sector |
|---|
| Region | 1 | 2 | 3 | 4 | 5 | 6 | 7 | 8 | 9 |
|---|
| I | 1258 | 1162 | 8927 | 211 | - | 13 | - | 3665 | 530 |
| II | 1010 | 1062 | 3308 | 1493 | - | 984 | 292 | 14,555 | 490 |
| III | 611 | 515 | 12,015 | 255 | 1 | 1 | 397 | 1604 | 820 |
| IV | 1526 | 175 | 27,235 | 1250 | 31 | 6 | 602 | 1770 | 3440 |
| V | 4595 | 3311 | 156,589 | 886 | 64 | 13 | 4450 | 1679 | 25,236 |
| RM | 18,510 | 6195 | 82,361 | 669 | 96 | 2 | 12,088 | 481 | 75,450 |
| VI | 2012 | 874 | 97,964 | 807 | 1320 | 0.2 | 1043 | 9396 | 10,060 |
Figure 3.
The water demand of each sector by region. Source: Prepared by the authors on the basis of official geographical data from the Chilean State Catalogue of Geospatial Data [
11].
Figure 3.
The water demand of each sector by region. Source: Prepared by the authors on the basis of official geographical data from the Chilean State Catalogue of Geospatial Data [
11].
3.3. The Water Scarcity Index
The water scarcity index was determined for each of the regions based on the historical mean annual runoff and the water demand data aggregated for each region obtained from the report of the Chilean Water Authority (DGA) [
23].
Table 3 displays the mean annual runoff values alongside total water demand and the ecological flow.
Table 3.
Values of water availability and total water demand by region for all data sources.
Table 3.
Values of water availability and total water demand by region for all data sources.
| MAR (L/s) | Total Water Demand (L/s) | Ecological Flow (L/s) |
|---|
| I | 11,900 | 15,236 | 530 |
| II | 930 | 22,704 | 490 |
| III | 1880 | 15,399 | 820 |
| IV | 22,200 | 32,595 | 3440 |
| V | 40,700 | 171,587 | 25,236 |
| RM | 103,000 | 124,402 | 75,450 |
| VI | 205,000 | 113,416 | 10,060 |
Using these values of runoff and demand, the water scarcity index for each region was calculated.
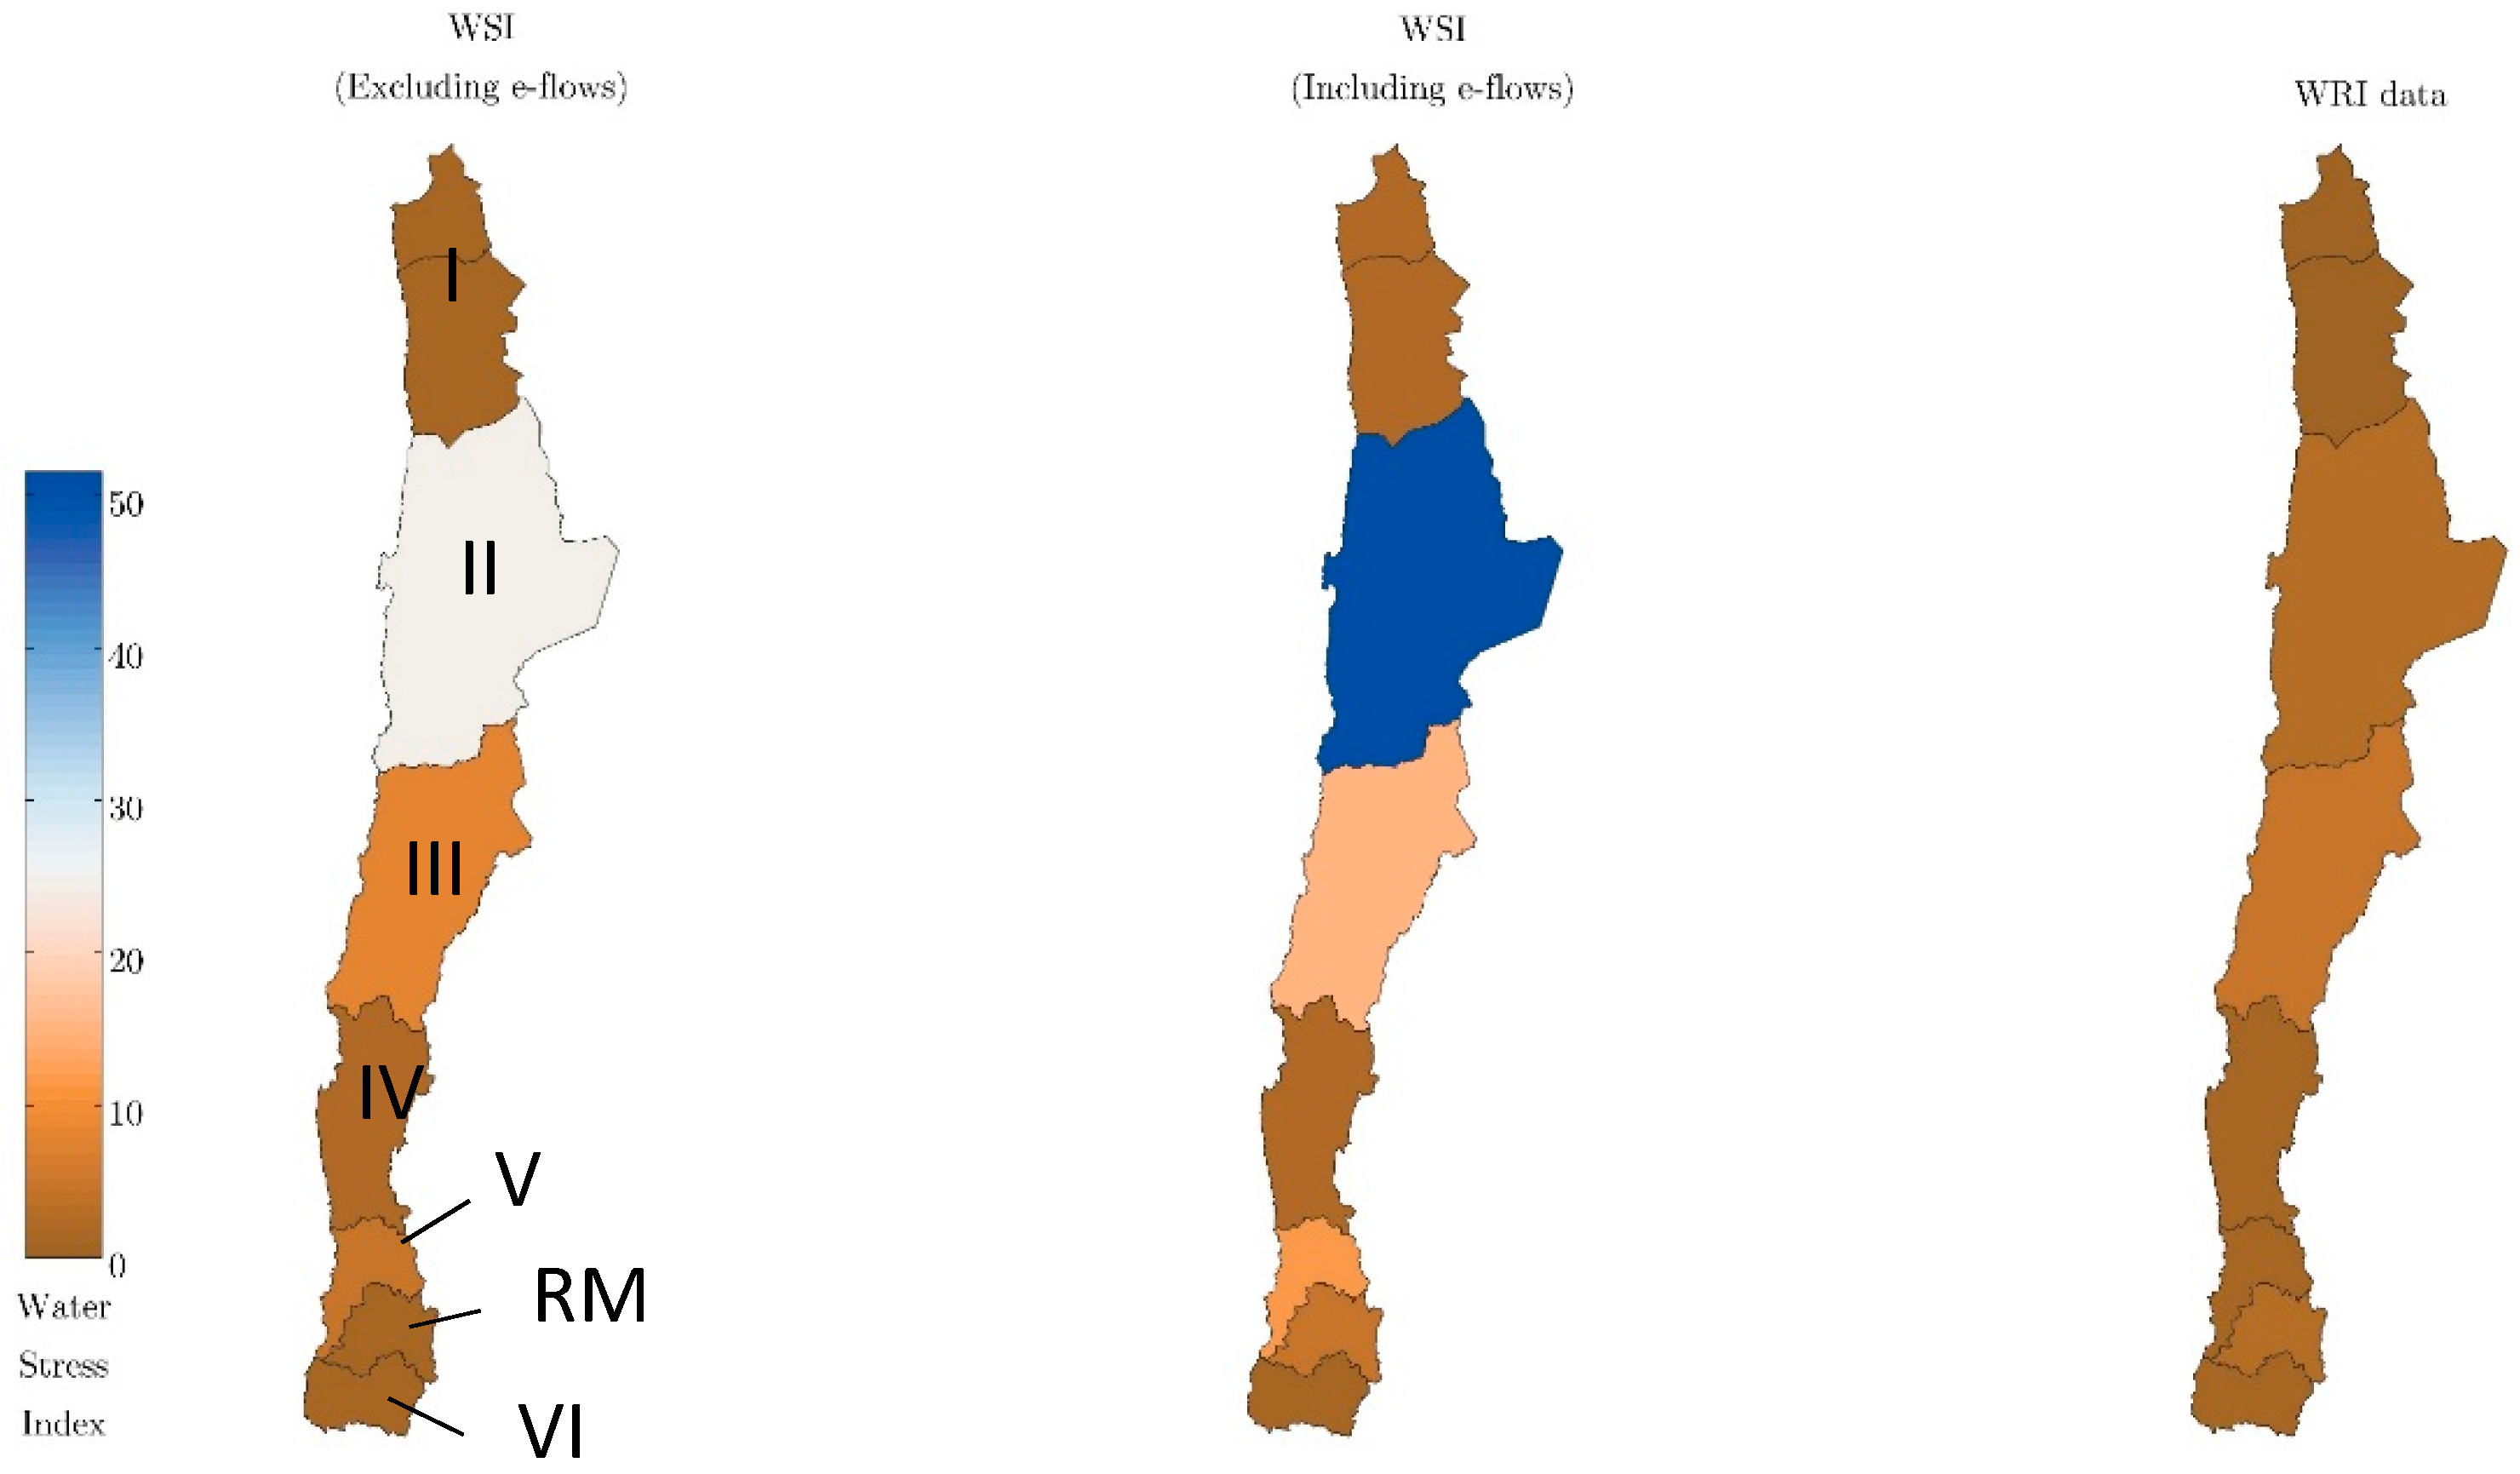
Table 4 below displays the WSI values for each region with and without the inclusion of ecological flow for the water consumption. The table also includes water stress values calculated using water availability and consumption data downloaded from the World Resources Institute (WRI) for comparison.
Figure 4 displays graphically the WSI values for each region with and without ecological flow requirements and using data obtained from the WRI.
Figure 4.
Water scarcity index values by region for each combination of inputs. Source: Prepared by the authors on the basis of official geographical data from the Chilean State Catalogue of Geospatial Data [
11].
Figure 4.
Water scarcity index values by region for each combination of inputs. Source: Prepared by the authors on the basis of official geographical data from the Chilean State Catalogue of Geospatial Data [
11].
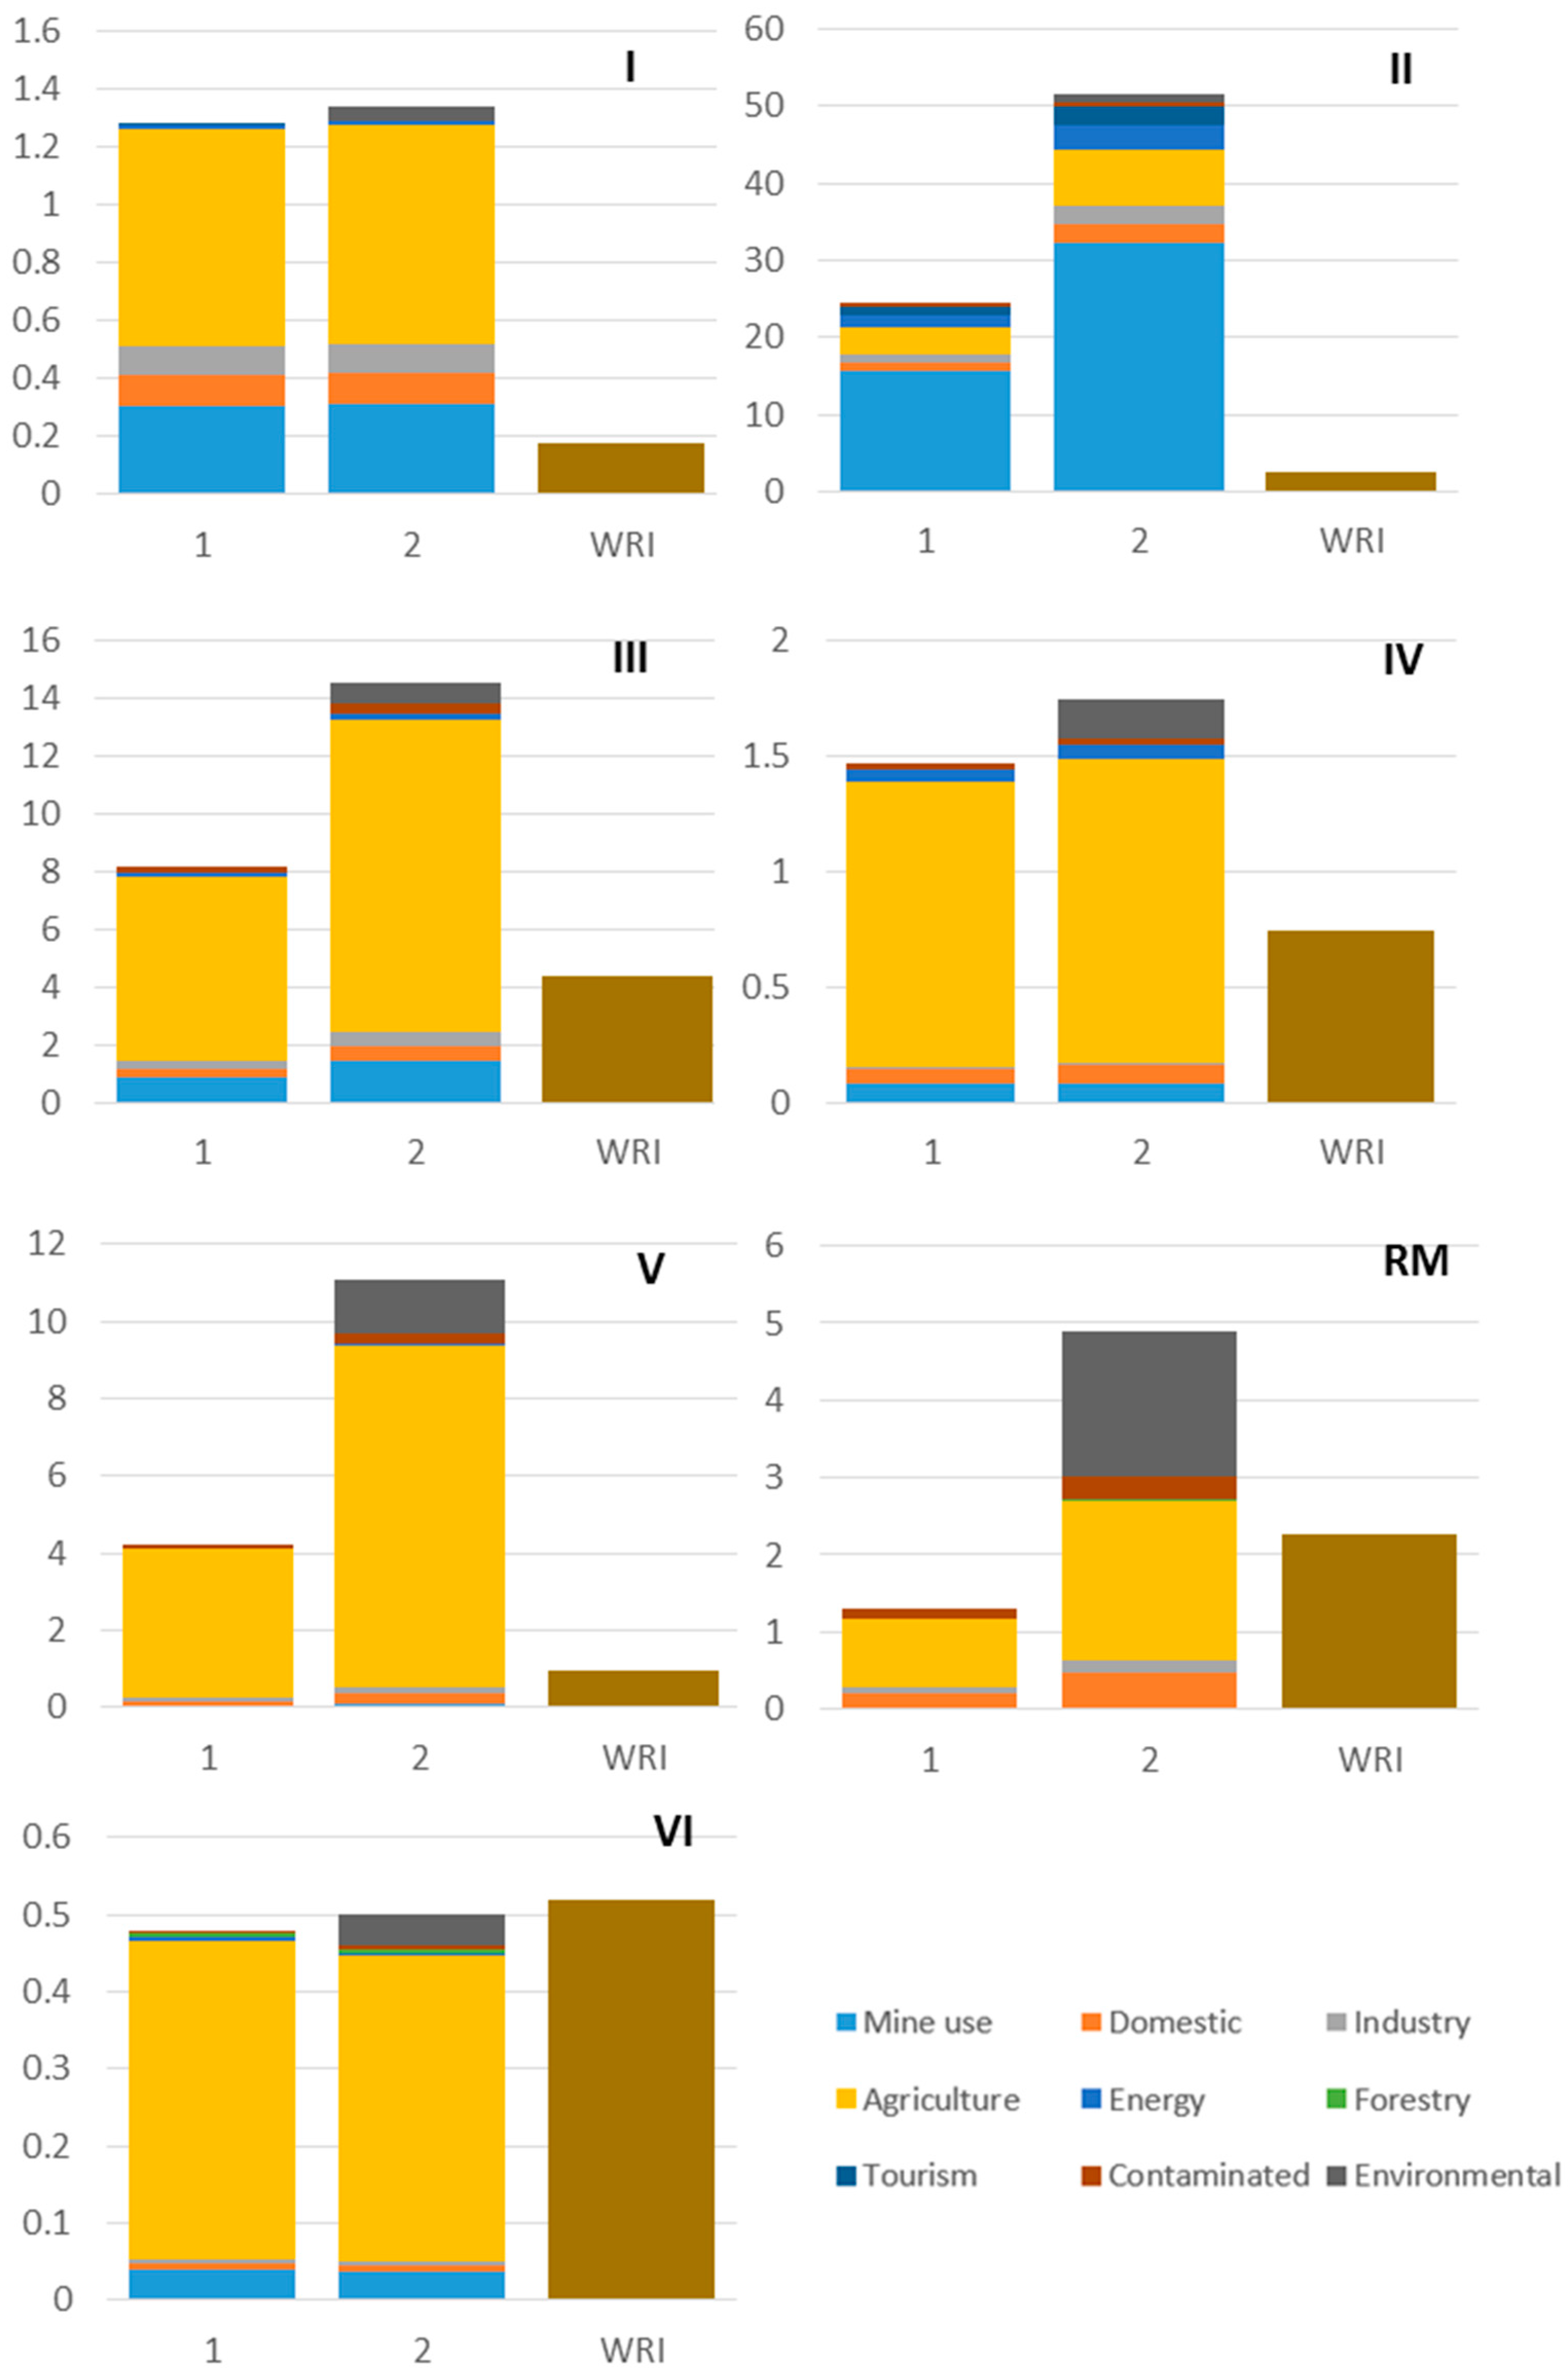
It can be observed from the above table and figure that the highest water scarcity index values occur in the second region of Antofagasta, where a value of 24.4 was calculated without including the ecological flow requirements and 51.6 when the ecological flow was included.
Table 4 shows all WSI values for each region were calculated to be greater than one with the exception of region VI, regardless of whether ecological flow requirements were included or not. These values indicate high overexploitation in all regions and moderate exploitation in region VI. The values obviously increased where the ecological flows were although the sensitivity to the flows varied by region. The ecological flows in the northern regions were calculated to have a high impact on the regional water scarcity relative to the central regions due to the very low availability of water. There was little change where water availability was higher and requirements were low such as for regions I, IV and VI. High values were recorded when requirements were high relative to availability such as regions II, V and RM.
Table 4.
Values of water scarcity index for each region and data set combination (with and without environmental requirements) and for WRI data.
Table 4.
Values of water scarcity index for each region and data set combination (with and without environmental requirements) and for WRI data.
| WSI (Excluding Ecological Flow) | WSI (Including Ecological Flow) | WRI Data |
|---|
| I | 1.28 | 1.34 | 0.18 |
| II | 24.41 | 51.60 | 2.48 |
| III | 8.19 | 14.53 | 4.39 |
| IV | 1.47 | 1.74 | 0.74 |
| V | 4.22 | 11.10 | 0.97 |
| RM | 1.17 | 4.37 | 2.26 |
| VI | 0.55 | 0.58 | 0.52 |
When comparing the WSI values from this study with the values calculated using WRI data, there is a general disparity. In each region, other than Metropolitan and region VI, the WRI value of water scarcity is considerably lower than those calculated in this study. In region I, the value of 0.2 suggests only slight exploitation of water resources and for region IV, the value indicates heavy exploitation although the value of 0.7 is around half of the values calculated in this study. For the Metropolitan Region the value calculated using the data from the WRI was between those calculated with and without the ecological flow. The water scarcity in this region is clearly sensitive to the inclusion of the ecological flow, the provision of which greatly increases the water scarcity. There are various possible reasons why the water stress values are lower for the WRI data, in general, than for the data used for this study. For their study, the WRI calculated withdrawals based on various indicators such as GDP, population, area under irrigation and power consumption [
25]. This methodology could lead to an underestimation of withdrawals if the mining industry has not been fully considered or the consumption of agriculture is undervalued. Despite the lower WSI values, the values calculated using the WRI data still suggest high overexploitation in several of the investigated regions, particularly regions II, III, V and the metropolitan region. It is important to note several limitations of the method used to determine the water scarcity index. The values used for the water demand are not values of water consumption, it is therefore possible that some sectors are consuming less than the stated value of demand therefore the values of water scarcity could be exaggerated. Furthermore, the runoff and demand values are averaged annually and therefore analysis of shorter term water scarcity cannot be completed, problems related to short term droughts for example cannot be observed. The variation in results dependent upon the quality of the data source may be misleading for public policy and, given the age of the available data, it is essential water resource availability and consumption data be regularly updated, with a more specific approach allowing accurate analysis of water scarcity.
3.4. Contribution of Different Sectors to Water Demand
Despite variations in WSI values, it is clear that action is required in each of the studied regions of Chile to reduce water scarcity to limit environmental damage and potential conflict between users. An important first step is to investigate which sectors are the greatest users and what potential actions could be implemented to reduce water scarcity.
Figure 5 displays the water scarcity index values by region and includes the contribution of each sector to the WSI value based on the proportion of demand.
Figure 5.
WSI values by region detailing contributions by sector excluding (1) and including (2) ecological flow requirements, and using data obtained from the World Resource Institute [
25].
Figure 5.
WSI values by region detailing contributions by sector excluding (1) and including (2) ecological flow requirements, and using data obtained from the World Resource Institute [
25].
It can be observed that in each region agriculture is the main water consumer with the exception of the second region of Antofagasta. The proportion of agricultural consumption is as high as 91.2% in the fifth region of Valparaiso when the ecological flow was not considered. Similar high proportions of demand were recorded for the fourth and sixth regions at 83.6% and 86.4%, respectively. The mining industry has a high impact upon water demand in the most northern regions (I–III) of Chile, particularly in the second region of Antofagasta where it was calculated that consumption from mining accounts for 64.1% of total demand. This is largely because of the abundance of minerals and metals in the region but also due to the lower suitability of the climate for agricultural purposes [
37] although agricultural water demand is still in evidence, accounting for 14.6% of water demand. The consumption from mining is second greatest in the third region although the impact is much lower than that of agriculture which accounts for 78% of water demand. In the fifth region and the Metropolitan Region, the consumption of water for domestic use and loss through contamination is high compared to the other regions. In the Metropolitan Region, domestic use accounts for 15.4% of demand, agriculture still dominates, however, accounting for 68.4% of demand. The proportional demand for mine consumption increases again in region VI where El Teniente, the world’s largest underground copper mine is located [
38]. Mining in this region accounts for 8.3% of demand compared to 0.4% in the Metropolitan Region where little mining exists. The analysis suggests that reducing demand from agriculture is likely to provide the greatest benefits in the majority of the northern and central regions of Chile due to comparatively high water use. Where water scarcity is worst (regions I, II and III), however, modifications to the freshwater consumption of the mining industry could also potentially yield great benefits. This is particularly true of the second region where mining was calculated as being the greatest water consumer.
3.5. Water Demand of the Mining Industry
The water demand values for the mining activities were obtained from the Chilean Water Authority 2007 study investigating water demand by sector [
17,
23]. The study investigated water consumption for all mine types from 1986 to 2005 using data mainly from COCHILCO and SOFOFA, a Chilean trade association [
17]. It is important to note that conditions in the mining industry have been changing recently, particularly within the copper mining industry. These changes are mainly related to low copper prices and reduced ore grades [
39]. As a result, greater volumes of ore are being processed to recover the same mass of copper requiring greater inputs of water, materials and energy. With respect to water use in Chile within the copper mining industry, values have remained relatively constant according to data provided by the Chilean Copper Commission [
40].
Table 5 below displays the values of water consumption and mineral processing in the copper mining industry from 2009 to 2014. There is considerably less publically available data for other types of mineral mining in Chile making it difficult to know if water use is changing in the mining sector as a whole. If the copper mining industry is representative of the industry, there is currently little increase in water consumption, and the data published by the Government Water Agency is a good indicator of current levels of consumption. Nevertheless, it is predicted by the Copper Mining Commission that water consumption is set to increase, and COCHILCO recently published a report predicting the use of different water types from the copper mining industry based on surveys and extrapolation of results [
18].
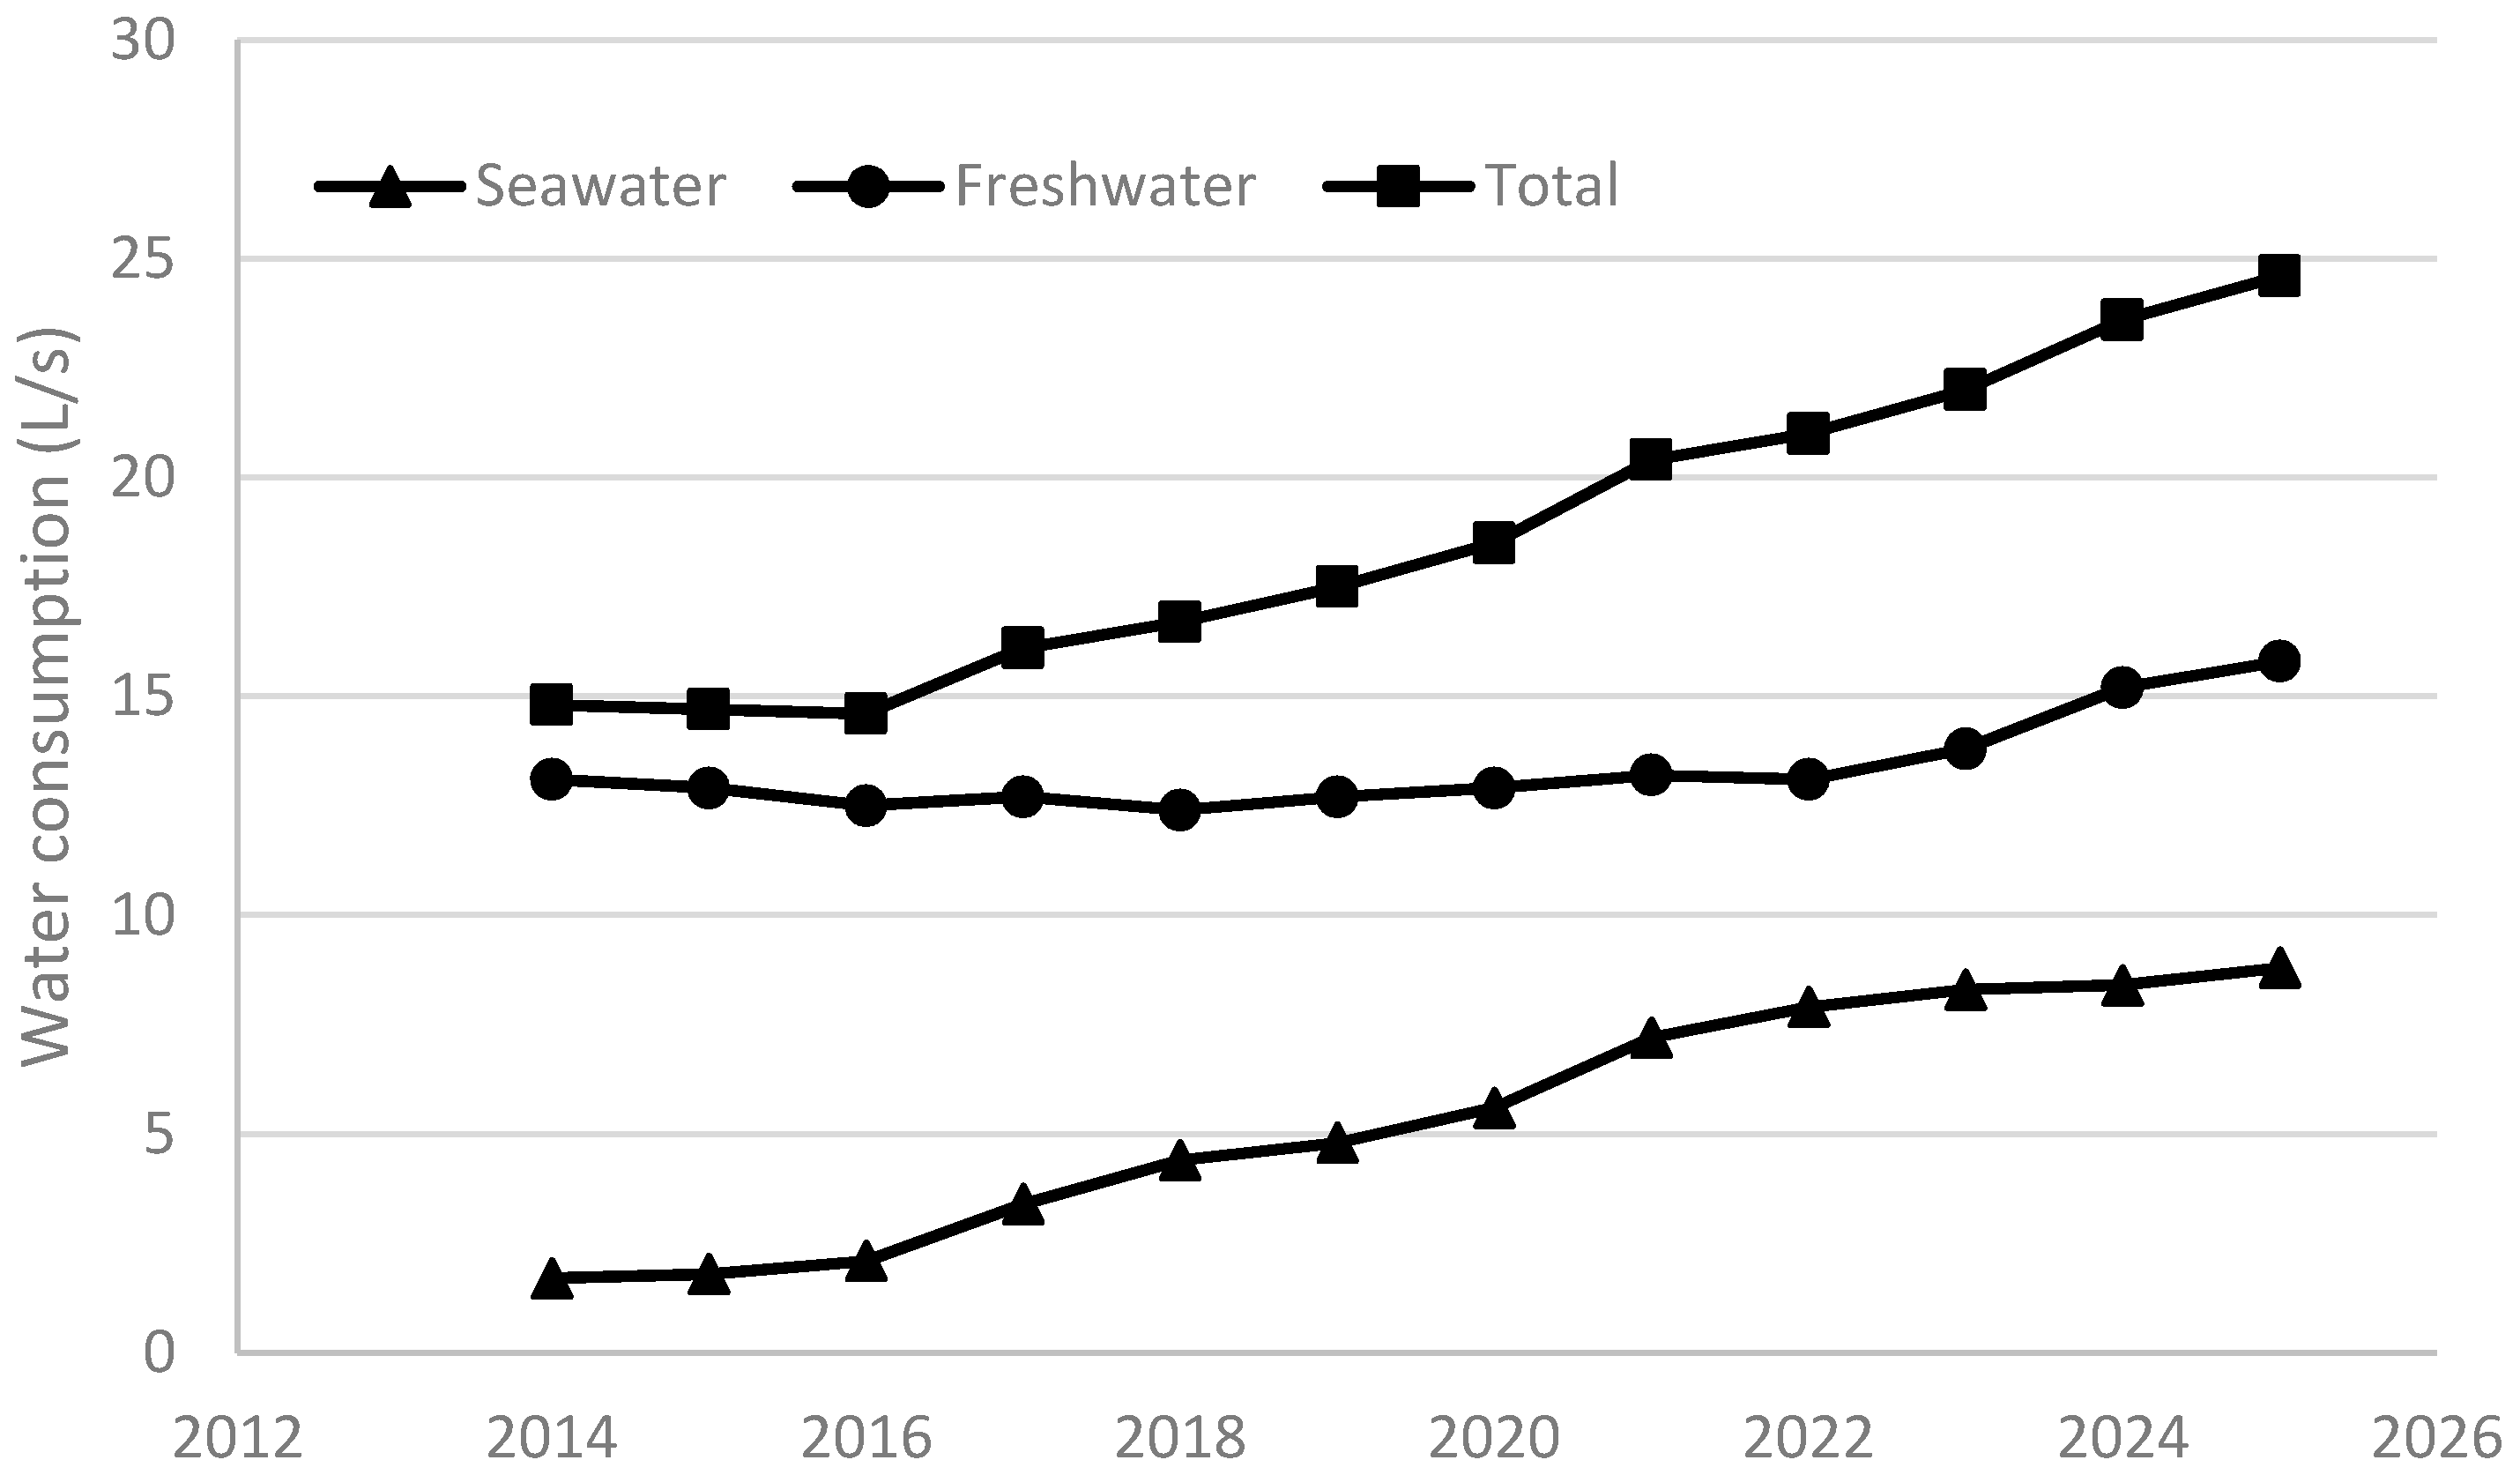
Figure 6 below displays the predicted increase in water consumption within the industry from freshwater, seawater and the combined total.
Providing the predictions displayed within
Figure 6 above are correct, water consumption will increase considerably within the mining industry in the next 10 years and despite the increase being mainly supplied by seawater, an overall increase in freshwater consumption will still occur. This persistent reliance will place continued strain on local water resources and potentially worsen the situation. It is highly important that efforts are made within the mining industry to reduce consumption, the following section discusses potential solutions.
Table 5.
Freshwater consumption of the copper mining industry (COCHILCO).
Table 5.
Freshwater consumption of the copper mining industry (COCHILCO).
| 2009 | 2010 | 2011 | 2012 | 2013 | 2014 |
|---|
| Freshwater consumption (L/s) | 12.270 | 12.651 | 12.564 | 12.379 | 12.497 | 12.737 |
| Mineral processed (Mton) | 891.8 | 919.2 | 912.7 | 1018.6 | 1087.7 | 1189.6 |
Figure 6.
Forecast water consumption data for the Chilean copper mining industry using data published by COCHILCO [
17].
Figure 6.
Forecast water consumption data for the Chilean copper mining industry using data published by COCHILCO [
17].
3.6. Methods for Water Consumption Reduction in Mining
The problem of high water consumption in mining is one experienced in many regions worldwide [
41]. As a result, many techniques have been explored to reduce consumption [
26,
42]. Examples of water consumption reduction methods include: evaporation reduction, improved thickener performance, alternative dust suppression techniques, dry processing, reduced on-site water use and sea water substitution among various others [
41,
42]. The issue of high water consumption in mining in Chile is starting to be taken seriously by the government and by mining companies [
42]. Nevertheless, as mentioned, water consumption within the industry is expected to increase over the next 10 years from a value of 14.6 m
3/s of freshwater in 2014 to 24.6 m
3/s in 2025 [
18] due to the development of new projects and reduced ore concentration. Indeed, a rise in water consumption is expected in all mining regions except the Metropolitan Region [
18].
Some inroads are being made in the Chilean mining industry with regards to water consumption; most large mining companies are now monitoring water use and each year publishing sustainability reports which encourage responsible water use [
42]. Case studies of good practice include the Candelaria mine, where a water recycling rate of 87% has been recorded, mostly from water recirculated from copper concentrate and tailing thickeners [
42]. The Codelco Norte Division has installed a monitoring system to track water consumption in all processes and determine where the greatest savings can be made. Additionally, the company has been analyzing the possible savings from potential water saving developments such as a desalinization plant. Some operations are already using seawater and desalinization. The Michilla mine, for example, uses raw seawater for dust suppression as well as in the leaching process [
42]. The Escondida mine has a highly ambitious plan to supply all required water via desalinization of seawater thus freeing the plant from all freshwater requirements [
42]. The mining industry in Chile is improving although strategies require widespread implementation to be effective on a regional scale, particularly with a forecasted rise in consumption.
In their study, Gunson
et al. [
41] investigated the effectiveness of combining a number of water consumption reduction strategies upon overall water use. The authors considered a basic copper mining operation with no strategies implemented as a base case and calculated the water use based on a number of studies. Typical water use reduction strategies were then tested and, using estimates of water reduction based on related research, the reduction of total water consumption was determined relative to the base case. It was calculated that the greatest reductions could be made through retention of tailings, avoiding evaporation from ponds and beaches, and dust suppression on roads using binders thus reducing the consumption of water. The best combined strategy achieved a 74% reduction in water use compared with the base case. With respect to operations in Chile where few water reduction strategies have been implemented, there is likely to be potential for high water savings based on similar strategies.
For further analysis, various water reduction efficiencies were tested for their impact on water scarcity index values. Low (25%), medium (50%) and high (75%) total water reduction efficiencies were tested. The water consumption of the mining industry for each region was reduced by each of the above percentages and the WSI was recalculated. The values are displayed below in
Table 6.
Table 6.
Original and recalculated WSI values for improved water efficiencies in the mining industry by region.
Table 6.
Original and recalculated WSI values for improved water efficiencies in the mining industry by region.
| | Excluding Eco-Flows | Including Eco-Flows |
|---|
| WSI | Low | Medium | High | WSI | Low | Medium | High |
|---|
| I | 1.28 | 1.20 | 1.13 | 1.05 | 1.34 | 1.26 | 1.18 | 1.10 |
| II | 24.41 | 20.50 | 16.59 | 12.68 | 51.60 | 43.33 | 35.06 | 26.79 |
| III | 8.19 | 7.98 | 7.76 | 7.55 | 14.53 | 14.15 | 13.77 | 13.39 |
| IV | 1.47 | 1.45 | 1.43 | 1.41 | 1.74 | 1.71 | 1.69 | 1.67 |
| V | 4.22 | 4.21 | 4.20 | 4.18 | 11.10 | 11.07 | 11.04 | 11.01 |
| RM | 1.17 | 1.17 | 1.17 | 1.17 | 4.37 | 4.37 | 4.36 | 4.36 |
| VI | 0.55 | 0.54 | 0.53 | 0.52 | 0.58 | 0.57 | 0.56 | 0.55 |
The proposed efficiency increases within the mining industry were calculated to considerably reduce the water scarcity index in the regions most impacted by mining, regions I, II and III. In region I, the high efficiency scenario of a 75% reduction in water use reduced the water scarcity index to 1.10 (where ecological flows were included), an 18% reduction. In the second region of Antofagasta, the improvement was greater, with the high efficiency scenario reducing the WSI by 48%. The impact for the other regions was lower due to the lesser impact of mining. Improved water efficiencies within the mining industry would clearly have a highly beneficial impact on the water scarcity situation in Chile‘s northern and central regions, and the greatest impact would be experienced by the regions of Arica, Parinacota and Tarapaca (I), and Antofagasta (II). Nevertheless, water scarcity index values for the northern regions would remain high and further strategies require investigation to lower scarcity further.
3.7. Water Demand of the Agricultural Industry
The agricultural sector is highly important to Chile providing 3.3% of the country’s GDP and employing around 10% of the population [
43]. The agriculture industry, however, is the greatest consumer of water in Chile and contributes greatly to the issue of water scarcity in many of the central and northern regions. Much of the irrigation used in Chile is traditional, gravity fed and therefore relatively inefficient in terms of how much water is used by the plants.
Table 7 displays the volumes of water used for irrigation and methods in each of the regions investigated in this study published by the Institute for Agricultural Research [
44].
Table 7.
Percentage of irrigation types used in Chile by region.
Table 7.
Percentage of irrigation types used in Chile by region.
| Region | Gravity Irrigation (%) | Advanced Irrigation (%) |
|---|
| I | 79.58 | 20.42 |
| II | 98.03 | 1.97 |
| III | 37.93 | 62.07 |
| IV | 50.76 | 49.24 |
| V | 41.80 | 58.20 |
| RM | 66.47 | 33.53 |
| VI | 72.04 | 27.96 |
For this study it is assumed that the gravity fed irrigation could be upgraded to a more water use efficient system such as a micro-sprinkler system. The upgrading of the traditional irrigation systems to a micro-sprinkler system was tested to investigate the impact upon the regional water scarcity. Values for irrigation efficiency were based on the research of [
45]. The gravity irrigation was assumed to have an efficiency at the average range of furrow irrigation of 60% and micro-sprinkler systems were assumed to have an efficiency of 90%. Upgrading of the system would therefore provide a 30% increase in efficiency. The 30% increase in water use efficiency was applied to the percentage of gravity irrigation for each region and water demand.
Table 8 below displays the calculated water scarcity index values calculated based on the improved values of water demand for the agricultural sector.
Table 8.
Recalculated WSI values based on an upgrading of irrigation technologies.
Table 8.
Recalculated WSI values based on an upgrading of irrigation technologies.
| Excluding Eco-Flows | Including Eco-Flows |
|---|
| WSI | WSI Irrigation Upgrade | WSI | WSI Irrigation Upgrade |
|---|
| I | 1.28 | 1.10 | 1.34 | 1.15 |
| II | 24.41 | 23.37 | 51.60 | 49.39 |
| III | 8.19 | 7.46 | 14.53 | 13.24 |
| IV | 1.47 | 1.28 | 1.74 | 1.52 |
| V | 4.22 | 3.73 | 11.10 | 9.83 |
| RM | 1.17 | 1.01 | 4.37 | 3.77 |
| VI | 0.55 | 0.45 | 0.58 | 0.47 |
The impact of upgrading the traditional irrigation varied depending on the percentage of water demand from the agricultural industry and the existing proportion of advanced irrigation technologies implemented. The highest reduction was observed in the sixth region of O’Higgins at 18.7%, slightly lower reductions where observed in regions I (14%), IV (12.7%), V (11.4%) and the Metropolitan Region (13.6%). The impacts on regions II and III were lower due to the lower proportional demand of agriculture in these regions. These results suggest that improvement to the irrigation efficiency of the agricultural sector in all regions would provide considerable benefits to many of Chile’s regions that are suffering water scarcity. It should be noted that as a single measure of water reduction, the impact remains relatively limited. Furthermore, the high energy costs of micro-sprinkler systems may be a barrier to widespread uptake in Chile. This tradeoff between water and energy is an area for further investigation.
3.8. Combination of Water Use Reduction Strategies
The combination of the implementation of water use reduction measures in the mining industry combined with increasing irrigation efficiency in agriculture was tested to investigate the impact on regional water scarcity values. The calculated values are displayed in
Table 9 below.
Table 9.
Recalculated WSI values for a combination of strategies.
Table 9.
Recalculated WSI values for a combination of strategies.
| Excluding Eco-Flows | Including Eco-Flows |
|---|
| | WSI | Low | Medium | High | WSI | Low | Medium | High |
|---|
| I | 1.28 | 1.02 | 0.95 | 0.87 | 1.34 | 1.07 | 0.99 | 0.91 |
| II | 24.41 | 19.45 | 15.54 | 11.63 | 51.60 | 41.12 | 32.85 | 24.58 |
| III | 8.19 | 7.25 | 7.04 | 6.82 | 14.53 | 12.86 | 12.48 | 12.10 |
| IV | 1.47 | 1.26 | 1.24 | 1.22 | 1.74 | 1.49 | 1.47 | 1.45 |
| V | 4.22 | 3.72 | 3.71 | 3.70 | 11.10 | 9.80 | 9.77 | 9.74 |
| RM | 1.17 | 1.01 | 1.01 | 1.01 | 4.37 | 3.77 | 3.77 | 3.76 |
| VI | 0.55 | 0.44 | 0.43 | 0.42 | 0.58 | 0.46 | 0.45 | 0.44 |
The combination of strategies studied in this paper maximize the reduction in regional water scarcity. The greatest reductions were calculated to occur in the second region (52%), the first region (32%) and the sixth region (25%) due to the dominance of the mining industry in the second region and the large presence of both mining and agriculture together in the first and sixth regions. The implementation of such strategies are essential in reducing the water scarcity of Chile’s central and northern regions, and further strategies will be required to improve the situation in those regions worst affected—the second, third and fifth regions. Further potential solutions which could potentially merit investigation are the complete substitution of freshwater with seawater in the mining industry and substitution of agricultural crops from water demanding crops to less demanding crops. Such moves, however, require robust economic and practical analysis.


