Article

The Spatiotemporal Variation of Drought in the Beijing-Tianjin-Hebei Metropolitan Region (BTHMR) Based on the Modified TVDI

1
College of Geomatics, Shandong University of Science and Technology, Qingdao 266590, China
2
College of Mining and Geomatics, Hebei University of Engineering, Handan 056038, China
3
Collaborative Innovation Center of Comprehensive Development and Utilization of Coal Resource, Handan 056021, China
4
Research Center of Hebei Province Ecological Civilization and Social Governance, Handan 056021, China
*
Author to whom correspondence should be addressed.
Sustainability 2016, 8(12), 1327; https://doi.org/10.3390/su8121327
Submission received: 19 October 2016 / Revised: 27 November 2016 / Accepted: 13 December 2016 / Published: 16 December 2016
(This article belongs to the Special Issue Sustainable Ecosystems and Society in the Context of Big and New Data)

Abstract

:
This study proposes a modified vegetation-dependent temperature-vegetation dryness index (TVDI) model for analyzing regional drought disasters in the Beijing-Tianjin-Hebei Metropolitan Region (BTHMR) of China. First, MODIS monthly normalized difference vegetation index (NDVI), land surface temperature (LST) data and land use/cover data (Land cover type2) were pre-processed as a consistent big dataset. The land use/cover data were modified and integrated into six primary types. Then, these land types were used as the base data layer to calculate the TVDI by parameterizing the relationship between the MODIS NDVI and LST data. By emphasizing different types of land uses, this study was able to compare and analyze the differences of the TVDI indices between the entire study area (no consideration of the land types) and the six classified land uses. The soil moisture data were used to validate the modified TVDI values based on different land uses, which confirmed that the modified model more effectively reflected drought conditions. Finally, the aforementioned model was used to analyze the temporal and spatial variation of drought experienced by vegetation cover from 2000 to 2014. The results of the modified model were validated with the synchronized soil moisture and precipitation data. The case study clearly demonstrated that the modified TVDI model, which is based on different vegetation indexes, could better reflect the drought conditions of the study area.

1. Introduction

Drought is a common, periodically occurring and complex natural disaster. Prolonged drought causes reductions in crop production on one hand and directly affects the sustainable development of agriculture and societal stability on the other hand [1,2]. The extent of a drought is determined by its duration, intensity, and spatial distribution, as well as by the societal and economic status of the affected area [3]. Global warming has recently become increasingly apparent [4]. As a consequence of global warming, climate change directly influences the distribution of precipitation and spatial patterns [5,6], which, again, results in prolonged droughts in certain areas. Since the 1980s, the temperature in the BTHMR has markedly increased; reduced precipitation, a shortage of water resources, and the drying of the climate have become evident, causing frequent meteorological disasters. These meteorological disasters have caused enormous economic lost in this area; an annual average of tens of billions of Yuan has been lost since the 1990s, and the loss has increased every year [7].
With the continuous development of remote sensing technologies, we have observed significant progress in drought monitoring investigations over large areas. Watson et al. [8] were the first to use a thermal inertia model to investigate drought successfully. Idso et al. [9] proposed a Crop Water Stress Index (CWSI) based on energy equilibrium; however, this index accounts for complex factors, and its precision is determined by the extrapolation range of the meteorological parameters for the land surface [10]. By comparison, the construction of various vegetation indexes based on the spectral characteristics of vegetation has been more widely applied to monitor droughts. For example, Kogan [11] introduced the Vegetation Condition Index (VCI), which was based on a normalized difference vegetation index (NVDI), and Wang et al. [12] proposed the Vegetation-Temperature Condition Index (VTCI). Building on the vegetation supply water index (VSWI) developed by Nemani et al. [13] and the vegetation index/temperature (VIT) trapezoid proposed by Moran [14], Sandholt et al. [15] proposed a Temperature-Vegetation Dryness Index (TVDI) based on the VI (vegetation index) and LST (land surface temperature). Since then, more researchers have used TVDI or have improved the TVDI to assess and predict drought [16,17,18,19], and they have fit the TVDI value and observed value of soil moisture to the inverse of the soil moisture [20,21]. The results from a large number of studies [22,23,24,25,26] have demonstrated that it is more advantageous to use the combined vegetation index and the surface temperature to monitor drought or even to investigate the regional soil moisture distribution.
However, in performing a drought analysis by using TVDI or improved TVDI, most researchers have considered the study area as a whole; none have taken into consideration the existence of different land cover types. Given that vegetation heights and coverage can dramatically differ between woodland, grassland and farmland, the experimental results show that the corresponding surface maximum and minimum temperatures also exhibit large differences, resulting in a large variation in the calculated results of the TVDI. By using the temporal and spatial monitoring of drought in the BTHMR as the research objective to address this challenge, the present paper employs MODSI NVDI and LST data products along with DEM data to calculate the TVDI for the BTHMR in May of 2010. The coverage areas for woodland, grassland and farmland were also extracted, and the individual TVDI was calculated; these results were compared with the above results. The soil moisture and precipitation in the BTHMR were used to validate and analyze the above calculated results. The TVDI calculation according to different land-cover types was confirmed to yield more ideal results. In combination with land-cover type classification, the drought that occurred in the growing season from May to October between 2000 and 2014 in the BTHMR was analyzed.

2. Study Areas and Data

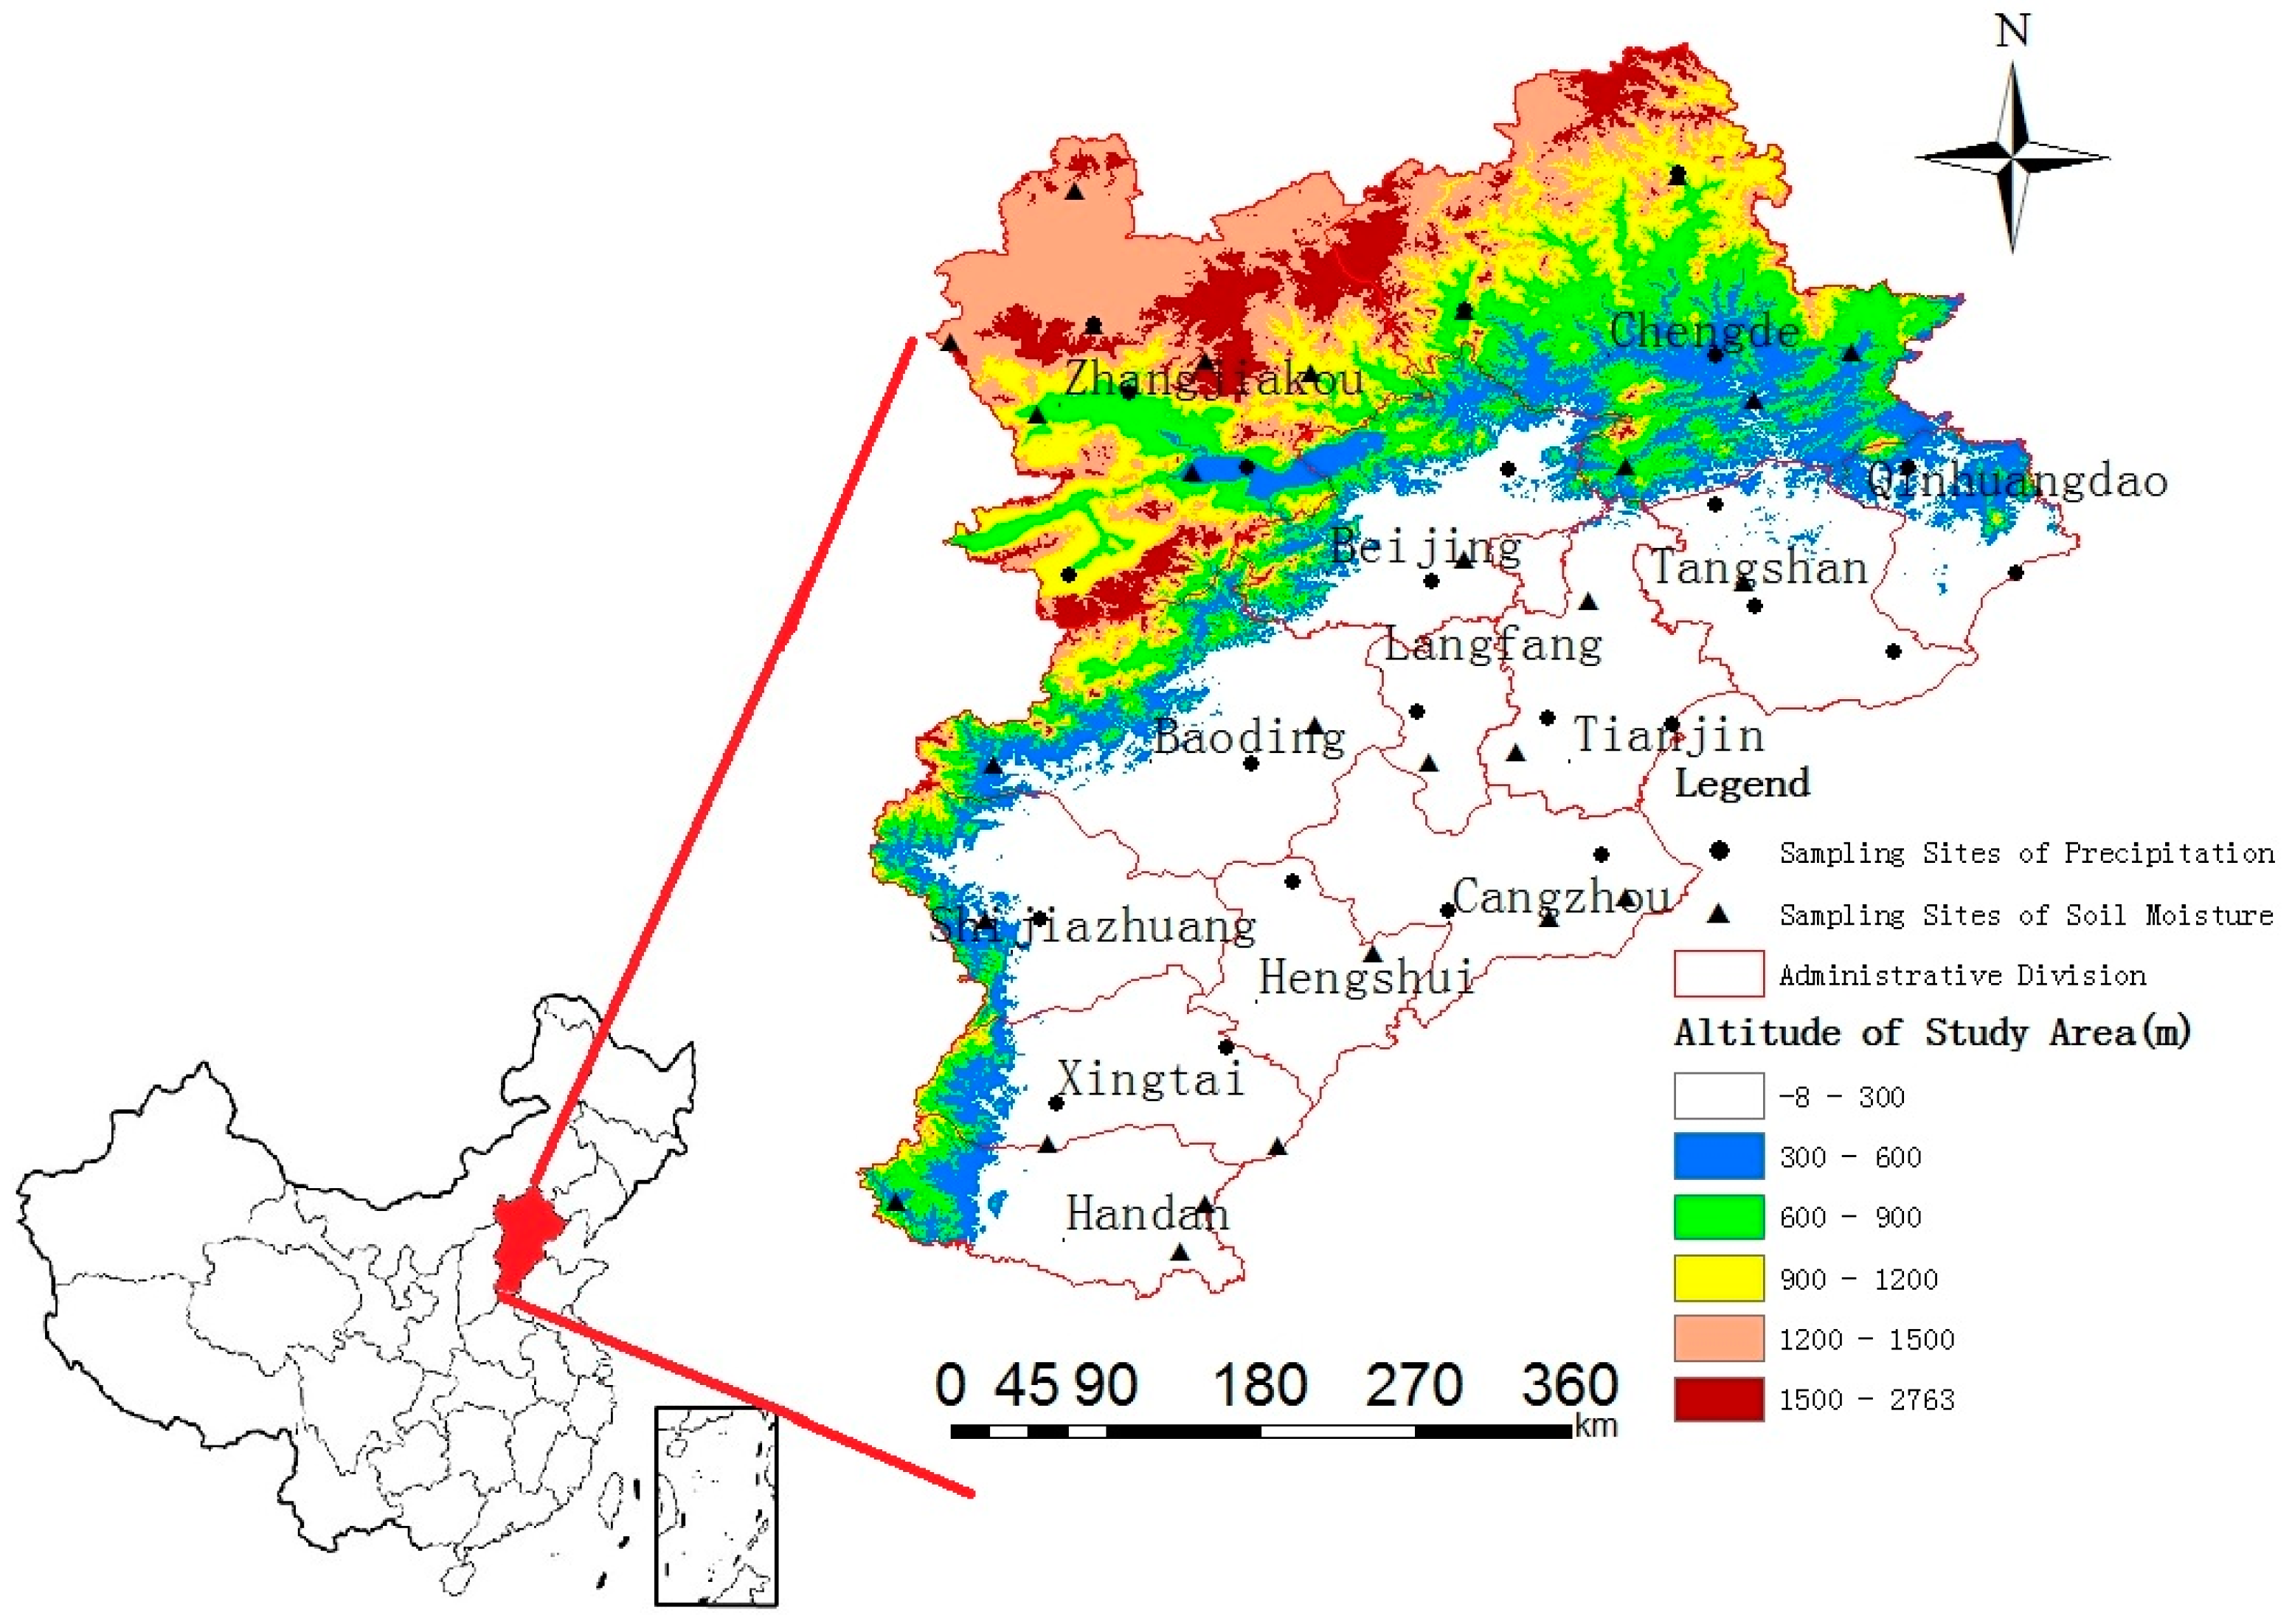
2.1. Overview of the Study Area

The BTHMR originated with the idea of constructing the capital in an economic circle that included Beijing, Tianjin, and 11 prefecture-level cities in Hebei province, as shown in Figure 1. The geographic coordinates are longitude 113°27′~119°50′ and latitude 36°05′~42°40′. The land area is 216 thousand km2, and the population is 110 million, of which 17.5 million are migrants. The study area has a higher elevation in the northwest than in the southeast, tilting from the northwest to the southeast. The landform is complex and diverse, and it is complete with plateaus, mountains, hills, basins and plains. There are three landform units, i.e., the Bashang Plateau, Yan and Taihang Mountains, and Heibei Plains. The altitude ranges from 0 m to 2763 m, with an average of 1200~1500 m, as shown in Figure 1. The BTHMR has a temperate, humid and semi-arid continental monsoon climate. The temporal and spatial distribution of the mean annual precipitation is extremely uneven. The precipitation varies significantly such that the precipitation between rainy and rainless years can be 15–20 times different, and the variation can normally vary by 4–5-fold [27]. This irregularity leads to frequent drought and flood disasters in this area. This area is the one of the primary wheat and maize production bases.

2.2. Source and Processing of Data

2.2.1. Remote Sensing and DEM Data

Due to the study area being large and covering a wide area, after fully considering the growing season, the temporal and spatial characteristics of the region’s different vegetation types [10,22], the temporal and spatial scale of the MODIS products, and the combination of phenological land cover characteristics, the MODIS Normalized Difference Vegetation Index (NDVI) and land surface temperature (LST) at a 1 km spatial resolution from May to October of each year were selected as the basic data sources. The data were collected for a total of 15 years, between 2000 and 2014.
There were two sources of MODIS products. One was downloaded from the Geospatial Data Cloud (GSCloud) at The Computer Network Information Center (CNIC) of the Chinese Academy of Sciences (CAS), from which the synthetic MODIS and the monthly NDVI and LST products were also obtained. However, because the website only provides data products from 2000 to 2010, the remaining MODIS products from 2011 to 2014 were complemented by MOD11A2 and MOD13A3 data that were downloaded from NASA’s official website. Among those complements, MOD11A2 was used to construct the monthly LST product based on the maximum value composite (MVC) method, and the MOD13A3 is a 1-km vegetation index monthly synthetic product.
The DEM data originated from the 30-m ASTER (Advanced Spaceborne Thermal Emission and Reflection Radiometer) GDEM data in GSCloud at CAS and were re-sampled to a 1-km resolution. A land surface temperature correction was performed by decreasing the temperature by 6 °C at a 1000-m altitude [28,29].
MODIS MOD12Q2 1-km standard data products of land grade 3 were used for the images of land use and cover change. The primary land cover classification products include the International Geosphere-Biosphere Program (IGBP) global vegetation classification scheme, the UMD Global Land Cover Classification, etc. The classification known as Land cover type2 from MODIS MOD12Q2 1 km standard data products was chosen for this paper, and it was further modified and combined with the farmland, grassland, woodland, water bodies, wetlands and urban use in the study area for each year. The land use type in the BTHMR for 2010 was used as the example. The distribution of the land types is shown in Figure 2.

2.2.2. Soil Moisture and Precipitation Data

Soil moisture and precipitation data were used to validate the calculation results of the TVDI [30]. The 10-day soil moisture data were obtained from the Dataset of the Growth and Development of Crops and the 10-day Soil Moisture of Farmland in China from the China Meteorological Data Sharing Service System. The mean monthly soil moisture was obtained using an average method based on three 10-day data per month from May to October, from 2000 to 2014. In our experiment, several abnormal data were removed. The source of the monthly precipitation data was the Dataset of Monthly Values for the China Surface Climate, and the collection duration span ran from 2000 to 2014, the same as that of the remote sensing products and soil moisture data collection times. The soil moisture and precipitation sites were distributed the over entire area, which can be seen in Figure 1. Among them, the black dots are locations of precipitation sites, and the black triangles are the location of soil moisture sites.

3. Methods

3.1. Maximum Value Composite (MVC)

MVC (Maximum Value Composites) is a procedure in which the maximum LST is chosen every month or every 8 days for each month. The maximization of the 8-day LST of each month can effectively remove the errors caused by clouds, solar zenith angles, and the atmosphere, thus improving the image quality [31,32]. This method was used to synthesize the maximum LST every month. Its equation is as follows:
L S T i = j = 1 3 ( L S T j )
where LSTi is the maximized LST in the ith month, and LSTj is the maximized LST in the jth 8-day period of the ith month.

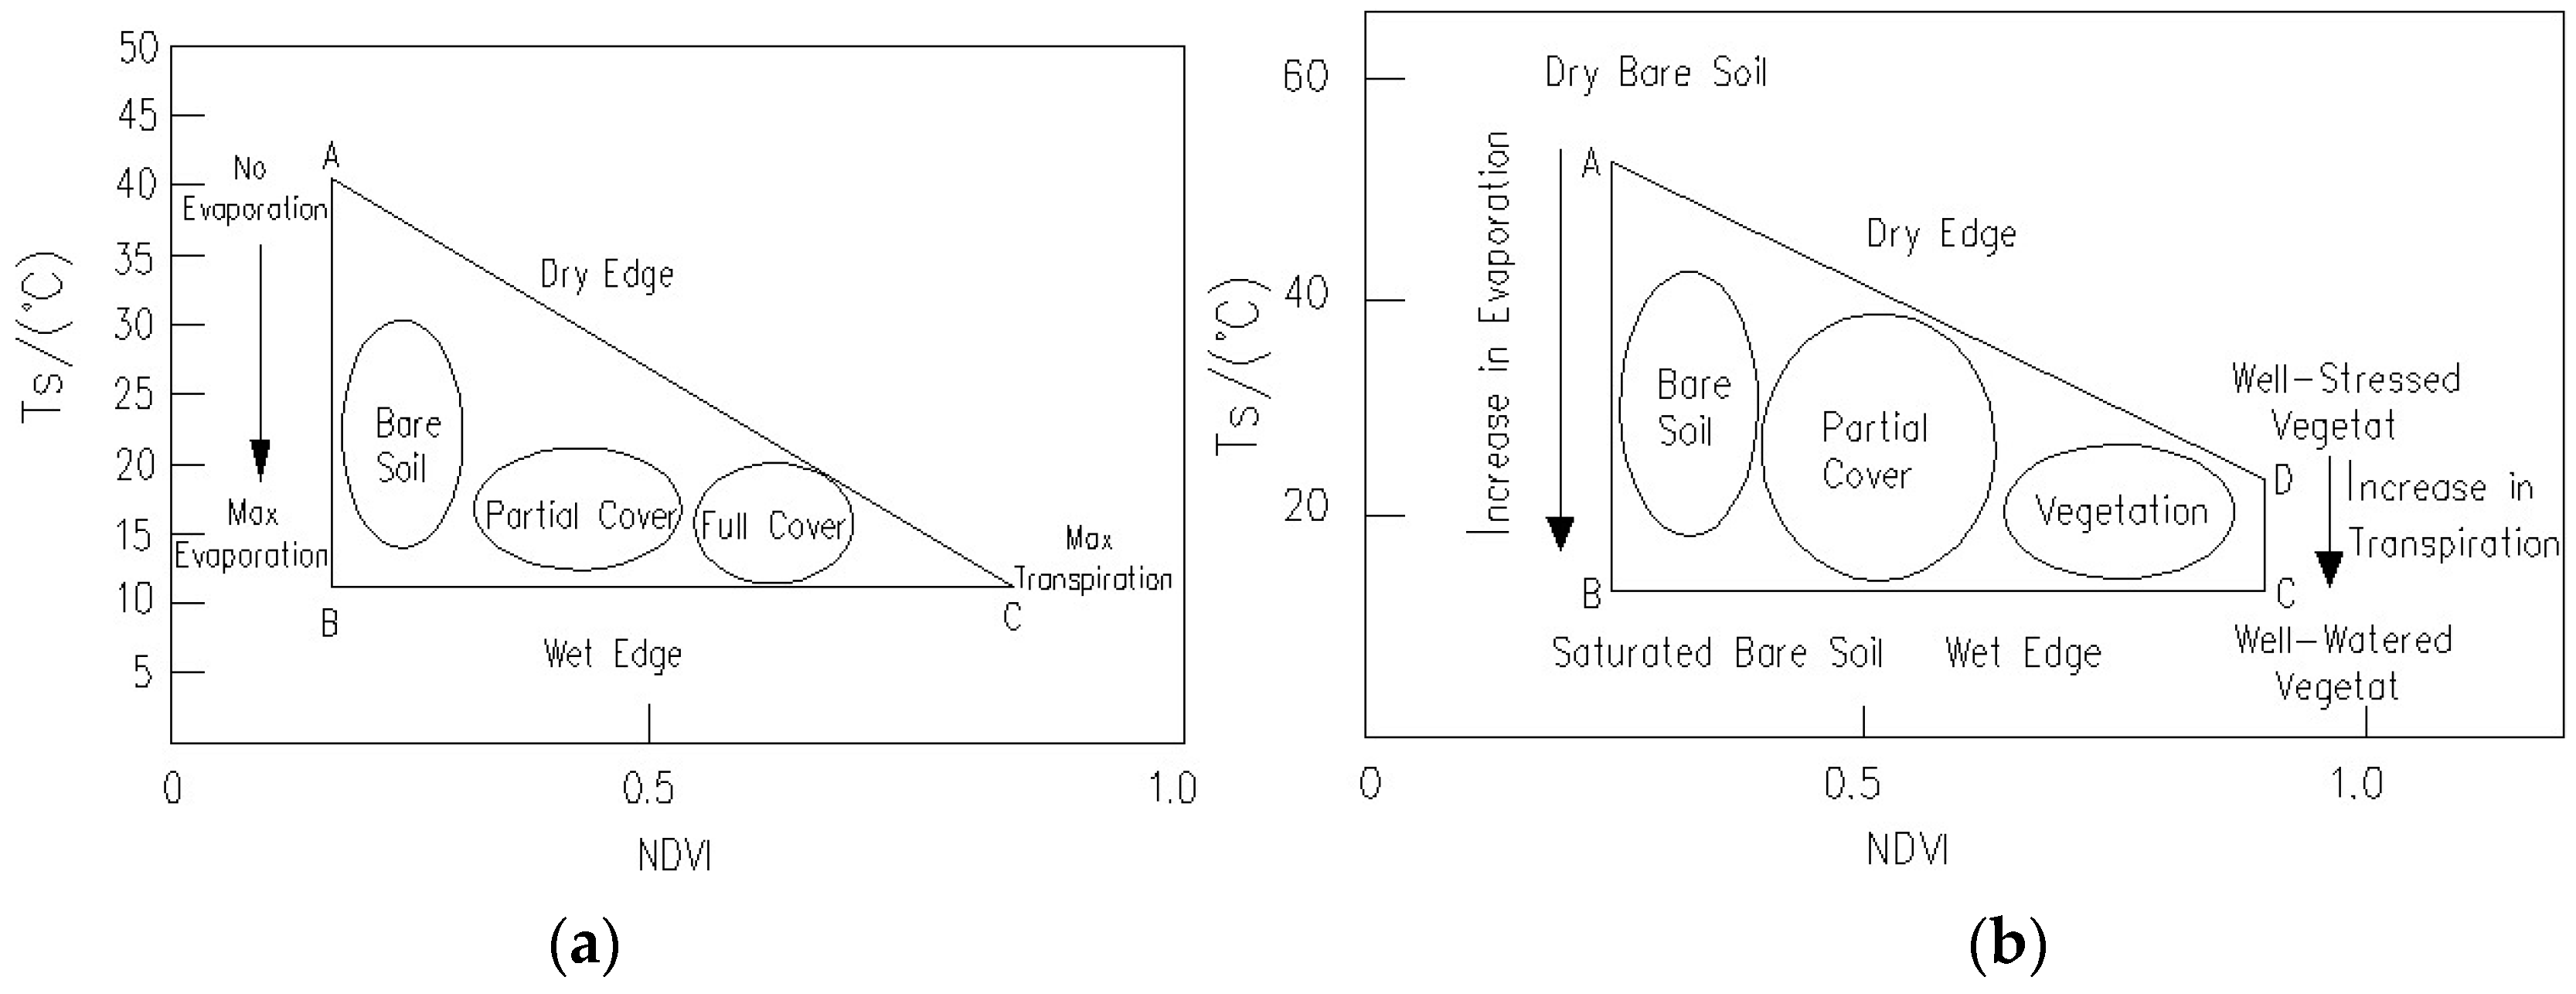
3.2. Temperature-Vegetation Dryness Index (TVDI)

Studies have shown that there is a pronounced negative correlation between the land surface temperature (Ts) and the vegetation index [33]. Price [34] and Carlson [35] found that the variation in the vegetation coverage and soil moisture is large; a scatter plot of Ts and NDVI obtained from the remote sensing images often results in a triangular shape, as shown in Figure 3a. Later, through a large set of experiments, Moran et al. [14] found that a scatter plot of Ts and NDVI resulted in a trapezoidal space, as shown in Figure 3b.
The TVDI can be calculated with the following equation:
T V D I = T s T s min T s max T s min
T s min = a 1 × N D V I + b 1
T s max = a 2 × N D V I + b 2
where Tsmin is the minimum land surface temperature observation for a given NDVI, which corresponds to the wet edge in Figure 3; Ts denotes the land surface temperature at a given pixel; Tsmax is the maximum land surface temperature observation for a given NDVI, which corresponds to the dry edge in Figure 3. The boundary lines of the dry and wet edges can be obtained by linear fitting; a1, b1, a2, and b2 are the coefficients of the fitting model for the dry and wet edges.

3.3. Temperature Correction

The study area has a higher altitude in the northwest area than in the southeast, with large variations in elevation, the maximum of which reaches 2700 m. This landform difference is thus an important controlling factor in terms of the vegetation, moisture and climate of the study area. On one hand, the regional patterns with huge altitude differences such as mountains and river valleys affect the flow of dry and wet air and lead to precipitation and wind differences, which further affect the soil texture and moisture. On the other hand, the elevation controls the temperature, thus affecting the vegetation coverage in different elevation zones and the extent of evapotranspiration and surface runoff [23]. To ensure the consistency of the calculation scale of these data, the regional DEM was used to correct the land surface temperature products and to reduce the effects of terrain undulation on the energy equilibrium. Specifically, the land surface temperature correction was performed by decreasing the temperature by 6 °C at an altitude of 1000 m [28,29].

3.4. Calculating TVDI on the Basis of Different Land Cover Types

For the current drought analysis using TVDI, most literature has shown that the study area was treated as a whole. Considering that the vegetation height and coverage differ greatly between woodland, grassland and farmland, the corresponding land surface maximum and minimum temperatures vary significantly. Therefore, a large variation in the TVDI may result if the study area is calculated as a whole. The TVDI was calculated and compared on the basis of whole and different vegetation types. In using the May 2010 data as an example, the research group divided the study area into woodland, grassland and farmland according to the University of Maryland land cover/use classification to calculate the TDVI.
To address the large quantity of repeated work in this study, an ENVI-based subprogram was developed by combining the IDL and TVDI calculation model, and it was used to calculate the TVDI; the calculation results based on the whole vegetation area was called WTVDI, and the calculation results are based on the respective classified vegetation was called DTVDI. Because the focus of this drought monitoring investigation is woodland, grassland and farmland, water bodies, wetlands, urban use and other land use types have not been considered in the DTVDI calculation.
To compare the two calculation results more clearly, the percentage change between the WTDVI value and DTDVI value was calculated; the equation is as follows:
Δ μ % = W T V D I D T V D I W T V D I × 100 %
where ∆μ%: the percentage of change; WTVDI: TDVI results calculated based on the whole area; DTVDI: TVDI results calculated based on land cover/use.
The percentage change between WTVDI and DTVDI is shown in Figure 4, in which different colors represent different degrees of variability. The degree of variability is within 20% for a major portion of the study area and 20%–40% for a partial area. Compared with the DTVDI value, the WTDVI value was underestimated for woodland; on the contrary, the WTDVI value was overestimated for grassland and farmland (Figure 2 and Figure 4).
To explore the reason for this difference, the dry/wet edges, the maximum/minimum LST and NDVI, which were used to calculate the WTDVI and DTVDI, have been summarized and compared (Table 1 and Table 2). A comparison of Table 1 and Table 2 shows that the temperatures of choice for the whole calculation were the maximum grassland temperature and the minimum woodland temperature. The difference in vegetation types results in calculation error. The TVDI for woodland was found to have been underestimated, and those of the grassland and farmland were overestimated when the dry and wet edges in Table 1 were inserted into Equation (2).
To assess the efficacy of the two calculation methods, as an example, the soil moisture data of study area, which were collected in May 2010, were used to validate the results [30]. The soil moisture sampling points are shown as black triangular spots in Figure 1. The two TVDI calculation results were extracted and then correlated with the corresponding soil moisture. The correlations are shown in Figure 5; there is a significant correlation between the calculation results and the soil moisture, with a correlation coefficient (R2) that ranges from 0.531 to 0.674.

4. Results

4.1. Results of DTVDI

The DTVDI time-series from May to October in the BTHMR were calculated by using the MODIS NDIV and LST monthly products between 2000 and 2014. The calculated DTVDIs range from 0 to 1. The larger the TVDI, the more severe the drought, and vice versa [34]. Therefore, the calculated DTVDIs for each month were divided into five grades based on the TVDI values as follows: 0 ≤ TVDI < 0.2: very wet, 0.2 ≤ TVDI < 0.4: wet, 0.4 ≤ TVDI < 0.6: normal, 0.6 ≤ TVDI < 0.8: drought, and 0.8 ≤ TVDI ≤ 1: severe drought [30,36]. Because this calculation covers a total of 15 years and 6 months in each year, there are 90 drought grade maps. In the interest of saving space, a typical case every 2 years for showing the drought change was selected in our study (Figure 6).

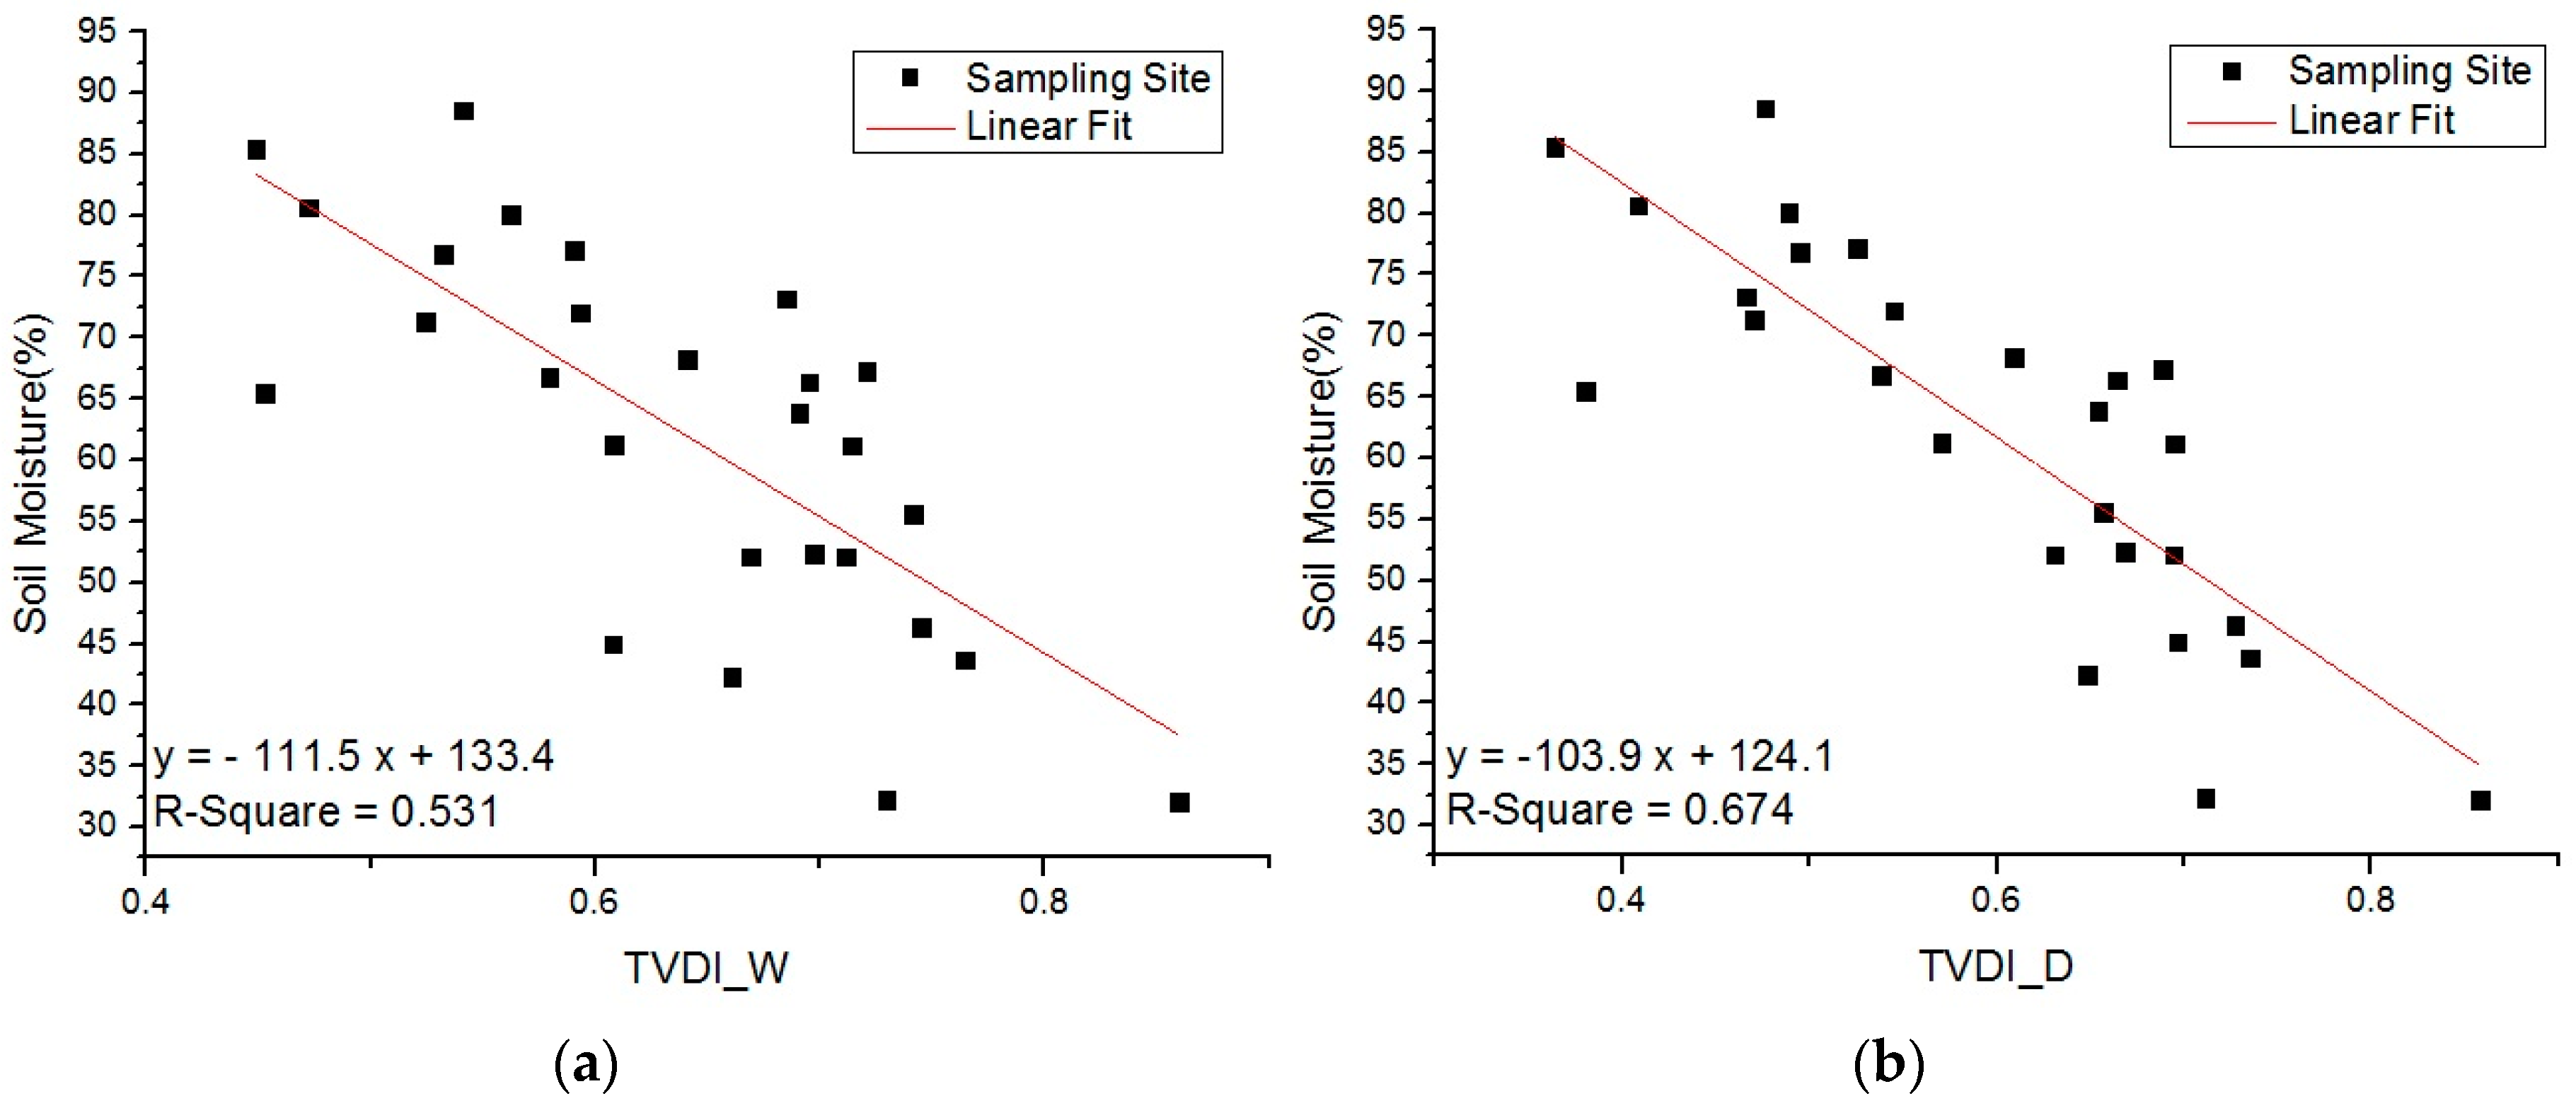
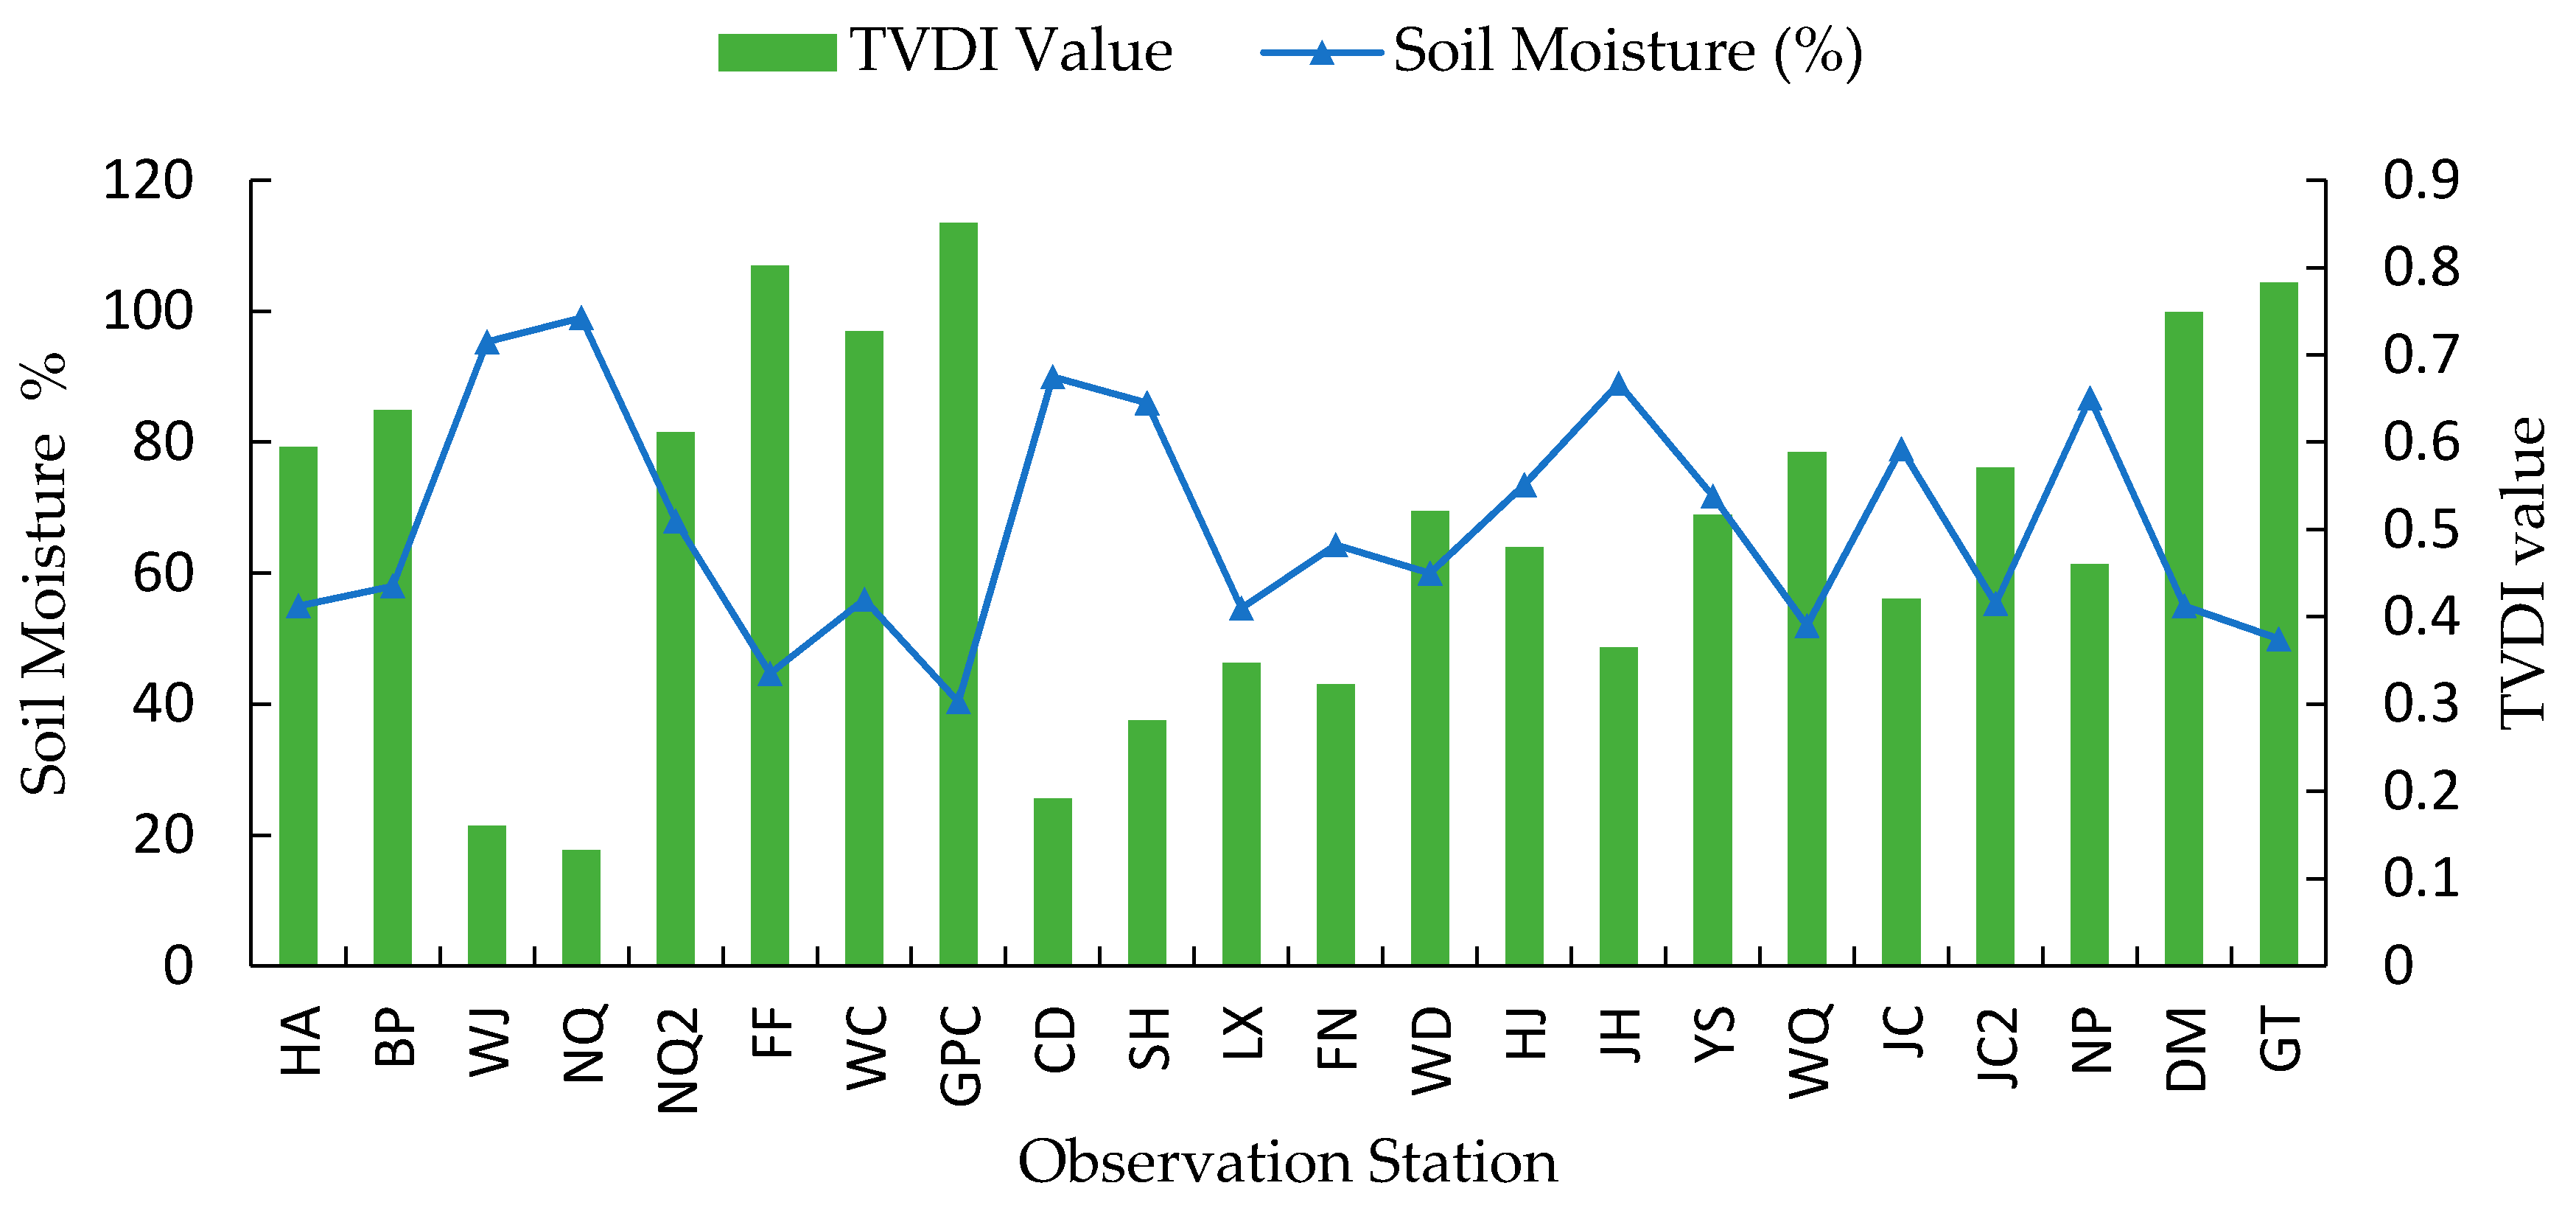
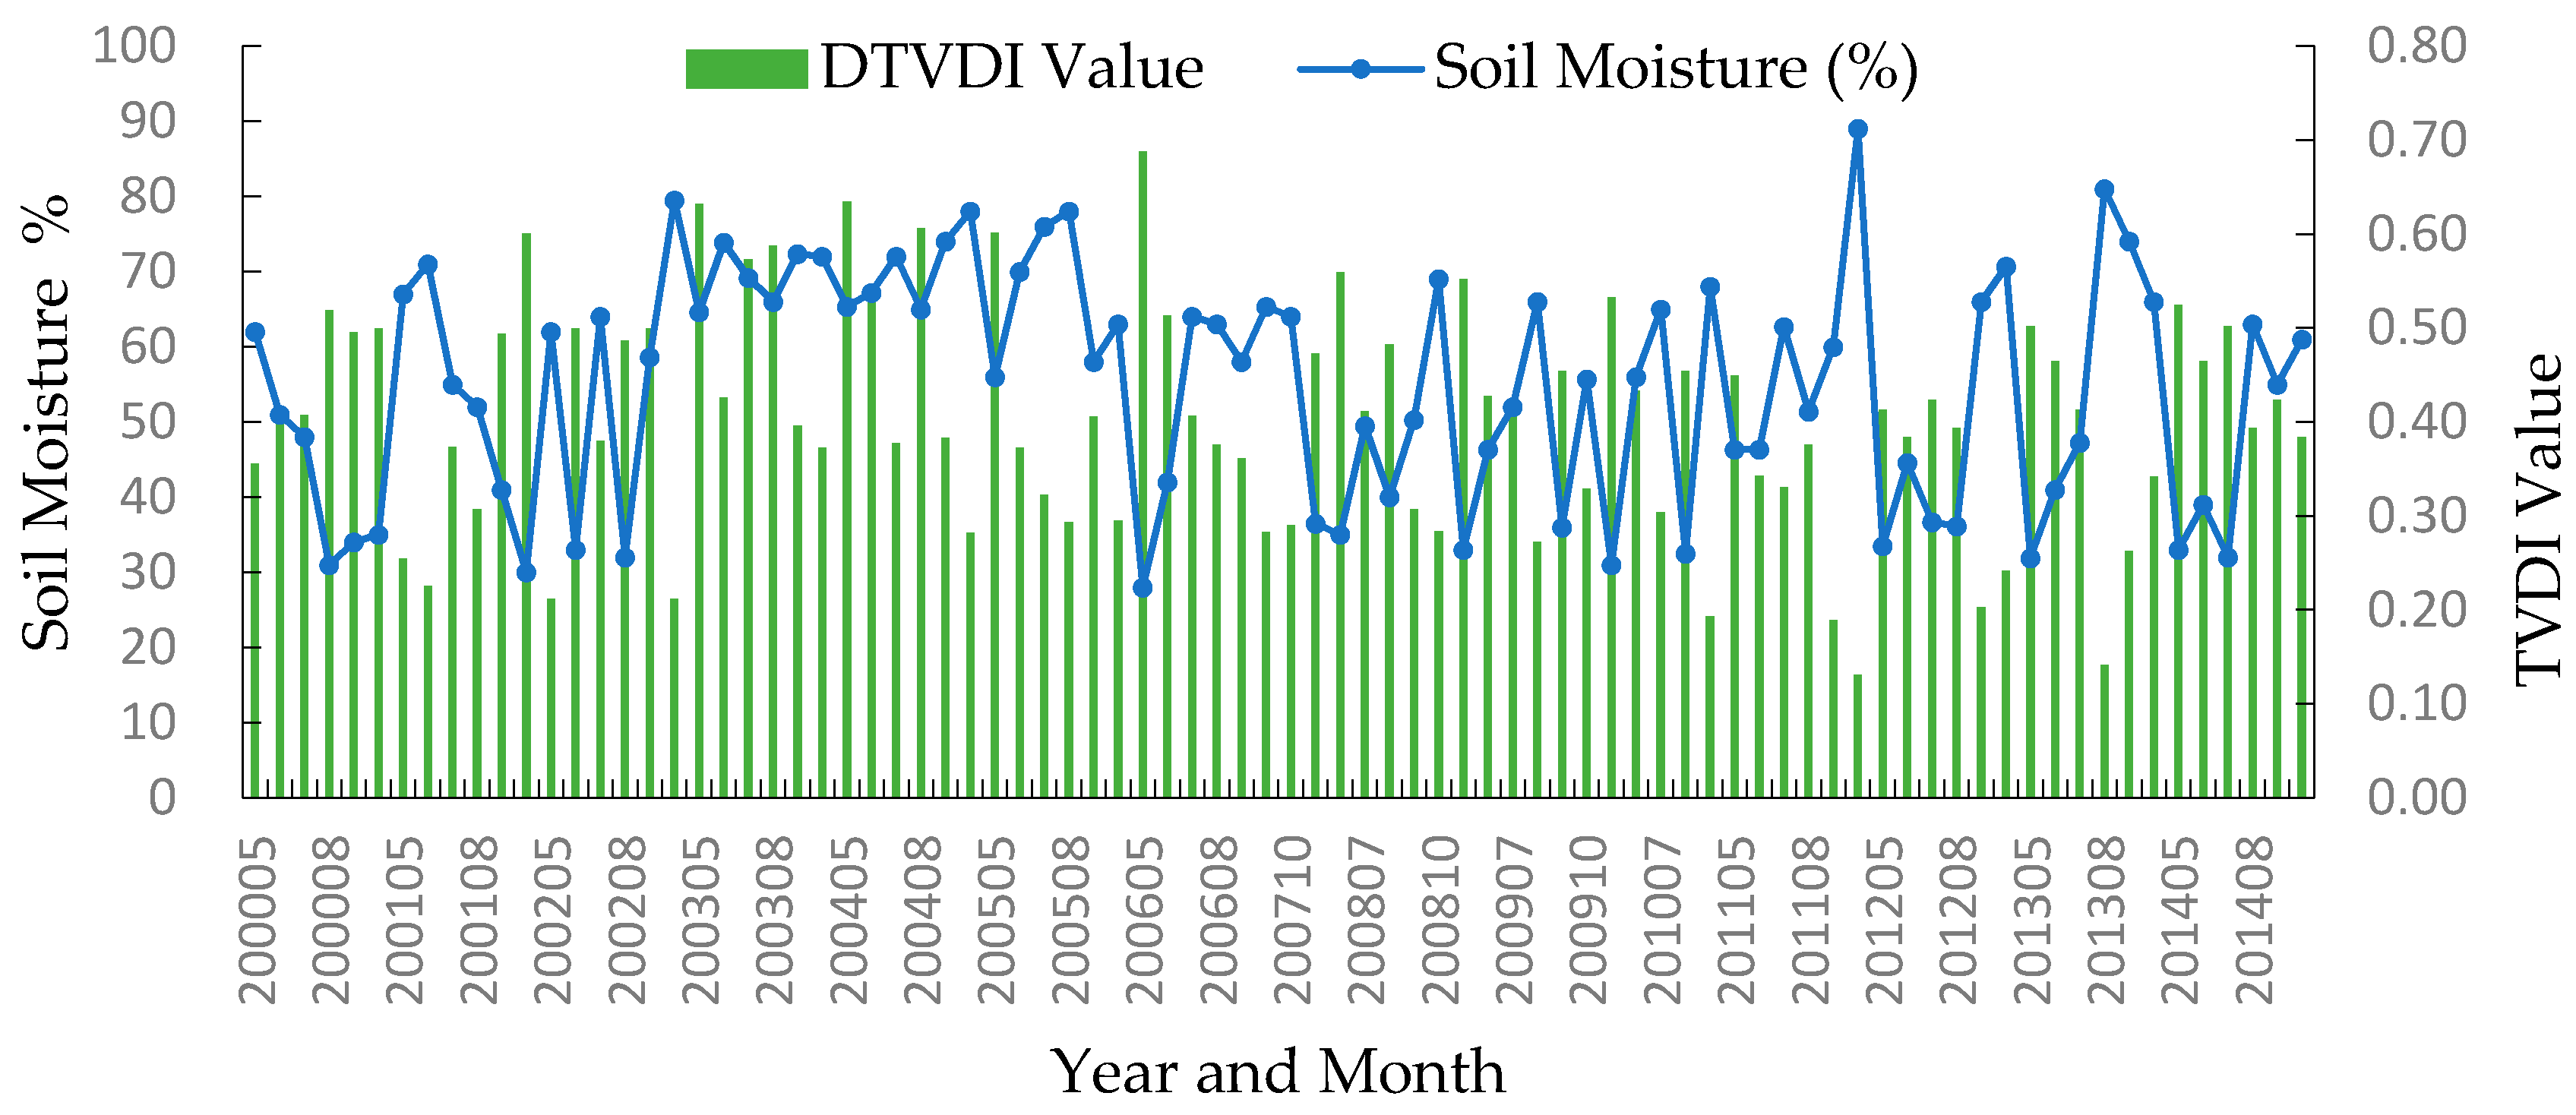
4.1.1. Correlation Analysis between DTVDI and 10-cm Soil Moisture

A 10-cm soil depth was chosen at the meteorological stations in the study area for use in comparative analyses with DTVDI on spatial and temporal scales. Figure 7 shows the comparison result between the measured moisture data and the DTVDI at 22 observation stations. The histogram in the figure represents the TVDI value at each observation station, and the line chart represents the mean monthly soil moisture value. There is a negative correlation between the DTVDI and the soil moisture (R = −0.855).
Figure 8 shows the comparison between the measured moisture data and DTVDI from May to October from 2000 to 2014 at the Nangong observation site. The histogram in the figure represents the TVDI value of different months at the Nangong observation station from 2000 to 2014, and the line chart represents the mean monthly soil moisture. There is a negative correlation between the DTVDI and the soil moisture (R = −0.793), that is to say, the higher the TVDI, the lower the soil moisture and the more severe the agricultural drought.

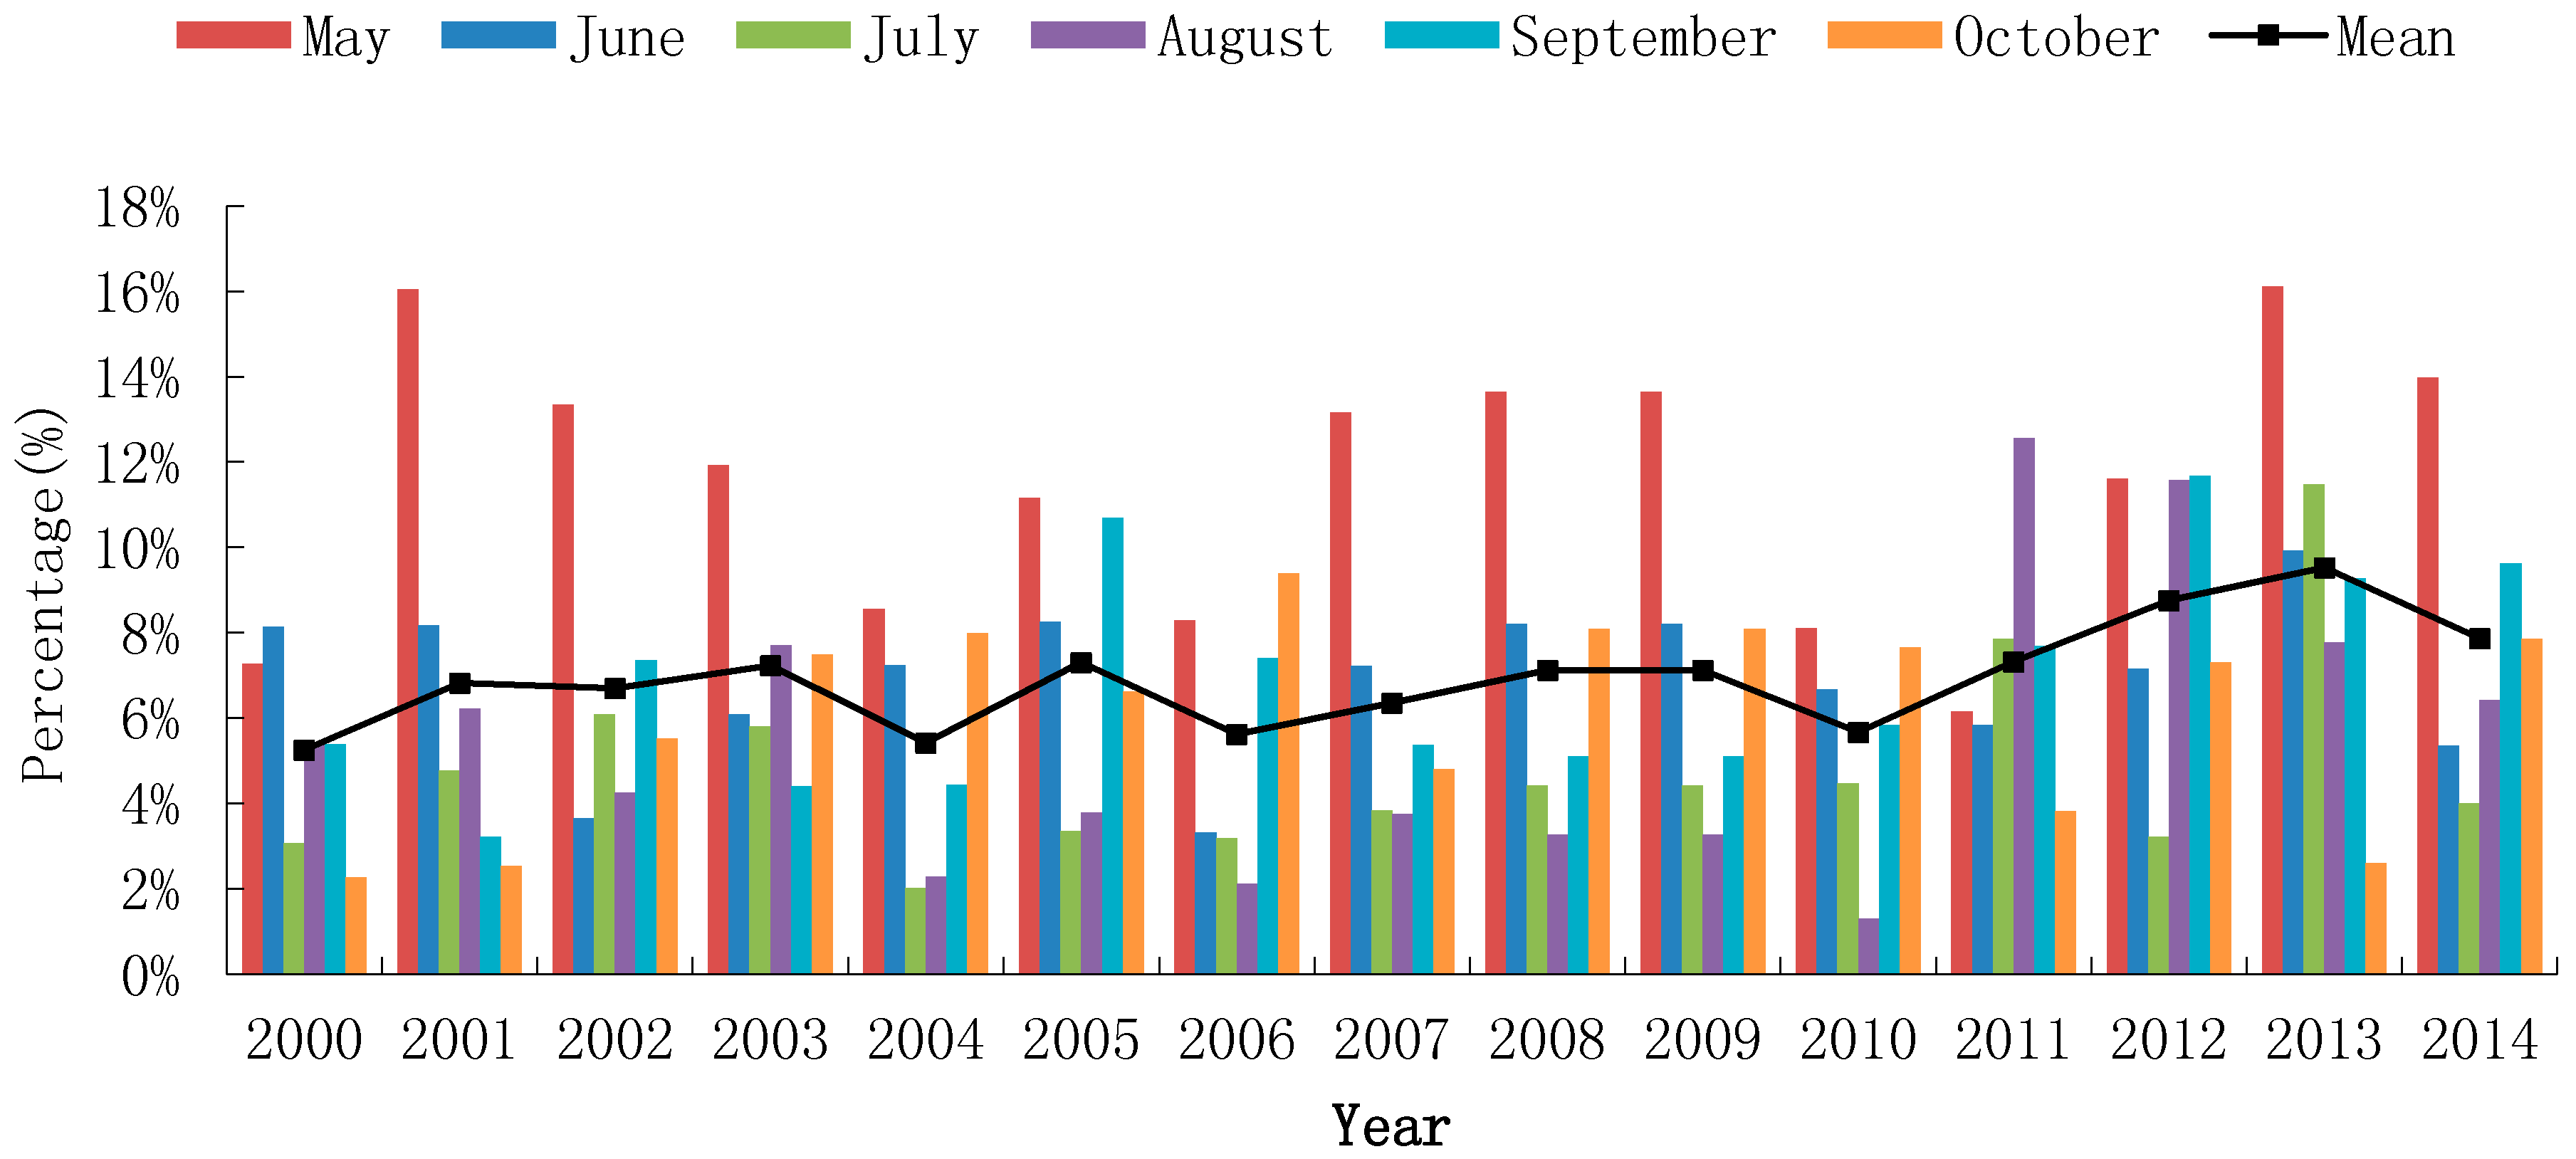
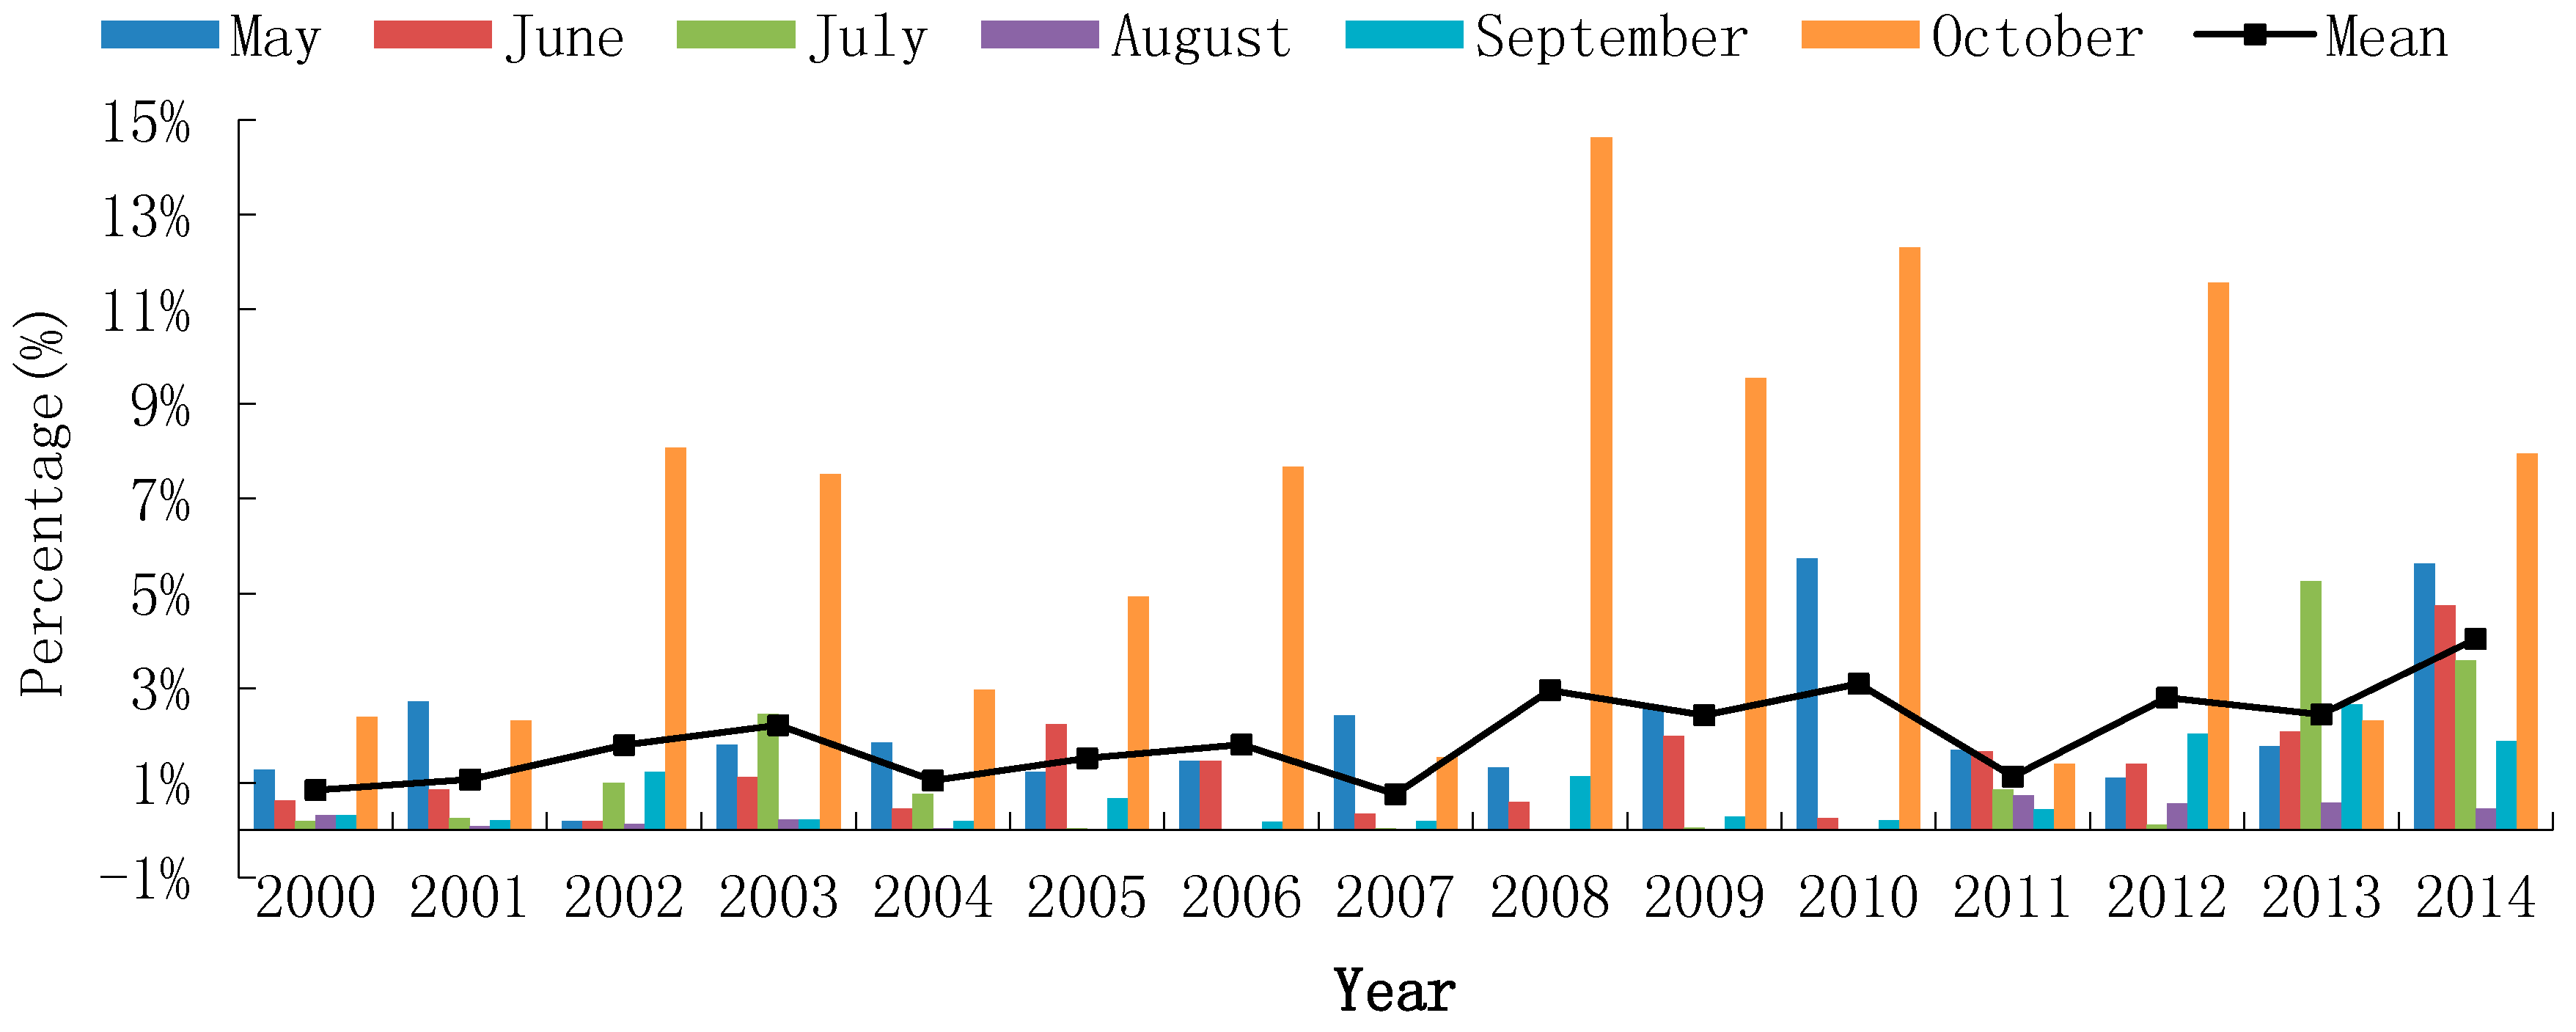
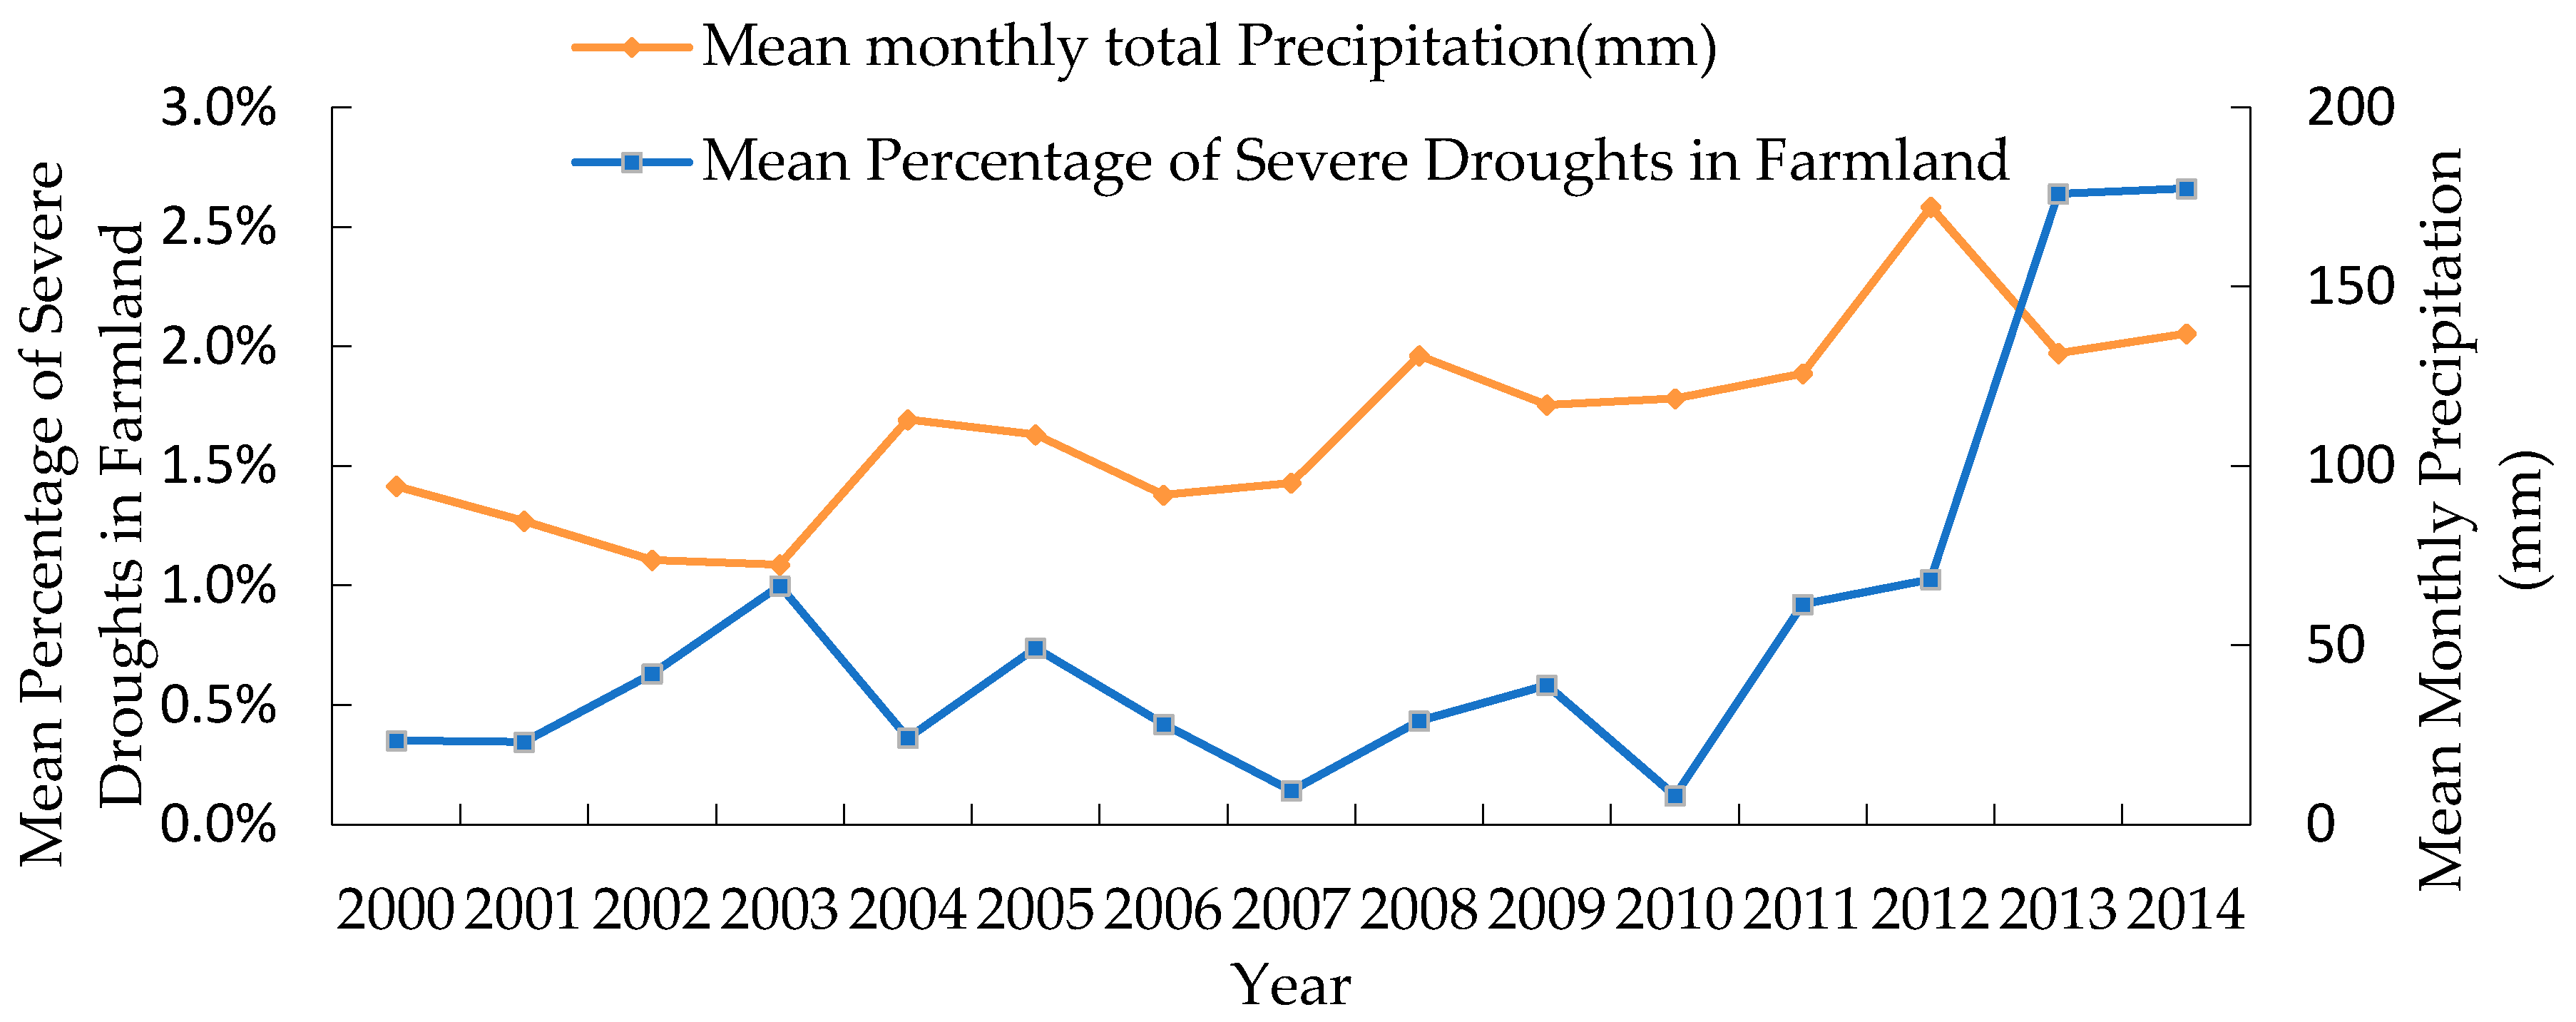
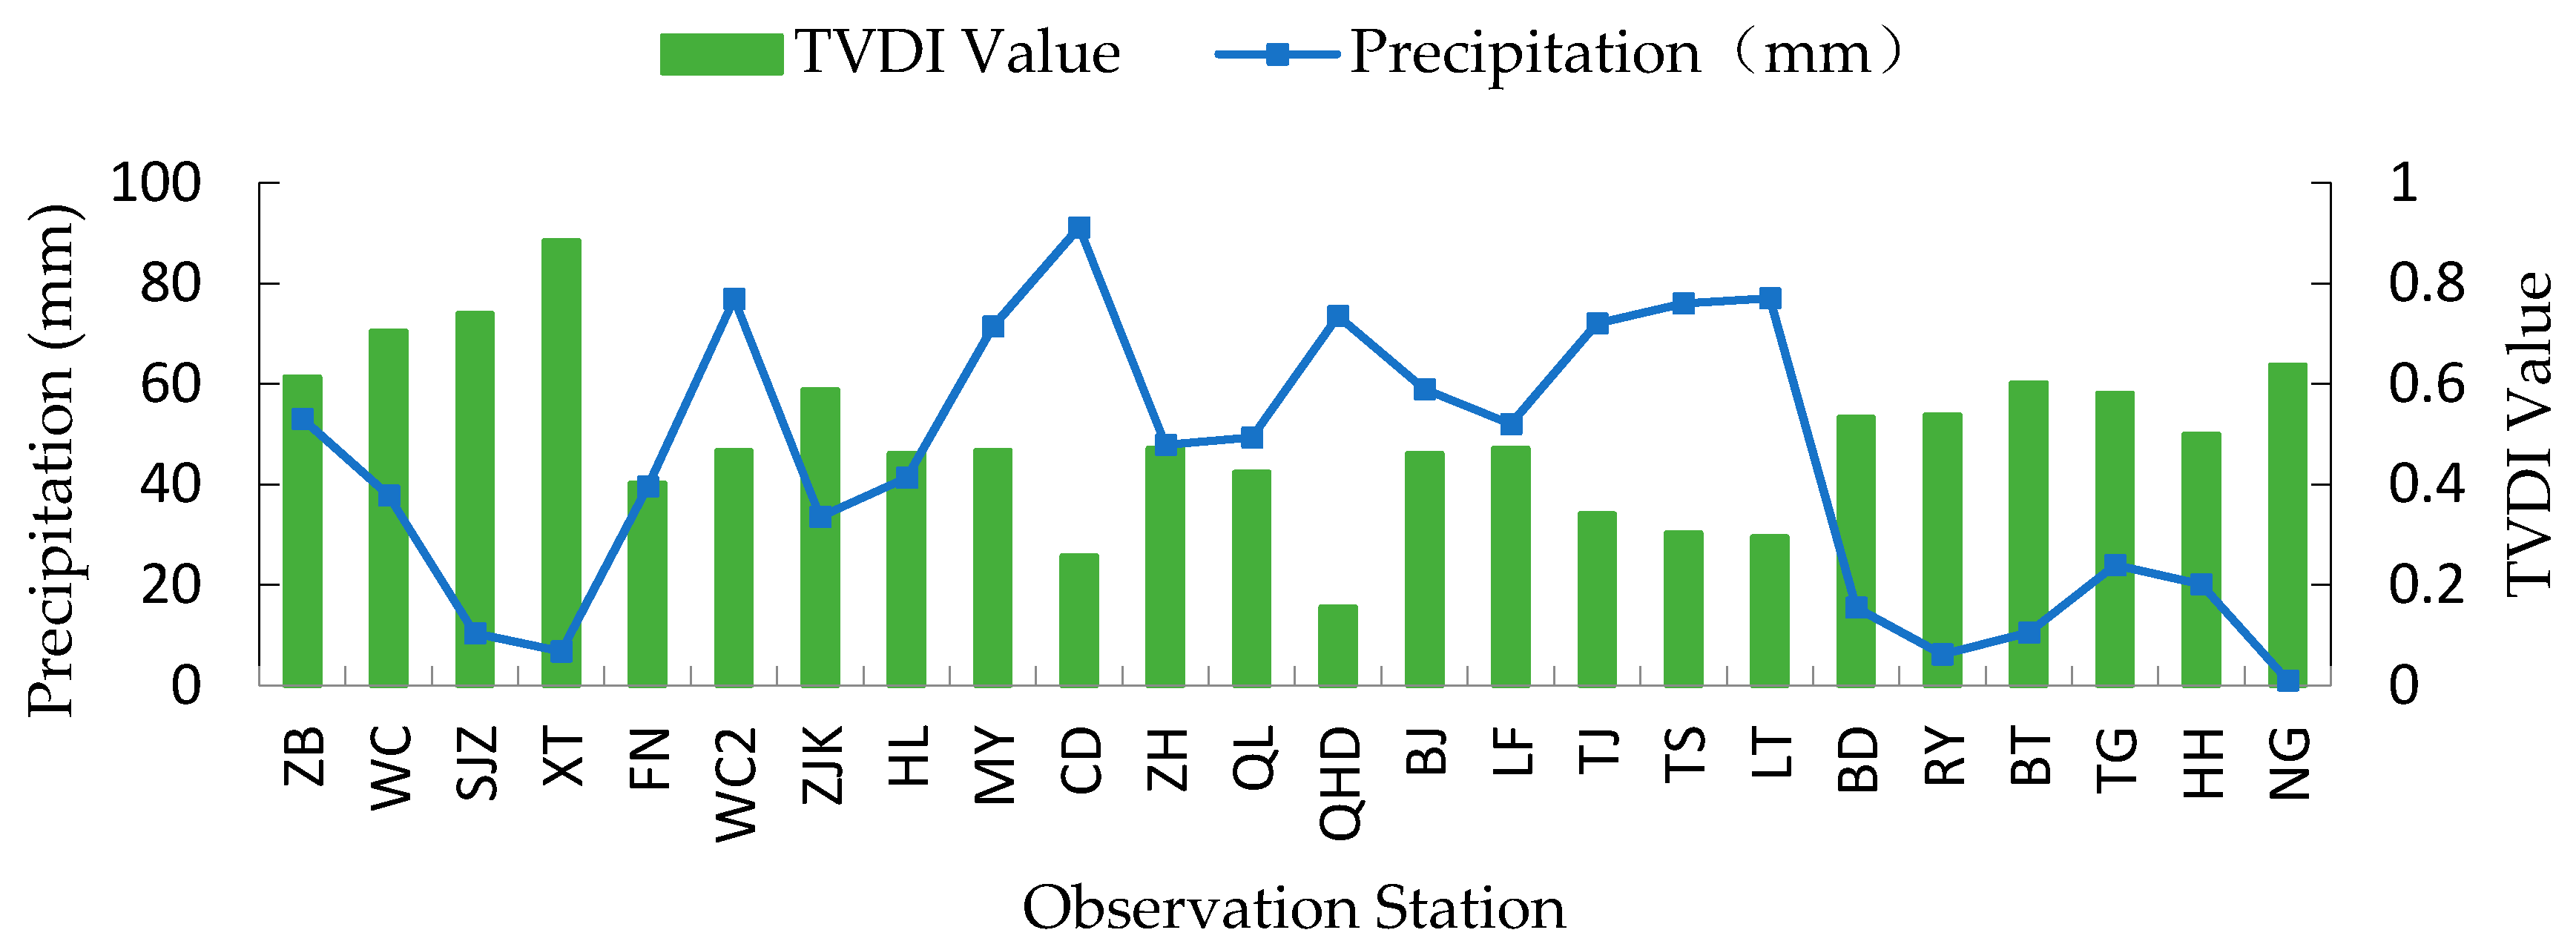
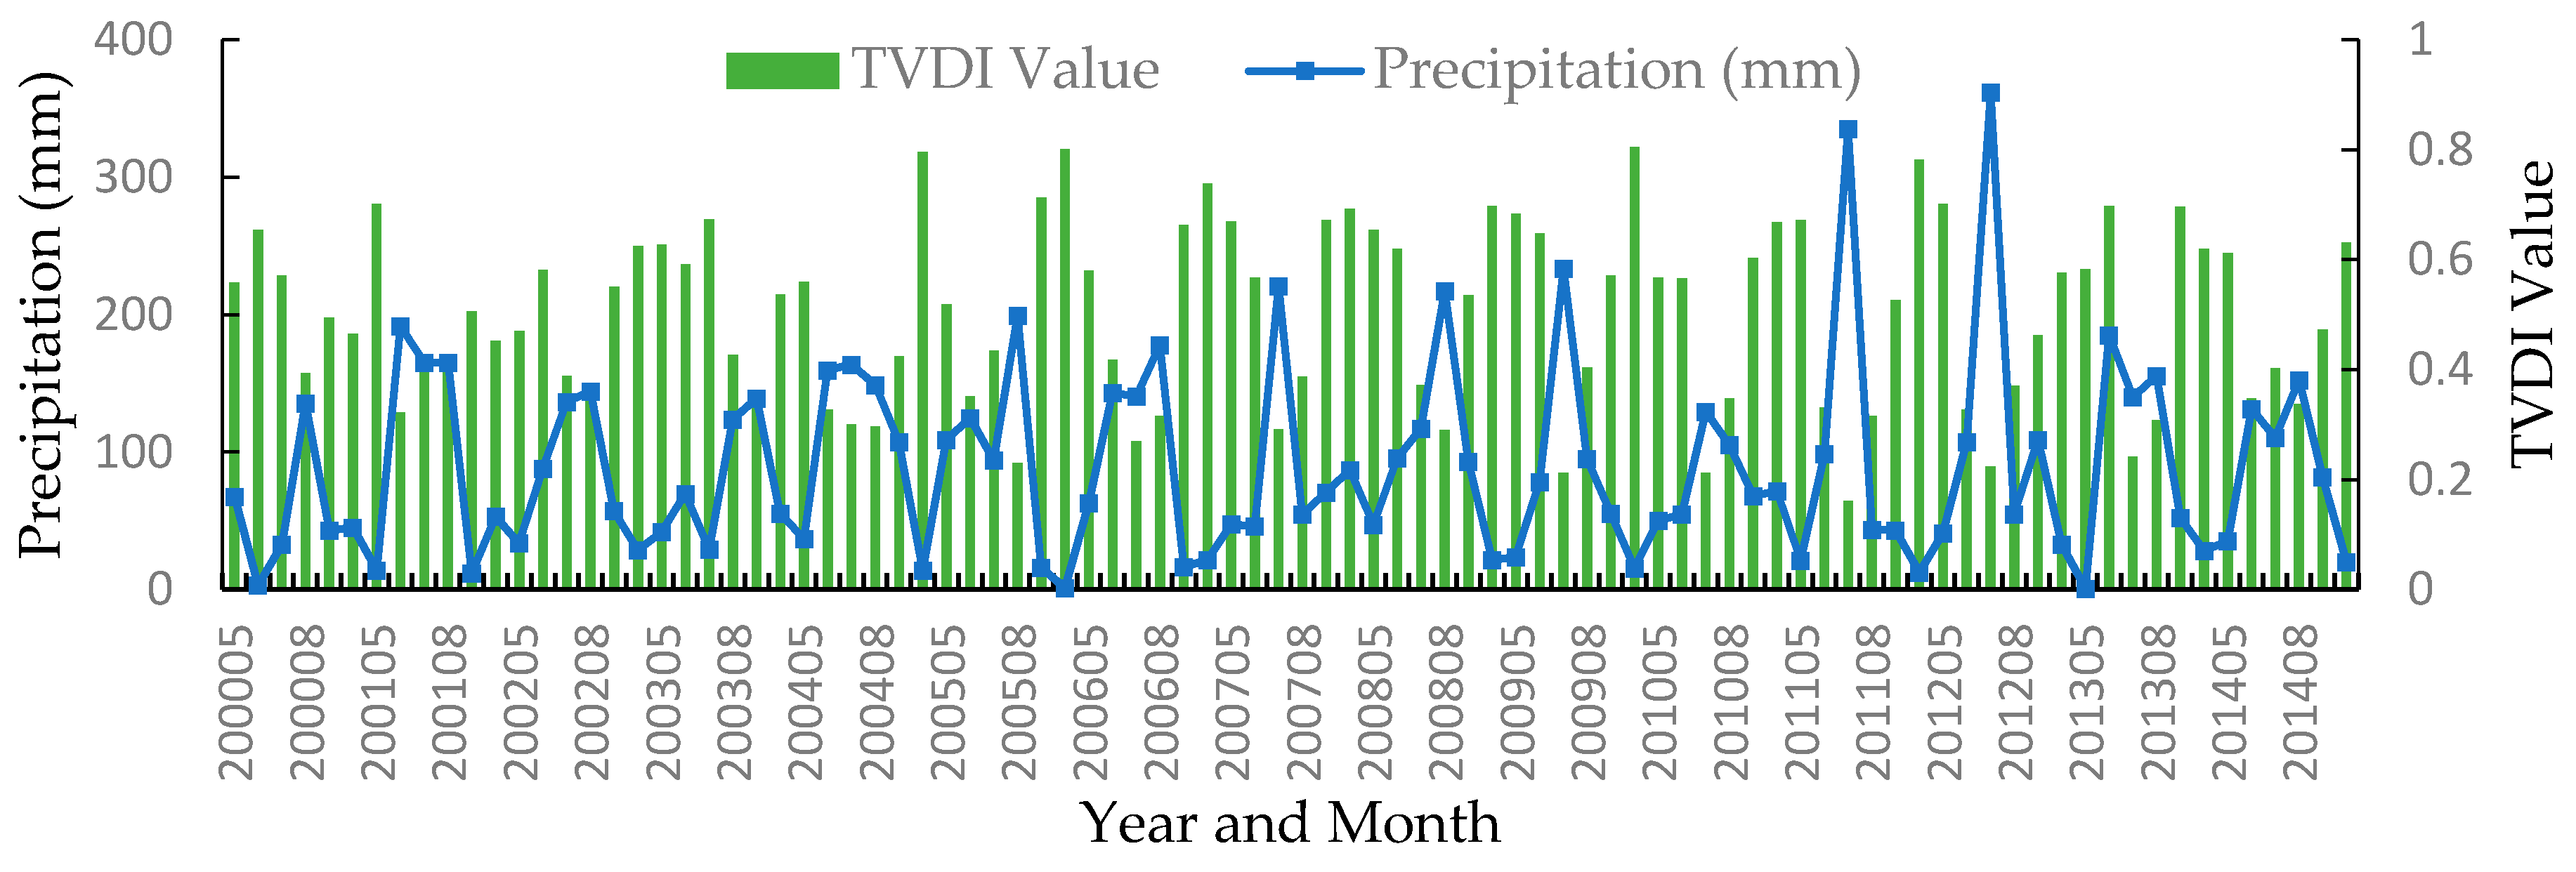
4.1.2. Correlation Analysis between DTVDI and Precipitation

The drought that occurred in the study area was primarily relieved by precipitation. The total monthly precipitation observed at the meteorological stations and the TVDI were compared and analyzed at spatial and temporal scales, and the results are shown in Figure 9 and Figure 10. As an example, Figure 9 shows the comparison between the precipitation and TVDI at 24 observation stations in September 2010, and Figure 10 shows the comparison between the precipitation from May to October between 2000 and 2014 and the corresponding TVDI at the Miyun observation station. The histogram in the figure represents the TVDI value at each station or for a different month at the Miyun observation station, and the line chart represents the mean total monthly precipitation. A detailed comparison of the two figures reveals that there was also a negative correlation between precipitation and DTVDI (R = −0.771 and −0.732 respectively). Theoretically, with decreased precipitation, the TVDI value increased. But at some stations, many farmlands were equipped with an irrigation facility for relieving drought, leading to a lower TVDI. Therefore, the negative correlation observed did not continue during certain months at the observation stations.

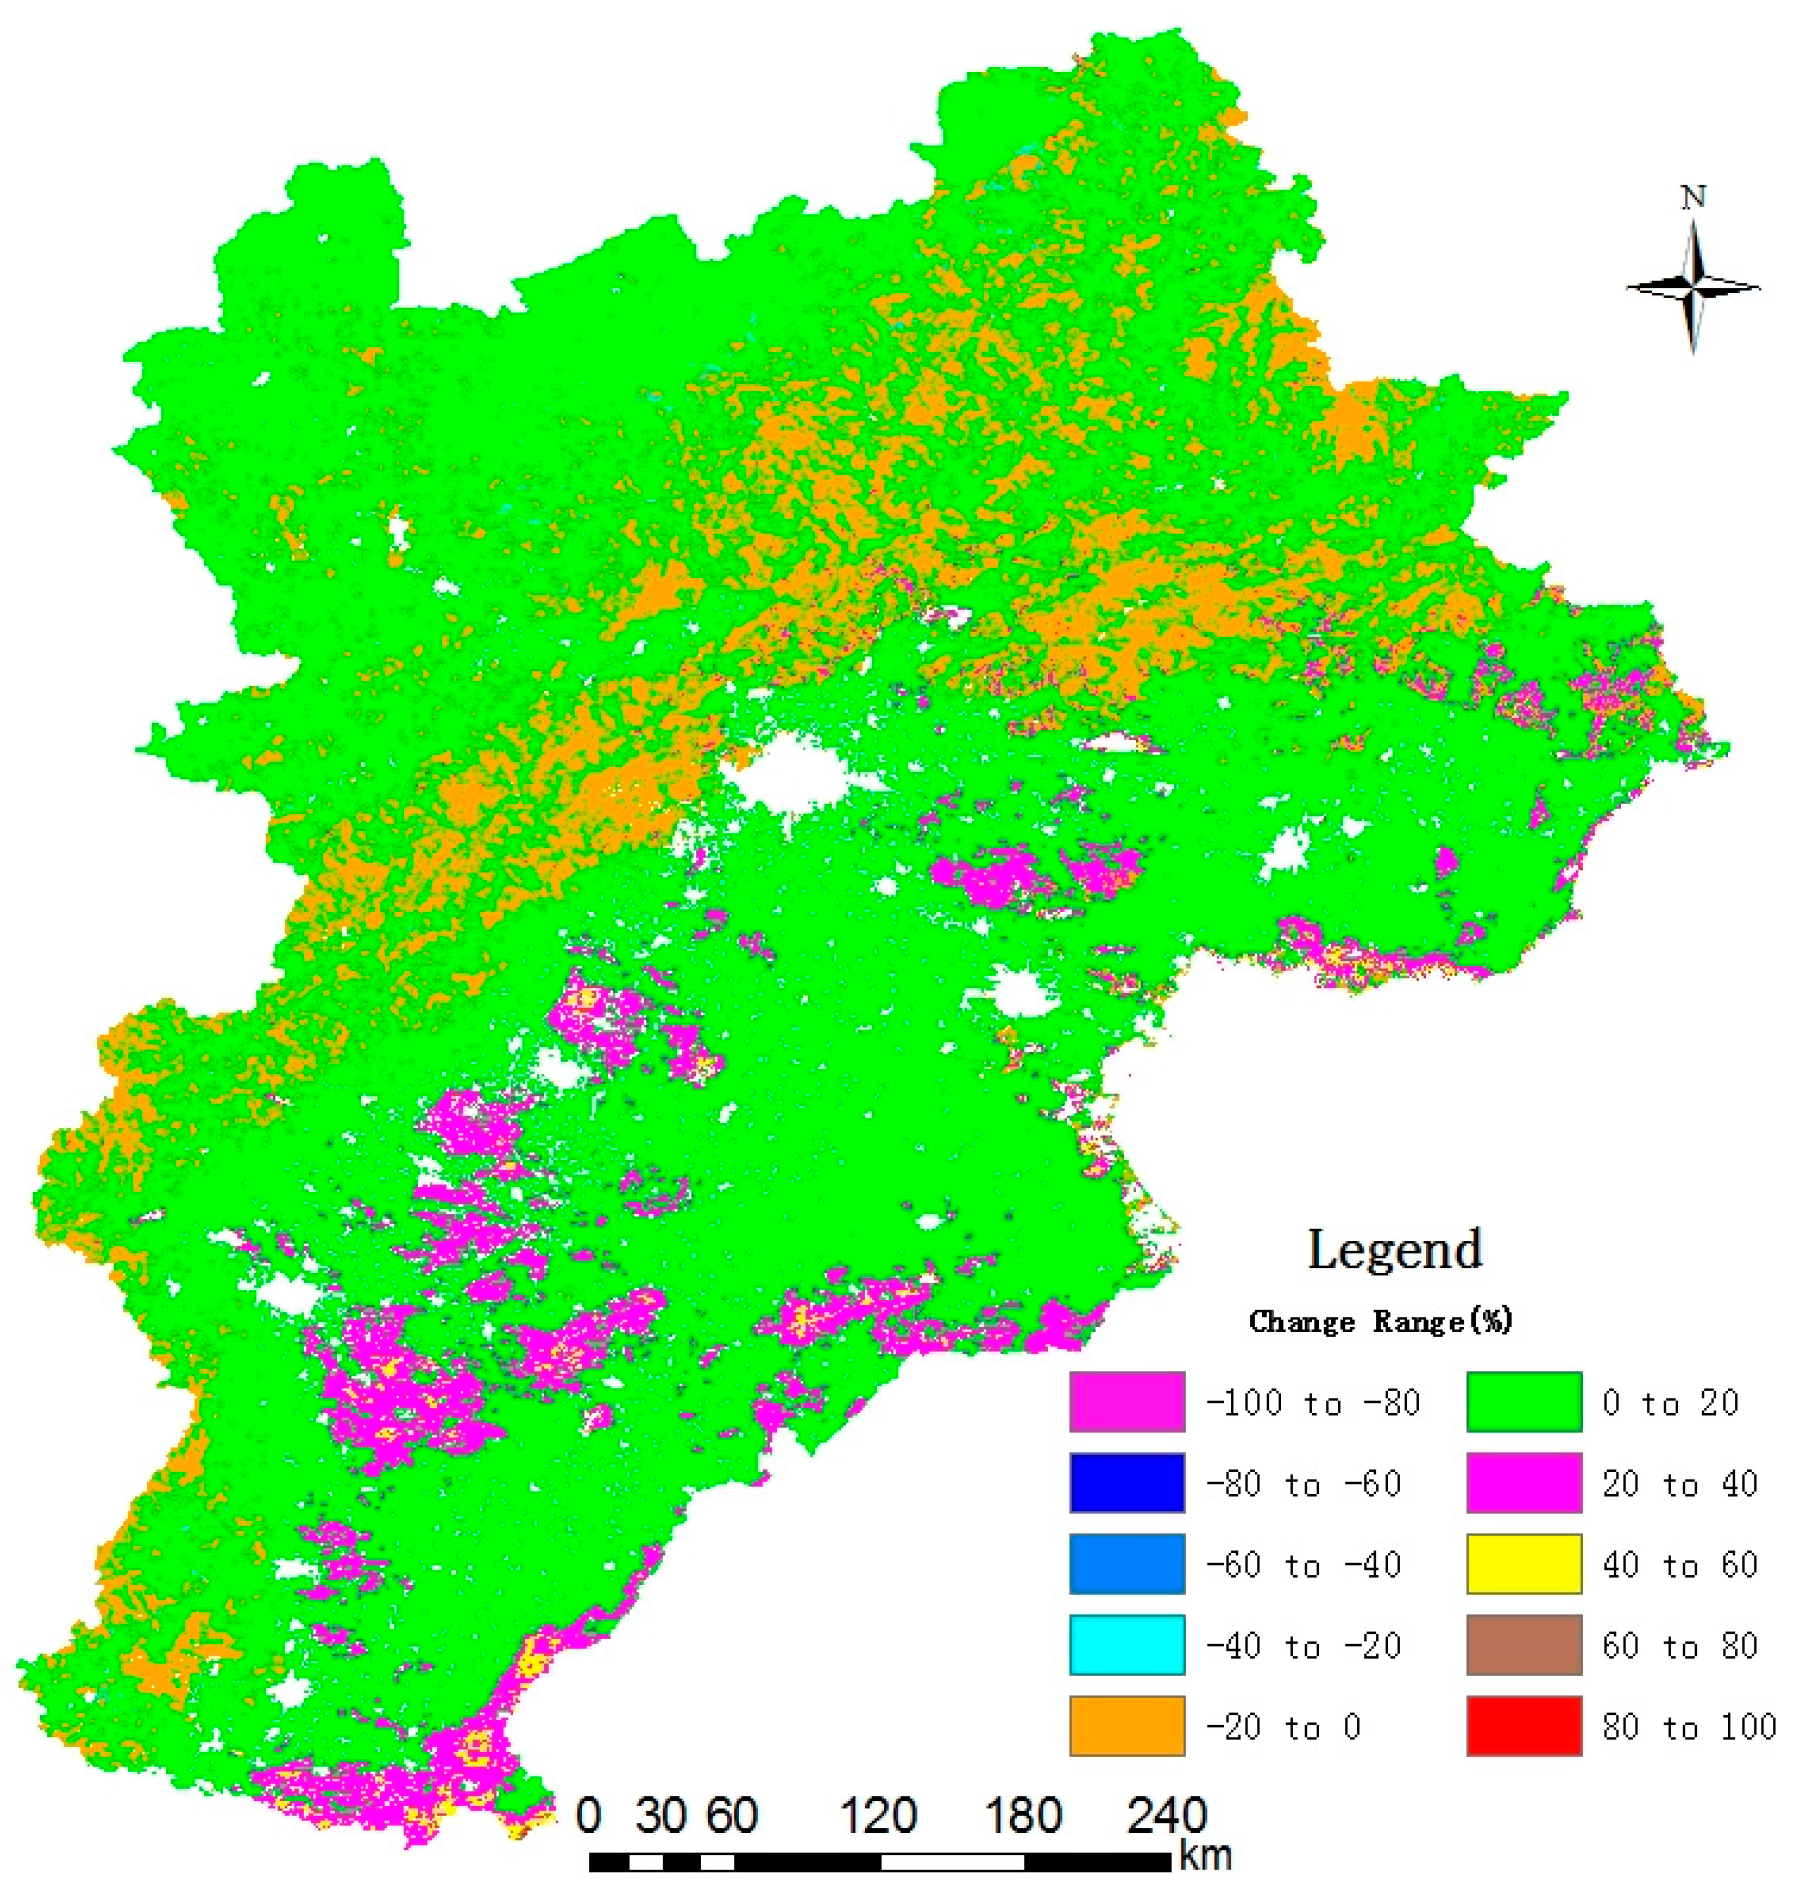
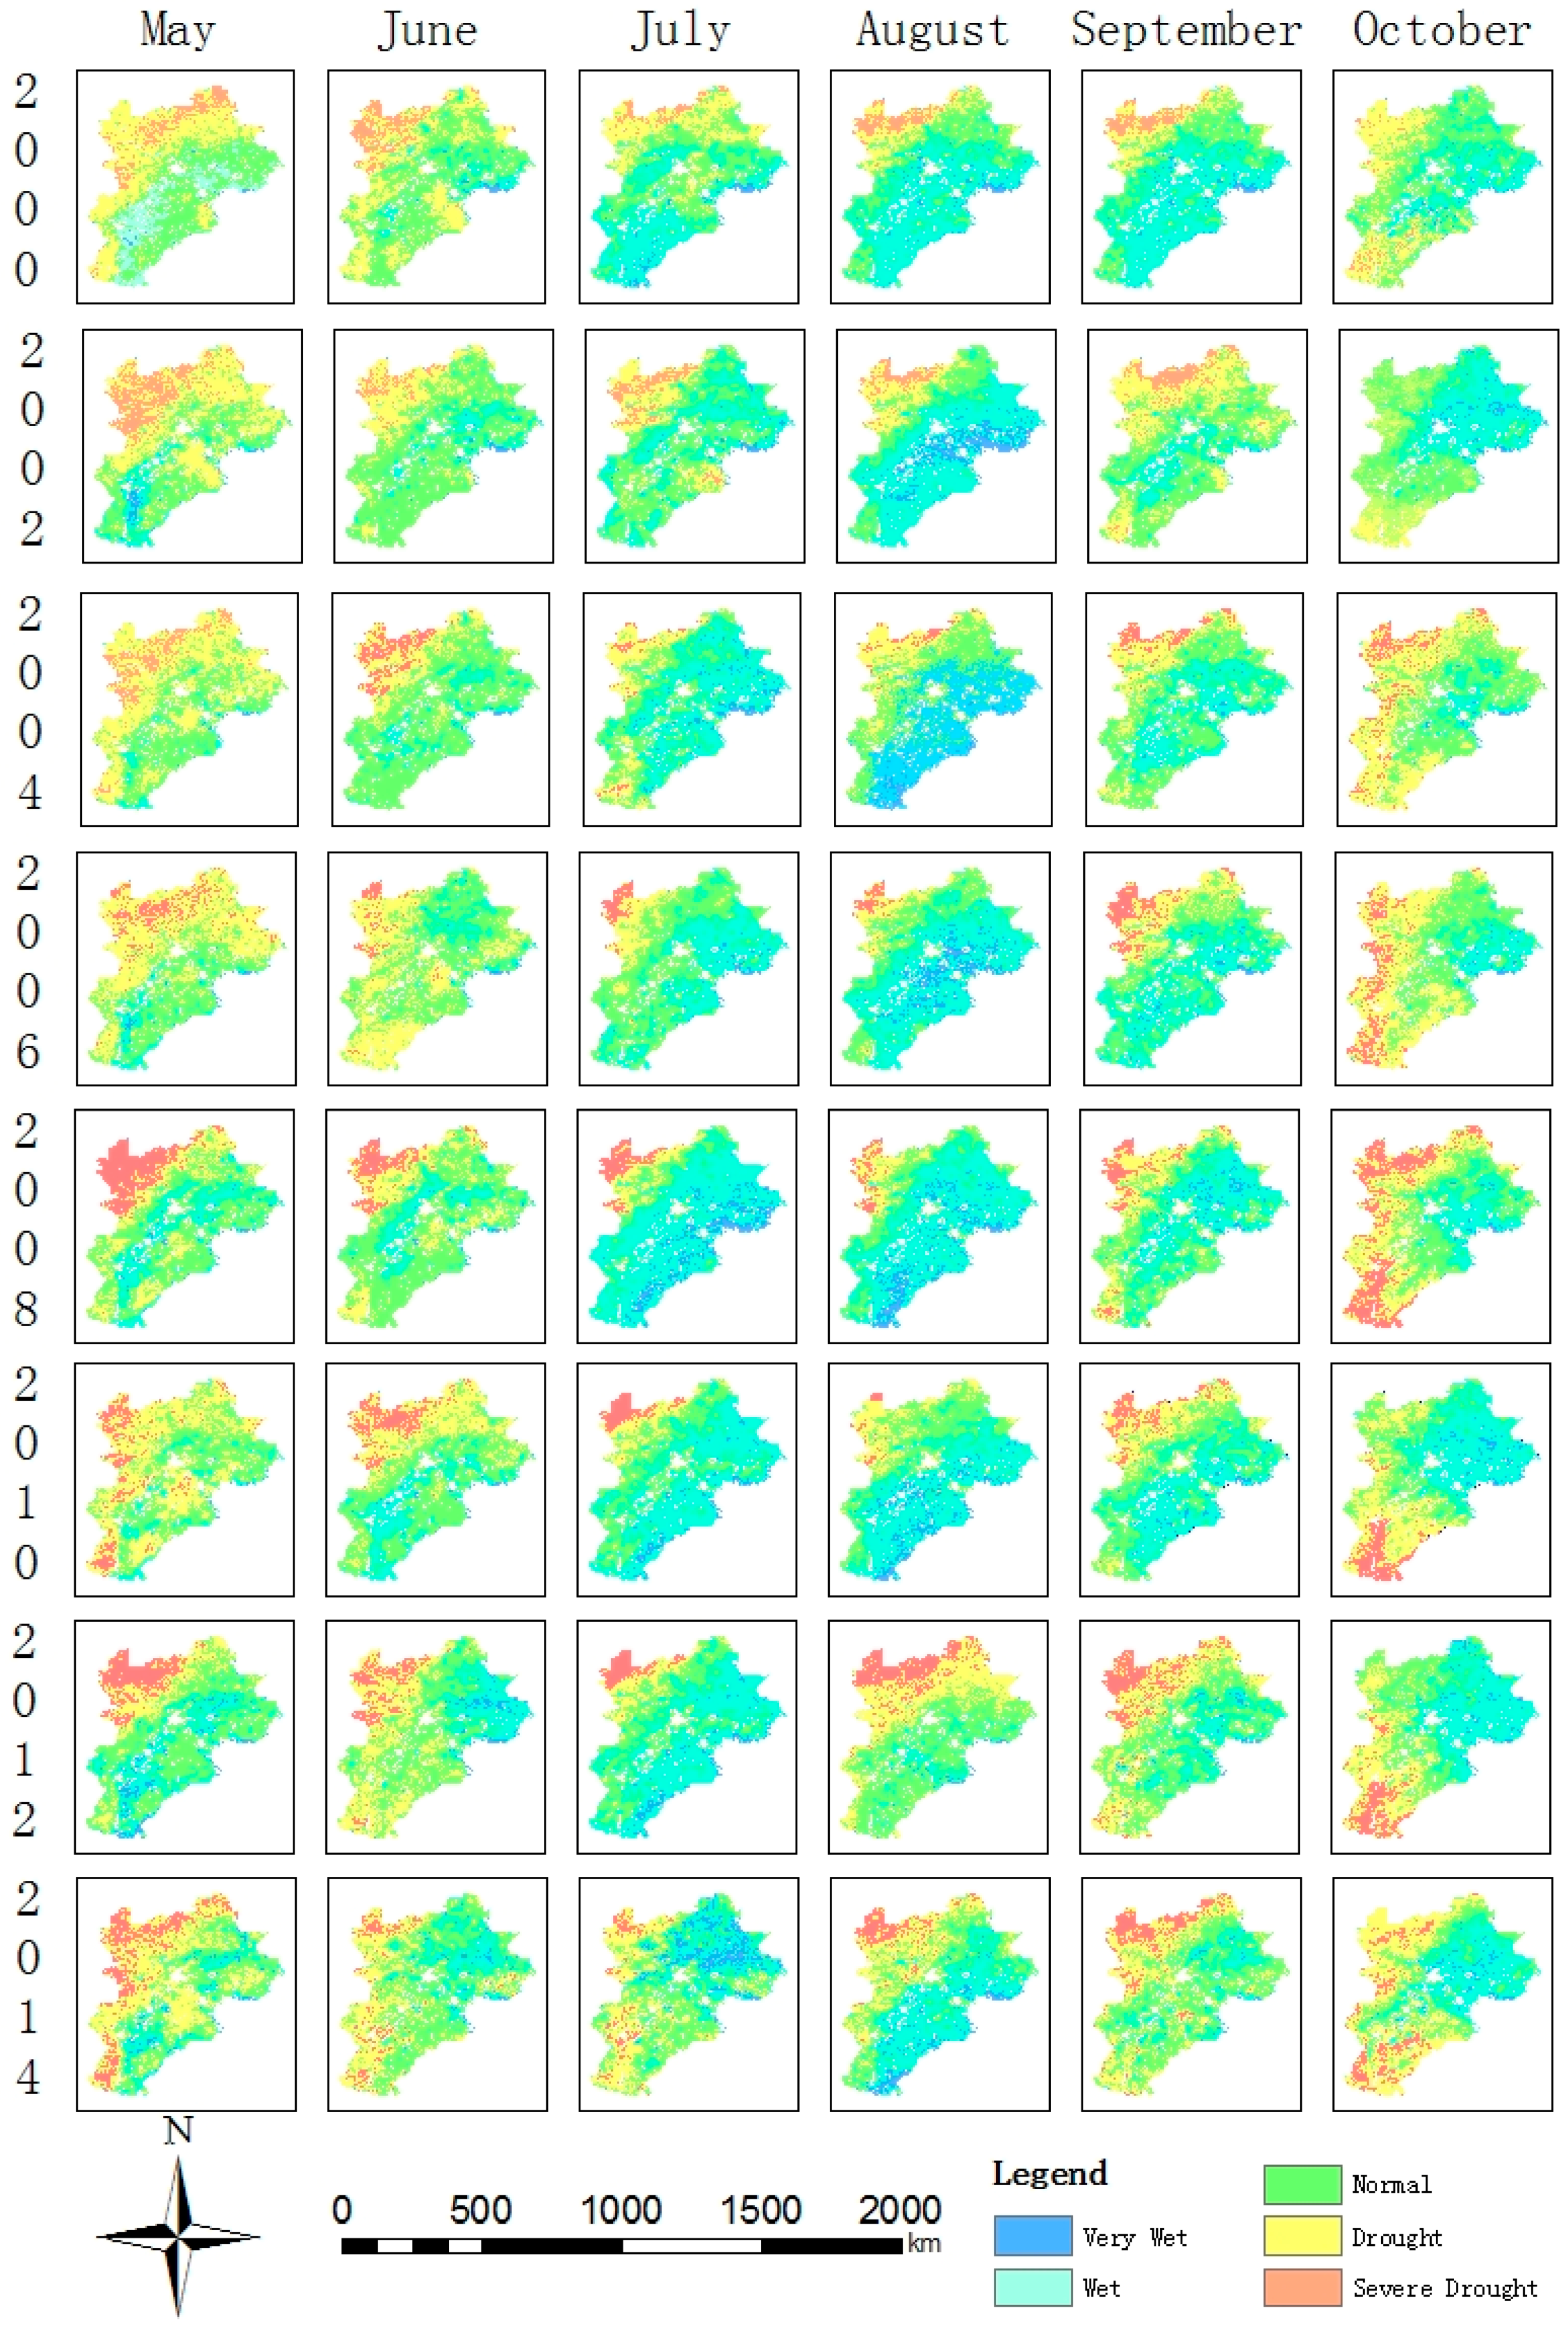
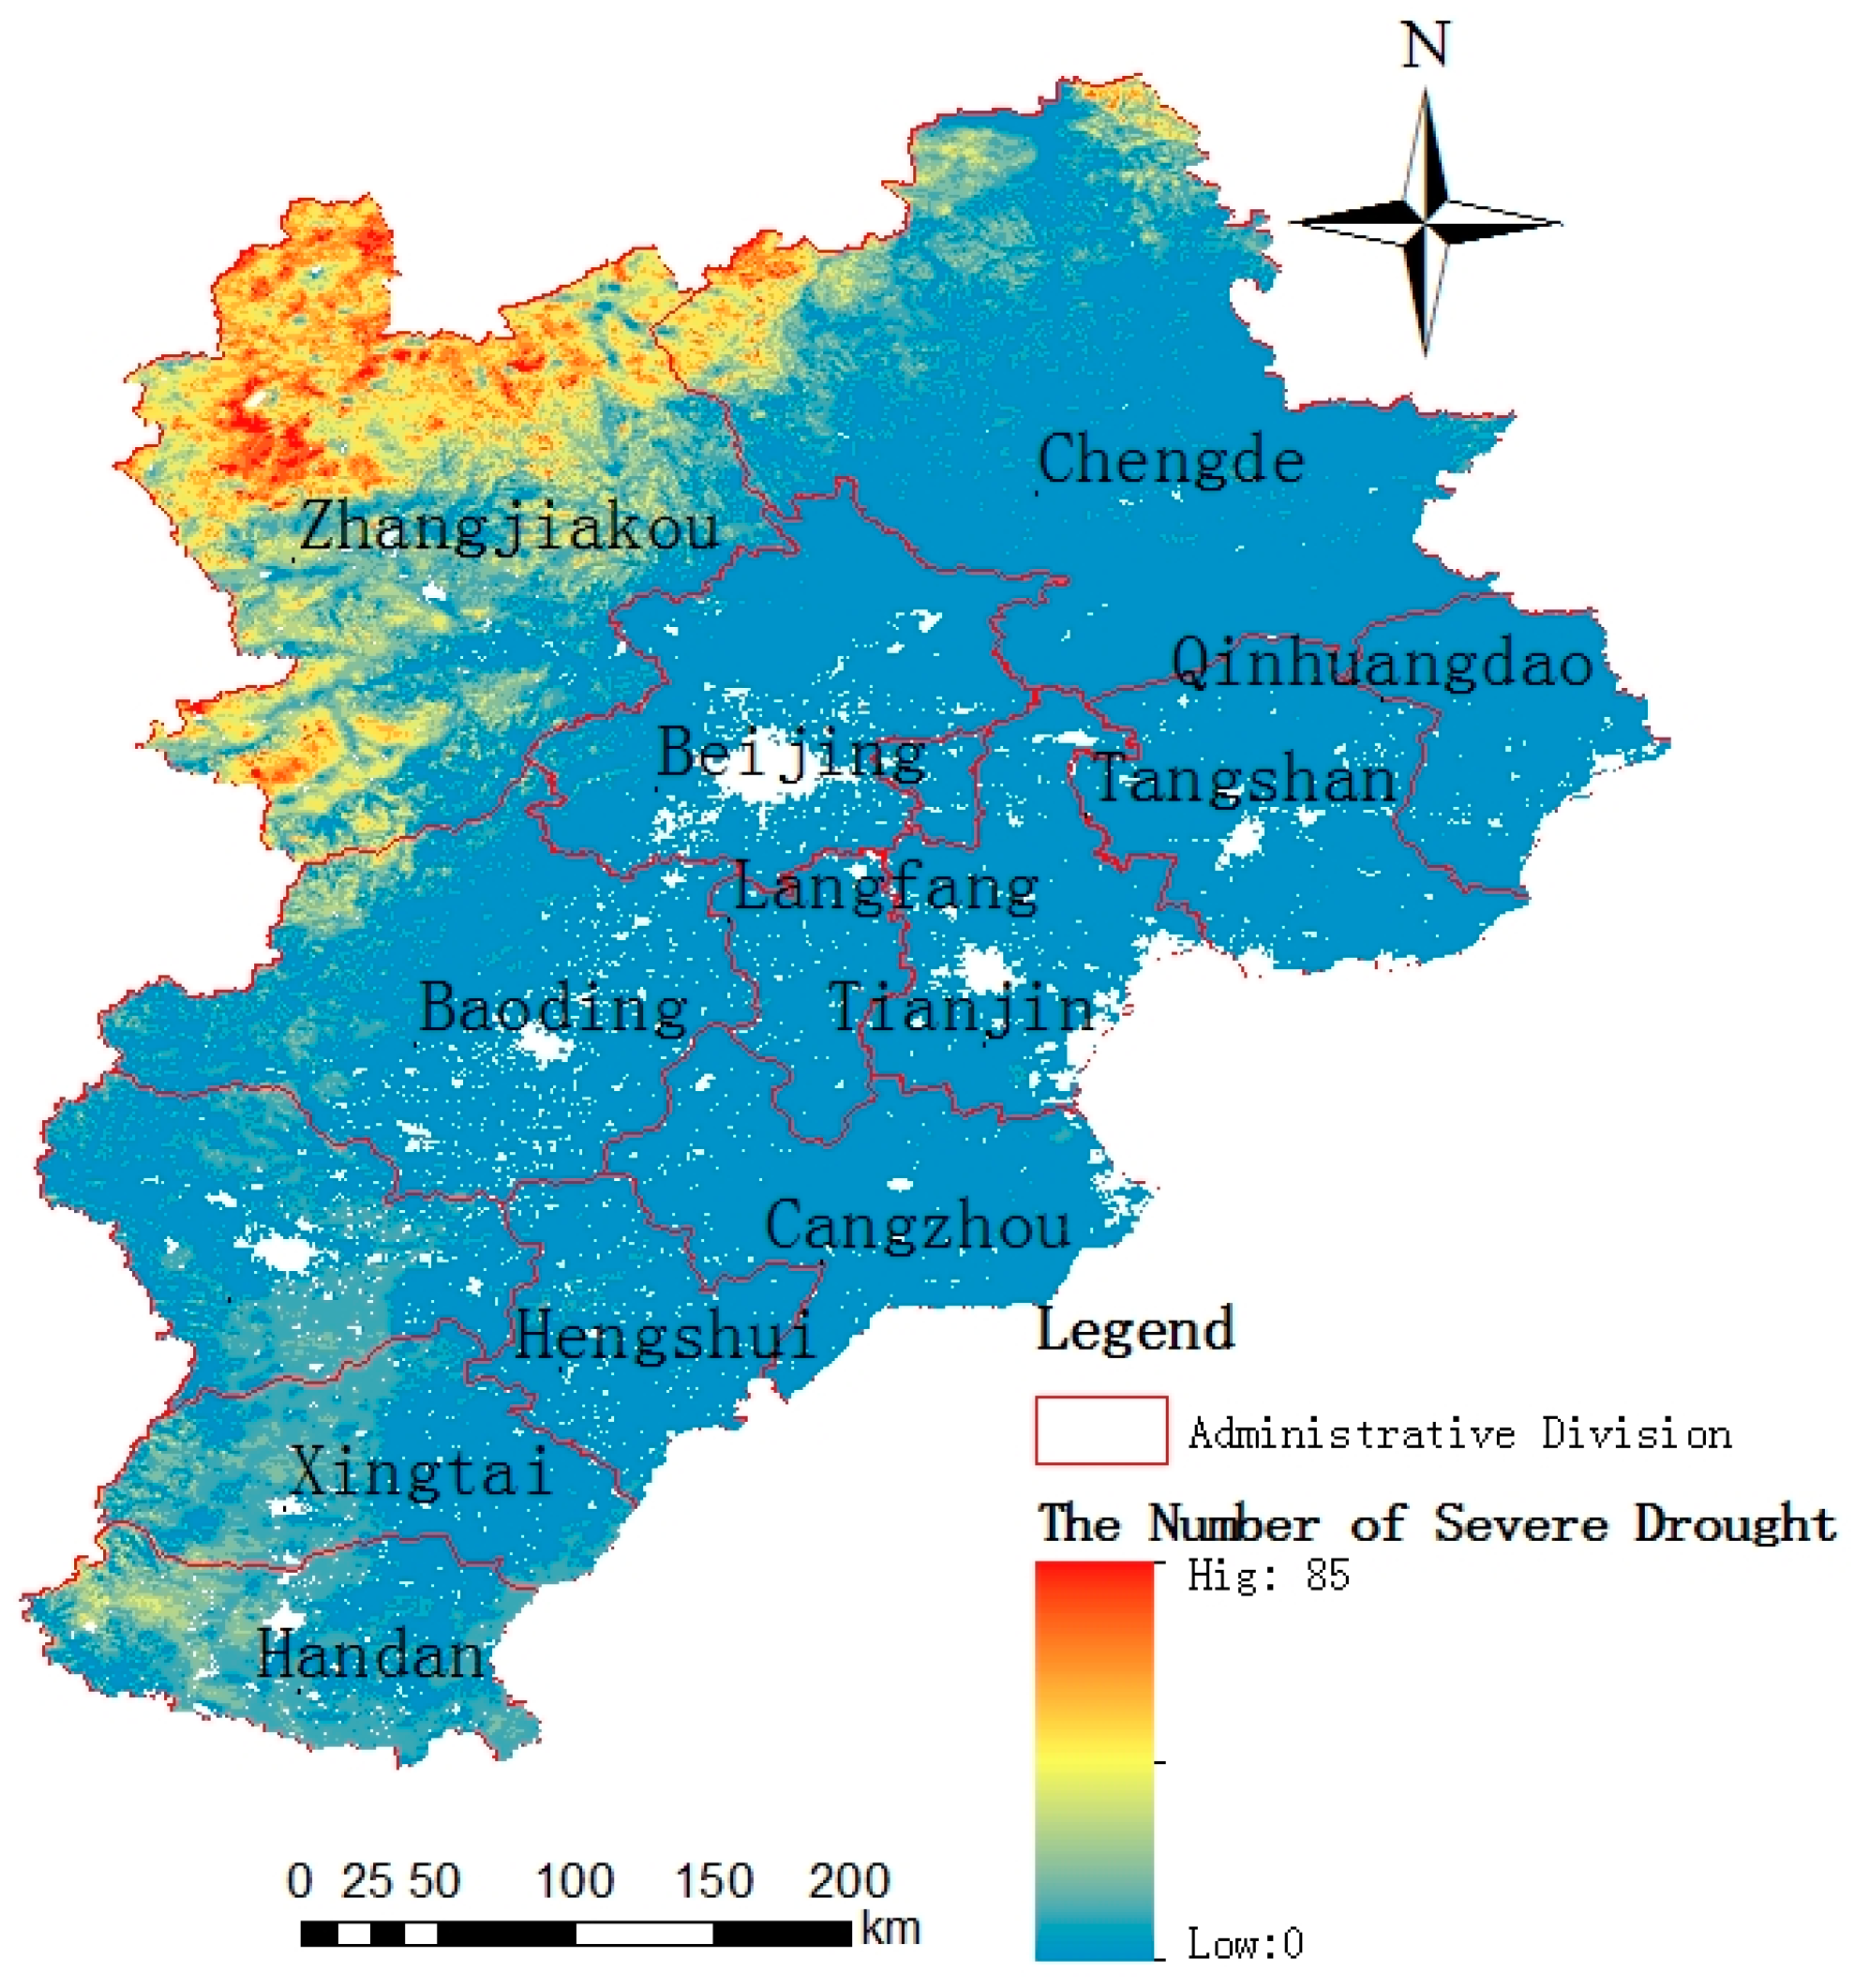
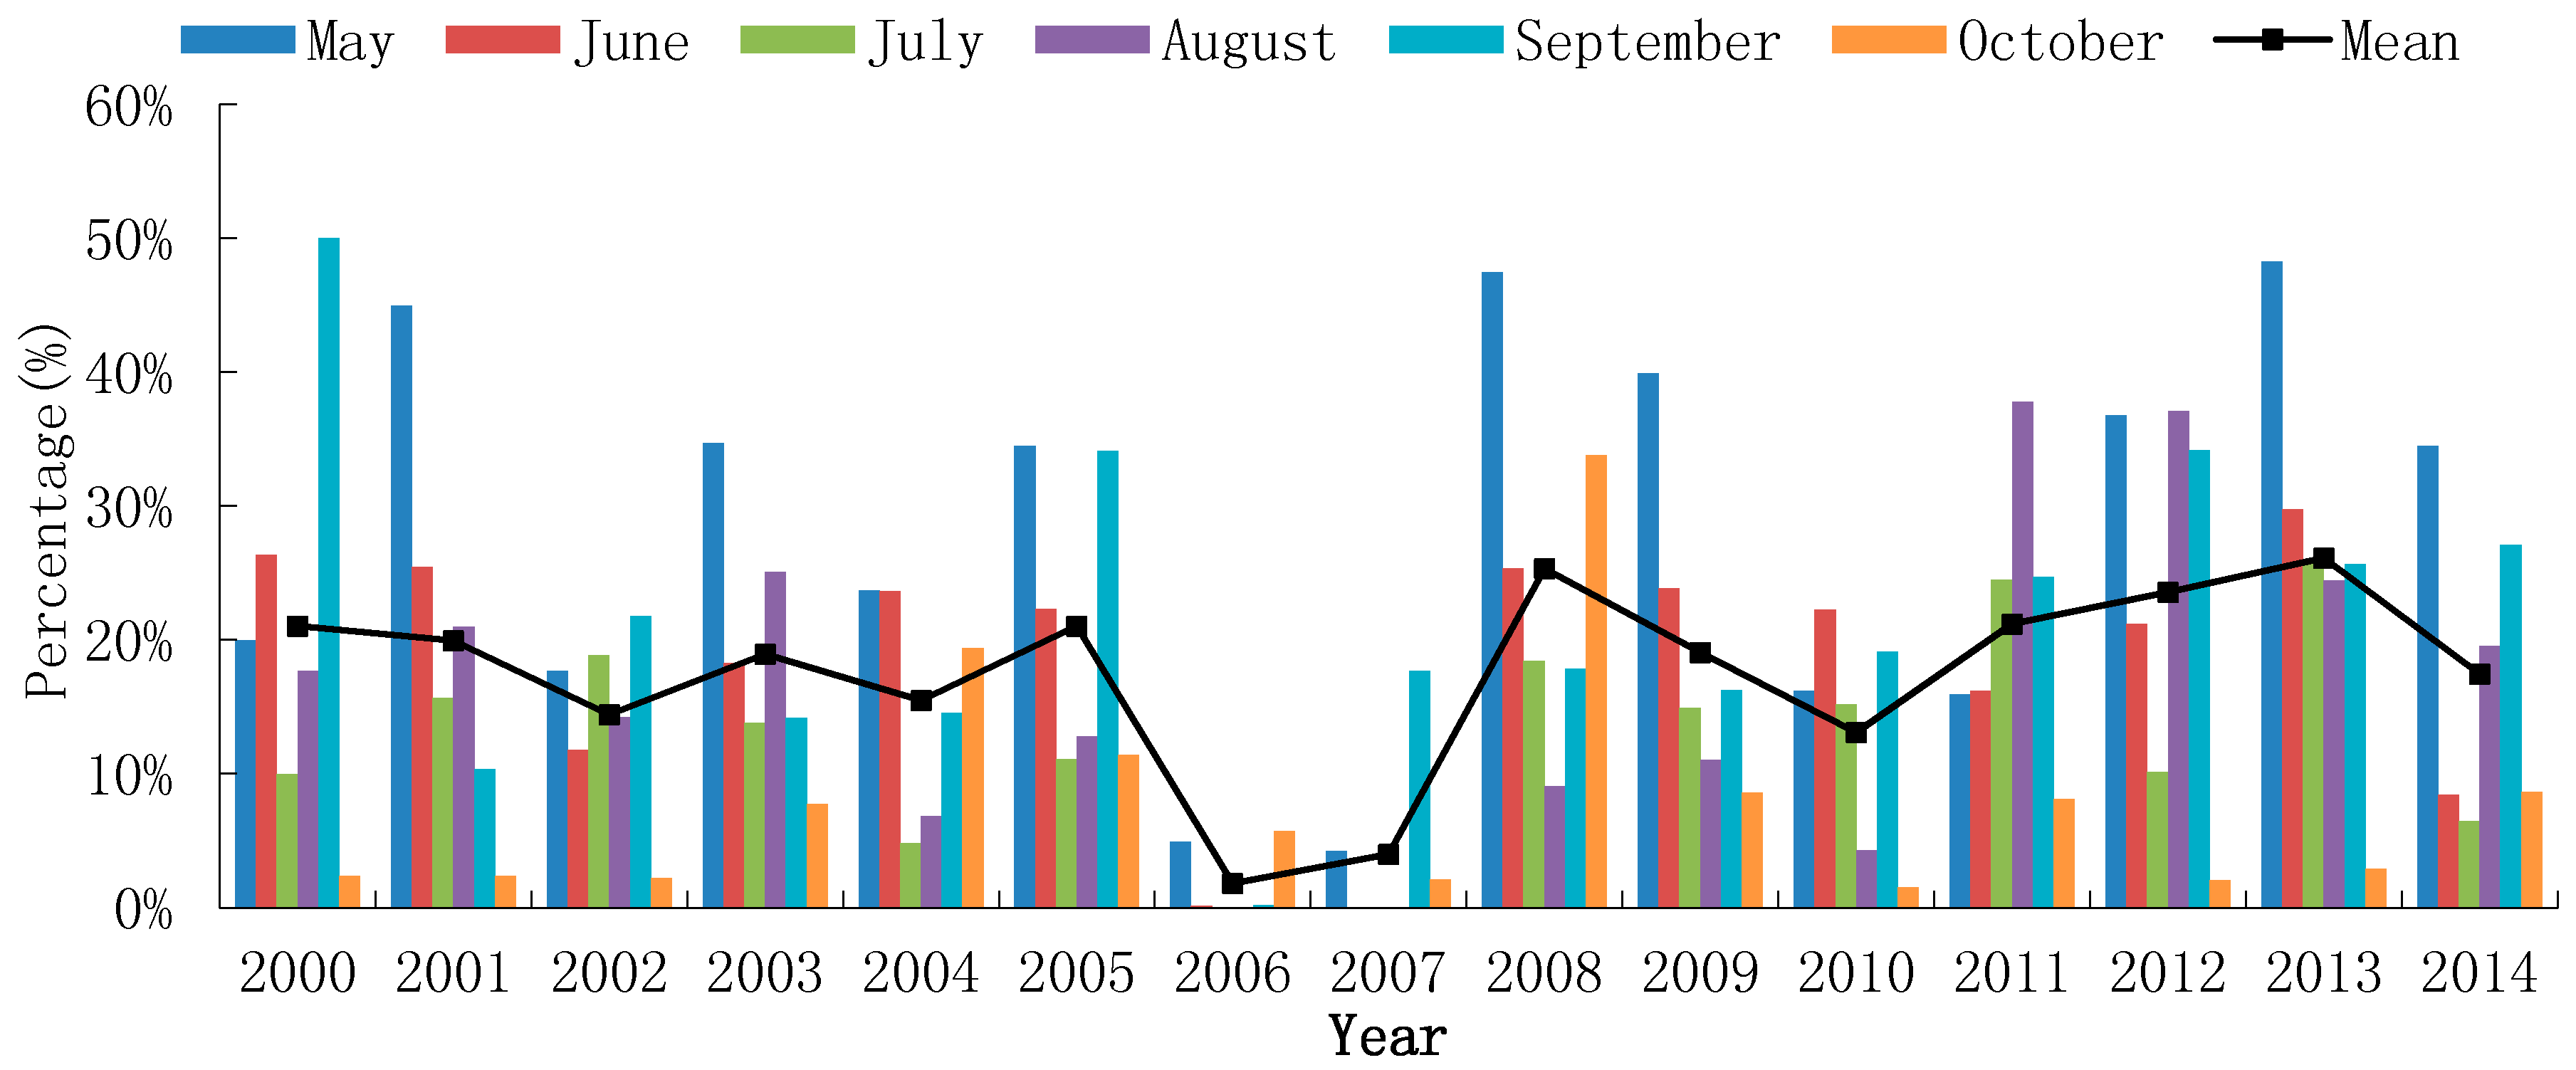
4.2. Spatiotemporal Analysis of Severe Drought in the Study Area

Figure 11 shows the spatial statistics for the severe droughts (0.8 < TVDI ≤ 1) that occurred from May to October between 2000 and 2014 in the BTHMR. Statistical results and Figure 11 shows that the total times of severe drought reached as high as 85 in some study areas during these 15 years. From May to October, the areas prone to droughts are concentrated to the north of Zhangjiakou and west of Chengde, and the areas prone to severe droughts are concentrated northwest of Zhangjiakou and Chengde, and west of Handan, Xingtai and Shijiazhuang.
Figure 12 shows the percentage of severe droughts from May to October between 2000 and 2014. In the figure, the different colors of the histograms represent the percentage of severe drought areas from May to October of each year, and the line chart represents the mean percentage of severe drought area from May to October for every year. Figure 12 indicates that the overall drought occurred primarily in May, September and October, and it was least likely to occur in July and August. These results are consistent with the continental monsoon climate of the BTHMR. The ample rainfall in summer resulted in decreases in the areas that were hit by severe droughts. The statistical precipitation data from May to October in 2010 (Figure 10) also confirm this finding. The calculations show that 2012, 2013 and 2014 were the three years when the area was hit hardest by drought. The severe drought rate of our study region ranges from 5.25% to 9.52%, the least severe was 5.24% in 2000 and the worst was 9.52% in 2013.
The primary land cover types in the study area are farmland and grassland, which account for 53.11% and 29.46%, respectively, of the total area. These land types are directly related to the region’s primary industries of agriculture and herding. The farmland and grassland that were hit by severe drought disasters have been statistically analyzed; the results are shown in Figure 13 and Figure 14. The histograms show that for the farmland, severe drought disasters occurred in October of each year, and 2008, 2010, 2012 and 2014 are the four years that were hit the hardest. During certain years, the affected area could cover up to 15% of the total area. Figure 14 indicates that the severe droughts in grassland primarily occurred in May and September. The areas that were hit by severe droughts were small in 2006 and 2007; the overlay of this figure with Figure 6 shows that the areas that were hit by severe droughts were primarily concentrated to the northwest of Zhangjiakou and across the majority of Chengde, in Hebei province. These results are consistent with the large body of literature and statistical data available for the BTHMR [37,38,39,40]. There are two reasons that caused the inconsistency in the drought timing of the farmland and grassland: these regions are located at different latitudes, and they have different irrigation conditions, e.g., many farmlands were equipped with irrigation facilities.

5. Discussion

In August 2012, the people’s government of Hebei province issued the strictest water resource management system [41] (referred to as the Management System below). The Management System outlined strict restrictions for groundwater exploitation in the area. To confirm the feasibility of the aforementioned research method and to evaluate the impact of the Management System on agricultural production, the drought in the area’s farmland has been statistically analyzed since the implementation of the Management System. According to the growth law of crops, June to September of every year is the optimum period for vegetation growth and is thus the peak traditional irrigation season for farmland. For this reason, the data from June to September were selected for analysis. Figure 15 shows a comparison between the mean percentage of severe droughts from June to September each year for the farmland in the study area, and the mean of the monthly total precipitation for the corresponding time. The figure shows that the means of the monthly total precipitation exhibited small variations and oscillated by approximately 100–150 mm. The monthly mean percentage of severe drought in the farmland remained stable between 2000 and 2012; 2003 is the year when more droughts occurred, with a monthly mean percentage of severe drought of 1.16%. However, because the implementation of the Management System began in 2012, the mean percentage of severe droughts has exhibited a dramatic change with an increase of 2.47% under the condition of no adjustment of planting structure, which is more than 110% higher than the previous level. These experiments demonstrate that the restriction on groundwater exploitation as outlined in the Management System issued by the Hebei government has resulted in a huge increase in the area hit by severe droughts, to a certain extent.

6. Conclusions

After analyzing the DTVDI calculation results, the times that were found to be most prone to drought were May, September and October. By contrast, the area that was hit by drought in the summer (June to August) was small and primarily concentrated in northern and southeastern Hebei province.
The experimental results from the study area confirm that the TVDI calculation method based on vegetation classification can be used for the effective monitoring and assessment of regional droughts. The results can provide effective data support to governmental departments for the prevention and management of droughts. Admittedly, the BTHMR has complex and diverse landforms, diverse climates and different land cover types. In addition, there are matching problems between the resolution of the satellite remote sensing data and the real conditions on the land surface. In particular, errors will result when matching unique landforms (e.g., valleys and mountains). All the aforementioned factors will create uncertainty in the use of remote sensing for large area drought monitoring; this uncertainty will be further explored in subsequent studies.

Acknowledgments

This paper is partially funded by the National High-tech R&D Program of China (863 Program) (2015AA123901), Natural Science Foundation of Hebei Province of China (D2015402134; 15967663D), and the Education Department of Hebei Province (QN2015105; YQ2013012; QN2014184).

Author Contributions

Haixin Liu and Anbing Zhang performed the new model research and prepared the paper. Tao Jiang provided advice and suggestions. Haitao Lv, Hefeng Wang and Xinxia Liu helped with the ground-based data and satellite remote sensing data collection and preprocessing.

Conflicts of Interest

The authors declare no conflicts of interest.

References

  1. Riebsame, W.E.; Changnon, S.A.; Karl, T.R. Drought and natural resources management in the United States. In Impacts and implications of the 1987–89 Drought; Westview Press Inc.: Boulder, CO, USA, 1991; pp. 312–313. [Google Scholar]
  2. Obasi, G.O.P. WMO’s Role in the International Decade for Natural Disaster Reduction. Bull. Am. Meteorol. Soc. 1994, 75, 1651–1655. [Google Scholar] [CrossRef]
  3. Sheffield, J.; Wood, E.F. Global Trends and Variability in Soil Moisture and Drought Characteristics, 1950–2000, from Observation-Driven Simulations of the Terrestrial Hydrologic Cycle. J. Clim. 2008, 21, 432–458. [Google Scholar] [CrossRef]
  4. Jeppesen, E.; Brucet, S.; Naselli-Flores, L.; Papastergiadou, E.; Stefanidis, K.; Nõges, T.; Nõges, P.; Attayde, J.L.; Zohary, T.; Coppens, J. Ecological impacts of global warming and water abstraction on lakes and reservoirs due to changes in water level and related changes in salinity. Hydrobiologia 2015, 750, 201–227. [Google Scholar] [CrossRef]
  5. Lehmann, J.; Coumou, D.; Frieler, K. Erratum to: Increased record-breaking precipitation events under global warming. Clim. Chang. 2015, 132, 517–518. [Google Scholar] [CrossRef]
  6. Peñuelas, J.; Rutishauser, T.; Filella, I. Ecology. Phenology feedbacks on climate change. Science 2009, 324, 887–888. [Google Scholar] [CrossRef] [PubMed]
  7. Zhang, L.; Ming, L.I.; Zhengfang, W.U.; Liu, Y. Vegetation cover change and its mechanism in northeast China based on SPOT/NDVI data. J. Arid Land Resour. Environ. 2011, 25, 171–175. [Google Scholar]
  8. Watson, K.; Rowan, L.C.; Offield, T.W. Application of thermal modeling in the geologic interpretation of IR images. Remote Sens. Environ. 1971, 3, 2017–2041. [Google Scholar]
  9. Idso, S.B.; Jackson, R.D.; Pinter, P.J.; Reginato, R.J.; Hatfield, J.L. Normalizing the stress-degree-day parameter for environmental variability. Agric. Meteorol. 1981, 24, 45–55. [Google Scholar] [CrossRef]
  10. Sun, W.; Wang, P.X.; Zhang, S.Y.; Zhu, D.H.; Liu, J.M.; Chen, J.H.; Yang, H.S. Using the vegetation temperature condition index for time series drought occurrence monitoring in the Guanzhong Plain, PR China. Int. J. Remote Sens. 2008, 29, 5133–5144. [Google Scholar] [CrossRef]
  11. Kogan, F.N. Remote sensing of weather impacts on vegetation in non-homogeneous areas. Int. J. Remote Sens. 1990, 11, 1405–1419. [Google Scholar] [CrossRef]
  12. Wang, P.X.; Li, X.W.; Gong, J.Y.; Song, C. Vegetation Temperature Condition Index and Its Application for Drought Monitoring. In Proceedings of the IEEE 2001 International Geoscience and Remote Sensing Symposium (IGARSS 2001), Sydney, Australia, 9–13 July 2001; pp. 141–143.
  13. Nemani, R.; Pierce, L.; Running, S.; Goward, S. Developing Satellite-derived Estimates of Surface Moisture Status. J. Appl. Meteorol. 2000, 32, 548–557. [Google Scholar] [CrossRef]
  14. Moran, M.S.; Clarke, T.R.; Inoue, Y.; Vidal, A. Estimating crop water deficit using the relation between surface-air temperature and spectral vegetation index. Remote Sens. Environ. 1994, 49, 246–263. [Google Scholar] [CrossRef]
  15. Sandholt, I.; Rasmussen, K.; Andersen, J. A simple interpretation of the surface temperature/vegetation index space for assessment of surface moisture status. Remote Sens. Environ. 2002, 79, 213–224. [Google Scholar] [CrossRef]
  16. Liang, L.; Zhao, S.H.; Qin, Z.H.; Ke-Xun, H.E.; Chong, C.; Luo, Y.X.; Zhou, X.D. Drought Change Trend Using MODIS TVDI and Its Relationship with Climate Factors in China from 2001 to 2010. J. Integr. Agric. 2014, 13, 1501–1508. [Google Scholar] [CrossRef]
  17. Rahimzadeh-Bajgiran, P.; Omasa, K.; Shimizu, Y. Comparative evaluation of the Vegetation Dryness Index (VDI), the Temperature Vegetation Dryness Index (TVDI) and the improved TVDI (iTVDI) for water stress detection in semi-arid regions of Iran. Isprs J. Photogramm. Remote Sens. 2012, 68, 1–12. [Google Scholar] [CrossRef]
  18. Ezzine, H.; Bouziane, A.; Ouazar, D. Seasonal comparisons of meteorological and agricultural drought indices in Morocco using open short time-series data. Int. J. Appl. Earth Obs. Geoinform. 2014, 26, 36–48. [Google Scholar] [CrossRef]
  19. Gao, Z.; Gao, W.; Chang, N.B. Integrating temperature vegetation dryness index (TVDI) and regional water stress index (RWSI) for drought assessment with the aid of LANDSAT TM/ETM+ images. Int. J. Appl. Earth Obs. Geoinform. 2011, 13, 495–503. [Google Scholar] [CrossRef]
  20. Feng, Z.; Zhang, L.W.; Shi, J.J.; Huang, J.F. Soil Moisture Monitoring Based on Land Surface Temperature-Vegetation Index Space Derived from MODIS Data. Pedosphere 2014, 24, 450–460. [Google Scholar]
  21. Holzman, M.E.; Rivas, R.; Piccolo, M.C. Estimating soil moisture and the relationship with crop yield using surface temperature and vegetation index. Int. J. Appl. Earth Obs. Geoinform. 2014, 28, 181–192. [Google Scholar] [CrossRef]
  22. Wang, P. Using MODIS Land Surface Temperature and Normalized Difference Vegetation Index products for monitoring drought in the southern Great Plains, USA. Int. J. Remote Sens. 2004, 25, 61–72. [Google Scholar]
  23. Song, C.; You, S.; Liu, G.; Linghong, K.E.; Zhong, X. The Spatial Pattern of Soil Moisture in Northern Tibet Based on TVDI Method. Prog. Geogr. 2011, 30, 569–576. [Google Scholar]
  24. Wang, H.; Li, X.; Long, H.; Xu, X.; Bao, Y. Monitoring the effects of land use and cover type changes on soil moisture using remote-sensing data: A case study in China’s Yongding River basin. Catena 2010, 82, 135–145. [Google Scholar] [CrossRef]
  25. Chen, C.F.; Son, N.T.; Chang, L.Y.; Chen, C.C. Monitoring of soil moisture variability in relation to rice cropping systems in the Vietnamese Mekong Delta using MODIS data. Appl. Geogr. 2011, 31, 463–475. [Google Scholar] [CrossRef]
  26. JianJun, B.; Yuan, Y.U.; LiPing, D. (JIA-2015-1119) Comparison between TVDI and CWSI for drought monitoring in the Guanzhong Plain, China. J. Integr. Agric. 2016. [Google Scholar] [CrossRef]
  27. Zhang, K. The impacts of global climate change on extreme weather events in Beijing-Tianjin-Hebei area and the countermeasures for disaster prevention. J. Arid Land Resour. Environ. 2011, 25, 122–125. [Google Scholar]
  28. Ran, Q.; Zhang, Z.; Zhang, G.; Zhou, Q. DEM correction using TVDI to evaluate soil moisture status in China. Sci. Soil Water Conserv. 2005, 3, 32–36. [Google Scholar]
  29. Li, H.J.; Li, C.Q.; Yong, L.; Lei, Y.P.; Com, M. Surface temperature correction in TVDI to evaluate soil moisture over a large area. J. Food Agric. Environ. 2010, 8, 1141–1145. [Google Scholar]
  30. Son, N.T.; Chen, C.F.; Chen, C.R.; Chang, L.Y.; Minh, V.Q. Monitoring agricultural drought in the Lower Mekong Basin using MODIS NDVI and land surface temperature data. Int. J. Appl. Earth Obs. Geoinform. 2012, 18, 417–427. [Google Scholar] [CrossRef]
  31. Yang, Y.; Tian, J.; Rong, Y.; Long, A. Monitoring Spatial Patterns of Vegetation Phenology in Heihe River Basin based on Remote Sensing. Remote Sens. Technol. Appl. 2012, 27, 282–288. [Google Scholar]
  32. Hope, A.S.; Boynton, W.L.; Stow, D.A.; Douglas, D.C. Interannual growth dynamics of vegetation in the Kuparuk River watershed, Alaska based on the Normalized Difference Vegetation Index. Int. J. Remote Sens. 2003, 24, 3413–3425. [Google Scholar] [CrossRef]
  33. Goward, S.N.; Cruickshanks, G.D.; Hope, A.S. Observed relation between thermal emission and reflected spectral radiance of a complex vegetated landscape. Remote Sens. Environ. 1985, 18, 137–146. [Google Scholar] [CrossRef]
  34. Price, J.C. Using spatial context in satellite data to infer regional scale evapotranspiration. IEEE Trans. Geosci. Remote Sens. 1990, 28, 940–948. [Google Scholar] [CrossRef]
  35. Carlson, T.N.; Gillies, R.R.; Perry, E.M. A Method to Make Use of Thermal Infrared Temperature and NDVI measurements to Infer Surface Soil Water Content and Fractional Vegetation Cover. Remote Sens. Rev. 1994, 9, 161–173. [Google Scholar] [CrossRef]
  36. Wang, C.; Qi, S.; Niu, Z.; Wang, J. Evaluating soil moisture status in China using the temperature–vegetation dryness index (TVDI). Can. J. Remote Sens. 2004, 30, 671–679. [Google Scholar] [CrossRef]
  37. Cai, W.; Zhang, Y.; Chen, Q.; Yao, Y. Spatial Patterns and Temporal Variability of Drought in Beijing-Tianjin-Hebei Metropolitan Areas in China. Adv. Meteorol. 2015, 2015, 1–14. [Google Scholar] [CrossRef]
  38. Yan, F.; Wang, Y.J.; Bo, W.U. Spatial and temporal distributions of drought in Hebei Province over the past 50 years. Geogr. Res. 2010, 29, 423–430. [Google Scholar]
  39. Xin, R.; Liu, X.F.; Yuan-Hua, L.I. Drought Climate Changes in Hebei Province during 1961–2000. J. Arid Land Resour. Environ. 2008, 22, 50–53. [Google Scholar]
  40. Cai, W.; Zhang, Y.; Yao, Y.; Chen, Q. Probabilistic Analysis of Drought Spatiotemporal Characteristics in the Beijing-Tianjin-Hebei Metropolitan Area in China. Atmosphere-Basel 2015, 6, 431–450. [Google Scholar] [CrossRef]
  41. General Office of Hebei Provincial People’s Government. The Strictest Water Resource Management System. Available online: http://info.hebei.gov.cn/hbszfxxgk/329975/329982/378329/index.html (accessed on 6 August 2012). (In Chinese)
Figure 1. Study area (BTHMR) and sampling sites of precipitation and soil moisture.
Sustainability 08 01327 g001
Figure 2. Types of land use in the BTHMR in 2010.
Sustainability 08 01327 g002
Figure 3. The feature space schematics of Ts-NDVI [14,34]. (a) Triangle: a scatter plot of Ts and NDVI; (b) trapezoid: a scatter plot of Ts and NDVI.
Sustainability 08 01327 g003
Figure 4. The percentage change between WTVDI and DTVDI.
Sustainability 08 01327 g004
Figure 5. Fit between the calculated TVDI and the soil moisture. (a) Correlation between soil moisture and WTVDI data; (b) Correlation between soil moisture and DTVDI data.
Sustainability 08 01327 g005
Figure 6. Drought grade maps from May to October in the BTHMR every two years from 2000 to 2014.
Sustainability 08 01327 g006
Figure 7. Comparison of the DTVDI and the soil moisture at each observation station in September 2010. (Note: HA-Huai’an, BP-Buping, WJ-Wuji, NQ-NeiQiu, NQ2-NeiQiu2, FF-Fengfeng, WC-Wei County, GP-Guangping, CD-Chengde, SH-Sanhe, LC-Luan County, FN-FengNan, WD-Wangdu, HJ-Hejian, JH-Jinghai, YS-Yanshan, WQ-Wuqiang, JC-Jing County, JC2-Jing County2, NP-Nanpi, DM-Daming, GT-Guantao).
Sustainability 08 01327 g007
Figure 8. Comparison of the DTVDI and the soil moisture at the Nangong observation station from May 2000 to October 2014.
Sustainability 08 01327 g008
Figure 9. Comparison of DTVDI and precipitation in September 2010. (Note: ZB-Zhangbei, WC-Wei County, SJZ-Shijiazhuang, XT-Xingtai, FN-Fengning, WC2-Weichang, ZJK-Zhangjiakou, HL-Huailai, MY-Miyun, CD-Chengde, ZH-Zunhua, QL-Qinglong, QHD-Qinhuangdao, BJ-Beijing, LF-Langfang, TJ-Tianjin, TS-Tangshan, LT-Leting, BD-Baoding, RY-Raoyang, BT-Botou, TG-Tanggu, HH-Huanghua, NG-Nangong).
Sustainability 08 01327 g009
Figure 10. Comparison of TVDI and precipitation from May 2000 to October 2014 at the Miyun station.
Sustainability 08 01327 g010
Figure 11. Spatial statistics for severe droughts from May to October between 2000 and 2014 in the BTHMR.
Sustainability 08 01327 g011
Figure 12. The percentage of severe droughts in the study area from May to October between 2000 and 2014.
Sustainability 08 01327 g012
Figure 13. Percentage of severe droughts in the farmland study area between 2000 and 2014.
Sustainability 08 01327 g013
Figure 14. Percentage of severe droughts in the grassland study area between 2000 and 2014.
Sustainability 08 01327 g014
Figure 15. Comparison between the mean monthly total precipitation and the mean percentage of severe droughts in farmland from May to September, between 2000 and 2014.
Sustainability 08 01327 g015
Table 1. The dry and wet edges from each calculation.
TypeDry EdgeWet Edge
WholeLST = −6.51 × NDVI + 317.27LST = 2.83 × NDVI + 290.65
WoodlandLST = −2.83 × NDVI + 311.33LST = 2.92 × NDVI + 292.23
CroplandLST = −5.92 × NDVI + 316.77LST = 3.42 × NDVI + 292.73
GrasslandLST = −10.86 × NDVI + 318.49LST = 5.89 × NDVI + 291.60
Table 2. Statistical values of NDVI and LST for each land cover type.
TypeNDVI MinimumNDVI MaximumLST MinimumLST Maximum
Whole0.160.99294.65314.51
Woodland0.410.97294.65307.94
Farmland0.190.99297.34313.48
Grassland0.160.844300.18314.51

