Article

Hydraulic Properties of Porous Media Saturated with Nanoparticle-Stabilized Air-Water Foam

School of Sustainable Engineering and the Built Environment, Arizona State University, Tempe, AZ 85281, USA
*
Author to whom correspondence should be addressed.
Sustainability 2016, 8(12), 1317; https://doi.org/10.3390/su8121317
Submission received: 20 September 2016 / Revised: 30 November 2016 / Accepted: 2 December 2016 / Published: 14 December 2016
(This article belongs to the Section Environmental Sustainability and Applications)

Abstract

:
The foam generated by the mixture of air and water has a much higher viscosity and lower mobility than those of pure water or gas that constitutes the air-water foam. The possibility of using the air-water foam as a flow barrier for the purpose of groundwater and soil remediation is explored in this paper. A nanoparticle-stabilized air-water foam was fabricated by vigorously stirring the nano-fluid in pressurized condition. The foam bubble size distribution was analyzed with a microscope. The viscosities of foams generated with the solutions with several nanoparticle concentrations were measured as a function of time. The breakthrough pressure of foam-saturated microfluidic chips and sand columns were obtained. The hydraulic conductivity of a foam-filled sand column was measured after foam breakthrough. The results show that: (1) bubble coalescence and the Ostwald ripening are believed to be the reason of bubble size distribution change; (2) the viscosity of nanoparticle-stabilized foam and the breakthrough pressures decreased with time once the foam was generated; (3) the hydraulic conductivity of the foam-filled sand column was almost two orders of magnitude lower than that of a water-saturated sand column even after the foam-breakthrough. Based on the results in this study, the nanoparticle-stabilized air-water foam could be injected into contaminated soils to generate vertical barriers for temporary hydraulic conductivity reduction.

1. Introduction

A foam is an aqueous dispersion of a gas in liquid, with thin films of liquid (called lamellae) separating gas bubbles. Foams are thermodynamically unstable, but the stability can be improved by surfactants [1], solid particles [2], polymers [3], and biopolymers [4]. Compared with those foam stabilization methods, the use of nanoparticles for foam stabilization has several advantages such as durability under high-temperature [5], high adhesion energy at interface [6,7], low retention of nanoparticles in reservoir rock [8,9], high CO2 solvation capability [6], and versatile functionality [9,10].
Stabilized foams have been used for enhanced oil/gas recovery (EOR) [11,12,13,14], the remediation of non-aqueous phase liquids (NAPLs) [15,16,17], and CO2 geological storage [18,19]. The stabilized CO2-water foam can be used for geological CO2 sequestration and CO2-enhanced oil recovery. Due to the high viscosity of CO2-water foam, high oil or water displacement efficiency can be achieved in oil production or geological CO2 sequestration, which enhances oil recovery rate or CO2 storage capacity. In addition, the nanoparticles injected for CO2 sequestration will remain in pore spaces with CO2 for a long-term and may prevent a rapid catastrophic failure in case CO2 escapes through a crack or fault in CO2 reservoirs.
In contrast to the considerable interest in studying CO2-water foam, there are not many studies on nanoparticle stabilized air-water foams. Some examples of previous study include the use for firefighting [20] and aquifer remediation [21]. Due to the ability to decrease the flow rate significantly, air-water foam could also be utilized as a barrier to rapidly isolate contaminants in soils for temporary purposes. The contaminants can be isolated by a foam barrier to protect groundwater until other permanent treatment methods are applied. To achieve this purpose, long-term stability and suitable viscosity of the air-water foam are important. In this study, the stability and viscosity of the air-water foam generated with the help of different types of nanoparticles are investigated. In addition, the breakthrough pressure is also measured as well as hydraulic conductivity in a core-scale experiment.

2. Background—Literature Review

An interface exists at the boundary between two immiscible fluids such as water-oil, air-water, CO2-water, and CO2-oil. Depending on the phase of two fluids, the mixture can be called either emulsion in which liquid phase droplets are dispersed in another liquid fluid or foam in which gaseous phase droplets are dispersed in liquid fluid. Colloidal particles tend to adsorb at the interface [22,23,24] and reduce mass transfer through the interface, thereby generating a stabilized emulsion or foam. The stability of emulsion (called Pickering emulsion) is affected by particles size, shape, concentration, wettability, and particle-particle interactions at the liquid-liquid interface [25]. For example, particles that have a contact angle slightly less than 90° (water-wet) tend to stabilize oil droplets-in-water emulsion whereas particle that have a contact angle slightly higher than 90° (oil-wet) stabilize water droplets-in-oil emulsion [26,27]. The hydrophilic/CO2-philic balance (HCB) of nanoparticles is a key factor that affects the stability of the CO2-water foam [28]. The surfactants added in the fluid may change the wettability of particles due to the adsorption of surfactant molecules onto particle surfaces [2,29]. It has been found that the ability to generate stable foam is enhanced by using both surfactants and nanoparticles together [28,30,31]. Nevertheless, some studies reported the destabilization of the surfactant-particle mixture [3,32].
The viscosity of foam is affected by many factors such as an injection pressure and flow rate of two fluids, pore size of the foam generator, nanoparticle concentration, and foam bubble size. The viscosity of water-oil emulsion is inversely proportional to the droplet size [33]. The bubble size of foam generated by a mixing method decreases with the increasing mixing speed, decreasing solution feeding rate, and cooling temperature [34]. The foam viscosity increases as the foam bubble size becomes more homogeneous, which results in a higher resistance to flow [35]. The smaller silica nanoparticles are found to have a greater ability in generating stabilized foams [36].
A permeable reactive groundwater barrier has been studied to remove the contaminants in soil [37,38]. Foams have great advantages of large specific surface area and low interface slip velocity [39], which are preferable for the permeable reactive groundwater barriers.
For the generation of air-water foam, air and water can be injected simultaneously through porous media. The vigorous agitation of the fluid in the air can also generate the air-water foam. Most researchers use the co-injection method in making CO2 foam at high-pressure condition [19,40,41]. However, the foam generation efficiency of the co-injection method is restricted by the flow rate and the size of porous media. Especially for the application in shallow surfaces (e.g., vertical barrier), the agitation method can make a large volume of foams that can be injected at the target depth.

3. Experimental Details

3.1. Nanoparticles and Surfactant

Two commercial silica nanoparticles (AEROSIL R974 and NYACOL DP9711) were used to stabilize the foam. The AEROSIL R974 (Cary Company, Addison, IL, USA) is a nanoparticle powder with the particle size of 5–50 nm. The NYACOL DP9711 (NYACOL Nano Technologies Inc., Ashland, MA, USA) is a nanoparticle suspension with the particle size of 20 nm. Two types of surfactants were also used: sodium dodecyl sulfate (SDS; purity ≥ 99.0%, Sigma-Aldrich, St. Louis, MO, USA) and hexadecyltrimethylammonium bromide (CTAB) (purity ~ 99%, Sigma-Aldrich). Four types of fluids were prepared by using the nanoparticles and the surfactants (Table 1). Ethanol (purity ≥ 99.5%, Sigma-Aldrich) was utilized to wet the hydrophobic AEROSIL R974 nanoparticles. The contact angle of water on AEROSIL R974 is around 120° [42]. Due to this high hydrophobicity of the nanoparticles, the nanoparticles may float on the water surface if ethanol is not added. To prepare (1) AEROSIL R974 nanofluid (2 wt % of nanoparticles in water), ethanol was first added to wet the silica nanoparticles. After deionized (DI) water (Reverse Osmosis system plus Three Stage DI Filtration System, US Water Systems Company, Indianapolis, IN, USA) was added to the solution, the solution was heated in a reflux set-up at around 80 °C for 2 h to evaporate the ethanol initially added to the solution. Later, the solution was stirred with a magnetic stirrer for 12 h and in an ultrasound bath (Branson 2800) for 20 min. The same procedure used for AEROSIL R974 solution was used again to prepare (2) AEROSIL R974 + SDS solution. The only difference was that 0.1 wt % SDS was added to the solution after heating; (3) CTAB solution and (4) CTAB + NYACOL DP9711 solution were obtained by adding DI water to commercial solutions.

3.2. Foam Generation and Stability

The Parr stirrer (Model 4563, Parr Instrument Co., Moline, IL, USA) mixes two fluids to generate foam. The rotational speed of the stirrer is 1700 rpm. The volume of the stirring chamber is 300 mL. The air-nanofluid foam was generated by vigorously agitating a solution for 10 min at an air pressure of approximately 300 kPa. Foams made from the four types of fluid by a stirring method were collected into vials. Pictures were taken by a camera (D5200, Nikon, Melville, NY, USA) periodically to observe the foam stability in terms of a foam height. The volume fraction of gas in the generated foam was 0.75~0.85.
The foam stability as a function of time was obtained by comparing the normalized foam height. The generated foam was also introduced in between two microscope slides (the distance between two slides was 200 μm). Then, the stability of the bubbles in the foams was observed with a microscope (IN300TC-10MA, AmScope, Irvine, CA, ISA) and the bubble size distribution was obtained from time-lapse (30 min interval) images by using ImageJ.

3.3. Viscosity Measurement and Calculation

The AEROSIL R974 solution was used to generate a foam. The viscosity of the foam was obtained by measuring the pressure difference between two ends of a stainless steel tube with a known length when a foam flows through the tube at a known flow rate (Figure 1a). A syringe pump (KDS 410P, Analytical West, Corona, CA, USA) and plastic syringes were used to collect the foam from the Parr stirrer and inject the foam into the stainless steel tube. The inner diameter of the stainless steel tube was 0.533 mm, and the total length of the tube was 124 cm. Two pressure transducers (PX309, Omega, Norwalk, CT, USA) were attached at two locations of the tube separated by 41 cm. The viscosity (η) was calculated by dividing the shear stress τ with the shear rate γ [19,28,40,43,44]:
η = τ/γ
The shear stress τ is determined by the shear force F and the area A parallel to the applied force vector:
τ = F A = Δ P ( π R 2 ) 2 π R L = Δ P R 2 L
The shear rate γ of a Newtonian fluid flowing within a pipe is determined:
γ = 4 v R = 4 Q π R 2 R = 4 Q π R 3
The viscosity of foam can be calculated:
η = τ γ = π 8 Δ P R 4 L Q
In Equation (4), ΔP is the pressure difference between two tube locations, R is the inner radius of the tube, L is the length of the tube, Q is the flow rate, v is the flow velocity, and η is the viscosity.
The effect of time on the viscosity of foams was investigated for the AEROSIL R974 solutions with 0.5 wt %, 1 wt %, and 2 wt % nanoparticle concentrations. The initially generated foams were introduced to several syringes and sealed for the viscosity measurement at different times. The foam prepared and stored in each syringe was injected into the capillary tube for the viscosity measurement.

3.4. Breakthrough Pressure Measurement—Microfluidic Chip

The experimental configuration is shown in Figure 1. The microfluidic chip (Micronit, Enschede, The Netherlands) that was used had 377 grains with diameter of 800 μm and the pore throat of the chip was 105 μm (refer to a similar experimental setup for foam flow [45]). A stainless steel syringe could inject water or foam into the microfluidic chip. A high prescision pressure transducer (PX329-002G5V, Omega, Norwalk, CT, USA) measured input pressure. A camera (Nikon D5200 with an AF-S Micro Nikkor lens) took a picture to show the displacement pattern. Once the microfluidic chip was saturated with a foam, the pressure was slowly increased by injecting water through a syringe pump at constant flow rate of 4 μL/min.
The breakthrough pressure PB was defined as the pressure of the water invading into the foam-saturated microfluidic chip when a water percolation path from the input to output port of the microfluidic chip occurred. During the injection of water at a slow flow rate, the water pressure increased until the water percolation path was obtained. As soon as there was a water percolation, the water flowed through the percolated channel, then, the water pressure decreased. Therefore, the maximum pressure difference between the input and output port of the microfluidic chip was called the breakthrough pressure PB (shown in the inset figure of Figure 2b).
As soon as the foams were generated from the 0.5 wt % AEROSIL R974 solution for the previous viscosity measurement, the same foams were also injected into three identical microfluidic chips for breakthrough pressure measurement. Then, the three chips were used for breakthrough pressure measurement on the first, third, and seventh day after the foam injection.

3.5. Breakthrough Pressure and Hydraulic Conductivity Experiment—Sand Column

The graded Ottawa sands (Humboldt Mfg. Co., Elgin, IL, USA) were used for the column test. The specific gravity was 2.65. The effective diameter D10, D30, and D60 were 0.27 mm, 0.35 mm, and 0.46 mm, respectively. The coefficient of uniformity was Cu = 1.66, and coefficient of curvature was Cc = 0.98. The sands (total weight 1150 g) were compacted into a permeameter (Humboldt Mfg. Co.) that was 7.62 cm in diameter and 15.0 cm in length. Three permeameter cells filled with sands with the same porosity (36%) were prepared.
The foam generated from the 0.5 wt % AEROSIL R974 solution by using the Parr mixer was introduced to a water-saturated sand column through the bottom port of the permeameter. The weight of displaced water was used for the calculation of foam saturation. The foam injection was stopped when the foam flowed out steadily from the outlet.
The breakthrough pressure of a sand column was measured by injecting water at 0.8 mL/min flow rate (Figure 1b). The breakthrough pressure of the first sand column was measured as soon as the foam was injected. The breakthrough pressures for the rest of the two sand columns were measured at four and seven days after the foam is injected.
A falling-head test method was used to measure the hydraulic conductivity of the foam-filled sand columns after the foam breakthrough. The hydraulic conductivity of a clean sand column was measured before a foam was injected. The hydraulic conductivity of the foam-filled sand columns was measured on the first, fourth, and seventh day after the foam breakthrough.

4. Results and Analyses
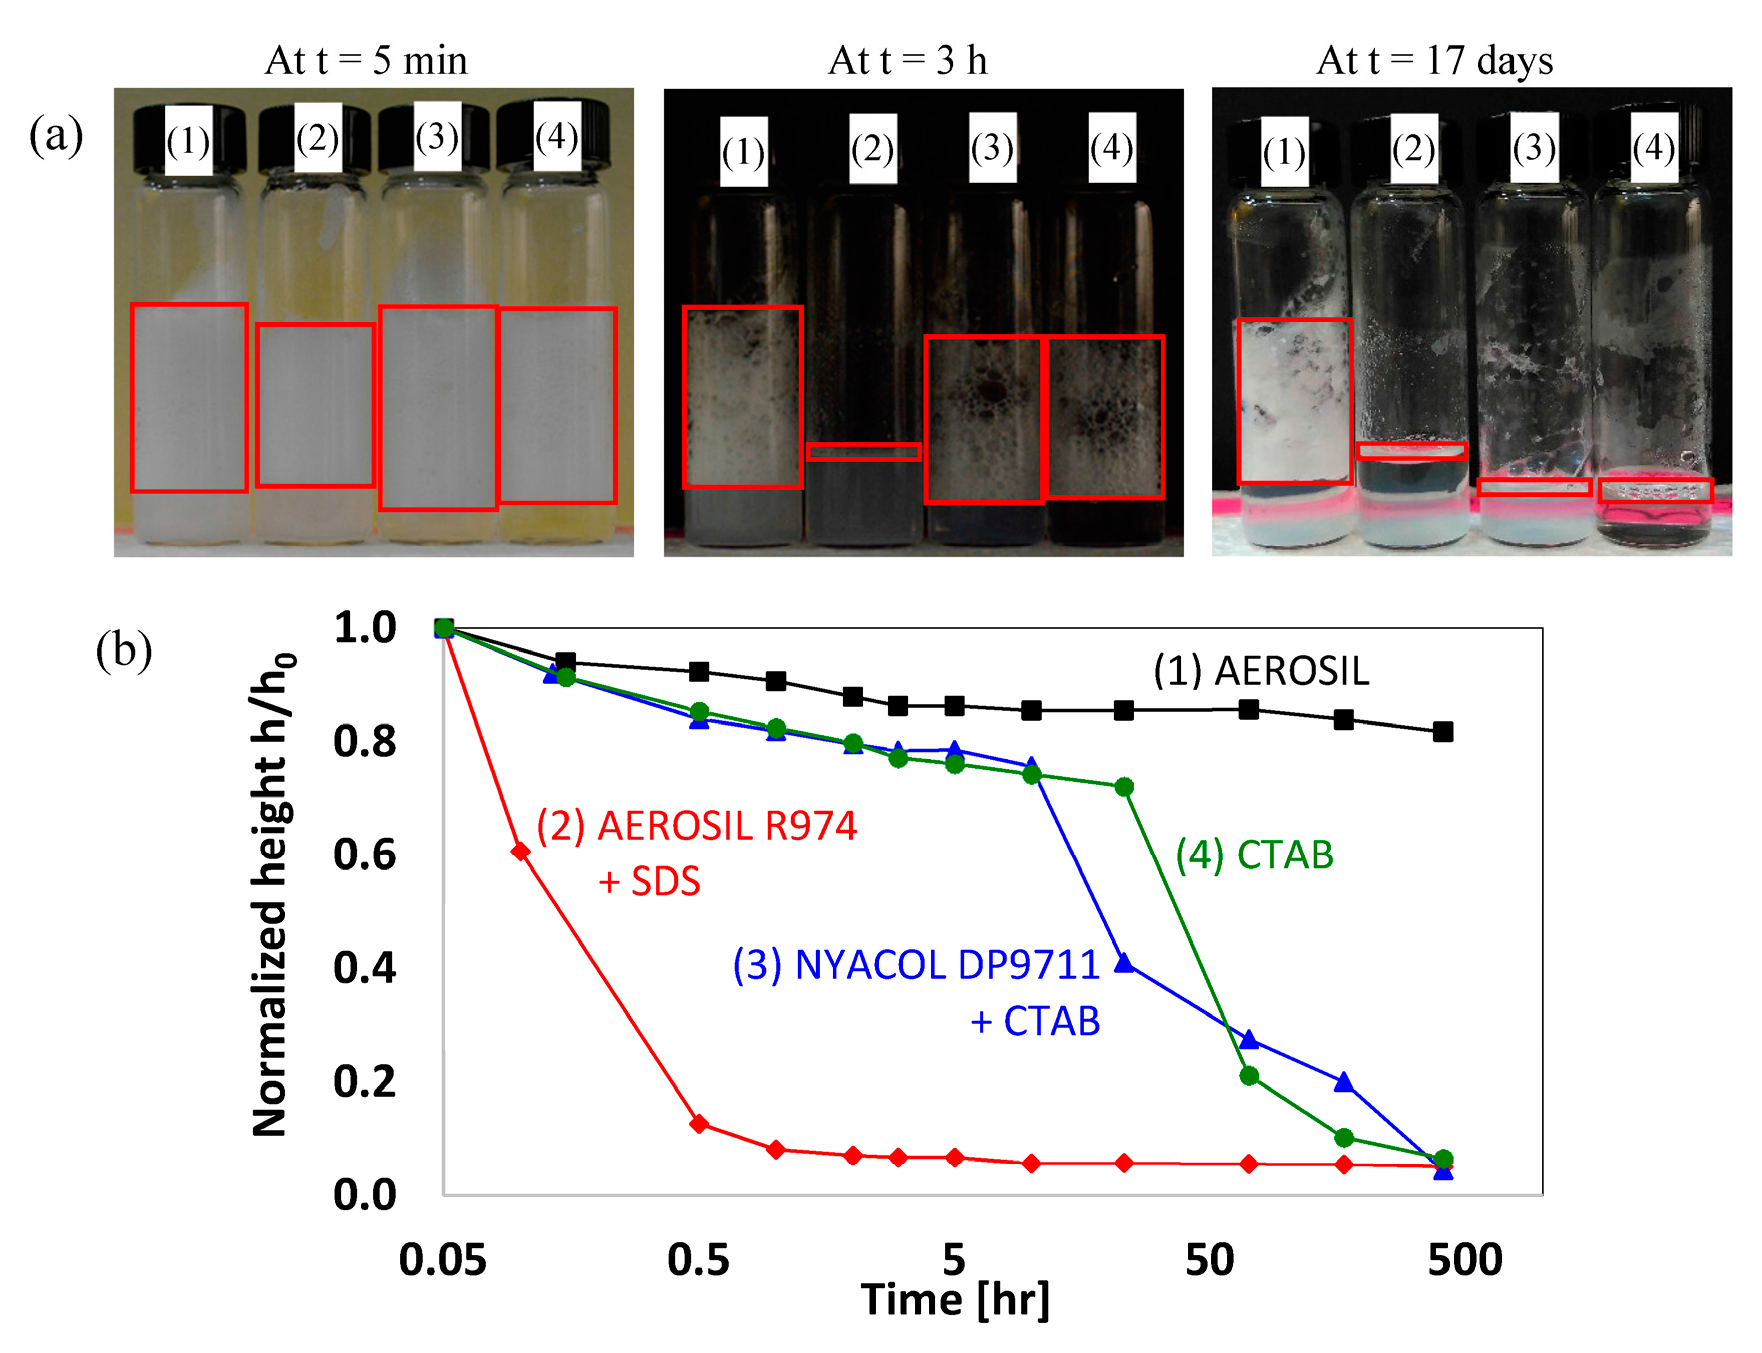
4.1. Foam Stability

Foam stability identified by the height of foams as a function of time was dependent on nanoparticle type and the presence of surfactants (Figure 3). The foam produced from the AEROSIL R974 solution had the highest stability among the four types of solutions. The height of the foam generated from the AEROSIL R974 solution was maintained over 80% of the original height even after 17 days. However, if the surfactant (0.1 wt % of SDS) was added to the AEROSIL R974 solution, the foam stability was dramatically reduced. The foam height of the solution dropped down to 10% of the initial height within 30 min. This may have been because the wettability of the nanoparticles in the AEROSIL R974 solution was modified to be strongly hydrophilic due to the SDS surfactant adsorption onto the nanoparticle surface [2,29]. Once the surface of nanoparticles became hydrophilic after the SDS surfactants were adsorbed on the nanoparticle surface, the foam stability decreased.
The stabilities of the foams made by CTAB solution and NYACOL DP9711 solution including CTAB were similar: they were destabilized dramatically at time = 10 h after the foam generation. The foam made from NYACOL DP9711 solution was destabilized quickly as soon as it was generated; the result is not included in Figure 3.

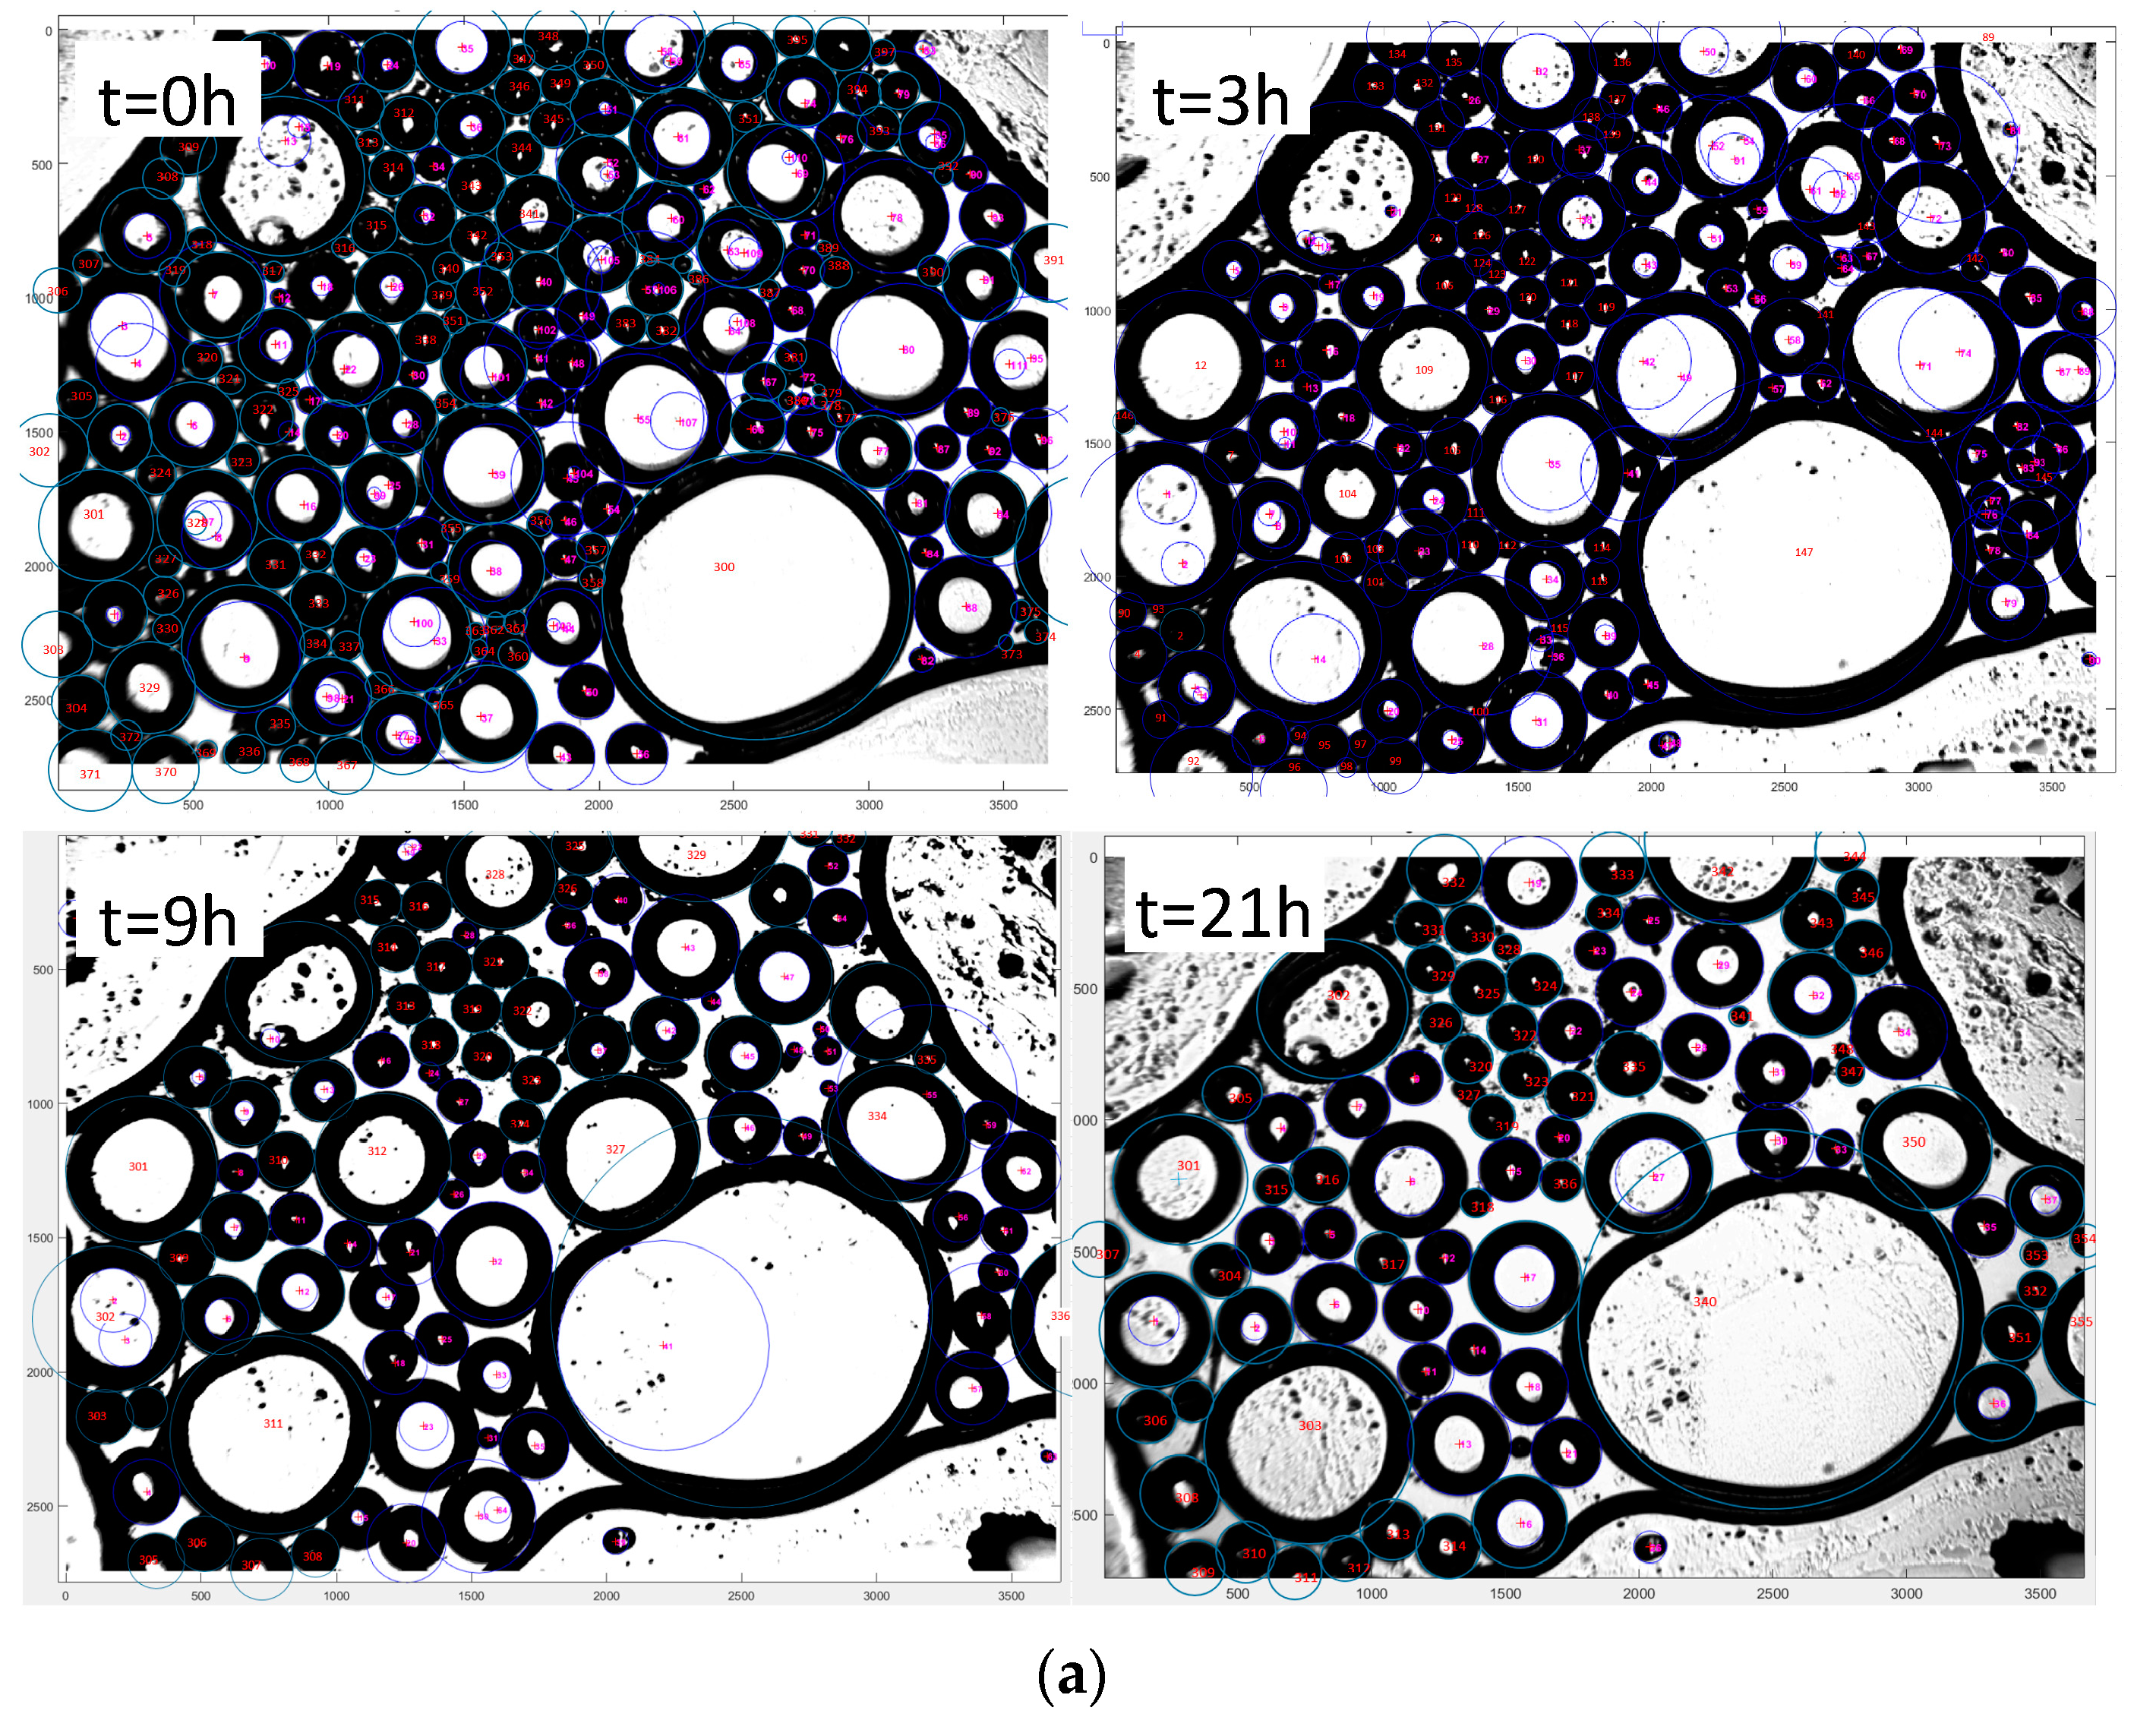
4.2. Bubble Size Distribution

A very small amount of the foam generated from AEROSIL R974 solution was introduced in between two microscope slides. The initial bubble size of the foam ranged from 25 μm to 350 μm. Figure 4a shows the air bubbles as a function of time after the foam was generated. The bubble size distribution is shown in Figure 4b. The measured viscosity of the foam as soon as it was generated is η = 11.7 cP. The distance between two slides was d = 200 μm. Therefore, for the bubble whose radius was less than 100 μm, the radius R was taken as measured Rm. For the bubble whose radius was larger than R = 100 μm (the bubble should be squeezed in between two microscope slides), a radius of the bubble in spherical shape was calculated [46]:
R = ( 3 4 π ( 2 π d ( R m d ) 2 + π 2 d 2 ( R m d ) + 4 3 π d 3 ) ) 1 / 3
As shown in Figure 4b, initially the most frequent radius of bubbles was 50 μm, and few bubbles larger than 300 μm were also observed. The total number of bubbles was N = 190 at the initial observation. At time = 3 h, the total number of bubbles decreased down to N = 144, and the most frequent radius increased to around R = 75 μm. The maximum radius was R = 340 μm. At the time of 9 h after the foam generation, the total number of bubbles was N = 95 and the most frequent radius increased up to R ~ 100 μm. The maximum radius increased to R = 370 μm. This phenomenon can be explained by bubble coalescence and the Ostwald ripening effect in which larger bubbles continue to grow at the expenses of smaller bubbles. Based on the analysis in Figure 4, the size of bubbles smaller than R = 100 μm decreased and some of the small bubbles disappeared, and bubbles bigger than R = 100 μm continued to grow in their sizes. Additionally, at time = 21 h, the total number of bubbles reduced by only three (N = 92), and the most frequent radius was maintained at R = 100 μm. The maximum bubble radius was R = 400 μm.
Here, two competing processes existed: the Ostwald ripening effect (originating from the mass transfer from small bubbles to large bubbles) and the existence of nanoparticles at the interface (impeding the mass transfer between the bubble and the surrounding fluid). In the literature, the existence of surfactants at the interface is shown to affect mass transfer rate through the interface [47,48]. Based upon the aforementioned observation, the reason why active Ostwald ripening process was observed for the first 9 h may be because initially there could be high solubility gradient from small bubbles to large bubbles and this could overcome the effect of nanoparticles on preventing mass transfer, but later once the small bubbles have disappeared, the nanoparticles at the interface can slow down the mass transfer due to the reduced solubility gradient. In addition, the bubble coalescence might contribute to the bubble size change [49].

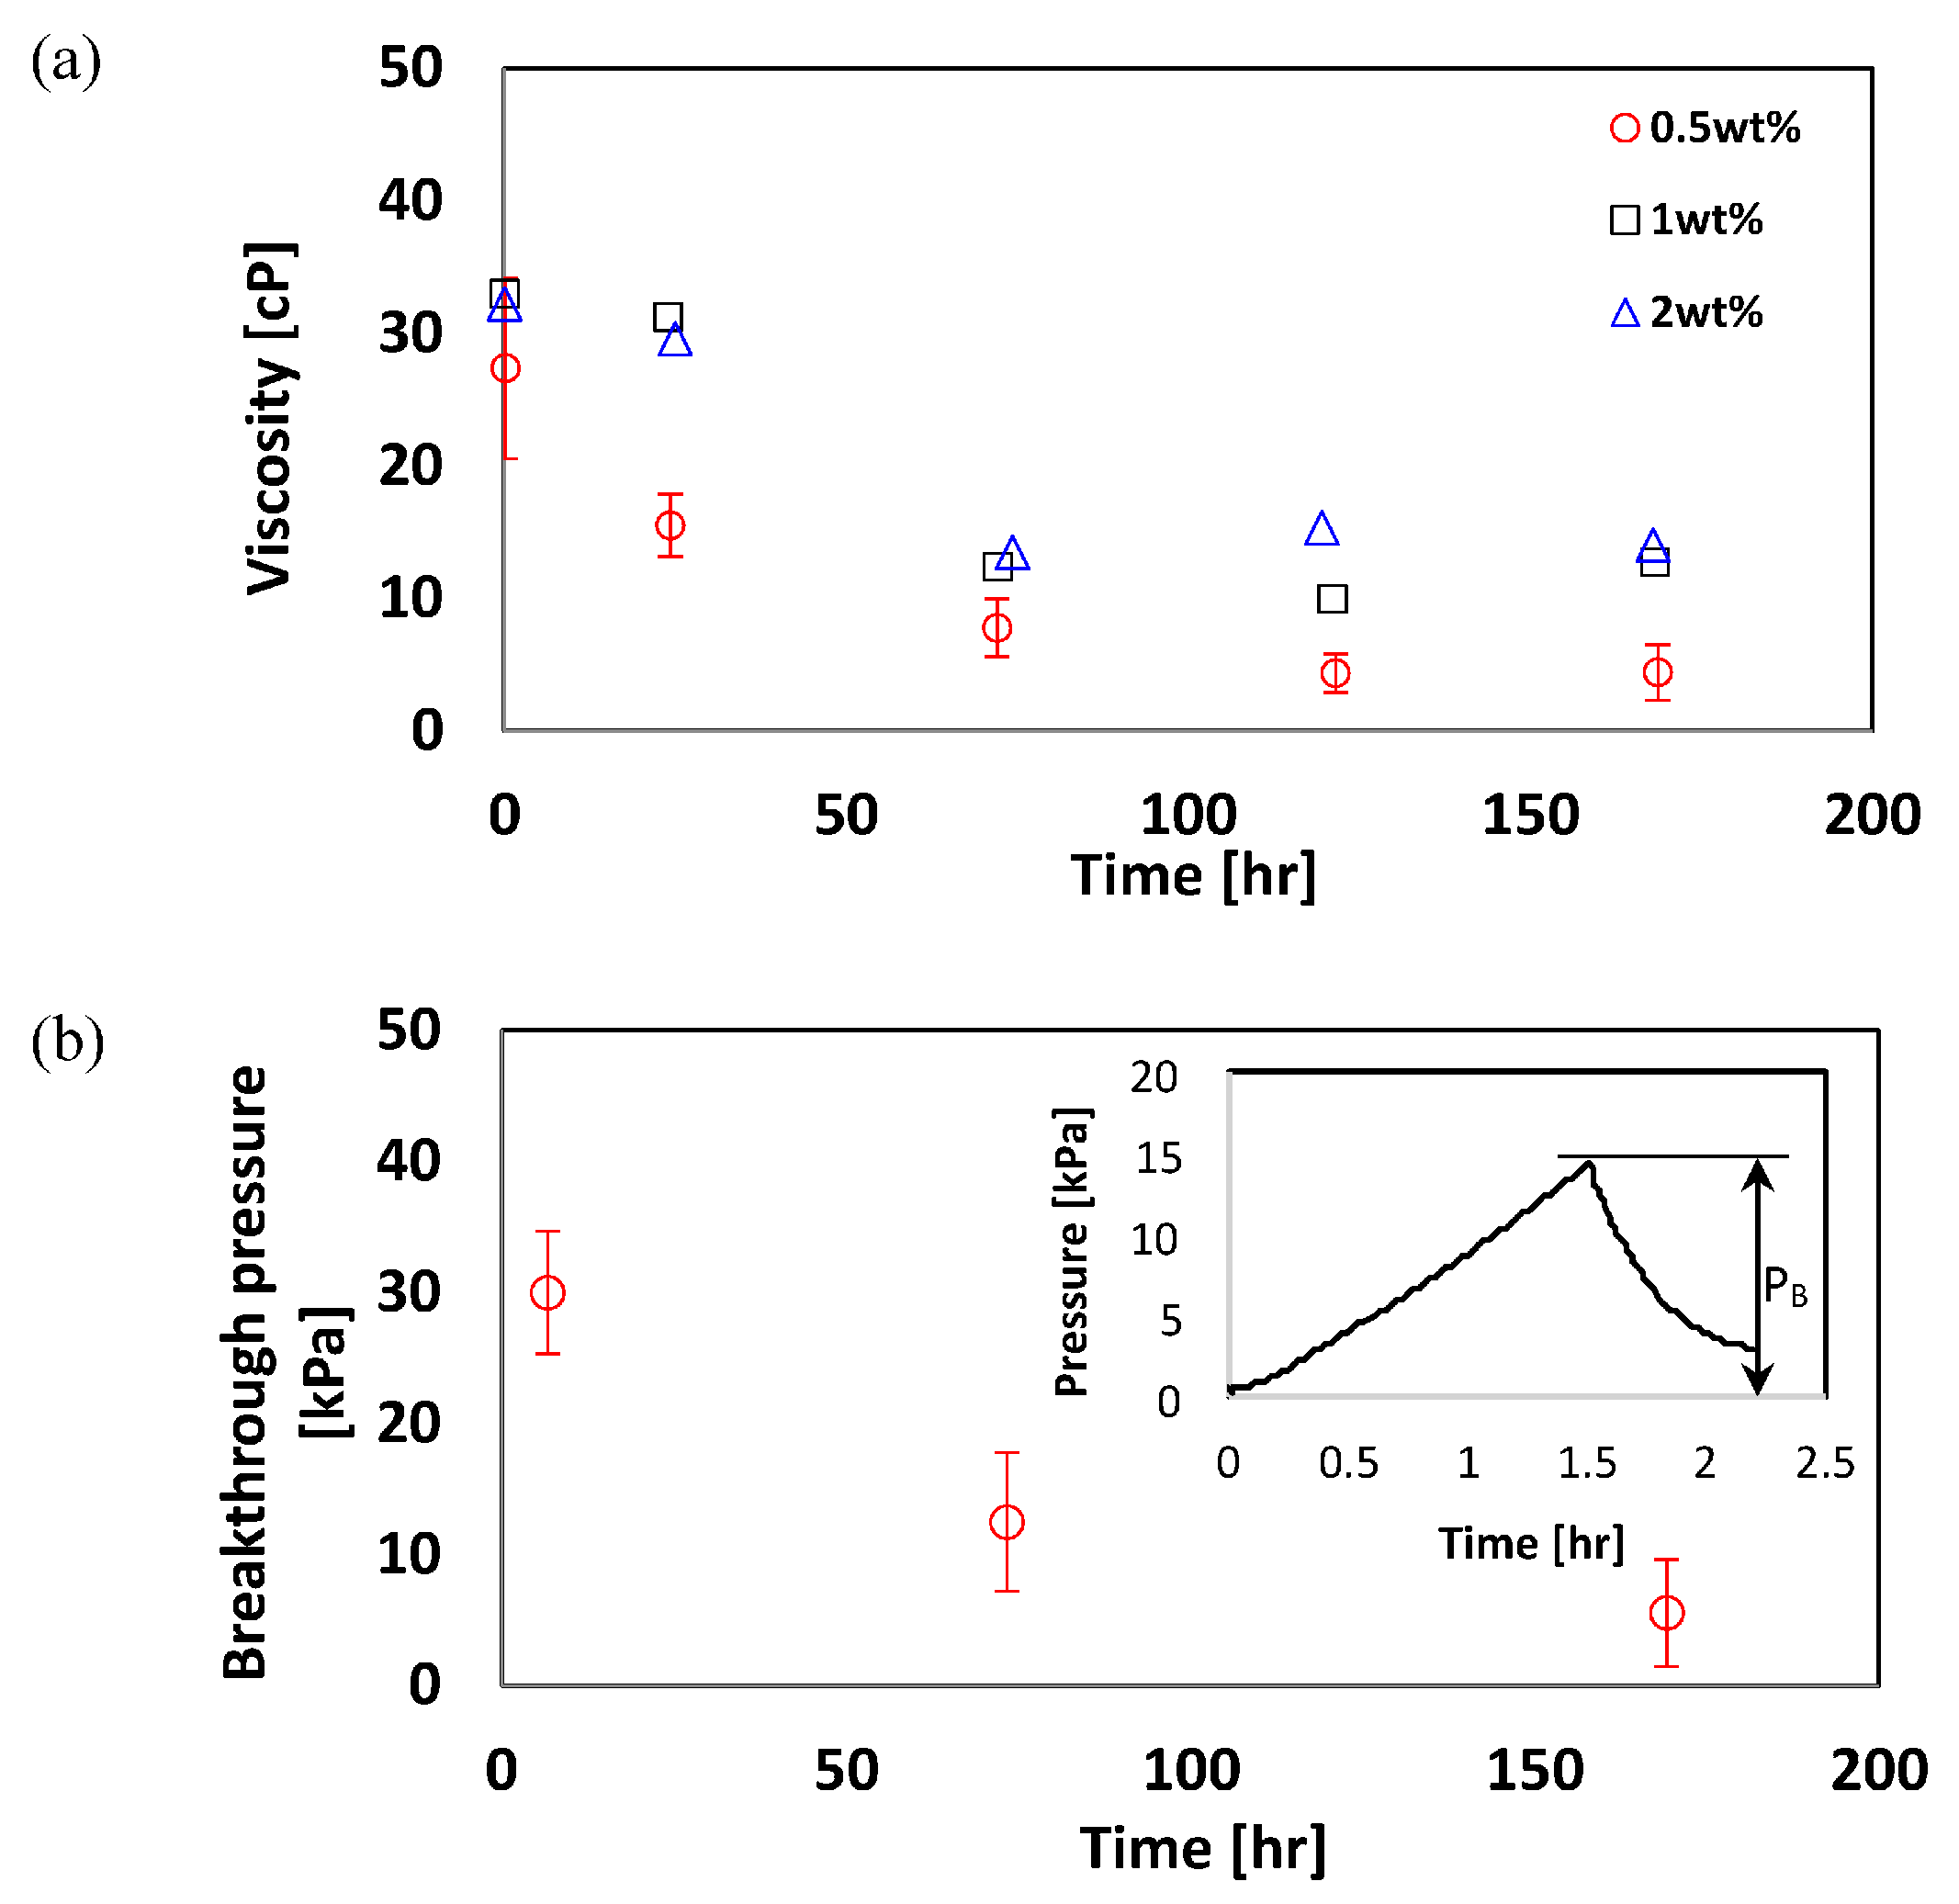
4.3. Effects of Time and Nanoparticle Concentration on Foam Viscosity

For the foam generated with the 0.5 wt % solution, the viscosity measurement was repeated five times at time = 0.2, 24, 72, 121, and 169 h after the foam generation, and only one viscosity measurement was conducted for the 1 wt % and 2 wt % solutions at the same time condition. As shown in Figure 2a, the viscosity of the foam decreased with increasing time. For the 0.5 wt % solution, the viscosity decreased from η = 27 cP to η = 7 cP during the initial 72 h, and thereafter it dropped very slowly down to η = 4.4 cP at t = 167 h. Note that the water viscosity was η = 0.89 cP at T = 297 K and atmospheric pressure condition [50].
The viscosities of the foams for the 1 wt % and 2 wt % solution were higher than the viscosity of the foam for the 0.5 wt % solution at a given time condition. However, the difference in viscosities between the 1 wt % and 2 wt % solutions was not clearly pronounced.
The inner diameter of the stainless steel tube that was used for viscosity measurement was 533 micron and the maximum bubble diameter of the foam shown in Figure 4a was 650 micron, therefore, a large bubble can plug fluid flow through the tube, which means that pressure drop along the tube was controlled by the friction between the large bubble and the tube wall. The effect of bubble size, liquid fraction, and fluid velocity on the friction has been explored by Cantat [51].

4.4. Breakthrough Pressure in a Microfluidic Chip

The breakthrough pressure for the foams generated from the 0.5 wt % AEROSIL R974 solution decreased with time. The breakthrough pressure was PB ~ 30 kPa initially, then decreased to PB ~ 14 kPa after three days, and PB ~ 8 kPa after seven days. The reduction in the viscosity and breakthrough pressure was a result of the foam degradation as a function of time. The viscosities of all foams decreased with time. The decreasing rate during the initial 72 h was relatively high, and then the viscosities were maintained almost constantly until 168 h. This trend was also captured by the breakthrough pressure measurement.

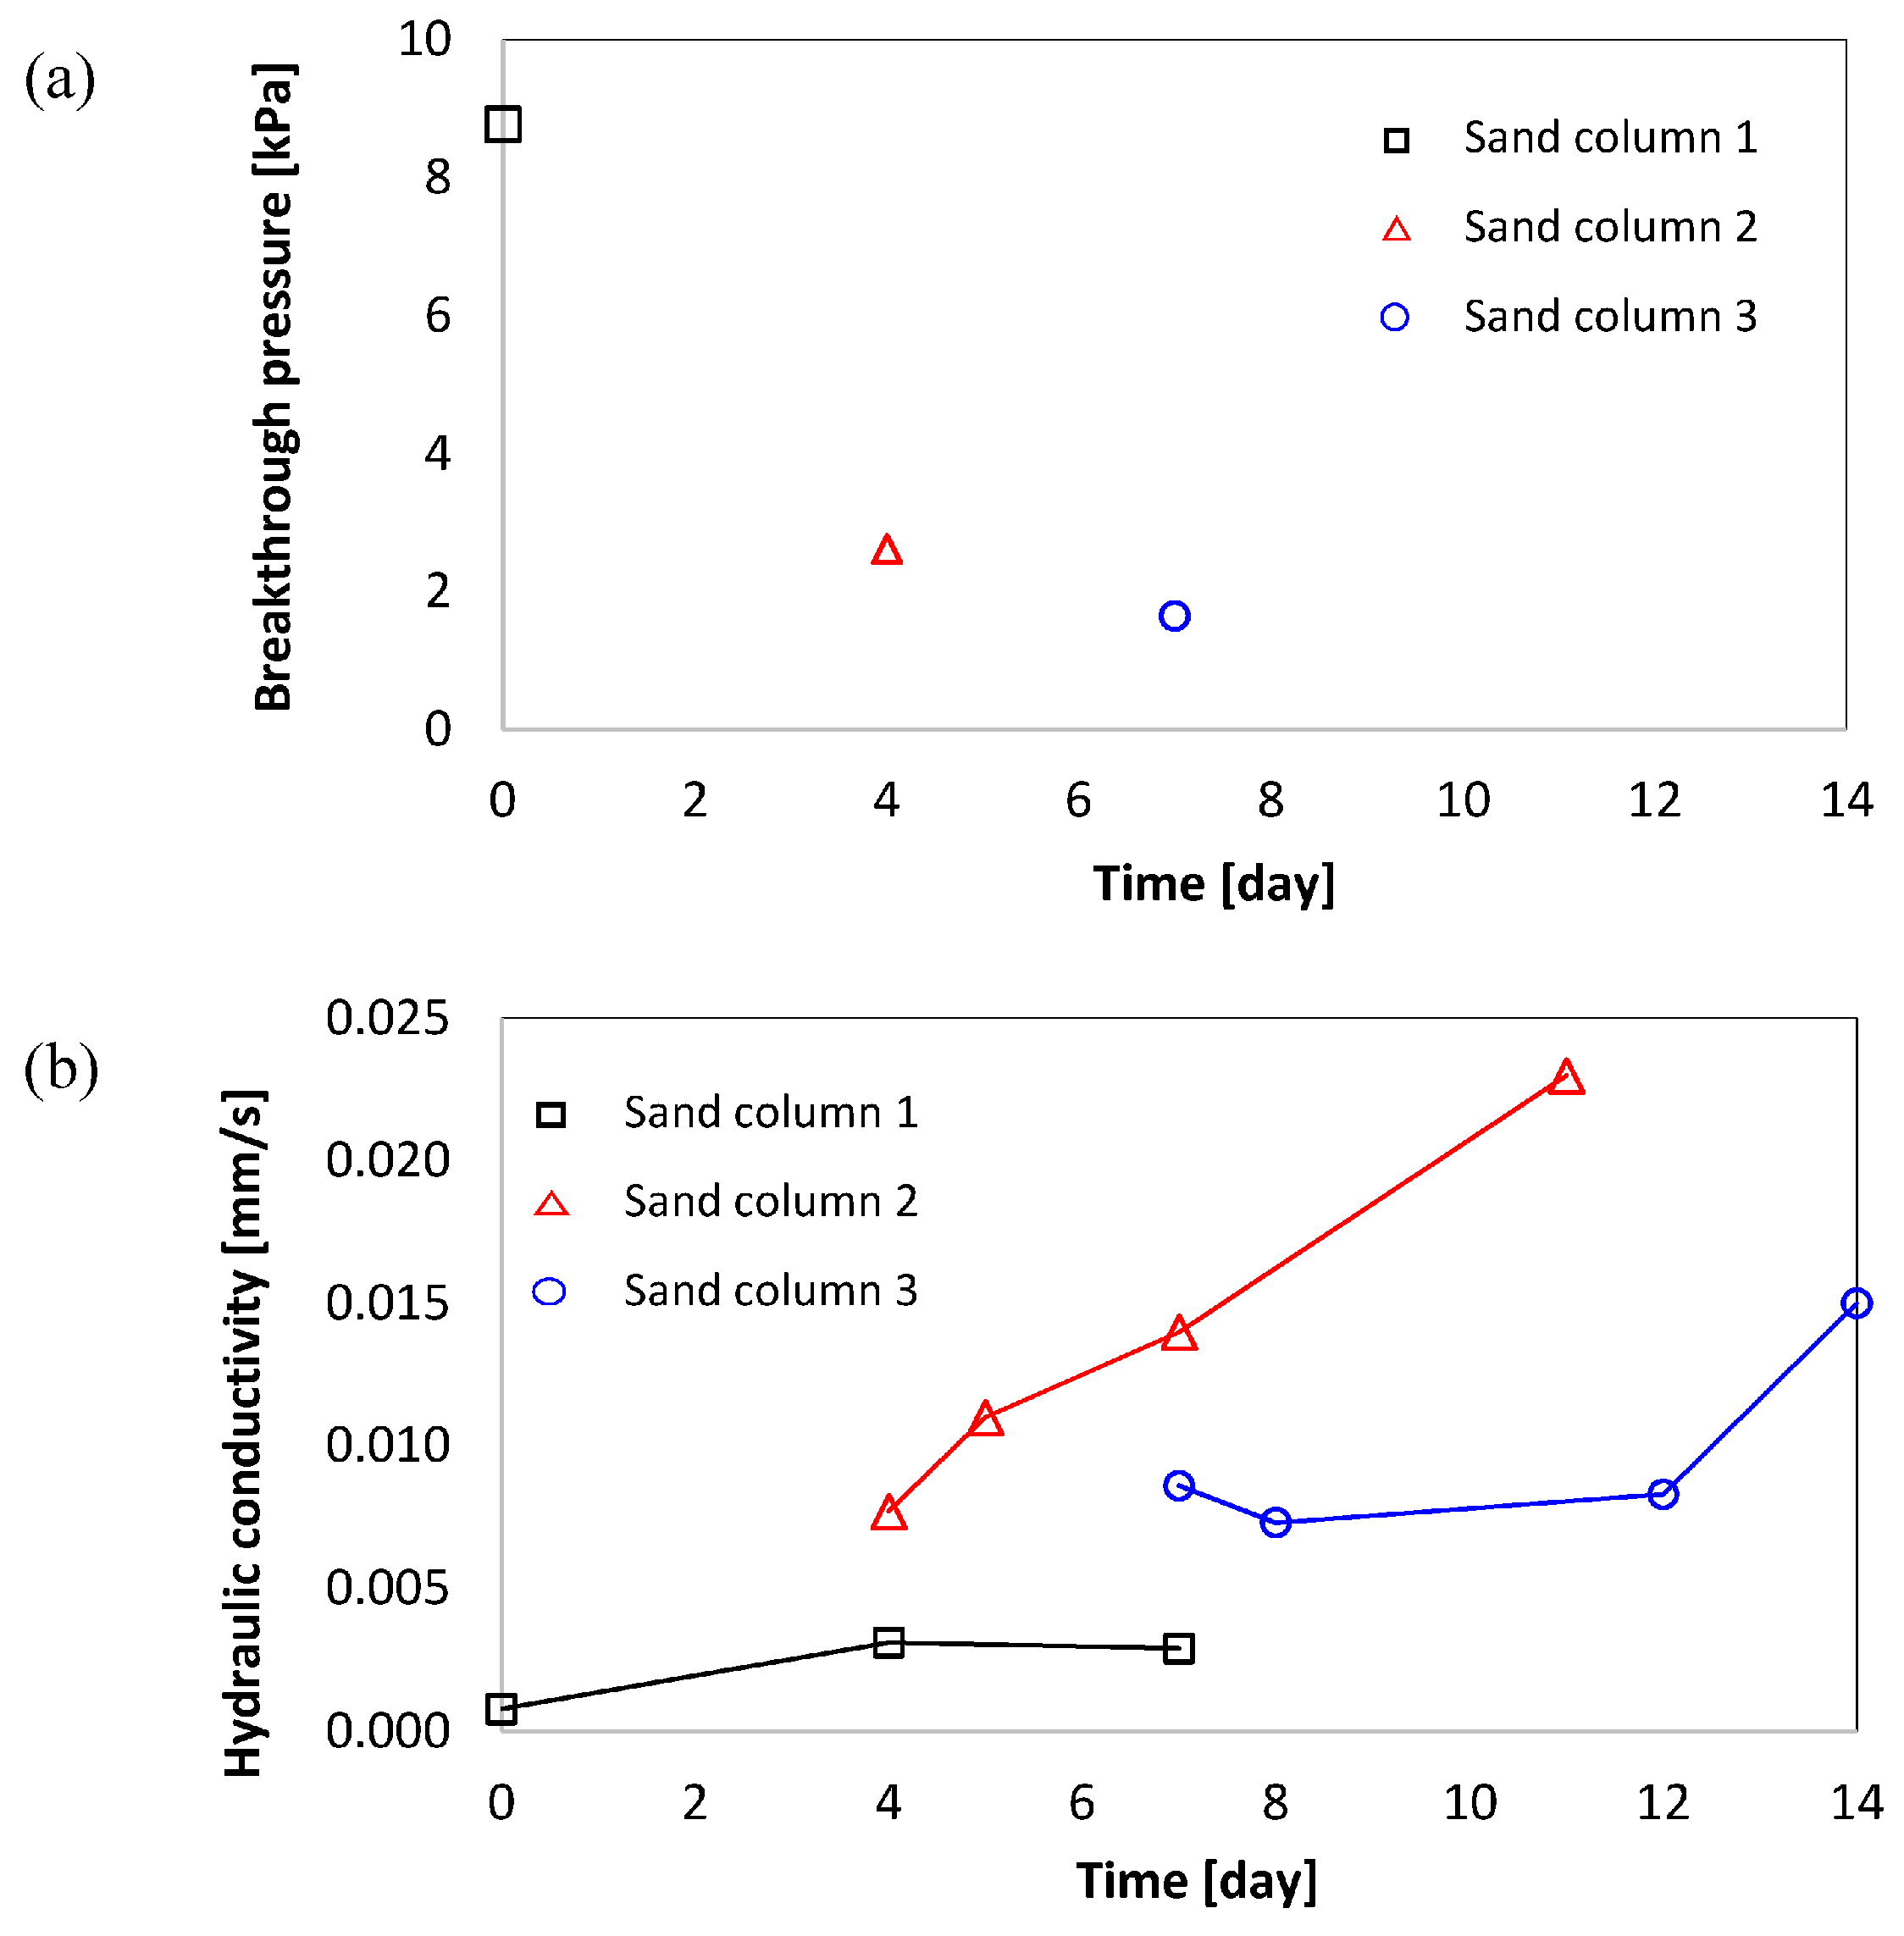
4.5. Breakthrough Pressure and Hydraulic Conductivity of Foam-Filled Sand Columns

Three sand columns with the same porosity n = 0.36 were used for this test. The hydraulic conductivity of water-saturated sand column was k ~ 0.46 mm/s. The foam generated from the 0.5 wt % AEROSIL R974 solution was injected into each sand column. The breakthrough pressure was measured at time = 0, 4, and 7 days after the foam injection. Thereafter, the hydraulic conductivity was measured at time = 0, 4, and 7 days after the breakthrough.
Figure 5 shows the breakthrough pressure and the hydraulic conductivity evolution after breakthrough. The breakthrough pressure decreased with increasing time, which was also shown in the microfluidic chip test. The breakthrough pressure dropped quickly during the first four days and then decreased slowly. Actual values of the breakthrough pressure of sand columns were smaller than those of the microfluidic chip. This was because (1) the size of pore throats was smaller for the microfluidic chip than the sand column (a small pore throat limits the mobility of gas bubble; higher pressure is required for gas bubble to pass through a smaller pore throat); and (2) a three-dimensional sand column may have a heterogeneous pore size distribution so that the water may have had a better chance to find the drainage path at lower water pressure.
The hydraulic conductivity was measured at time = 0, 4, and 7 days after the water. The hydraulic conductivity of the foam-filled sand column was almost two orders of magnitude lower than that of the water-saturated sand column even after the water breakthrough. Due to this reduced hydraulic conductivity even after the water breakthrough, the stabilized foam could be used to control hydraulic conductivity for a temporary method.

5. Conclusions

Nanoparticle-stabilized air-water foams were generated from several nanoparticle and surfactant solutions by mixing method. The properties of foam and foam-filled microfluidic chips and sand columns were investigated.
The foam generated from AEROSIL R974 solution shows high stability: the normalized height of the foam was maintained at over 80% of the initial height even after 17 days. Bubble coalescence and the Ostwald ripening effect might contribute to the change in the bubble size distribution in the foam. The viscosity of the foam was η = 25 cP initially and decreased down to η = 4.4 cP after one week. The foam generated with higher nanoparticle concentration solution showed higher viscosities, but there was no apparent difference between the 1 wt % and 2 wt % solutions.
Breakthrough pressures for the microfluidic chip and sand column decreased with the time since the foam was injected. Additionally, the hydraulic conductivity of the foam-filled sand columns right after the water breakthrough also increased with time, but the values of the foam-filled sand columns were almost two orders of magnitude lower than the hydraulic conductivity of the water-saturated sand column.
The results of this study show that there is a possibility of injecting nanoparticle-stabilized air-water foam into the ground to prevent contaminant transport along with groundwater flow, but further research considering different soil types, contaminant types, foam durability, and up-scaling techniques from lab to in-situ test is needed.

Acknowledgments

This study is funded by Jang’s start-up fund provided by Arizona State University. Jaewon Jang has not received any support to publish in open access.

Author Contributions

Jaewon Jang conceived and designed the experiments; Xianglei Zheng performed the experiments; Xianglei Zheng and Jaewon Jang analyzed the data; Xianglei Zheng and Jaewon Jang wrote the paper.

Conflicts of Interest

The authors declare no conflict of interest.

References

  1. Zhang, S.Y.; Sun, D.J.; Dong, X.Q.; Li, C.F.; Xu, J. Aqueous foams stabilized with particles and nonionic surfactants. Colloids Surf. A Physicochem. Eng. Asp. 2008, 324, 1–8. [Google Scholar] [CrossRef]
  2. Binks, B.P.; Horozov, T.S. Aqueous foams stabilized solely by silica nanoparticles. Angew. Chem. Int. Ed. 2005, 44, 3722–3725. [Google Scholar] [CrossRef] [PubMed]
  3. Alargova, R.G.; Warhadpande, D.S.; Paunov, V.N.; Velev, O.D. Foam superstabilization by polymer microrods. Langmuir 2004, 20, 10371–10374. [Google Scholar] [CrossRef] [PubMed]
  4. Engelhardt, K.; Rumpel, A.; Walter, J.; Dombrowski, J.; Kulozik, U.; Braunschweig, B.; Peukert, W. Protein Adsorption at the Electrified Air-Water Interface: Implications on Foam Stability. Langmuir 2012, 28, 7780–7787. [Google Scholar] [CrossRef] [PubMed]
  5. Espinoza, D.A.; Caldelas, F.M.; Johnston, K.P.; Bryant, S.L.; Huh, C. Nanoparticle-Stabilized Supercritical CO2 Foams for Potential Mobility Control Applications; Society of Petroleum Engineers: Dallas, TX, USA, 2010. [Google Scholar]
  6. Dickson, J.L.; Binks, B.P.; Johnston, K.P. Stabilization of carbon dioxide-in-water emulsions with silica nanoparticles. Langmuir 2004, 20, 7976–7983. [Google Scholar] [CrossRef] [PubMed]
  7. Melle, S.; Lask, M.; Fuller, G.G. Pickering emulsions with controllable stability. Langmuir 2005, 21, 2158–2162. [Google Scholar] [CrossRef] [PubMed]
  8. Rodriguez, E.; Roberts, M.R.; Yu, H.; Huh, C.; Bryant, S.L. Enhanced migration of surface-treated nanoparticles in sedimentary rocks. In Proceedings of the SPE Annual Technical Conference and Exhibition, New Orleans, LA, USA, 4–7 October 2009.
  9. Yu, H.; Yoon, K.Y.; Ingram, D.R.; Johnston, K.P.; Bryant, S.L.; Huh, C. Transport and retention of aqueous dispersions of paramagnetic nanoparticles in reservoir rocks. In Proceedings of the SPE Improved Oil Recovery Symposium, Tulsa, OK, USA, 24–28 April 2010.
  10. Prodanović, M.A.; Ryoo, S.; Rahmani, A.R.; Kuranov, R.; Kotsmar, C.; Milner, T.E.; Johnston, K.P.; Bryant, S.L.; Huh, C. Effects of magnetic field on the motion of multiphase fluids containing paramagnetic particles in porous media. In Proceedings of the SPE Improved Oil Recovery Symposium, Tulsa, OK, USA, 24–28 April 2010.
  11. Li, Y.Z.; DiCarlo, D.; Li, X.F.; Zang, J.L.; Li, Z.N. An experimental study on application of nanoparticles in unconventional gas reservoir CO2 fracturing. J. Pet. Sci. Eng. 2015, 133, 238–244. [Google Scholar] [CrossRef]
  12. Nguyen, P.; Fadaei, H.; Sinton, D. Pore-Scale Assessment of Nanoparticle-Stabilized CO2 Foam for Enhanced Oil Recovery. Energy Fuels 2014, 28, 6221–6227. [Google Scholar] [CrossRef]
  13. Yan, W.; Miller, C.A.; Hirasaki, G.J. Foam sweep in fractures for enhanced oil recovery. Colloids Surf. A Physicochem. Eng. Asp. 2006, 282, 348–359. [Google Scholar] [CrossRef]
  14. Mas-Hernandez, E.; Grassia, P.; Shokri, N. Foam improved oil recovery: Foam front displacement in the presence of slumping. Colloids Surf. A Physicochem. Eng. Asp. 2015, 473, 123–132. [Google Scholar] [CrossRef]
  15. Lee, S.; Lee, G.; Kam, S.I. Three-Phase Fractional Flow Analysis for Foam-Assisted Non-aqueous Phase Liquid (NAPL) Remediation. Transp. Porous Med. 2014, 101, 373–400. [Google Scholar] [CrossRef]
  16. Wang, X.W.; Chen, J.J.; Lv, C. Evaluation of foam surfactant for foam-flushing technique in remediation of DDT-contaminated soil using data envelopment analysis method. Environ. Sci. Pollut. Res. 2015, 22, 2994–3003. [Google Scholar] [CrossRef] [PubMed]
  17. Mulligan, C.N.; Wang, S.L. Remediation of a heavy metal-contaminated soil by a rhamnolipid foam. Eng. Geol. 2006, 85, 75–81. [Google Scholar] [CrossRef]
  18. Vitoonkijvanich, S.; AlSofi, A.M.; Blunt, M.J. Design of foam-assisted carbon dioxide storage in a North Sea aquifer using streamline-based simulation. Int. J. Greenh. Gas Control 2015, 33, 113–121. [Google Scholar] [CrossRef]
  19. Worthen, A.J.; Bagaria, H.G.; Chen, Y.S.; Bryant, S.L.; Huh, C.; Johnston, K.P. Nanoparticle-stabilized carbon dioxide-in-water foams with fine texture. J. Colloid Interface Sci. 2013, 391, 142–151. [Google Scholar] [CrossRef] [PubMed]
  20. Vinogradov, A.V.; Kuprin, D.S.; Abduragimov, I.M.; Kuprin, G.N.; Serebriyakov, E.; Vinogradov, V.V. Silica Foams for Fire Prevention and Firefighting. ACS Appl. Mater. Interfaces 2016, 8, 294–301. [Google Scholar] [CrossRef] [PubMed]
  21. Hirasaki, G.J.; Miller, C.A.; Meinardus, H.; Dwarakanath, V. Application of foam for aquifer remediation. Abstr. Pap. Am. Chem. Soc. 2003, 225, U685. [Google Scholar]
  22. Pickering, S.U. Emulsions. J. Chem. Soc. Trans. 1907, 91, 2001–2021. [Google Scholar] [CrossRef]
  23. Ramsden, W. Separation of solids in the surface-layers of solutions and ‘suspensions’ (Observation on surface-membraines, bubbles, emulsions, and mechanical coagulation)—Preliminary account. Proc. R. Soc. Lond. 1903, 72, 156–164. [Google Scholar] [CrossRef]
  24. Binks, B.P.; Horozov, T.S. Colloidal Particles at Liquid Interfaces; Cambridge University Press: Cambridge, UK, 2006. [Google Scholar]
  25. Adkins, S.S.; Gohil, D.; Dickson, J.L.; Webber, S.E.; Johnston, K.P. Water-in-carbon dioxide emulsions stabilized with hydrophobic silica particles. Phys. Chem. Chem. Phys. 2007, 9, 6333–6343. [Google Scholar] [CrossRef] [PubMed]
  26. Golomb, D.; Barry, E.; Ryan, D.; Swett, P.; Duan, H. Macroemulsions of Liquid and Supercritical CO2-in-Water and Water-in-Liquid CO2Stabilized by Fine Particles. Ind. Eng. Chem. Res. 2006, 45, 2728–2733. [Google Scholar] [CrossRef]
  27. Golomb, D.; Barry, E.; Ryan, D.; Lawton, C.; Swett, P. Limestone-Particle-Stabilized Macroemulsion of Liquid and Supercritical Carbon Dioxide in Water for Ocean Sequestration. Environ. Sci. Technol. 2004, 38, 4445–4450. [Google Scholar] [CrossRef] [PubMed]
  28. Worthen, A.J.; Bryant, S.L.; Huh, C.; Johnston, K.P. Carbon dioxide-in-water foams stabilized with nanoparticle and surfactant acting in synergy. AIChE J. 2013, 59, 3490–3501. [Google Scholar] [CrossRef]
  29. Binks, B.P.; Kirkland, M.; Rodrigues, J.A. Origin of stabilisation of aqueous foams in nanoparticle-surfactant mixtures. Soft Matter 2008, 4, 2373–2382. [Google Scholar] [CrossRef]
  30. Li, S.Y.; Li, Z.M.; Wang, P. Experimental Study of the Stabilization of CO2 Foam by Sodium Dodecyl Sulfate and Hydrophobic Nanoparticles. Ind. Eng. Chem. Res. 2016, 55, 1243–1253. [Google Scholar] [CrossRef]
  31. Dong, X.Q.; Xu, J.A.; Cao, C.B.; Sun, D.J.; Jiang, X.R. Aqueous foam stabilized by hydrophobically modified silica particles and liquid paraffin droplets. Colloids Surf. A Physicochem. Eng. Asp. 2010, 353, 181–188. [Google Scholar] [CrossRef]
  32. Subramaniam, A.B.; Mejean, C.; Abkarian, M.; Stone, H.A. Microstructure, morphology, and lifetime of armored bubbles exposed to surfactants. Langmuir 2006, 22, 5986–5990. [Google Scholar] [CrossRef] [PubMed]
  33. Pal, R. Effect of droplet size on the rheology of emulsions. AIChE J. 1996, 42, 3181–3190. [Google Scholar] [CrossRef]
  34. Kim, J.U.; Park, B.H.; Lee, M.H. Critical parameters to determine mean bubble size of generated foams from a foam generator. J. Appl. Polym. Sci. 2013, 130, 2062–2067. [Google Scholar] [CrossRef]
  35. Schramm, L.L.; Wassmuth, F. Foams: Basic Principles, in Foams: Fundamentals and Applications in the Petroleum Industry; American Chemical Society: Washington, DC, USA, 1994; pp. 3–45. [Google Scholar]
  36. Kim, I.; Worthen, A.J.; Johnston, K.P.; DiCarlo, D.A.; Huh, C. Size-dependent properties of silica nanoparticles for Pickering stabilization of emulsions and foams. J. Nanopart. Res. 2016, 18. [Google Scholar] [CrossRef]
  37. Gao, W.C.; Zhang, Y.X.; Zhang, X.Y.; Duan, Z.L.; Wang, Y.H.; Qin, C.; Hu, X.; Wang, H.; Chang, S. Permeable reactive barrier of coarse sand-supported zero valent iron for the removal of 2,4-dichlorophenol in groundwater. Environ. Sci. Pollut. Res. 2015, 22, 16889–16896. [Google Scholar] [CrossRef] [PubMed]
  38. Thiruverikatachari, R.; Vigneswaran, S.; Naidu, R. Permeable reactive barrier for groundwater remediation. J. Ind. Eng. Chem. 2008, 14, 145–156. [Google Scholar] [CrossRef]
  39. Stevenson, P. (Ed.) Foam Engineering Fundamentals and Applications; Wiley: Chichester, UK, 2012; p. 548.
  40. Adkins, S.S.; Chen, X.; Chan, I.; Torino, E.; Nguyen, Q.P.; Sanders, A.W.; Johnston, K.P. Morphology and stability of CO2-in-water foams with nonionic hydrocarbon surfactants. Langmuir 2010, 26, 5335–5348. [Google Scholar] [CrossRef] [PubMed]
  41. Wang, H.; Chen, J.J. A study on the permeability and flow behavior of surfactant foam in unconsolidated media. Environ. Earth Sci. 2013, 68, 567–576. [Google Scholar] [CrossRef]
  42. Degussa. The Use of Hydrophobic AEROSIL in the Coatings Industry. In Basic Characteristics and Applications of AEROSIL; Ferch, H., Ed.; Degussa AG: Darmstadt, Germany, 1993. [Google Scholar]
  43. Xue, Z.; Worthen, A.; Qajar, A.; Robert, I.; Bryant, S.L.; Huh, C.; Prodanovic, M.; Johnston, K.P. Viscosity and stability of ultra-high internal phase CO2-in-water foams stabilized with surfactants and nanoparticles with or without polyelectrolytes. J. Colloid Interface Sci. 2016, 461, 383–395. [Google Scholar] [CrossRef] [PubMed]
  44. Yu, J.J.; Khalil, M.; Liu, N.; Lee, R. Effect of particle hydrophobicity on CO2 foam generation and foam flow behavior in porous media. Fuel 2014, 126, 104–108. [Google Scholar] [CrossRef]
  45. Géraud, B.; Jones, S.A.; Cantat, I.; Dollet, B.; Méheust, Y. The flow of a foam in a two-dimensional porous medium. Water Resour. Res. 2016, 52, 773–790. [Google Scholar] [CrossRef] [Green Version]
  46. Gaillard, T.; Honorez, C.; Jumeau, M.; Elias, F.; Drenckhan, W. A simple technique for the automation of bubble size measurements. Colloids Surf. A Physicochem. Eng. Asp. 2015, 473, 68–74. [Google Scholar] [CrossRef]
  47. Tcholakova, S.; Mitrinova, Z.; Golemanov, K.; Denkov, N.D.; Vethamuthu, M.; Ananthapadmanabhan, K.P. Control of Ostwald ripening by using surfactants with high surface modulus. Langmuir 2011, 27, 14807–14819. [Google Scholar] [CrossRef] [PubMed]
  48. Weiss, J.; Canceliere, C.; McClements, D.J. Mass transport phenomena inoil-in-water emulsions containing surfactant micelles: Ostwald ripening. Langmuir 2000, 16, 6833–6838. [Google Scholar] [CrossRef]
  49. Guo, F.; Aryana, S. An experimental investigation of nanoparticle-stabilized CO2 foam used in enhanced oil recovery. Fuel 2016, 186, 430–442. [Google Scholar] [CrossRef]
  50. Street, R.L.; Watters, G.Z.; Vennard, J.K. Elementary Fluid Mechanics, 7th ed.; John Wiley&Sons: Etobicoke, ON, Canada, 1996. [Google Scholar]
  51. Cantat, I. Liquid meniscus friction on a wet plate: Bubbles, lamellae, and foams. Phys. Fluids 2013, 25, 031303. [Google Scholar] [CrossRef] [Green Version]
Figure 1. Experimental configuration. (a) Foam viscosity measurement. The inner diameter of the stainless steel tube is 0.533 mm; (b) Breakthrough pressure measurement in the microfluidic chip and sand pack. The overall dimension of a microfluidic chip is 21.3 mm × 12.7 mm, and the thickness of channels (pore depth) is 50 μm. The hydraulic conductivity of the microfluidic chip is ~0.01 mm/s.
Sustainability 08 01317 g001
Figure 2. Foam viscosity and breakthrough pressure of foam-fill microfluidic chips as a function of time. (a) Viscosity of foams generated from 0.5 wt %, 1 wt %, and 2 wt % AEROSIL R974 solution; (b) Breakthrough pressure (PB) measured in the microfluidic chip. Inset figure shows one breakthrough pressure test result (water was injected into the microfluidic chip at a constant rate of 4 μL/min).
Sustainability 08 01317 g002
Figure 3. Stability of foams generated from different solutions. (a) The height of foam contained in glass bottles. The solutions used for foam generation are (1) AEROSIL R974; (2) AEROSIL R974 with SDS; (3) NYACOL DP9711 with CTAB; and (4) CTAB solution. Pictures of foams taken at 5 min (left); 3 h (center); and 17days (right) after foam generation; (b) Foam height h normalized by the initial foam height h0 as a function of time.
Sustainability 08 01317 g003
Figure 4. Observation of air bubbles in between two microscope slides. (a) Pictures of air bubbles at 0 h, 3 h, 9 h, and 21 h after foam generation; (b) Bubble size distribution at time = 0 h, 3 h, 9 h, and 21 h after foam generation. Note that the distance between two microscope slides was 200 μm, the viscosity of the foam was η = 11.7 cP.
Sustainability 08 01317 g004aSustainability 08 01317 g004b
Figure 5. Breakthrough pressure and hydraulic conductivity of sand filled with foam (foam saturation ~ 92%). (a) Breakthrough pressure; (b) Hydraulic conductivity after breakthrough. Note: the hydraulic conductivities of the clean sands were 0.22 mm/s (square), 0.73 mm/s (triangle), and 0.43 mm/s (circle). The porosity of the sand pack was 36%.
Sustainability 08 01317 g005
Table 1. Nanofluids for generating air foam.
Nanofluid
AEROSIL R974 (1 wt % and 0.5%) + ethanol (2 wt %)
SDS (0.1 wt %) + AEROSIL R974 (1 wt %) + ethanol (2 wt %)
CTAB (0.1 wt %)
CTAB (0.1 wt %) + NYACOL DP9711 (1 wt %)
Note: The 2 wt % ethanol was utilized to wet the hydrophobic nanoparticles. The final concentration was less than 0.5% by heating the solution at 80 °C. SDS: sodium dodecyl sulfate. CTAB: Hexadecyltrimethylammonium bromide.

