1. Introduction
Climate change is now widely recognised as the major environmental problem facing the globe [
1]. The Intergovernmental Panel on Climate Change (IPCC) [
2] has reported that most of the observed warming is likely due to the increase in concentration of greenhouse gas (GHG) emissions in the atmosphere, with this conclusion having been widely accepted. Almost all human activities are involved in the emission of greenhouse gases, directly or indirectly, through combustion of fossil fuels or the disruption or removal of carbon sinks such as forests, leading to the observed increase in the GHG concentration in the atmosphere [
3]. The tourism industry is a significant source of these emissions with its contribution expected to grow considerably in the future as the sector expands. Currently, the tourism industry accounts for more than 30% of global exports of services, 6% of total exports and 9% of global GDP [
4].
Many of the activities undertaken by the tourism sector are energy-intensive, including transport, delivering amenities and providing accommodation and other facilities for tourist needs. In many cases, this means that such tourist destinations might have greater emissions compared to other similar-sized, non-tourism-based communities [
5]. Tourism also drives the construction of new infrastructure and buildings, such as hotels, further adding to the emissions intensity of the sector. Most destinations also use considerable amounts of energy for importing food and other material goods and for disposing of waste [
6,
7]. Aviation has also been shown to contribute significantly to overall emissions from the sector (e.g., [
5,
7,
8,
9,
10,
11,
12]) and is often the major source of tourism-related energy use [
5]. This is particularly apparent for those destinations that are isolated or island-based, where tourists overwhelmingly arrive by air [
5,
8]. For example, in the Caribbean islands, Gössling [
13] reported that the share of emissions related to air travel was between 44% and 71% of total emissions across the region. Still, despite the increased attention being paid to tourism-induced aviation and the need to mitigate GHG emissions, significant gaps in the research exist [
14]. The issue is further complicated by the fact that aviation emissions are accounted for differently across the literature with no agreement on how to best deal with them [
12]. In spite of this, there is widespread consensus that this source of emissions should be included in national accounting frameworks to enable better understanding and encourage mitigation policies [
12].
On a global scale, the UN World Tourism Organisation (UNWTO) reported that in 2005 tourism contributed approximately 5% of CO
2 emissions worldwide. These emissions were predominantly from the transport sector, which generated 75% of the total emissions for the tourism industry [
15]. Projected forward under businessasusual scenarios, it was estimated that the growth of the sector could result in an increase in CO
2 emissions of 152% by 2035, even when improvements in efficiency are accounted for [
15]. Consequently, many studies have been undertaken to give some idea of the scale of impact that tourism has on emissions. Dwyer et al. [
5] found that in Australia, the tourism sector contributes between 3.9% and 5.3% of total industry GHG emissions in Australia, making it the fifth highest emissions sector in the nation. A similar result was found for Switzerland [
16], with the study finding that the tourism sector was four times more GHG intensive than the Swiss economy on average, accounting for 5.2% of total national emissions. In a summary of national tourism sector emissions based on 27 studies across 22 countries [
13], tourism was found to be equivalent to between 4% and 150% of total national emissions, with the highest emissions observed in small island developing states such as Turks and Caicos. However, Gössling [
13] further concluded that even in developed economies where tourism is not the dominant economic sector, the results confirm the high energy intensity of the industry in general. Analysis by Scott et al. [
17] shows that if the current high-growth trends in emissions continue, tourism is likely to become a major source of GHGs for the globe.
Alongside the contributions tourism makes to global emissions, various studies have looked at the possible consequences of continued climate change on the tourism industry (e.g., [
5,
9,
14]). Tourism around the world is likely to be affected both directly and indirectly from shifts in the global climate in many different ways. For example, climate change has the capacity to significantly alter the appeal of certain tourism destination through affecting the climate directly, increasing adverse weather events or altering the natural environment [
15]. Flow-on effects from emissions mitigation policies, changing social conditions and economic issues are also predicted to indirectly impact the sector [
15]. A study by UNWTO [
18] identified climate change vulnerability hotspots for the sector globally, summarising the anticipated direct and indirect impacts on different regions. For example, the report suggested that islands in the Caribbean are likely to be subjected to direct impacts from increased extreme weather events, sea level rise and water scarcity with indirect effects also felt from political destabilisation and increased travel costs. In some countries, such impacts are already being felt, with Tobago amongst numerous countries reporting regular water shortages for accommodation providers and tour operators due to increasing droughts and more extreme summer temperatures [
18]. The report by UNWTO [
18] predicted similar impacts for the Mediterranean, which is likely to experience issues including water scarcity, biodiversity loss and increased disease outbreaks. Such studies have all increased awareness of the impacts of tourism-related energy consumption and emissions around the world and the ways in which climate change may impact destinations [
5]. This has led to an increased demand to quantify the impact of such energy-related activities and develop appropriate, effective management strategies [
5].
However, despite many experts highlighting the increasing importance of understanding the role of tourism in emissions, much of the current analysis and policy responses continue to ignore the sector [
9,
13,
19]. As the impacts of climate change and the characteristics of the tourism sector differ substantially between destinations, effective tourism-specific mitigation policies cannot be designed without thorough assessment of national tourism sectors [
13,
20], of which comprehensive studies and assessments are lacking [
20]. In addition, because tourism is often not seen as a true economic sector in its own right, it is often excluded from the System of National Accounts, meaning countries most often do not have comprehensive statistics relating to its energy consumption or emissions [
5]. This is particularly problematic when it comes to capturing the significant emissions from international air travel due to the difficulty in properly allocating these emissions [
21]. At present, international aviation is excluded from Kyoto reporting requirements, which only covers domestic transport [
22]. That the field of environmental assessments of tourism is still in the early stages of development is widely acknowledged in the literature (e.g., [
9,
20,
23,
24]), particularly in relation to climate change, where accurate quantification of emissions is critical [
8]. The result of this is a limited understanding of the role of tourism in global emissions and climate change, preventing the design and adoption of effective mitigation approaches [
19].
Within the existing literature on this topic, there has been a wide range of approaches adopted for assessment of the sector. A review by Filimonau et al. [
19] found that many studies focussed solely on identifying environmental impacts related to tourism with no analysis of the consequences, with others examining perceptions or attitudes towards the sector’s impact held by tourists or tourism-related businesses. Of those that have attempted to quantify the carbon impact of tourism for specific destinations, both bottom-up and top-down methodologies have been used including GHG conversion factors, environmental impact assessments and ecological footprint analyses often using Tourism Satellite Accounts [
13]. Examples of these studies include an assessment by Patterson and McDonald [
9], which quantified all environmental impacts arising from tourist activities in New Zealand, with the energy use of tourism in that country also examined by Becken et al. [
25]. To date, there have been five emissions-related assessments for the country, each adopting different emissions allocations scenarios [
13]. The GHG emissions related to tourism energy use in Whistler, Canada were also quantified using a bottom-up approach [
26]; however, induced effects were excluded. Another study [
27] assessed the waste and GHG emissions due to tourism in Wales and a recent study in 2010 aimed to quantify the GHG impacts from tourism solely in Australia [
5]. This study used both a “production” and “expenditure” (or consumer) approach based on the national Tourism Satellite Account to calculate the emissions for the year 2003/2004. Gössling [
28] investigated the use of the ecological footprinting technique in assessing environmental impacts of tourism on the Seychelles; however, quantifying GHG emissions was not the primary focus. In Iceland, Björnsson [
29] studied the carbon emissions generated by foreign tourists with a bottom-up approach using three representative tourist types. However, this analysis was limited to the direct emissions stemming from only three tourism-related sectors—transport, accommodation and activities. In a summary article, Gössling [
13] identified 27 emissions-related studies in the literature covering 22 national tourism sectors.
While acknowledging these and other existing important contributions to the academic literature, it has been suggested that additional comprehensive studies are needed that account for the full scope of emissions related to tourism including both the direct and indirect impacts [
13,
20]. While some studies have included an analysis of both of these impacts (e.g., [
5,
11,
12,
27]), many assessments have adopted limited system boundaries (e.g., [
7,
16,
27]) that exclude indirect emissions, and important tourism sub-sectors or impacts, often due to complexities in defining the extents of tourism in the economy of which there remains no single definition [
13]. In fact, in the aforementioned review by Gössling [
13], none of the 27 studies adopted comprehensive system boundaries in the assessment, meaning that the results are likely to only be indicative of the true impact of tourism.
While there are valuable studies on the GHGs from tourism with wide assessment boundaries in the literature, they often include only direct impacts from tourism activities, with indirect impacts (scope 3) commonly excluded (e.g., [
7,
16,
27]), which leaves room for further contributions. Direct impacts are generated directly from tourist activities, while indirect impacts result from intermediate inputs due to all other emissions-causing activity related to the industry [
30]. These emissions are largely spread around the world embedded in international trade. In spite of being largely absent in tourism-related literature, the significance of indirect emissions has been widely reported and quantified in many other sectors, from consumer carbon footprints [
31] to general urban sustainability [
32], service industries [
33], engineering and construction (e.g., [
34,
35]), with many studies suggesting that the contribution of indirect emissions can be potentially much higher than direct emissions [
36,
37]. They are also particularly important for services which form an important part of tourists’ consumption. Exclusion of indirect emissions from services also means that the majority of emissions are not captured, as the impact from the final point of delivery of a service is often only minor compared to that from the required material inputs [
33]. While not a comprehensive assessment, an analysis of the indirect emissions associated with different tourism-related activities by Filimonau et al. [
19] suggested that the indirect carbon footprint for hotels and tourism transport could be as high as 20% and 65% of the respective totals. The scale of the importance of indirect emissions has been further echoed in other studies, as for example by [
12,
38,
39]. Furthermore, there are suggestions that the share of carbon impacts due to indirect emissions is likely to increase in the future, due to the comparative simplicity in reducing direct emissions, making it even more critical to include this issue in assessments [
40]. In recognition of the importance of including the full range of emissions related to national tourism, a number of methodologies have been proposed for the calculation [
41] including the life-cycle assessment (LCA) approach (e.g., [
42]). LCA enables the full scope of emissions embedded in all related goods and services to be accounted for and, while it has so far had limited application in the tourism sector (e.g., [
19,
20,
23,
43]), it offers an opportunity to improve the quality and accuracy of environmental assessments [
44]. Especially applicable to national scale emission studies, the LCA methodology is able to give broader information on the impact of the sector, which can be particularly important for effective policy-making [
43].
In light of this, the aim of this study is to take a step towards an improved understanding of the overall GHG emissions induced by tourism directly and indirectly. An input-output (IO)-based hybrid LCA method is presented to study the full scope of emissions caused by tourism. This approach has been identified as a viable solution to the problem of truncation and boundary selection [
19,
45]. As a demonstration of the method, the full carbon footprint of an average foreign tourist is assessed with a consumption-based approach that allocates the emissions to the consumers of goods and services [
41,
46], and then the overall GHGs induced by inbound tourism to Iceland over the period 2010–2015 are estimated. Iceland provides an interesting case due to three features. First, the tourism sector in Iceland is the fastest-growing industry in the country with an annual growth rate exceeding 30% in the most recent years [
47]. Second, as Iceland is a remotely located island, almost all tourists arrive by air, which is a very GHG-intensive travel mode. Third, the country is unique in terms of GHG emissions due to its almost emissions-free energy industry and import-dominated economy, which emphasise the role of the indirect emissions. The presented hybrid LCA approach is applicable in other contexts as well.
According to the study, the per capita emissions caused by the average tourist visiting Iceland are approximately 1.35 tons CO2-eq, but quickly increase up to over 3 tons as the flight distance rises. Overall, this study finds that tourism currently causes GHG emissions of close to 2,000,000 tons annually in Iceland. Annual emissions are rapidly growing due to the increasing number of tourist visits as well as a rise in the average flight distance, with the most significant growth observed in the number of tourists arriving from Asia and North America.
The paper is structured as follows: the next section outlines the research method applied to calculate the carbon footprint of an average tourist, followed by a section outlining the research design and data sources utilised. The fourth section presents the results of the study. Section five provides a discussion of the results comparing the carbon footprint with that calculated in the previous study on Iceland as well placing the results in a global tourism context.
2. Method
The method utilised in this study is LCA-based carbon footprinting. The LCA approach is in accordance with ISO 14044 [
48], with the guidelines of Wiedmann and Minx [
41] and Minx et al. [
46] followed for consumption-based carbon footprinting.
LCA is a method for analysing the impacts of a good, service or system over its life cycle including all the utilised energy and material inputs. This means that both the direct and the indirect emissions are captured [
49,
50,
51]. There are two main approaches to LCA; Process LCA and Input-Output (IO) LCA, with hybrid LCAs combining aspects of both [
36]. IO LCAs are commonly called environmentally extended IO LCAs (EE IO LCA) or economic IO LCAs (EIO LCA), but in this study will be referred to as IO LCA. This study employs an IO LCA-based hybrid model, which aims to take advantage of the strengths of the two methods. More particularly, the employed method is called tiered hybrid LCA (e.g., [
52]), an approach that is further discussed below.
IO LCA is an efficient method for capturing both the direct and indirect emissions caused by the studied system [
45]. IO LCA is a top-down method that approximates environmental impact through the utilisation of “sectorial monetary transaction matrices” [
53], in other words, by calculating the environmental output per monetary expenditure in the sector. By describing the inputs that a given sector of an economy requires from all other sectors to produce a unit of output [
54], the IO LCA method can model the complete and complex interdependencies that exist between economic sectors [
52]. Using the assumption that an increase in the output of goods or services from one sector requires a proportional increase in inputs from others, the economic output for each stage of the life cycle can be determined [
54]. This information is expressed as a normalised matrix of technical coefficients. To calculate the total environmental impact, this economic matrix is simply inverted and multiplied by a corresponding matrix of impact intensities (environmental impact per monetary unit of output) [
52,
54]. This calculation results in the determination of the total consumption-based environmental impact across the economy for producing a particular product or service. A full description of the IO LCA derivation and calculation methodology can be found in [
55,
56,
57].
The IO LCA method inherently includes the complete production and delivery chains associated with producing a good or service and, therefore, the direct and indirect emissions. It is very efficient in analyses intending to include the indirect emissions, particularly those of services, whose impact can easily be significantly underestimated [
33,
36,
37]. In general, IO LCAs and IO-based hybrid LCAs are more comprehensive than the more traditional process LCAs, which suffer from some level of truncation error [
37,
52]. Another important benefit of this approach is that the data required for the assessment is often regularly collected as part of national statistics in many countries [
52]. Through the combined effects of using publically available data and consistent boundaries of analysis, the IO LCA enables a relatively quick and inexpensive estimate to be produced of the environmental impacts of a certain process across an economy [
54]. While the environmental impacts included in a particular IO model can be varied to include almost anything, the significant data requirements and workload of producing the IO tables mean they are commonly limited to a number of key impact categories. Typically, the number of impacts is fewer than that available in process LCA databases.
The input-output tables utilised for the LCA assessment combine various products, production technologies and services into aggregated commodity sectors [
52], disguising the heterogeneous resources, processes and environmental impacts associated with each. As such, IO LCA is generally more suited to assessing typical, aggregate products that can be well represented by the relevant commodity sector [
54]. Furthermore national input-output data assumes that for a single region, all production methods are the same, including those for imported commodities, and that there is no impact from ignoring price heterogeneity that can distort flows between industries [
52]. Another limitation of IO LCA is the assumed linear relationship between sector outputs and environmental burdens [
58]. Data age and incomplete sectorial statistics further compound the issue, resulting in a generalised, approximate assessment of the environmental impact of a production decision [
52]. In addition, this method generally does not take into account potential end-use GHGs or land use change impacts.
In adopting the tiered hybrid LCA approach, some of these weaknesses can be reduced. In a tiered hybrid LCA model, certain phases in the production and delivery chain (known as tiers) are replaced with specific process data [
52]. Higher-order upstream tiers, representing indirect emissions, are still assessed with IO analysis to maintain the comprehensiveness of the assessment. For example, in the energy sector, the production phase (the first tier) can be replaced with local up-to-date data instead of using the model average and potentially old data. In general, the tiered hybrid approach reduces the level of uncertainty in the calculation related especially to: (1) data age, as more up-to-date data can be used; (2) average production technology assumption, if production technology specific to the assessment object is used; and (3) the aggregation error, when data specific to the assessment object is used in place of the industry sector average as is typical in IO models; (4) by adding use-related emissions to the assessment for sectors including only cradle-to-gate emissions (e.g., fuel combustion from driving). It has been suggested that hybrid LCAs can provide combination of comprehensiveness and accurateness not achievable by either one of the LCA approaches alone [
52].
In consumption-based carbon footprint assessments, the GHGs are allocated to the users of the goods and services (e.g., [
32,
41,
46]. IO and hybrid LCAs have a relatively established position in consumer carbon footprint assessments [
32,
41,
46], but the method has not been applied widely for assessing the carbon footprints of tourists, even though it can be successfully utilised. The same strength of assessment comprehensiveness, which makes the method widely accepted in the field of consumer carbon footprinting [
32], is an important attribute in any consumption-based GHG assessments.
5. Discussion
The aim of this study was to present a consumption-based carbon footprinting method to assess the total GHG impact of tourism for a country, including direct and indirect emissions. The approach is applicable to other destinations as well, but in this study Iceland was used as the case country due to its unique nature as an isolated island nation and almost 100% renewable sources-based local energy system.
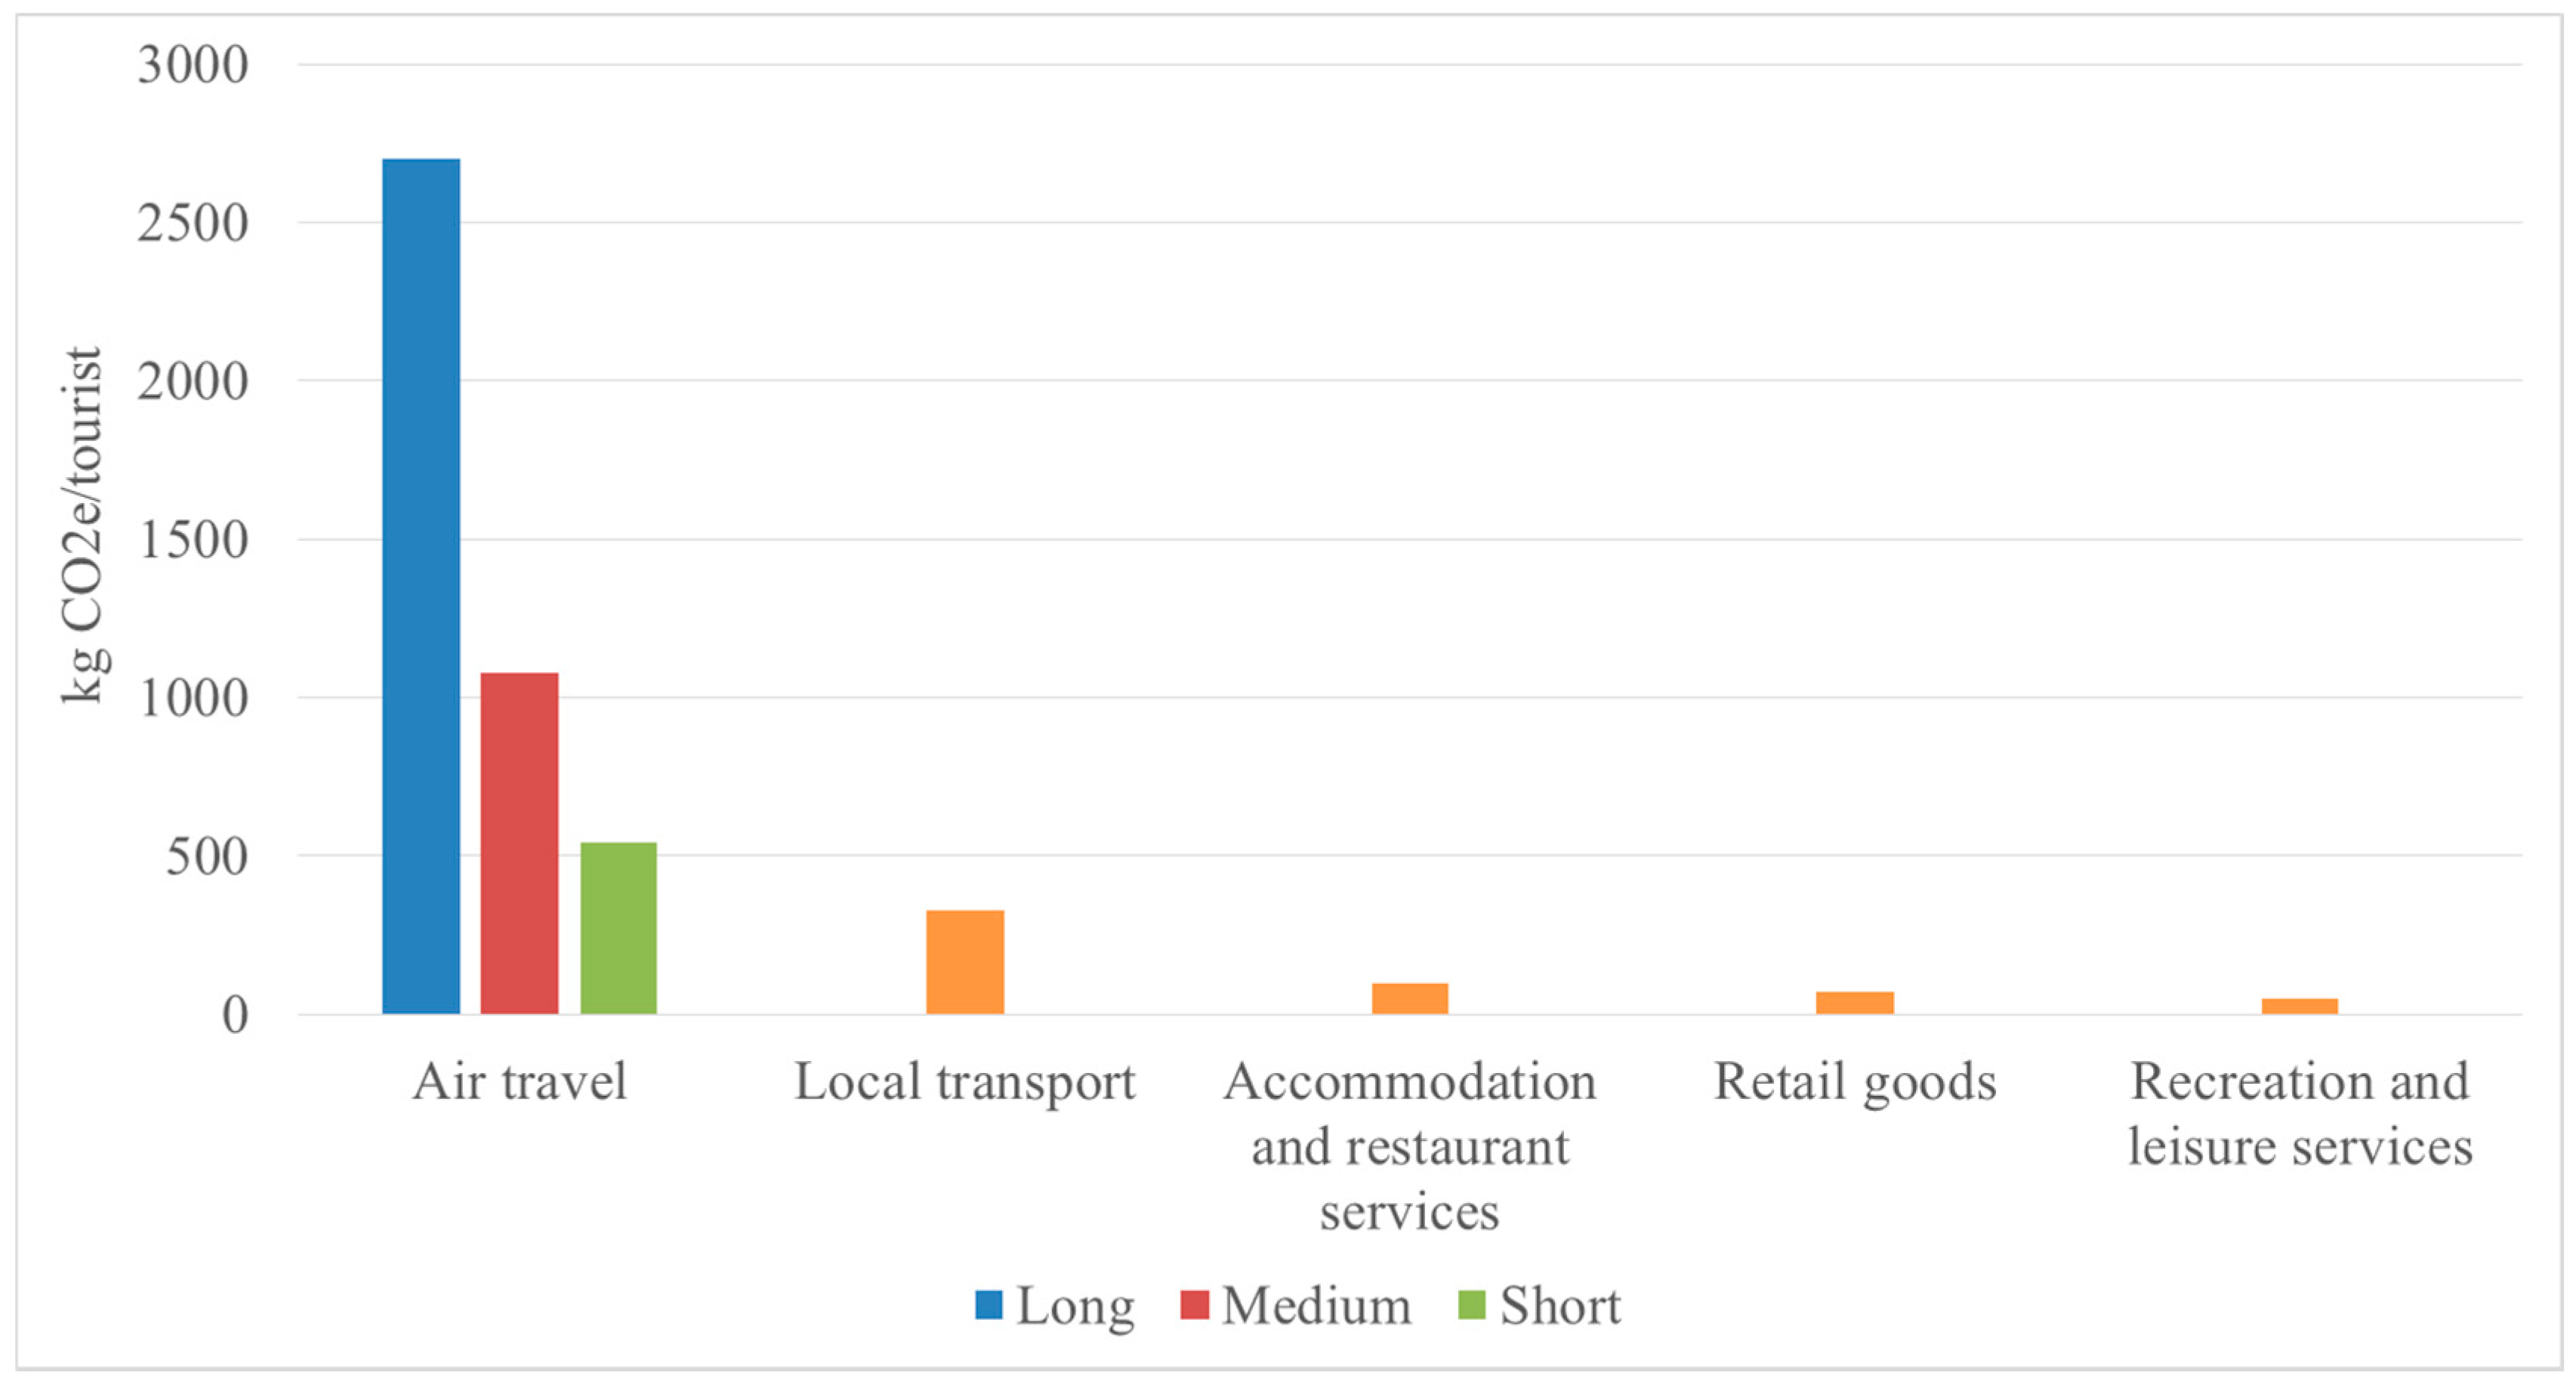
The results indicate that transport is, by far, the largest source of emissions. The dominance of aviation emissions clearly demonstrates the strong influence that the point of departure of a tourist has on the final carbon footprint. This finding is especially concerning given the trend towards more tourists arriving from outside of Europe. In-country transport is also notable, especially given the short duration of travel. As noted by [
19], the length of stay is an important factor in assessing the carbon impact of tourism, with longer stays enhancing the overall carbon efficiency of travel [
80].
From a climate change mitigation policy perspective, this study finds on average 70% of the GHGs caused by an individual tourist to be due to air travel and thus the emissions currently fall outside of any domestic mitigation policies. This also means that any local mitigation policies in Iceland (or any other similar destination) will affect only a minor share of the total emissions. The GHG emissions from air travel in 2013 were already larger than the total tourism-related emissions in 2010 and the share of air travel is also the most rapidly growing sector due to the shift in the countries of origin towards North America and Asia. This has resulted in a disproportionate rise in emissions—while the growth rate in number of visits has increased from 2010 to 2015 from below 20% to 30%, the growth in emissions has risen significantly from 20% to well above 30%.
Furthermore, this study found that of the remaining 30% of total emissions, the majority relate to fuel combustion in local transport. These emissions are likely to largely remain for a long time despite the initial discussions about electrification of the transport sector in Iceland. As local transport is used by the majority of tourists visiting Iceland [
29], addressing this sector will be vital when developing local emission mitigation strategies. The low emissions stemming from the accommodation, retail and activities sectors due to Iceland’s almost carbon-free energy system also suggest that focussing on transport will produce the largest reduction in the part of the carbon footprint within reach of local mitigation policies. Rapid growth in tourism also boosts construction activity and potentially leads to high emissions from the construction sector, but the issue should be studied further to understand well enough the emissions and the mitigation potentials.
The findings of this study regarding the carbon significance of transport activities are in line with other examples in the literature. International aviation was reported as the dominant source of emissions by many other studies on the topic (e.g., [
5,
7,
8,
9,
10,
12,
20]), including the UNWTO-UNEP-WMO [
59], where it was shown to account for up to 50% of total tourism emissions globally. Aviation’s share of total emissions in the present study are also similar in magnitude to other island nations as summarised by Gössling [
13], which may be a more meaningful comparison. Other transport modes, including road and water travel, car rental and other related activities, were also generally found to be the second-largest source of emissions (e.g., [
18,
29]). Gössling [
7] also found that transport (both road, sea and air) could contribute 90% of total emissions, even when indirect emissions were excluded, with a figure of 75% reported in the Helsingborg Statement on Sustainable Tourism. The only exception are the results from UNWTO-UNEP-WMO [
18], which show similar relative emissions between the “other transport” and “accommodation” sectors. In Iceland, conversely, the local low-carbon energy system automatically pushes more relative weight to ground transport. Due to the different calculation methodologies and system boundaries adopted across the literature [
13], further comparison of the less emissions-intensive sectors (e.g., accommodation, retail, etc.) was not attempted.
Table S3 summarises some of the similarities and differences in the results of this study and previous studies found from the literature.
The overall carbon footprints calculated were also compared to those found by Bjönsson [
29], who modelled the emissions resulting from three different trip itineraries. The results of [
29] ranged between 400 and 1300 kg CO
2-eq per capita for the trips comparable to the one assessed in this study, which emitted an average of 1.35 ton CO
2-eq per capita. The similar per capita emissions found by the two studies goes some way towards validating the findings of the current analysis. Furthermore, the lower results obtained by [
29] are to be expected due to the broader scope of the current study. Most importantly, only the direct emissions were calculated in [
29], meaning the results underestimate the true emissions to some extent, especially in regards to transport. In addition, no long-distance flights from Asia were included in the assessment and the emissions due to retail and consumption were also omitted.
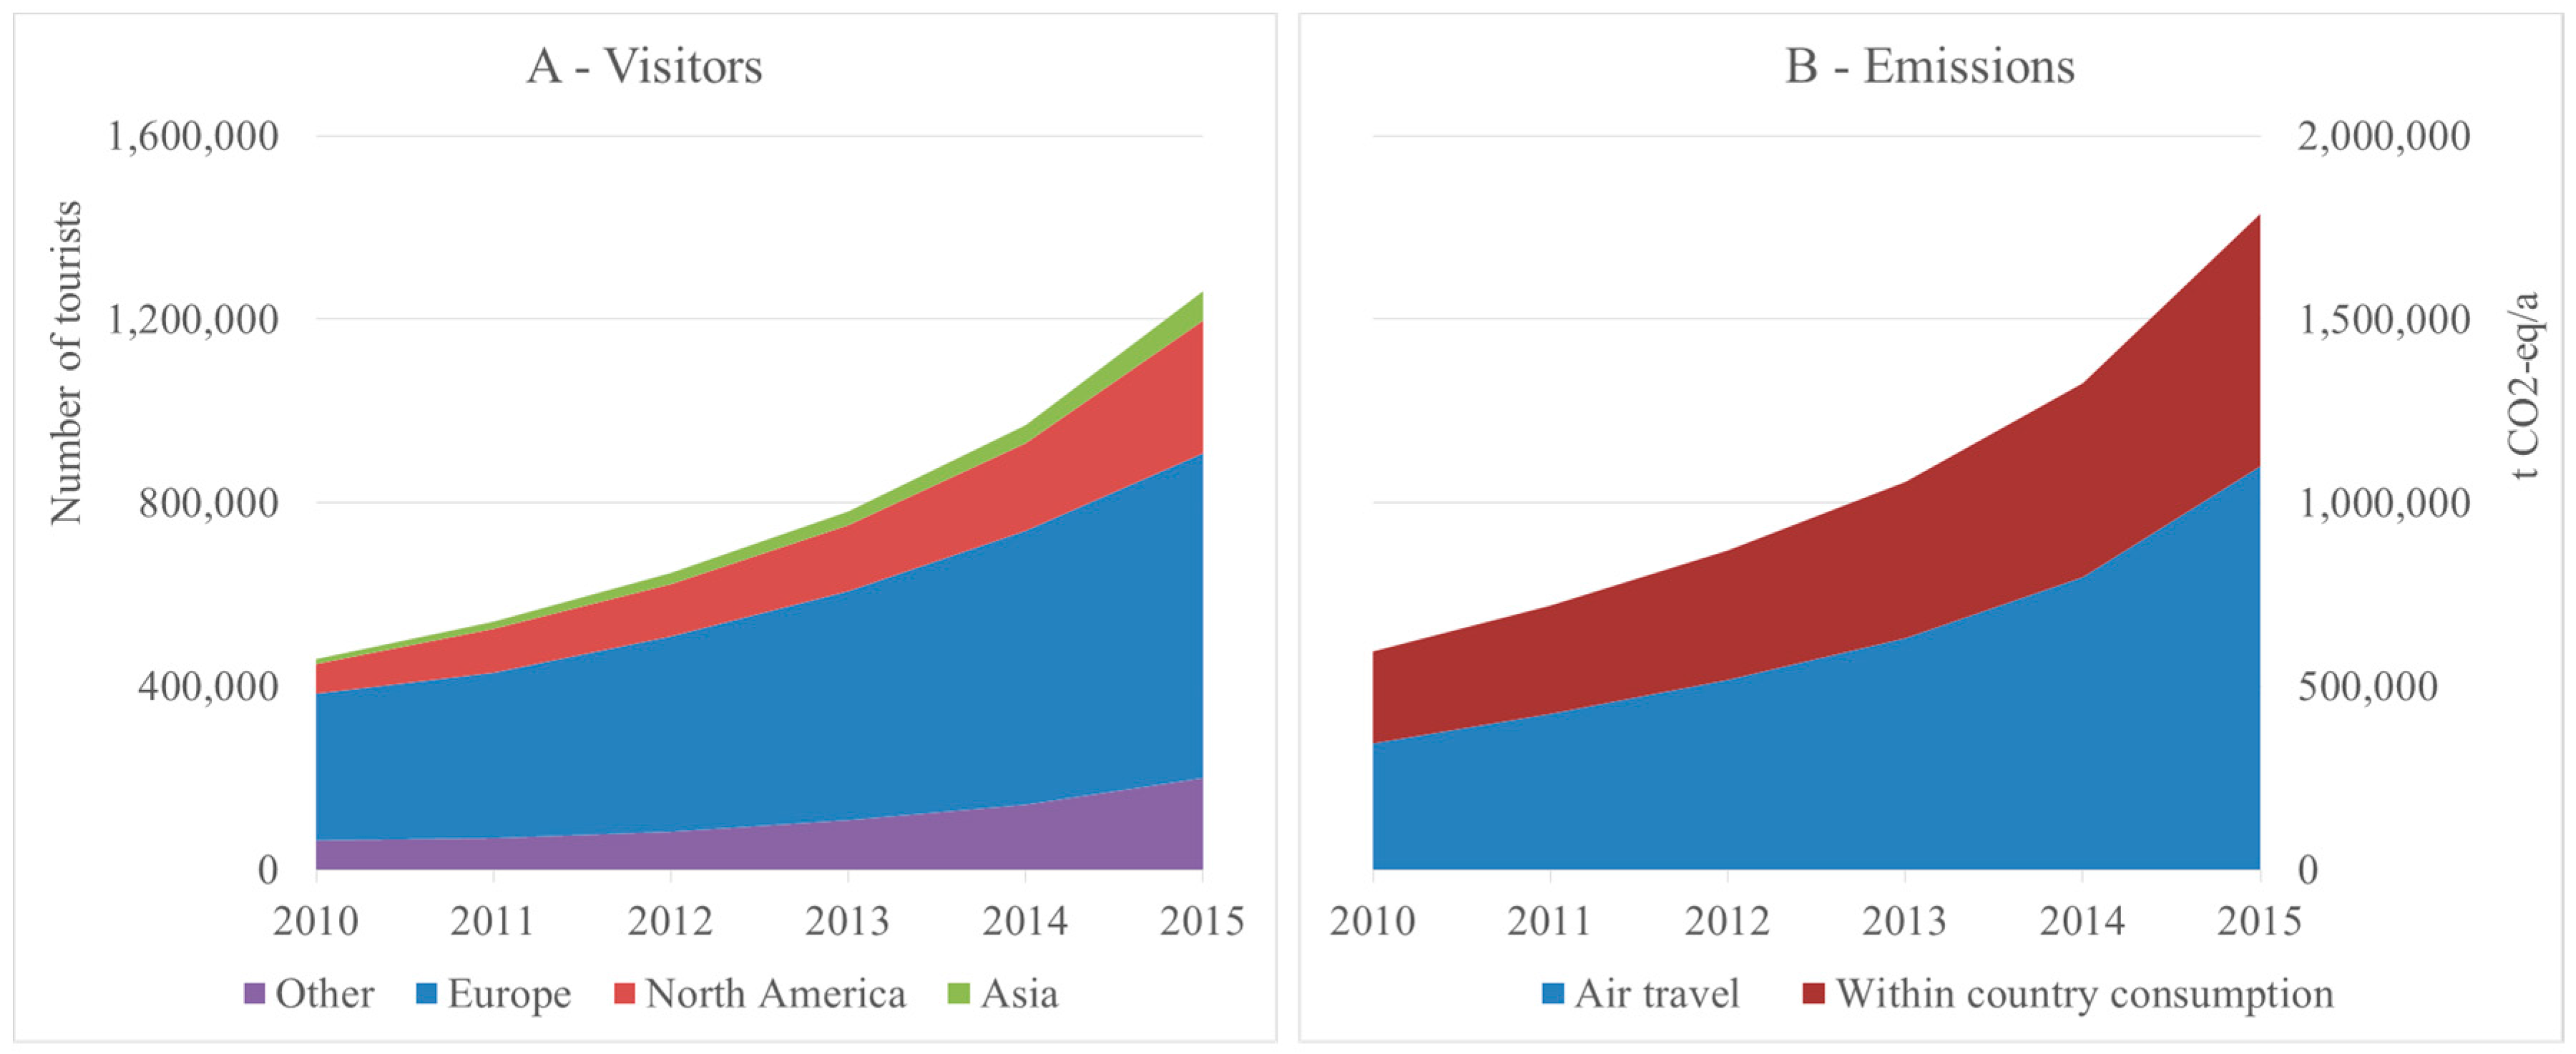
In the second part of this study, it was estimated that the total GHG load caused by tourism to Iceland has boomed from 0.6 million tons CO
2-eq to 1.8 million tons CO
2-eq between 2010 and 2015 (
Figure 2B). This is significant especially when compared to Iceland’s total emissions in 2012 of 4.6 million tons CO
2-eq, a figure that largely omits air travel. Also noticeable from the results of this study is that the overall GHG load due to tourism is not growing fast just because of the rise in visits to Iceland, but also because of the increase in the relative share of tourists coming from farther away (
Figure 2A). It was also assumed that all flights from Europe and North America were direct. In reality, such an assumption leads to an underestimation of the aviation-related emissions, but without proper data on the connection flights, this weakness was accepted.
Overall, the reliability of the study and results were assessed in terms of the limitations and uncertainties related to the model itself, study design and the input data used. The applicability of the hybrid LCA method for consumption-based assessments has been shown to be appropriate based on other studies in the literature (e.g., [
72,
73,
81]). However, as no local model was available, this study utilised a U.S.-based model, which raises an issue regarding compatibility. The EIO LCA model was selected for several reasons, which support its applicability. First, of the available models, the EIO LCA provides the most disaggregated set of industry sectors, which reduces the aggregation error, one of the main deficiencies of the IO method [
52]. This meant that the integrity of the input data could be maintained as much as possible. Second, the EIO LCA enables enhancements to be made by using local data. In this assessment, the utilisation of local energy data in the model significantly reduces the compatibility uncertainty, since the vast majority of GHGs are due to the energy sector. Third, as the majority of goods consumed in Iceland is imported, a local model is unlikely to produce significantly different results; the U.S. is already the second-largest import trade partner to Iceland. Finally, the assessment was further improved through the calculation of the emissions from air travel with distance data and the GHG intensity from Chester and Horvath [
76], and inclusion of the emissions from fuel combustion of rental cars based on litres of fuel purchased. These modifications reduced the direct EIO LCA share in the assessment results from 15% in the long-flight scenario to 29% in the medium scenario and 46% in the short scenario, meaning the use of another model would most likely not change any of the suggested implications significantly. Notwithstanding, as the model is based on 2002 economic information, there are still inaccuracies in the results due to changes in the economic or environmental data over time. To reduce these uncertainties, sectoral inflation corrections were applied to each industry sector of the model for the years 2002−2013 before applying a monetary exchange rate conversion. While this does not fully remove the uncertainty, it does significantly reduce it.
When using the IO LCA approach, converting monetary values into GHG emissions contains uncertainty as well. The inherent deficiencies of IO LCA (homogeneity and linearity assumptions e.g., [
51]) means that all products from one IO model industry sector are assumed to have the same GHG intensity per monetary unit. Furthermore, the emissions load is assumed to linearly increase with an increase in expenditure. If the purchased products are very different from the industry average, the model might randomly under- or overestimate the emissions. In the current study, however, the key sectors (aviation and private vehicle use) are not subject to this uncertainty, meaning the impact should be limited.
Regarding the input data, the expenditures were predominantly sourced from Statistics Iceland, which suggests a high level of reliability. While the data was only sourced for a single year in this analysis (2013) and could therefore suffer from temporal variability, the overall tourist spending in Iceland has remained relatively stable between 2010 and 2015, thereby indicating a low risk of this error. Furthermore, the calculated GHG impact of tourism in Iceland is an average figure, with no specific data included on trip length, activities undertaken or accommodation preferences. With other studies indicating the importance of certain factors such as trip length on the overall emissions intensity of tourism (e.g., [
23]), further work is required to understand the sensitivity of the emissions to these variables. This would likely require more thorough, accurate and up-to-date data collection on the actual behaviour of tourists [
23].
Certain sources of GHG emissions were also excluded from the analysis (see
Table 2), suggesting that the results derived in this study underestimate the true emissions to some extent. For example, transport in the tourist’s country of origin, potential accommodation before the flight and connection flights (which increase the distances travelled) were not covered in this analysis due to a lack of data. Furthermore, the analysis method used is unable to explicitly account for the additional infrastructure and buildings, especially hotels, constructed as a result of tourism expansion. The IO method inherently includes the capital costs and thus the emissions related to the fixed capital of each sector, but increasing construction activity due to tourism expansion would only be apparent in an up-to-date model. Therefore, although some construction-related emissions are captured in the IO model, it is reasonable to assume that the accommodation services sector in particular may generate higher emissions than shown in this study due to rapid construction of new accommodation facilities to meet the increasing demand. IO models, including EIO LCA, are typically cradle-to-gate models. This means that there might be a downwards bias in the results they produce, as emissions that occur during the “use” or “end-of-life” phase are excluded. In this study, as the use of rental vehicles was calculated separately, additional emissions occurring during this phase are covered. The end-of-life phase is the most uncertain. To some extent, the prices tourists pay include end-of-life costs and the related emissions are determined by IO matrices which include the recycling and waste treatment sectors. However, how well the actual end-of-life emissions are reflected in this approach cannot be easily estimated. Typically, the end-of-life phase is the least important in terms of GHGs [
37] and thus this uncertainty should not compromise any findings or potential policy guidelines based on the results reported in this study.
It should also be noted that the tourism sector likely generates environmental impacts in addition to GHG emissions, all of which have been excluded from this study, as well as various social impacts. Several studies reviewed for this paper identified land use, biodiversity loss, water consumption, pollution and cultural issues as significant consequences of tourism in addition to energy use and emissions [
7,
9]. For example, Patterson & McDonald [
9] found that tourism ranked 6th out of the 25 sectors assessed in terms of land use impact, with Gössling [
7] calculating that the sector contributed to 0.5% of global loss of biologically productive land (mostly from transport-related infrastructure). It has also been shown that tourism leads to significantly higher rates of water consumption, with some tourists in Europe consuming up to 800 L/day compared to the average daily consumption of just 241 L/day [
4]. While examination of these issues was beyond the scope of this study, such an analysis is required to fully understand and address the impacts caused by the rapidly expanding tourism sector in Iceland.
Finally, the assumptions behind the international air travel emissions factors do have a significant impact on the result due to the dominance of this sector. The selected source Chester and Horvath [
76] was validated with the intensities used by Ottelin et al. [
82] and Lewis [
67] with the result that Chester and Horvath estimate the emissions somewhat lower (operation 98 g CO
2-eq/PKT vs. 114–149 g CO
2-eq/PKT in [
82] and the whole life cycle 135 g CO
2-eq/PKT vs. 180.5 g CO
2-eq/PKT in [
67]), thus suggesting that air travel is not over-emphasised in this study. However, PKT as a unit is still potentially problematic. There is no information available on whether the average occupancy rates of flights to Iceland comply with those used by Chester and Horvath [
76], and large deviations could lead to significant estimation errors. This uncertainty cannot be overcome in this study. An additional interesting perspective on air travel is that the climate change impact would be much higher than current GHG intensities imply since they are calculated using the same approach as for ground vehicles. In fact, if certain short-lived GHGs and the cloud-forming impacts were accounted for, the impacts per passenger kilometre would be significantly higher [
83]. For example, Lee et al. [
83] have suggested multipliers of 1.3 to 4.8 for the impacts of aviation. If this were the case, it would further increase the significance of the findings in this study regarding the impact of air travel. As the tourism sector accounts for at least half of global aviation emissions and is likely to rise, determining the correct multipliers is a critical issue to resolve [
84].


