
Using Food Flow Data to Assess Sustainability: Land Use Displacement and Regional Decoupling in Quintana Roo, Mexico


Abstract
:1. Introduction
- (1)
- Visibility: Ex situ environmental degradation associated with the production of food for a particular region becomes less visible as production takes place further away from the consumption region. Consumers are less likely to be aware of the potential environmental impact of their consumption when products originate from distant areas. Consumers also may have less attachment to the landscapes of production and less connection to the population impacted by consumption. This is particularly true when there is a weakening of proximate urban–rural relationships (e.g., hinterlands).
- (2)
- Governance: In situ environmental degradation associated with the production of food for other areas is less governable by local and regional institutions. When outside actors such as governments or corporations are more powerful than the local ones, local government and other actors cannot fully control flows and environmental impacts [13].
- (3)
- Food security: Estimating food security defined as the capacity of a region to feed itself, especially under situations of environmental or political–economic stress—becomes more problematic. Regions can become increasingly or fully dependent on outside trade flows (imported products). In addition, if there is a large component of the flows aimed at export, regional land use may or may not reflect that external dependency. Much of its productive land, even if used for food production, might not be destined to feed that region, but to feed other regions [9].
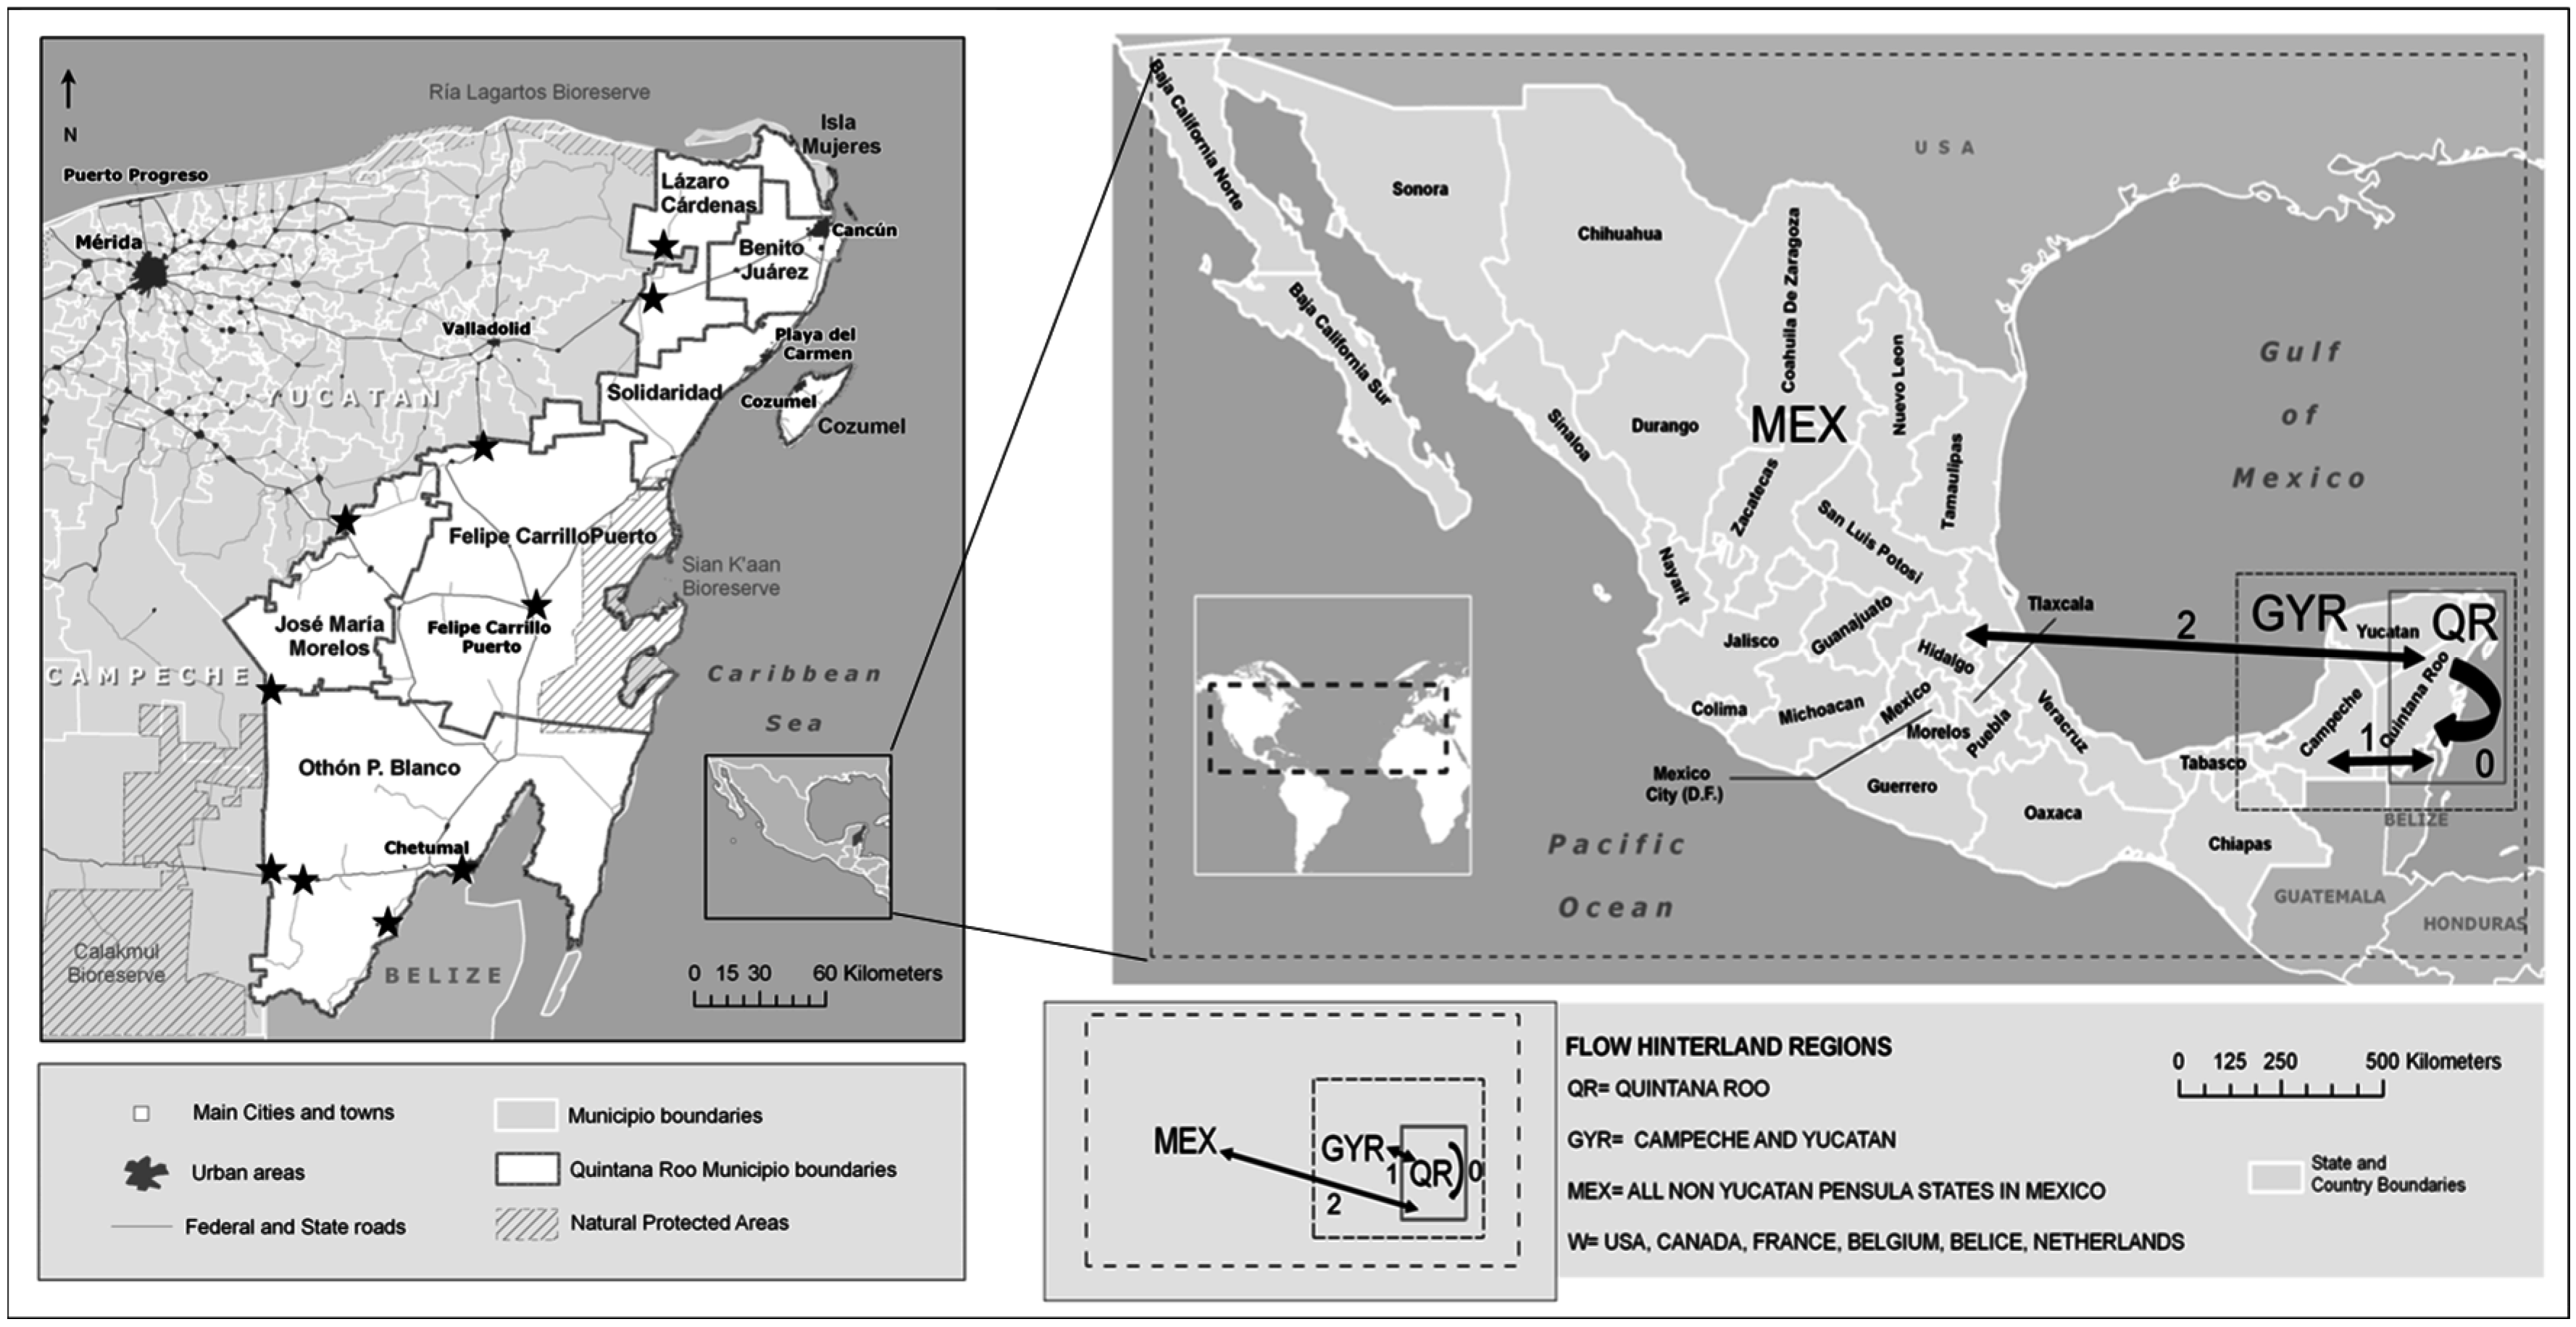
2. Study Area
3. Methodological Approach
3.1. Data Sources and Processing
3.2. Land Displacement
3.3. Regional Decoupling
3.4. Consumption vs. Production
4. Results
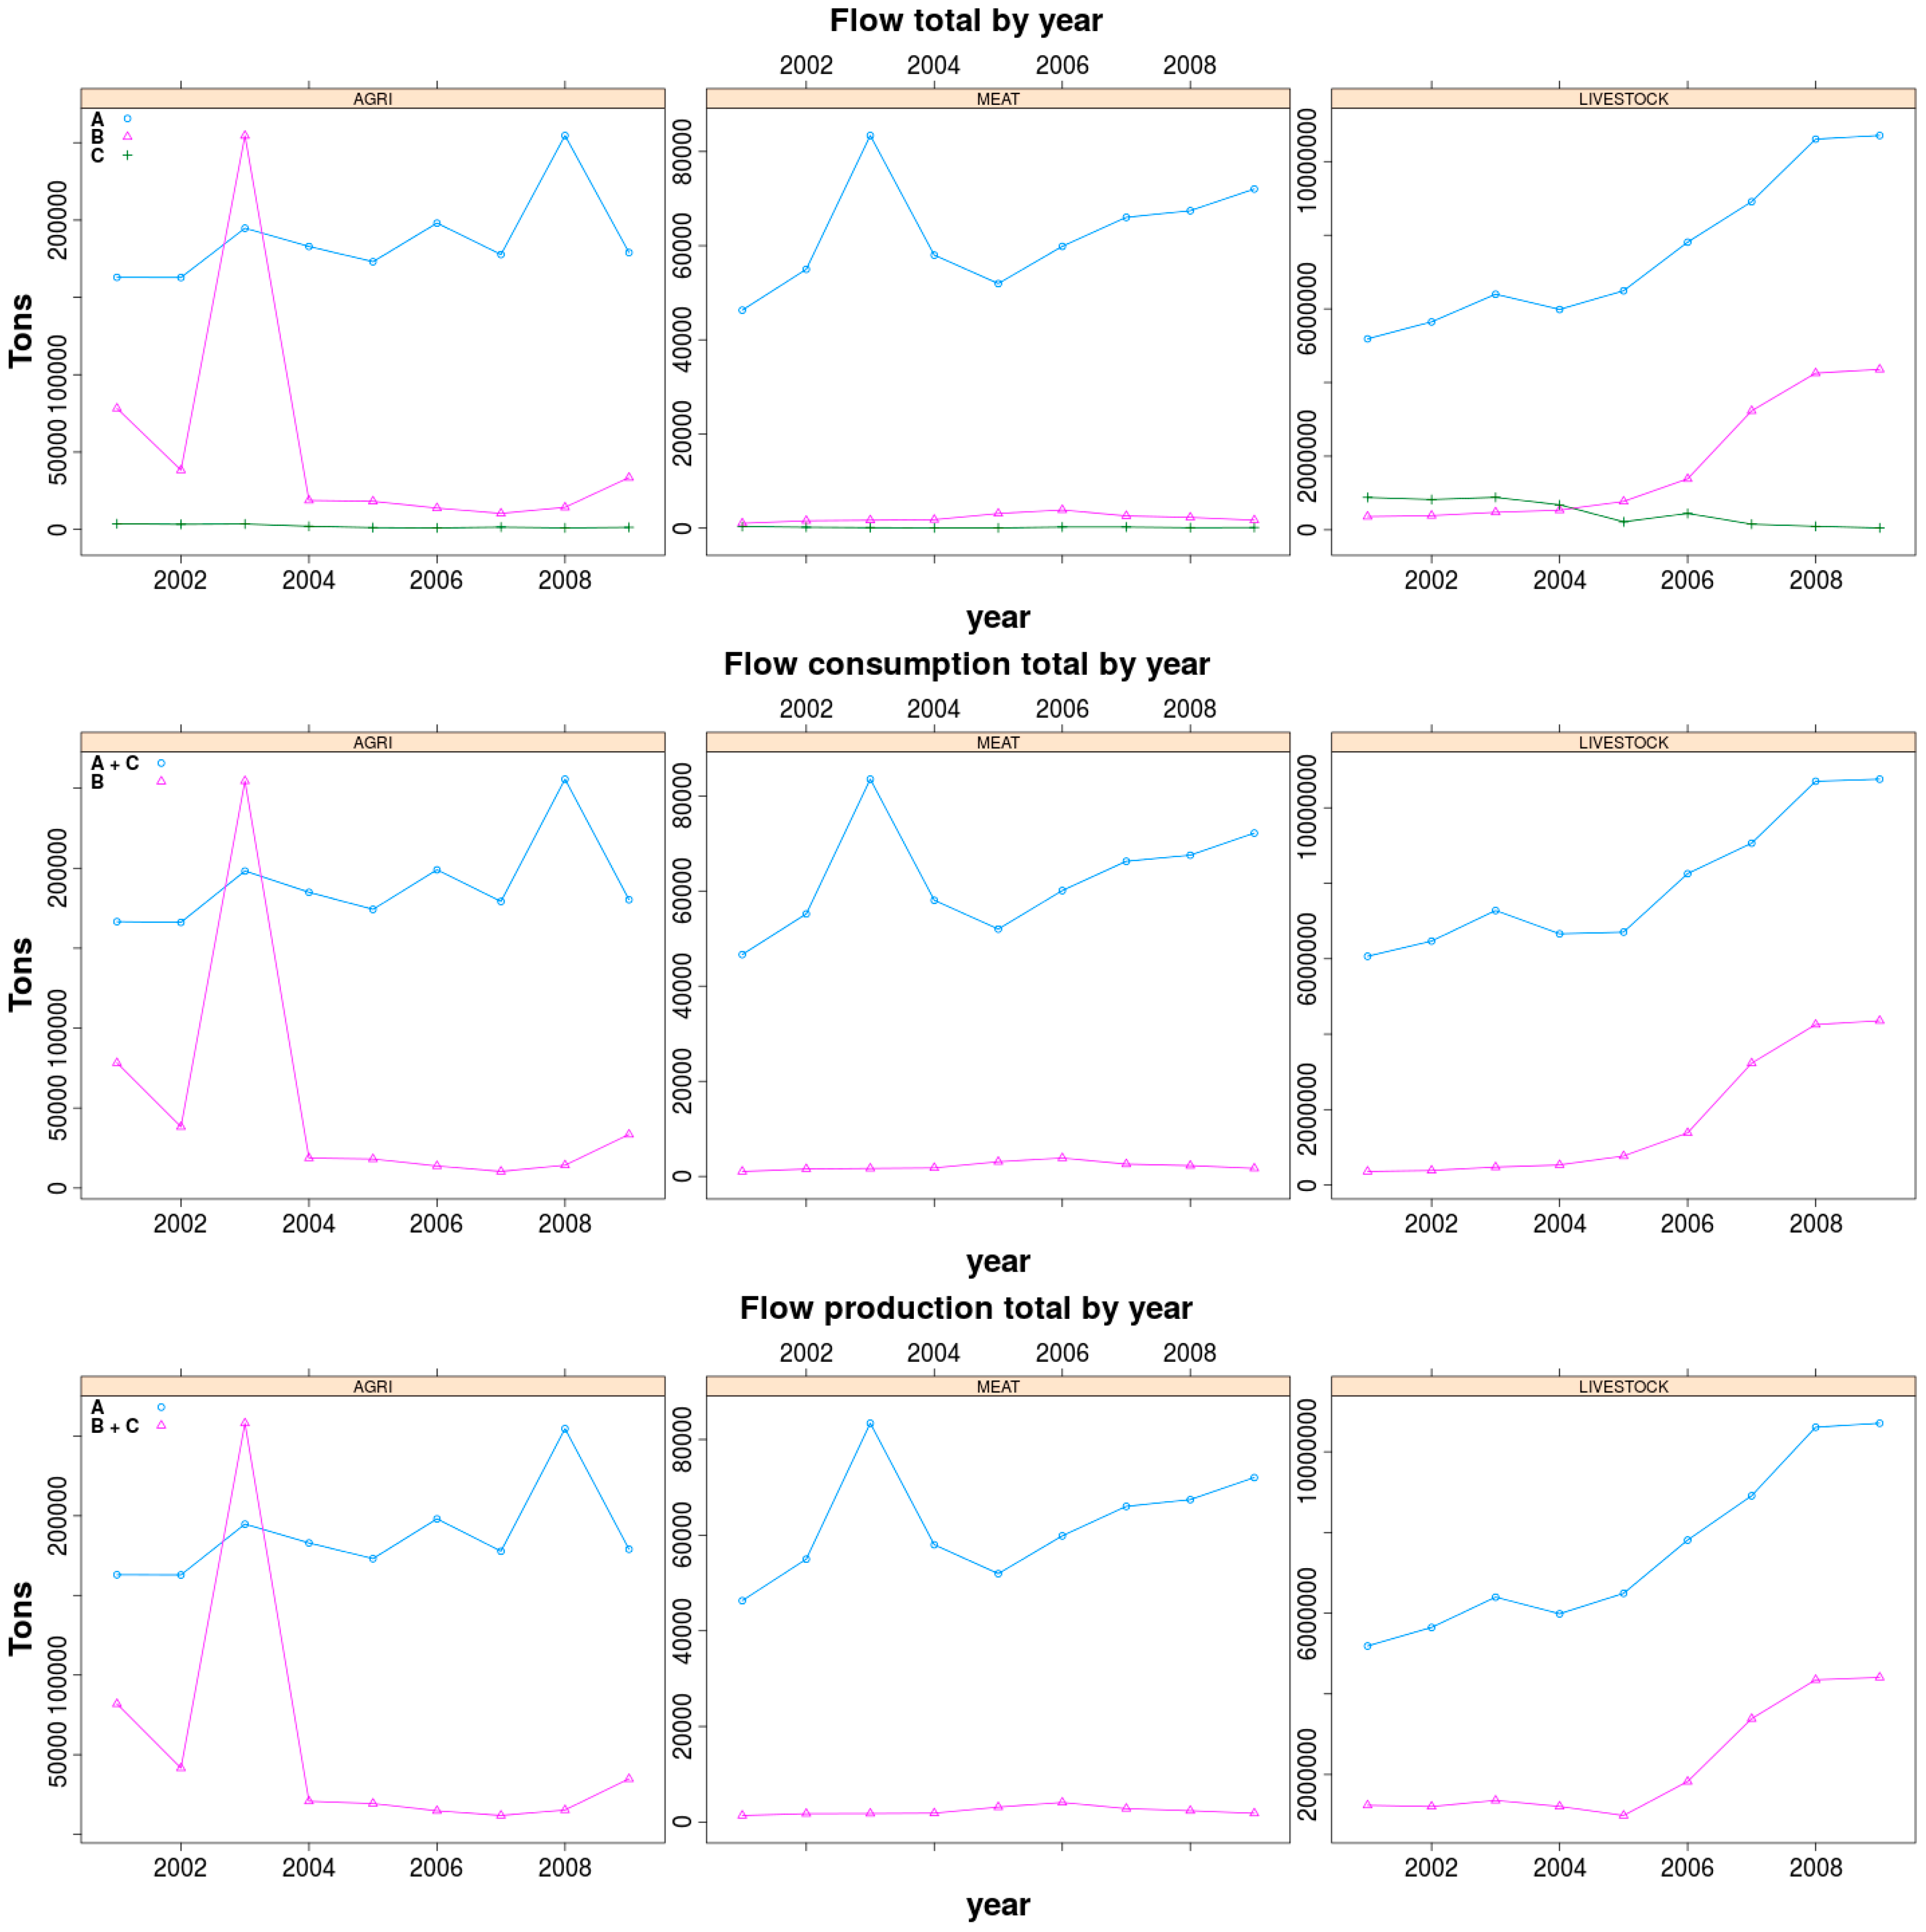
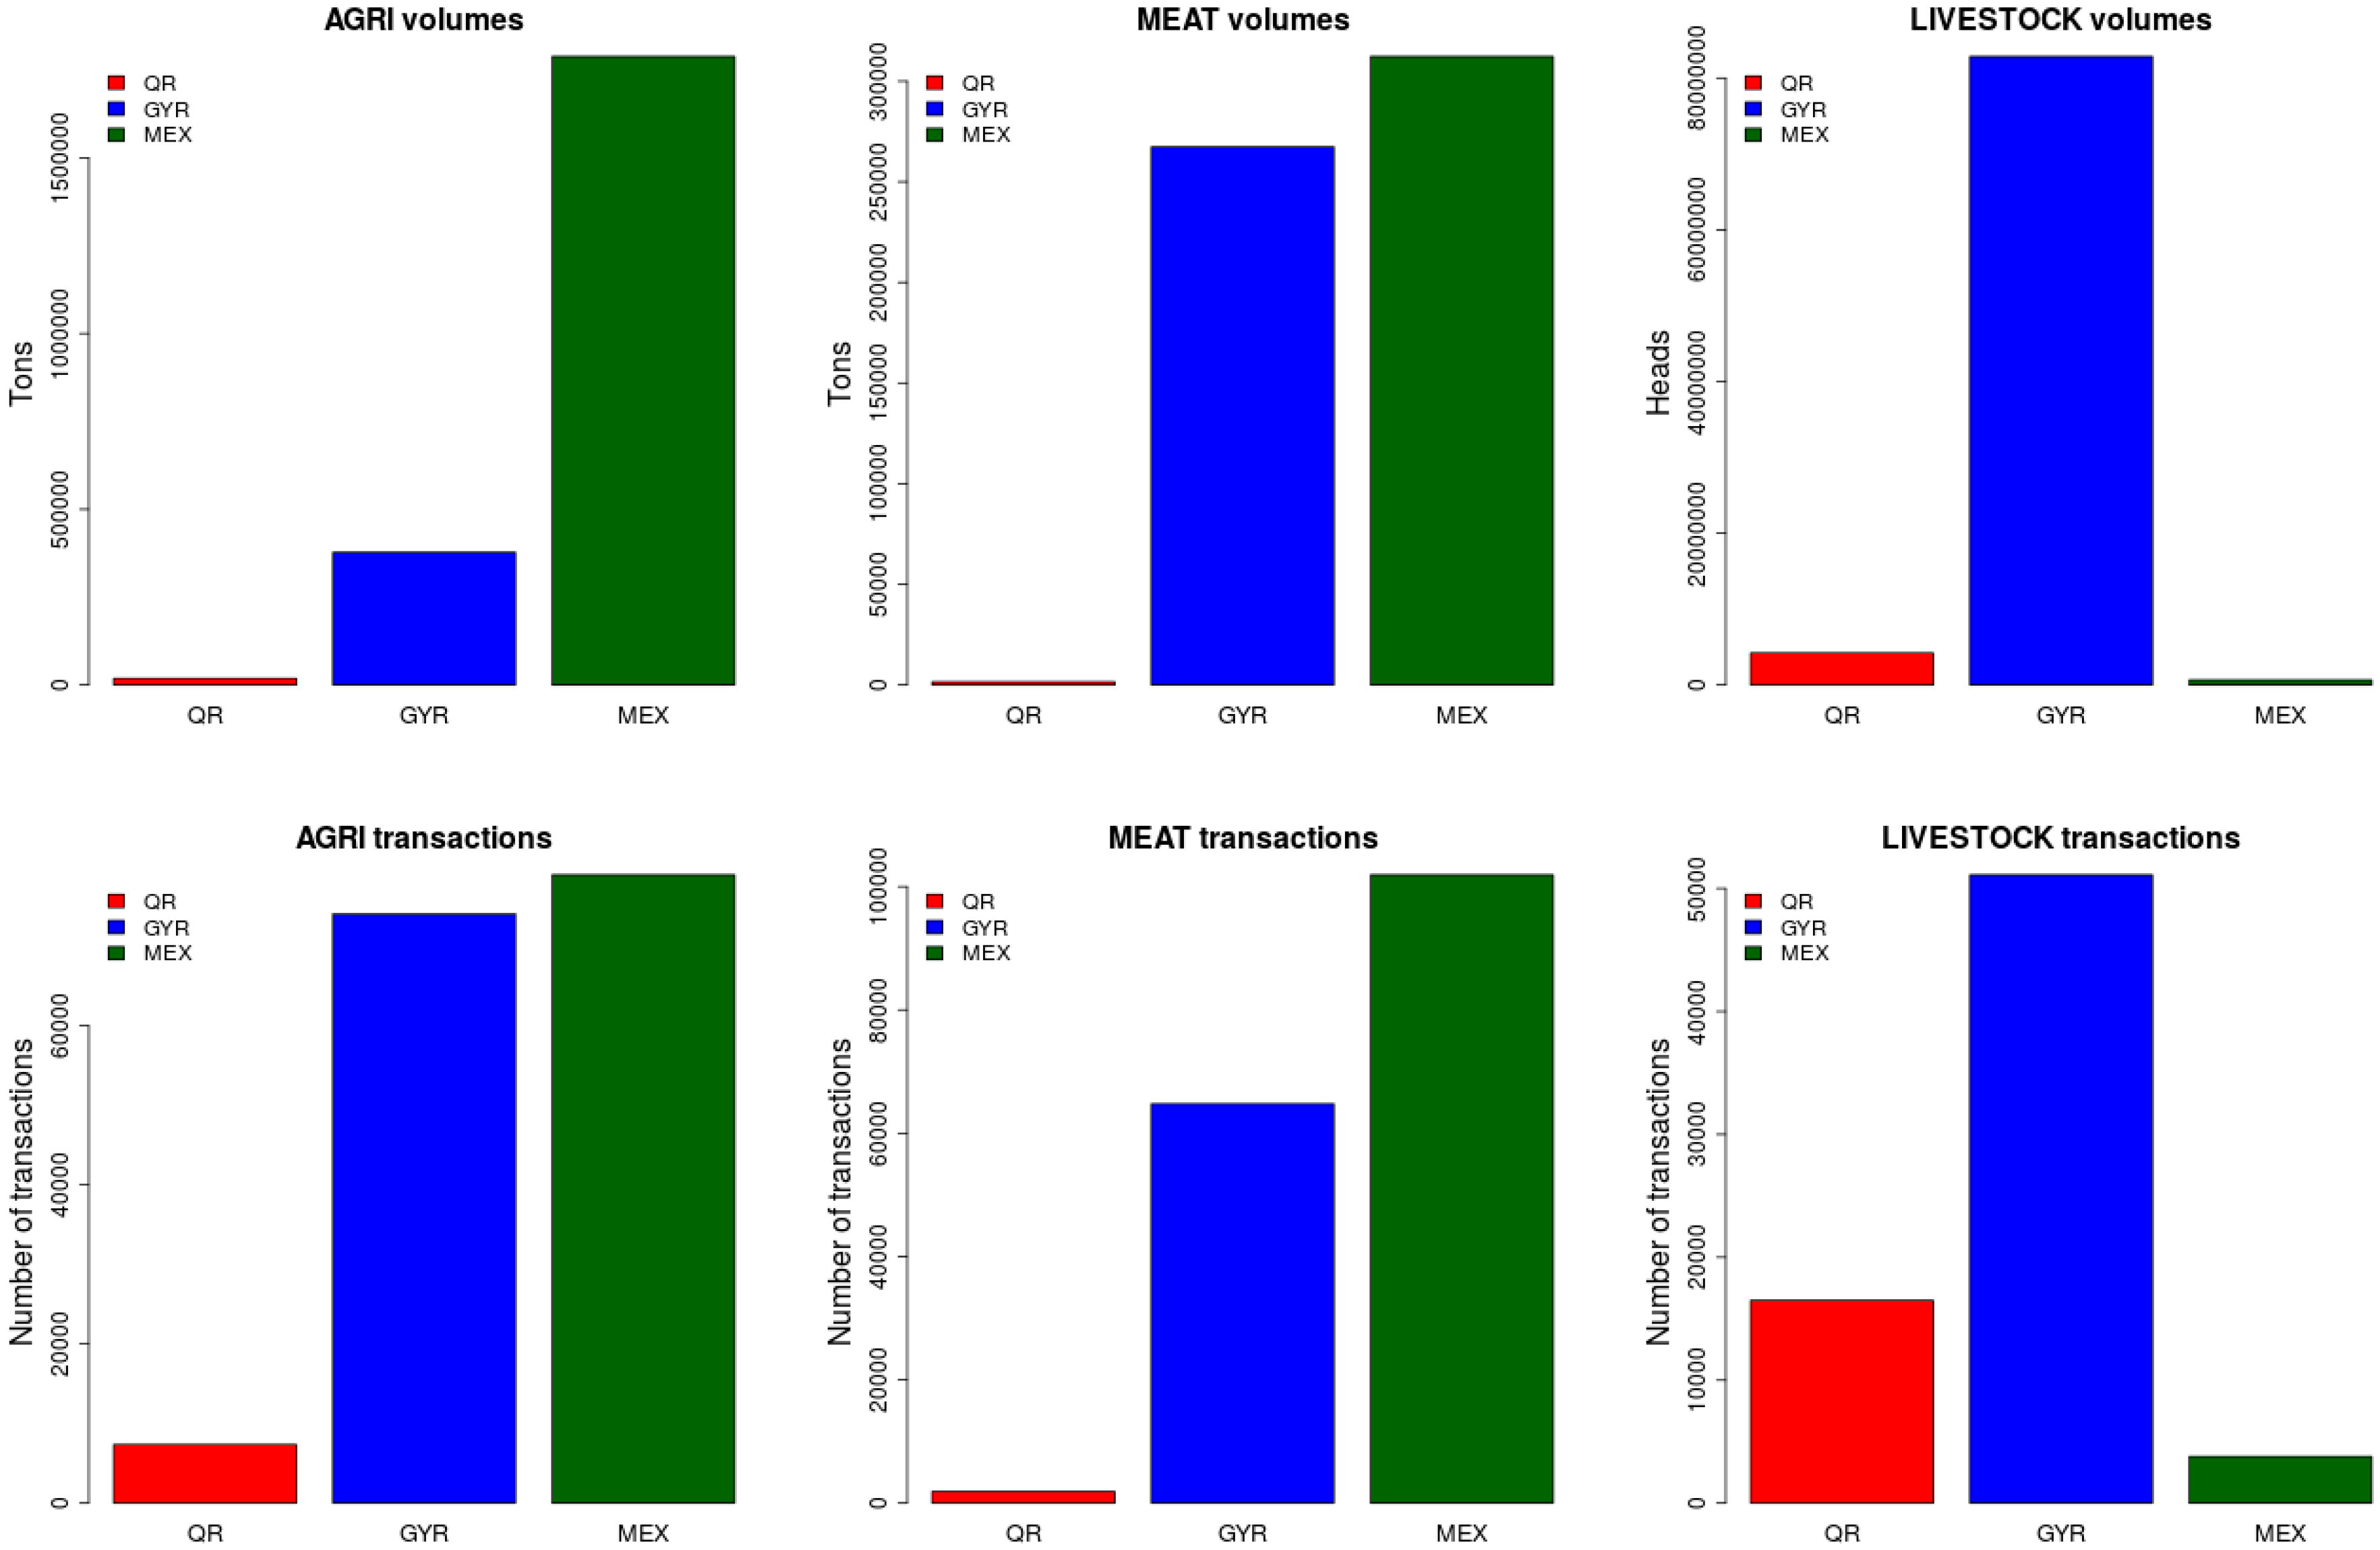
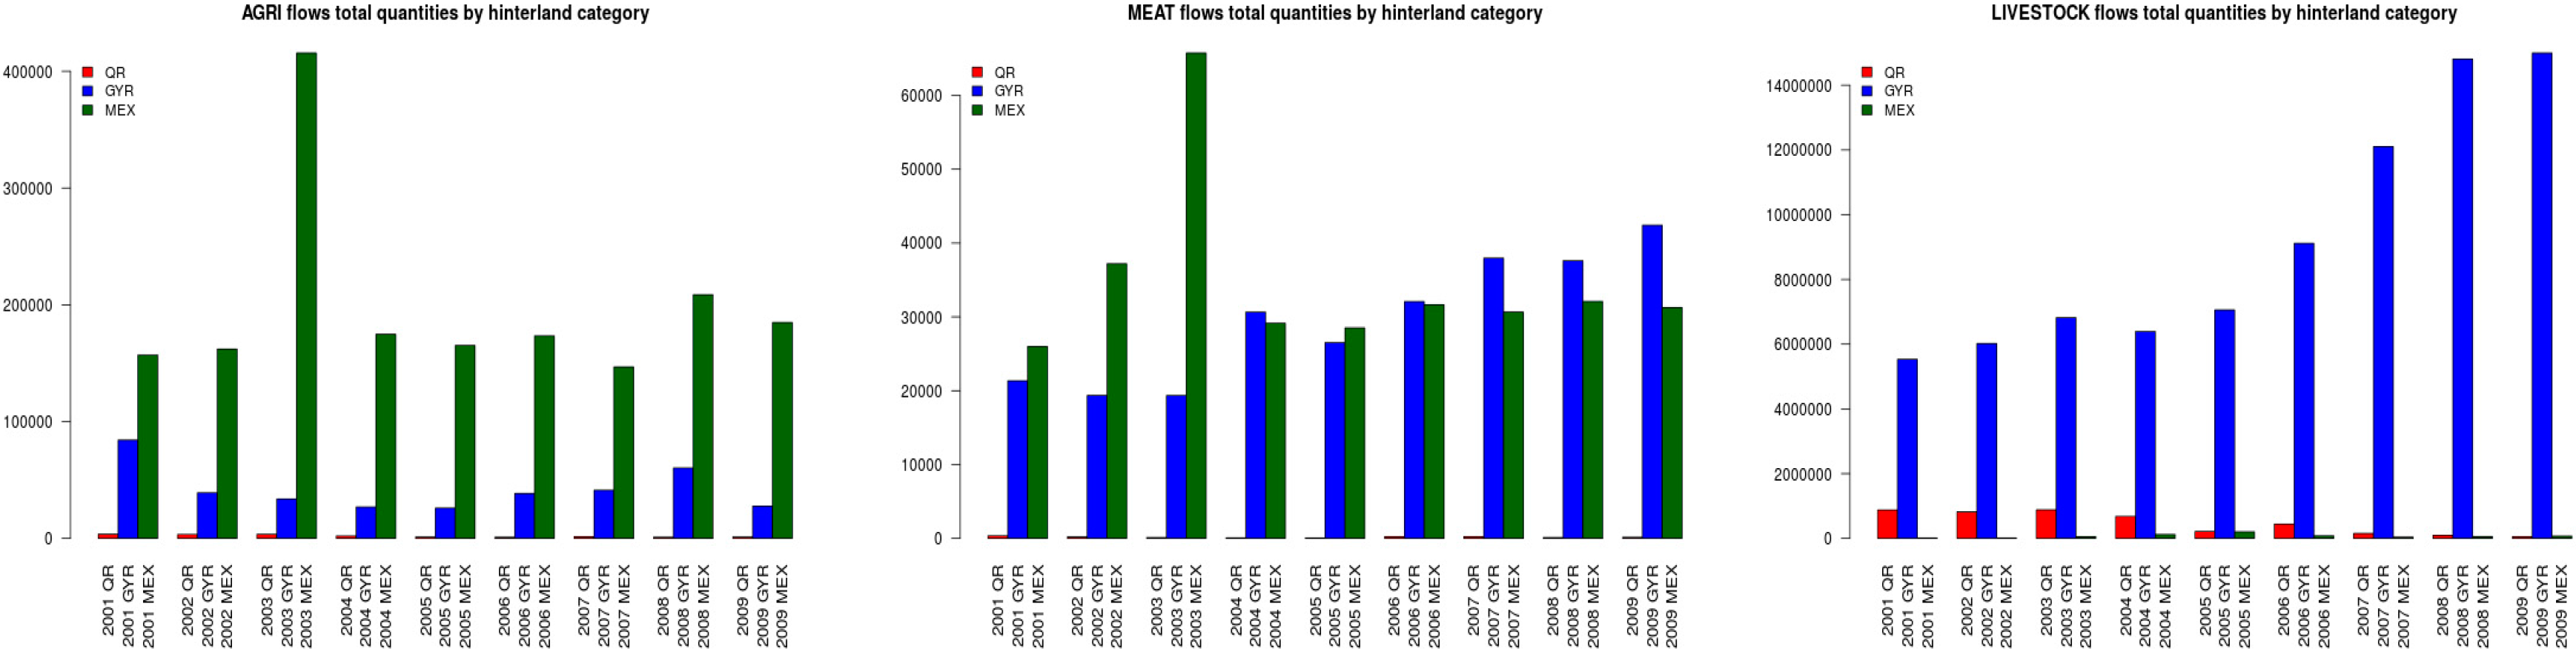
4.1. Main Trends: Inflows, Outflows and Internal Circulation Measured in Number of Shipments and Volumes by Type of Product
4.2. Production and Consumption (Volume Units) by Product
4.3. Decoupling Figures over Time per Each Product Type in Counts and Percentage
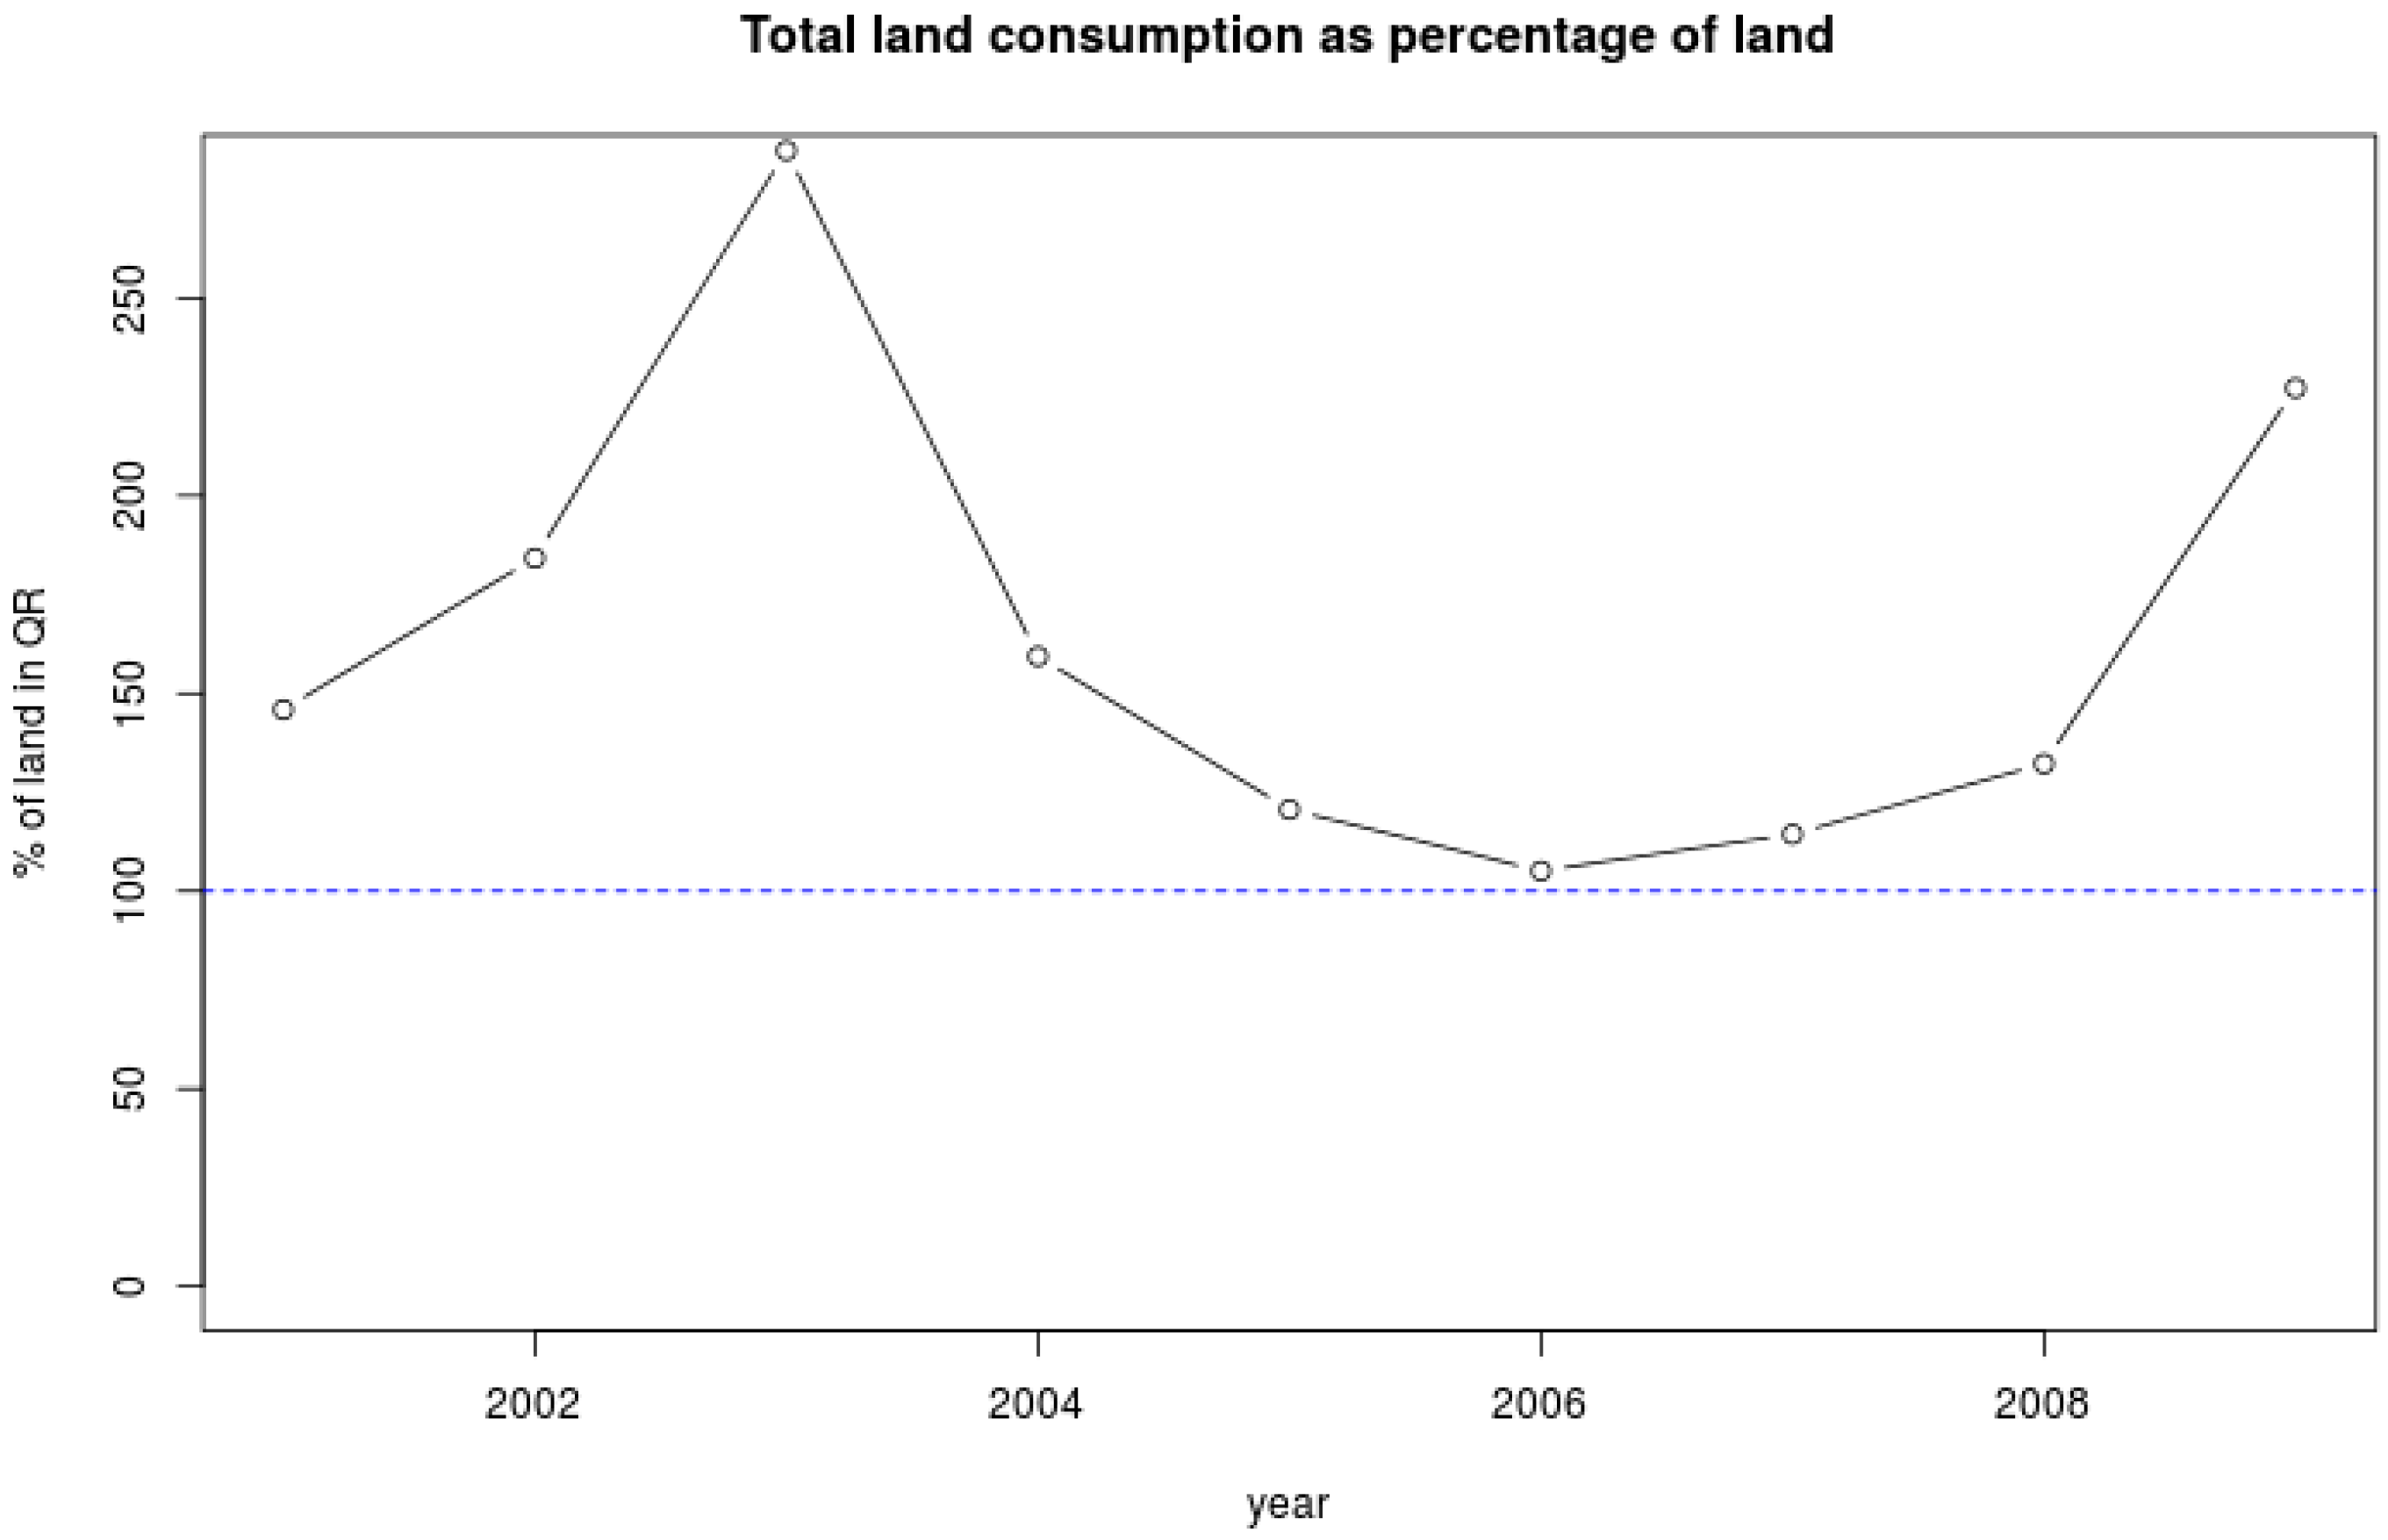
4.4. Land Displacement and Land Consumption vs. Existing Resources
5. Discussion
6. Conclusions
Acknowledgments
Author Contributions
Conflicts of Interest
Appendix A. Conversion from Quantities/Volumes to Area Units by Product Type

| Product | Tn/Ha |
|---|---|
| Molasses | 1.8 |
| Watermelon | 10.23 |
| Orange | 12.13 |
| Papaya | 71.24 |
| Maize | 0.84 |
| Banana | 12.67 |
| Lemon | 17.84 |
| Rice | 5 |
| Tomato | 28.625 |
| Sugar | 53.15 |
| Habanero Chile | 10 |
| Avocado | 20.46 |
| Sorgo | 2.92 |
| Corn the cob | 5.23 |
| Jalapeño Chile | 10.039 |
| Type | Head/Ha |
|---|---|
| Adult Cow | 1 |
| Weaned Calves | 1.43 |
| 1–2 year old Calves | 1.54 |
| Unweaned male calves | 2.5 |
| Sheep | 12.5 |
| Goat | 6.25 |
| Horse | 1.25 |
| Pig | 5 |
| Product | Head/HA |
|---|---|
| Poultry | 0.64 |
| Bovine meat | 1.352 |
| Pork meat | 1.352 |
| Dairy | 0.123 |
| Eggs (pasteurized) | 0.569 |
| Sheep meat | 1.352 |
References
- Steffen, W.; Sanderson, A.; Tyson, P.D.; Jäger, J.; Matson, P.A.; Moore, B., III; Oldfield, F.; Richardson, K.; Schellnhuber, H.J.; Turner, B.L.; et al. Global Change and the Earth System: A Planet under Pressure; Springer: Berlin/Heidelberg, Germany; New York, NY, USA, 2004. [Google Scholar]
- Carpenter, S.R.; Mooney, H.A.; Agard, J.; Capistrano, D.; DeFries, R.S.; Díaz, S.; Dietz, T.; Duralappah, A.K.; Oteng-Yeboah, A.; Perelral, H.M.; et al. Science for managing ecosystem services: Beyond the Millennium Ecosystem Assessment. Proc. Natl. Acad. Sci. USA 2009, 106, 1305–1312. [Google Scholar] [CrossRef] [PubMed]
- De Fries, R.S.; Foley, J.A.; Asner, G.P. Land use choices: Balancing human needs and ecosystem function. Front. Ecol. Environ. 2004, 2, 249–257. [Google Scholar] [CrossRef]
- Phalan, B.; Onial, M.; Balmford, A.; Green, R.E. Reconciling Food Production and Biodiversity Conservation: Land Sharing and Land Sparing Compared. Science 2011, 333, 1289–1291. [Google Scholar] [CrossRef] [PubMed]
- Kastner, T.; Rivas, M.J.I.; Koch, W.; Nonhebel, S. Global changes in diets and the consequences for land requirements for food. Proc. Natl. Acad. Sci. USA 2012, 109, 6868–6872. [Google Scholar] [CrossRef] [PubMed]
- Alexander, P.; Rounsevell, M.D.A.; Dislich, C.; Dodson, J.R.; Engström, K.; Moran, D. Drivers for global agricultural land use change: The nexus of diet, population, yield and bioenergy. Glob. Environ. Chang. 2015, 35, 138–147. [Google Scholar] [CrossRef]
- Meyfroidt, P.; Lambin, E.F.; Erb, K.-H.; Hertel, T. Globalization of land use: Distant drivers of land change and geographic displacement of land use. Curr. Opin. Environ. Sustain. 2013, 5, 438–444. [Google Scholar] [CrossRef]
- Weinzettel, J.; Hertwich, E.G.; Peters, G.P.; Steen-Olsen, K.; Galli, A. Affluence drives the global displacement of land use. Glob. Environ. Chang. 2013, 23, 433–438. [Google Scholar] [CrossRef]
- D’Odorico, P.; Carr, J.A.; Laio, F.; Ridolfi, L.; Vandoni, S. Feeding humanity through global food trade. Earth’s Future 2014, 2, 458–469. [Google Scholar] [CrossRef]
- Hubacek, K.; Feng, K.; Chen, B.; Kagawa, S. Linking Local Consumption to Global Impacts. J. Ind. Ecol. 2016, 20, 382–386. [Google Scholar] [CrossRef]
- Davis, K.F.; Rulli, M.C.; D’Odorico, P. The global land rush and climate change. Earth’s Future 2015, 3, 298–311. [Google Scholar] [CrossRef] [Green Version]
- Ostrom, E. Polycentric systems for coping with collective action and global environmental change. Glob. Environ. Chang. 2010, 20, 550–557. [Google Scholar] [CrossRef]
- Sikor, T.; Auld, G.; Bebbington, A.J.; Benjaminsen, T.A.; Gentry, B.S.; Hunsberger, C.; Izac, A.M.; Margulis, M.E.; Plieninger, T.; Schroeder, H.; et al. Global land governance: From territory to flow? Curr. Opin. Environ. Sustain. 2013, 5, 522–527. [Google Scholar] [CrossRef]
- Turner, B.L.; Lambin, E.; Reenberg, A. The Emergence of Land Change Science for Global Environmental Change and Sustainability. Proc. Natl. Acad. Sci. USA 2007, 104, 20666–20671. [Google Scholar] [CrossRef] [PubMed]
- Rounsevell, M.D.; Pedroli, B.; Erb, K.H.; Gramberger, M.; Busck, A.G.; Haberl, H.; Kristensen, S.; Kuemmerle, T.; Lavorel, S.; Lindner, M.; et al. Challenges for land system science. Land Use Policy 2012, 29, 899–910. [Google Scholar] [CrossRef]
- Wackernagel, M.; Rees, W. Our Ecological Footprint: Reducing Human Impact on the Earth; New Society Publishers: Gabriela Island, BC, Canada, 1996. [Google Scholar]
- Walker, R. Urban sprawl and natural areas encroachment: Linking land cover change and economic development in the Florida Everglades. Ecol. Econ. 2001, 37, 357–369. [Google Scholar] [CrossRef]
- Seto, K.C.; de Groot, R.; Bringezu, S.; Erb, K.; Graedel, T.E.; Ramankutty, N.; Reenberg, A.; Schmidt, O.J.; Skole, D.L. Stocks, flows, and prospects of land. In Linkages of Sustainability; Graedel, T.E., Van der Voet, E., Eds.; Strüngman Forum: Cambridge, UK, 2009. [Google Scholar]
- Seto, K.C.; Reenberg, A.; Boone, C.G.; Fragkias, M.; Haase, D.; Langanke, T.; Marcotullio, P.; Munroe, D.K.; Olah, B.; Simon, D. Urban land teleconnections and sustainability. Proc. Natl. Acad. Sci. USA 2012, 109, 7687–7692. [Google Scholar] [CrossRef] [PubMed]
- Meyfroidt, P.; Lambin, E.F. Forest transition in Vietnam and displacement of deforestation abroad. Proc. Natl. Acad. Sci. USA 2009, 106, 16139–16144. [Google Scholar] [CrossRef] [PubMed]
- Meyfroidt, P.; Rudel, T.K.; Lambin, E.F. Forest transitions, trade, and the global displacement of land use. Proc. Natl. Acad. Sci. USA 2010, 107, 20917–20922. [Google Scholar] [CrossRef] [PubMed]
- Friis, C.; Reenberg, A. Land Grab in Africa: Emerging Land System Drivers in a Teleconnected World; GLP-IPO: Copenhagen, Denmark, 2010. [Google Scholar]
- Turner, M.G. Landscape ecology: The effect of pattern on process. Annu. Rev. Ecol. Syst. 1989, 20, 171–197. [Google Scholar] [CrossRef]
- Von Thünen, J.H. Der isolierte Staat in Beziehung auf Landwirtschaft und Nationalökonomie. In Von Thünen’s Isolated State; Hall, P., Ed.; Pergamon Press: Oxford, UK, 1966; (Original in 1876 In German). [Google Scholar]
- Angelsen, A. Forest Cover Change in Space and Time: Combining the von Thunen and Forest Transition Theories. World Bank Policy Working Paper 4117. 2007. Available online: https://openknowledge.worldbank.org/handle/10986/7147 (accessed on 28 October 2016).
- Grau, R.; Kuemmerle, T.; Macchi, L. Beyond land sparing versus land sharing: Environmental heterogeneity, globalization and the balance between agricultural production and nature conservation. Curr. Opin. Environ. Sustain. 2013, 5, 477–483. [Google Scholar] [CrossRef]
- Mather, A.S. The forest transition. Area 1992, 24, 367–79. [Google Scholar]
- Rudel, T.K.; Coomes, O.; Moran, E.; Angelsen, A.; Achard, F.; Lambinand, E.; Xu, J. Forest transitions: Towards an understanding of global land use change. Glob. Environ. Chang. 2005, 14, 23–31. [Google Scholar] [CrossRef]
- Perz, S.G. Grand Theory and Context Specificity in the Study of Forest Dynamics: Forest Transition Theory and Other Directions. Prof. Geogr. 2007, 59, 105–114. [Google Scholar] [CrossRef]
- Rudel, T.; Schneider, L.C.; Uriarte, M.; Turner, B.L.; DeFries, R.; Lawrence, D.; Geoghegan, J.G.; Hecht, S.; Ickowitz, A.; Lambin, E.; et al. Agricultural Intensification and Changes in Cultivated Areas, 1970–2005. Proc. Natl. Acad. Sci. USA 2010, 106, 20675–20680. [Google Scholar] [CrossRef] [PubMed]
- Mather, A.S.; Needle, C.L. The forest transition: A theoretical basis. Area 1998, 30, 117–124. [Google Scholar] [CrossRef]
- Hecht, S. Invisible forests: The political ecology of forest resurgence in El Salvador. In Liberation Ecologies: Environment, Development, Social Movements; Peet, R., Watts, M.W., Eds.; Routledge: London, UK; New York, NY, USA, 2004. [Google Scholar]
- Schmook, B.; Radel, C. International labor migration from a tropical development frontier: Globalizing households and an incipient forest transition: The Southern Yucatán case. Hum. Ecol. 2008, 36, 891–908. [Google Scholar] [CrossRef]
- Turner, B.L. Sustainability and forest transitions in the southern Yucatán: The land architecture approach. Land Use Policy 2010, 27, 170–179. [Google Scholar] [CrossRef]
- Walker, R.T.; Harwell, C. Land use dynamics and ecological transition: The case of South Florida. Urban Ecosyst. 1997, 1, 37–47. [Google Scholar] [CrossRef]
- Bruckner, M.; Fischer, G.; Tramberend, S.; Giljum, S. Measuring telecouplings in the global land system: A review and comparative evaluation of land footprint accounting methods. Ecol. Econ. 2015, 114, 11–21. [Google Scholar] [CrossRef]
- Chaudhary, A.; Kastner, T. Land use biodiversity impacts embodied in international food trade. Glob. Environ. Chang. 2016, 38, 195–204. [Google Scholar] [CrossRef]
- Walker, R.; Solecki, W.D. Theorizing land-cover and land-use change: The case of the Florida Everglades and its degradation. Ann. Assoc. Am. Geogr. 2004, 94, 311–238. [Google Scholar] [CrossRef]
- Córdoba Ordóñez, J. Propuesta de tipificación municipal del comportamiento demográfico en el estado de Yucatán (México). Anales de Geografía de la Universidad Complutense 1999, 19, 47–70. (In Spanish) [Google Scholar]
- Lutz, W.; Prieto, L.; Sanderson, W. (Eds.) Population, Development and Environment on the Yucatan Peninsula: From Ancient Maya to 2030; International Institute for Applied Systems Analysis: Luxemburg, 2000.
- Farris, N.M. Maya Society under Colonial Rule: The Collective Enterprise of Survival; Princeton Press: Princeton, NJ, USA, 1984. [Google Scholar]
- Klepeis, P.; Turner, B.L. Integrated land history and global change science: The example of the Southern Yucatan Peninsular Region project. Land Use Policy 2001, 18, 27–39. [Google Scholar] [CrossRef]
- Macías Zapata, G.A. La Península Fracturada. Conformación Marítima, Social y Forestal del Territorio Federal de Quintana Roo. 1884–1902; Colección Peninsular. Centro de Investigaciones y Estudios Superiores en Antropología Social-CIESAS, Universidad de Quintana Roo: Chetumal, Mexico, 2002. (In Spanish) [Google Scholar]
- Macías Zapata, G.A. (Ed.) El vacío Imaginario. Geopolítica de la Ocupación Territorial en el Caribe Oriental Mexicano; Centro de Investigaciones y Estudios Superiores en Antropología Social-CIESAS, México DF. I Congreso del Estado de Quintana Roo, X Legislatura: Chetumal, Mexico, 2003. (In Spanish)
- Villalobos Gonzales, M.H. El Bosque Sitiado. Asaltos Armados, Concesiones Forestales y Estrategias de Resistencia Durante la Guerra de Castas; Centro de Investigaciones y Estudios Superiores en Antropologia Social: Tlalpan, Mexico, 2006. (In Spanish) [Google Scholar]
- Primack, B.; Bray, D.; Galleti, H.A.; Ponciano, I. Timber, Tourists, and Temples: Conservation and Development in the Maya Forest of Belize, Guatemala, and Mexico; Island Press: Washington, DC, USA, 1988. [Google Scholar]
- Turner, B.L., II; Geoghegan, J.G.; Foster, D.R. (Eds.) Integrated Land Change Science and Tropical Deforestation in the Southern Yucatán: Final Frontiers; Oxford University Press: Oxford, UK, 2004.
- Coll-Hurtado, A.; Godínez Calderón, M.L. La Agricultura en México: Un atlas en Blanco y Negro. Colección Textos Monográficos-Economía; Instituto de Geografía, Universidad Nacional Autónoma de México: Mexico City, Mexico, 2004. (In Spanish) [Google Scholar]
- Klepeis, P.; Vance, C. Neoliberal policy and deforestation in southeastern Mexico: An assessment of the PROCAMPO Program. Econ. Geogr. 2003, 79, 221–240. [Google Scholar] [CrossRef]
- Klepeis, P. Development policies and tropical deforestation in the southern Yucatan peninsula: Centralized and decentralized approaches. Land Degrad. Dev. 2003, 14, 541–561. [Google Scholar] [CrossRef]
- Torres, R.; Momsen, J. Gringolandia: The Construction of a New Tourist Space in Mexico. Ann. Assoc. Am. Geogr. 2005, 95, 314–335. [Google Scholar] [CrossRef]
- Hernández Aguilar, M.L.; Garcia de Fuentes, A.; Córdoba Ordóñez, J. Distribución Territorial de la Producción Agropecuaria en la Península de Yucatán Hacia Fines de Siglo XX; CINVETAV-PNUD-UNAM: Mexico City, Mexico, 2004. (In Spanish) [Google Scholar]
- Flachenberg, H.; Galletti, H. A Forest Management in Quintana Roo, Mexico. In Timber, Tourists, and Temples: Conservation and Development in the Maya Forest of Belize, Guatemala, and Mexico; Primack, B., Bray, D., Galleti, H.A., Ponciano, I., Eds.; Island Press: Mexico City, Mexico, 1998. [Google Scholar]
- Torres Rojo, J.M. Estudio de Tendencias y Perspectivas del Sector Forestal en America Latina Documento de Trabajo. Informe Nacional. México. Secretaria de Medio Ambiente y Recursos Naturales de México (SEMARNAT). 2004. Available online: ftp://ftp.fao.org/docrep/fao/009/j2215s/j2215s00.pdf (accessed on 15 October 2016). (In Spanish)
- Bray, D.B.; Merido Perez, L.; Barrt, D. Los Bosques Comunitarios de México. Manejo Sustentable de Paisajes Forestales. 2011. Available online: http://www.nacionmulticultural.unam.mx/empresasindigenas/docs/2059.pdf (accessed on 7 November 2016).
- SAGARPA. Diagnostico Agropecuario Forestal y Pesquero del Estado de Quintana Roo. 2010. Available online: http://www.sagarpa.gob.mx/Delegaciones/quintanaroo/Lists/Difusin%202009/Attachments/18/Diagn%C3%B3stico_sectorial_QRoo10.pdf (accessed on 1 December 2015).
- Colunga-Garcia, C.; Marin, P.; Larqué Saavedra, A. Naturaleza y Sociedad en el Area Maya: Pasado, Presente y Futuro; CICY-Academia Mexicana de Ciencias: Mérida, Mexico, 2003. (In Spanish) [Google Scholar]
- Islebe, G.A.; Calmé, S.; León-Cortés, J.L.; Schmook, B. Biodiversity and Conservation of the Yucatán Peninsula; Springer: New York, NY, USA, 2015. [Google Scholar]
- Secretaria Nacional del Medio Ambiente–SEMARNAT. 2011. Available online: http://www.semarnat.gob.mx/leyesynormas/Pages/leyessectorfederal.aspx (accessed on 5 July 2010).
- Center for Applied Biodiversity Science (CABS) at Conservation International (CI). El Colegio de la Frontera SUR (ECSUR), Belize Tropical Forest Studies, and Consejo Nacional de Areas Protegidas—World Conservation Society (WCS). 2009. Available online: https://www.ncbi.nlm.nih.gov/pmc/articles/PMC3414527/bin/pone.0042309.s001.zip (accessed on 3 December 2014). [Google Scholar]
- Keys, E. Exploring market based development: Market intermediaries and farmers in Calakmul, Mexico. Geogr. Rev. 2005, 95, 24–46. [Google Scholar] [CrossRef]
- Emel, J.; Neo, H. Killing for profit: Global livestock industries and their socio-ecological implications. In Global Political Ecology; Peet, R., Robbins, P., Watts, M., Eds.; Routledge: London, UK; New York, NY, USA, 2011; pp. 67–83. [Google Scholar]
- Klooster, D. Forest transitions in Mexico: Institutions and forests in a globalized countryside. Prof. Geogr. 2003, 55, 227–237. [Google Scholar]
- Schneider, L.C.; Geoghegan, J. Land abandonment in an agricultural frontier after a plant invasion: The case of bracken fern in southern Yucatán, Mexico. Agric. Resour. Econ. Rev. 2006, 35, 167–177. [Google Scholar] [CrossRef]
- Radel, C.; Schmook, B. Male Transnational Migration and its Linkages to Land-Use Change in a Southern Campeche Ejido. J. Latin Am. Geogr. 2008, 7, 59–83. [Google Scholar] [CrossRef]
- Rueda, X. Understanding deforestation in the southern Yucatán: Insights from a sub-regional, multi-temporal analysis. Reg. Environ. Chang. 2010, 10, 175–190. [Google Scholar] [CrossRef]
- Córdoba Ordóñez, J.; Fuentes, G.; Azcárate, C. Modernismo ambiental frente a tradición: Problemas y perspectivas en el caso de la península de Yucatan (Mexico). Anales de Geografía de la Universidad Complutense 2000, 20, 235–251. (In Spanish) [Google Scholar]
- Eastmond, A. Agricultura y Ganadería. In Atlas de Procesos Territoriales de Yucatán; García de Fuentes, A., Córdoba Ordóñez, J., Eds.; Universidad Autónoma de Yucatán: Mérida, Mexico, 1999. (In Spanish) [Google Scholar]
- Jutila, S.T. Spatial Macroeconomic models. Pap. Reginal Sci. 1973, 30, 39–57. [Google Scholar] [CrossRef]
- Millones, M. Settlement Classification Using a Rural-Urban Continuum in Cusco, Peru. Master’s Thesis, University of Miami, Coral Gables, FL, USA, 2006. [Google Scholar]
- Servicio de Información Agrícola y Peruaria—SIAP. Available online: http://infosiap.siap.gob.mx:8080/agricola_siap_gobmx/ResumenDelegacion.do (accessed on 15 October 2016).
- Paturnau, J.M. Alternative Uses of Sugarcane and Its by Products in Agroindustries. Available online: http://www.fao.org/docrep/003/s8850e/S8850E03.htm (accessed on 15 October 2016).
- John Pix Pocketbook. Available online: http://www.thepocketbook.biz/ (accessed on 15 October 2016).
- The Landshare Project. Available online: http://www.landshare.org/uploads/7/5/4/1/7541639/data_and_assumptions.pdf (accessed on 15 October 2016).


| Data Item/Product | Source/Provider | Spatial Scale: | Temporal Scale: | Variables Derived | Type of Data |
|---|---|---|---|---|---|
| Flow of forest, agricultural and livestock products | Comité Estatal para el fomento y protección pecuaria del estado de Quintana Roo S.C. (CEFPPQR) | State and Municipal | 2001–2009 - daily | hinterland indicator transactions/shipment frequency AGRI = agricultural production LIVESTOCK = animal production MEAT = meat and other animal processed product including honey | Counts Metric Tons Head count |
| Southern Mexico Forest Cover and Clearance for c. 1990 to c. 2007 digital map | Center for Applied Biodiveristy—CABS 2009. Derived from Landsat TM and Enhanced Thematic Mapping Landsat (ETM+) imagery | - Southern México states - ~30 m | Compilations for 1990, 2000 and 2007 | Land change/persistence classes: Forest persistence (FP) Non-forest persistence (NFP) Forest-to-non-forest-change (CH) | Categorical |
| TYPE | Description |
|---|---|
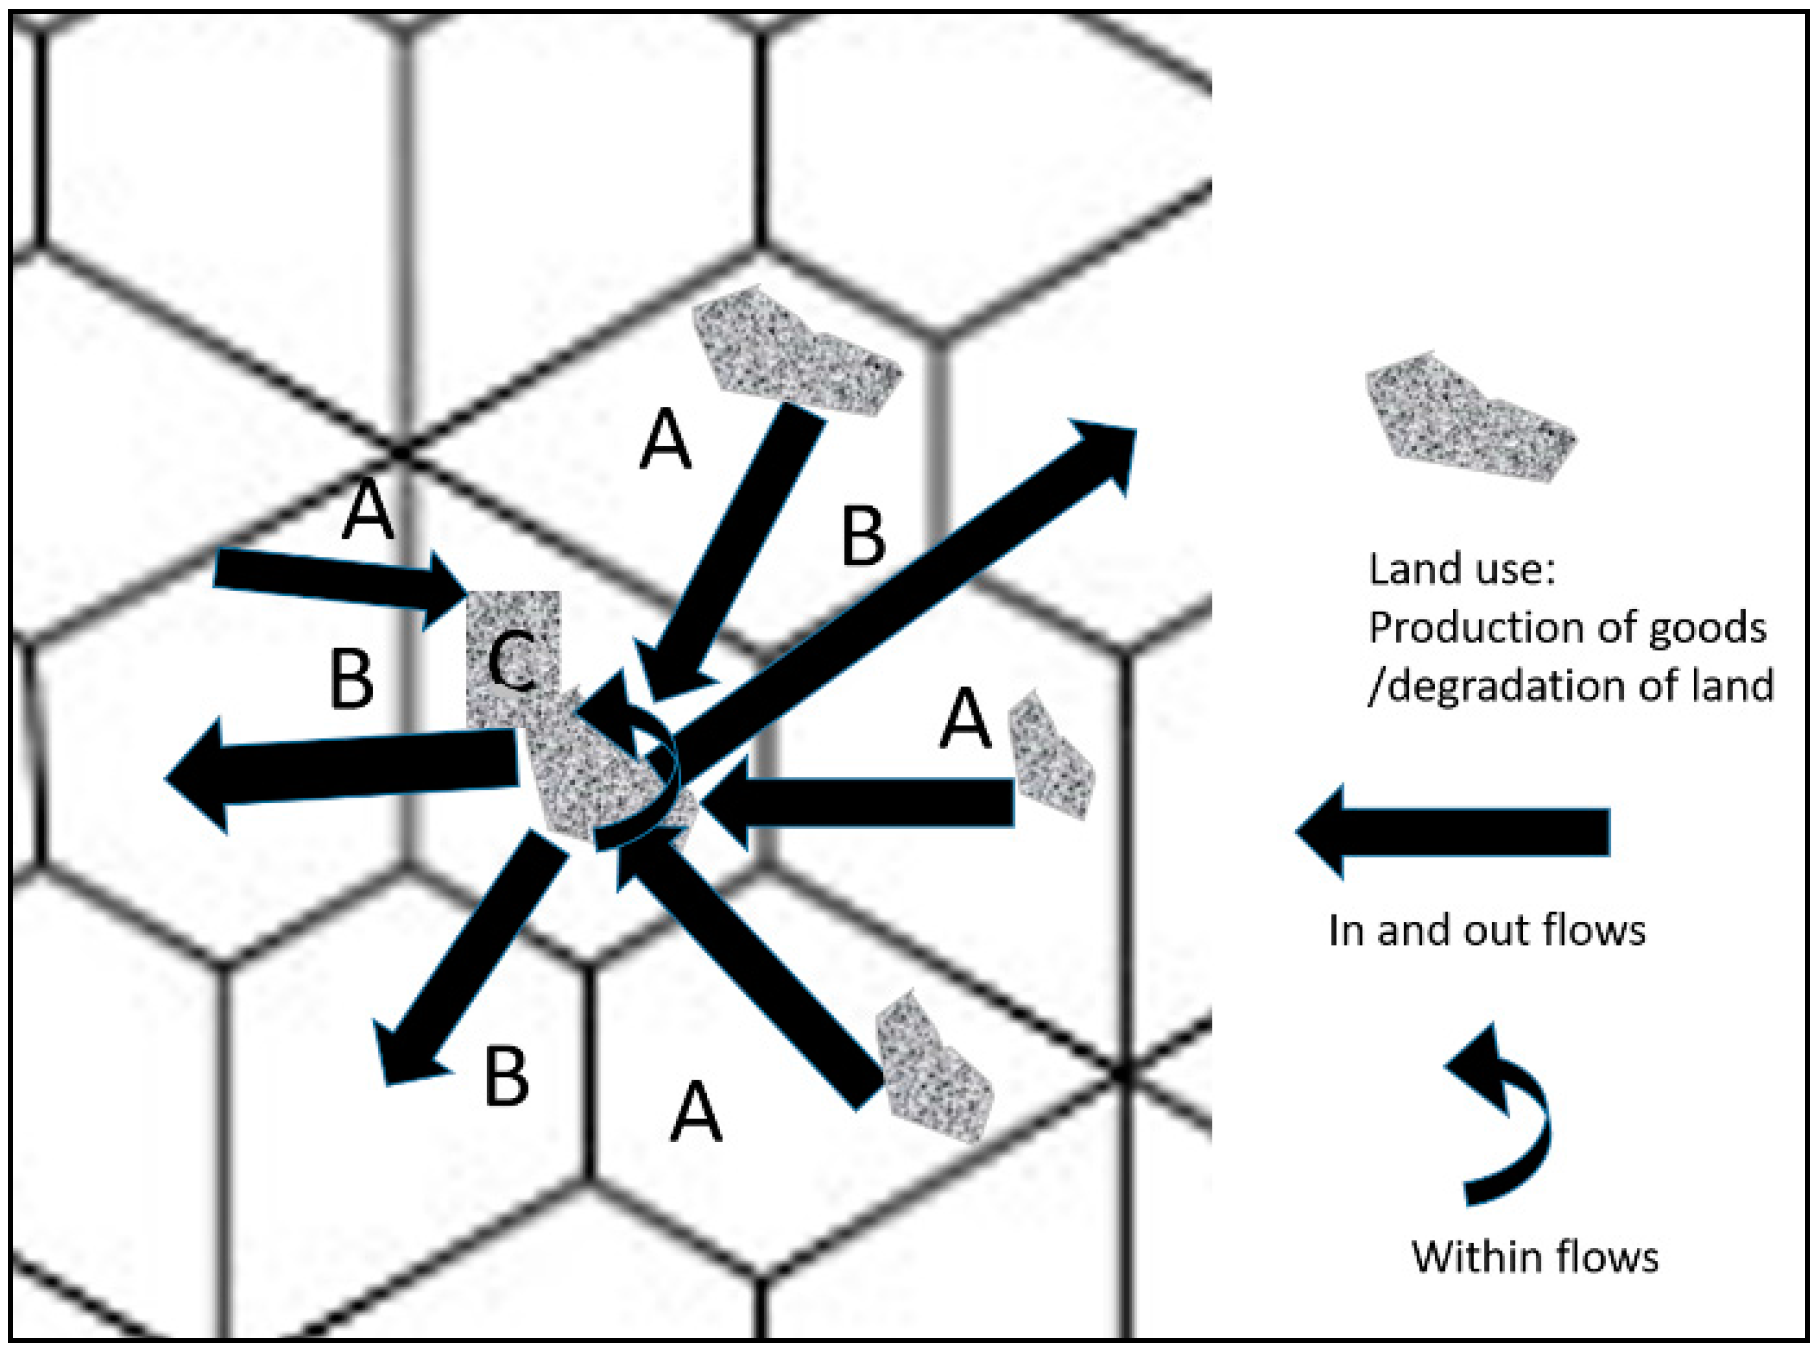
| A (inflows) | Land displaced from QRoo to GYR and MEX |
| B (outflows) | Land displaced from GYR and MEX to QRoo |
| C (wthinin flows) | Local internal land consumption/demand |
| B + C | Total potential land used for food production in QRoo linked to either internal or external consumption/demand |
| A + C | Total land demand/consumption to meet consumption levels in QRoo Land used in GYR and MEX and QRoo to be consumed/demanded by QRoo |
| A + B + C | Total impact of food production and consumption on land in anchor region in a “business as usual” scenario |
| Flow | Direction | AGRI (%) | LIVESTOCK (%) | MEAT (%) | Total (%) |
|---|---|---|---|---|---|
| Inflow (A) | GYR–QR | 62,409 | 44,719 | 44,317 | 151,445 |
| (38.92) | (61.65) | (26.29) | (37.83) | ||
| Inflow (A) | MEX–QR | 71,428 | 2361 | 97,170 | 170,959 |
| (44.54) | (3.31) | (57.64) | (42.71) | ||
| Subtotal (A) | 133,837 | 47,080 | 141,487 | 322,404 | |
| (83.46) | (65.96) | (83.93) | (80.54) | ||
| Outflow (B) | QR–GYR | 11,645 | 6388 | 20,459 | 38,492 |
| (7.26) | (8.95) | (12.14) | (9.62) | ||
| Outflow (B) | QR–MEX | 7517 | 1426 | 4740 | 13,683 |
| (4.69) | (2) | (2.81) | (3.42) | ||
| Subtotal (B) | 19,162 | 7814 | 25,199 | 52,175 | |
| (11.95) | (10.95) | (14.95) | (13.03) | ||
| Within (C) | QR–QR | 7355 | 16,487 | 1889 | 25,731 |
| (4.59) | (23.10) | (1.12) | (6.43) | ||
| Total % | 160,354 | 71,381 | 168,575 | 400,310 | |
| (100) | (100) | (100) | (100) |
| Flow | Direction | AGRI | LIVESTOCK | MEAT | Total |
|---|---|---|---|---|---|
| (%) | (%) | (%) | (%) | ||
| Inflow (A) | GYR–QR | 309,780.5 | 67,467,247.02 | 251,067.23 | 68,028,094.74 |
| (14.18) | (76.92) | (43.20) | (75.19) | ||
| Inflow (A) | MEX–QR | 1,376,223.95 | 279,599.4 | 308,843.23 | 1,964,666.58 |
| (63) | (0.32) | (53.15) | (2.17) | ||
| Subtotal | 1,686,004.45 | 67,746,846.42 | 559,910.46 | 69,992,761.33 | |
| (77.18) | (77.24) | (96.35) | (77.36) | ||
| Outflow (B) | QR–GYR | 67,744.15 | 15,374,247 | 16,271.04 | 15,458,262.20 |
| (3.10) | (15.53) | (2.80) | (17.09) | ||
| Outflow (B) | QR–MEX | 412,193.56 | 374,706 | 3410.19 | 789,709.75 |
| (18.87) | (0.43) | (0.59) | (0.87) | ||
| Subtotal | 479,937.71 | 15,748,353 | 19,681.24 | 16,247,971.95 | |
| (21.97) | (17.95) | (3.39) | (17.96) | ||
| Within (C) | QR–QR | 18,547 | 4,216,209 | 1530.19 | 4,236,287.17 |
| (0.85) | (4.81) | (0.26) | (4.68) | ||
| Total | 2,184,490.14 | 87,711,408 | 581,121.88 | 90,477,020.45 | |
| % | 100 | 100 | (100) | (100) |
© 2016 by the authors; licensee MDPI, Basel, Switzerland. This article is an open access article distributed under the terms and conditions of the Creative Commons Attribution (CC-BY) license (http://creativecommons.org/licenses/by/4.0/).
Share and Cite
Millones, M.; Parmentier, B.; Rogan, J.; Schmook, B. Using Food Flow Data to Assess Sustainability: Land Use Displacement and Regional Decoupling in Quintana Roo, Mexico. Sustainability 2016, 8, 1145. https://doi.org/10.3390/su8111145
Millones M, Parmentier B, Rogan J, Schmook B. Using Food Flow Data to Assess Sustainability: Land Use Displacement and Regional Decoupling in Quintana Roo, Mexico. Sustainability. 2016; 8(11):1145. https://doi.org/10.3390/su8111145
Chicago/Turabian StyleMillones, Marco, Benoit Parmentier, John Rogan, and Birgit Schmook. 2016. "Using Food Flow Data to Assess Sustainability: Land Use Displacement and Regional Decoupling in Quintana Roo, Mexico" Sustainability 8, no. 11: 1145. https://doi.org/10.3390/su8111145