Article

Experimental and Analytical Studies on the Utilization of Biowastes Available in an Educational Institution in India

Department of Mechanical Engineering, St. Xavier’s Catholic College of Engineering, Nagercoil, Tamilnadu-629003, India
*
Author to whom correspondence should be addressed.
Sustainability 2016, 8(11), 1128; https://doi.org/10.3390/su8111128
Submission received: 13 September 2016 / Revised: 26 October 2016 / Accepted: 30 October 2016 / Published: 3 November 2016

Abstract

:
The biowastes generated in an educational institution are not stable throughout the period of a year. Therefore, analytical and experimental studies were conducted to predict the quality and the quantity of biogas produced from wastes such as cow dung, rice waste, mixed rice waste, and vegetable waste that were available in an educational institution. The study shows that the methane composition in the biogas throughout a year-long period, that includes both academic and non-academic schedules is between 52.28% and 58%, and it is suitable for any relevant application. It also could substitute 30% to 35% of Liquefied Petroleum Gas (LPG) used in the campus.

1. Introduction

Biogas is one of the popular renewable energy sources which is cost-effective and eco-friendly. The biowaste generated in the kitchen and other places of an educational institution can be collected systematically and used to produce biogas through anaerobic digestion. Biogas obtained from kitchen waste not only minimizes (soil pollution) landfill waste but also reduces the emission of methane (CH4) and carbon dioxide (CO2) [1]. Kitchen waste can be effectively used to produce biogas, and it could be an alternative fuel for Liquid Petroleum Gas (LPG) [2,3,4]. It reduces waste accumulation, and is also a cleaner way to help meet increasing energy demands [5,6].
Anaerobic digestion of organic materials produces biogas with 50%–60% of CH4, 35% of CO2, 4% of Hydrogen Sulphide (H2S), and traces of water vapour. The composition of the above components in biogas varies for different biowastes, and many methods are being used to study the different compositions [7,8,9]. Even though it is an inexpensive gas, the higher methane content of 95%–99% in LPG and Compressed Natural Gas (CNG) inhibits the commercialization of biogas. Methane, in the form of biogas, is a good substitute for conventional energy used in heating and power generation. The residue or digestate obtained from the biogas plant contains a higher percentage of nitrogen, phosphates, and other nutrients, and it could be used as a high quality natural manure for plants [10,11].
Using the Life Cycle Assessment (LCA) methodology, fixed dome and plastic tubular digesters were compared based on the production cost and environmental impact. The comparison shows that the tubular digester is simple in construction, easy to handle, applicable to any place, and environmentally-friendly [10]. A comparison based on techno-economic advantages and environmental safety shows that the landfill system is the worst method for solid waste management. An energy generation system that can effectively utilize municipal waste is of great importance in handling the solid waste. Incineration methods can be considered as other options for electricity generation [11]. Though various technologies related to energy recovery and the modality of waste disposal are available for waste management, it is difficult to select the proper technology without knowing the composition of the waste, plant size, and location [12]. The energy demands of an organisation may not be fully covered by the biogas technologies, but its contribution plays a major role towards meeting those energy demands with an environmentally-friendly approach [13]. The technological features, environmental impacts, economic advantages, quantity of availability, and energy flow patterns decide the feasibility of selecting a plant size for a particular location [14]. The profitability of this method is generally affected by the challenges encountered in the collection of wastes, transportation costs, and landfill fees needed to manage the leftover ashes and clinkers [15]. Since conventional thermal treatments such as combustion, gasification, and pyrolysis may not be used for energy generation from Municipal Solid Waste (MSW), Rice Waste (RW), Cow Dung (CD), etc., anaerobic digestion can be considered as the best option for energy generation from the above wastes, which are normally available in an educational institution. It is also reported that the food waste generated in schools can be effectively used for biogas generation, and it can be recycled through composting in order to produce useful end products [16,17,18]. Most of the previous studies focused on the constant loading rate of biowaste to predict biogas generation. In an educational institution, the availability of biowaste varies based on student activities [19], and therefore intensive study for one full academic year is needed to predict the possibility of utilizing the energy generated from biowaste.
In this work, biowastes such as rice waste (RW), rice waste mixed with vegetable, meat, and fish (MRW), and vegetable waste (VW) produced in hostels and canteens are taken as feedstock along with cow dung (CD) which is obtained from the cattle farm available inside the campus. An experimental study has been carried out with four anaerobic digesters to predict the quality and the quantity of the methane yield, and a toolbox in MATLAB (R2011b of MathWorks, Natick, MA, USA) that uses the Anaerobic Digestion Model 1 (ADM1) has been used in the mathematical model [20].

2. Materials and Methods

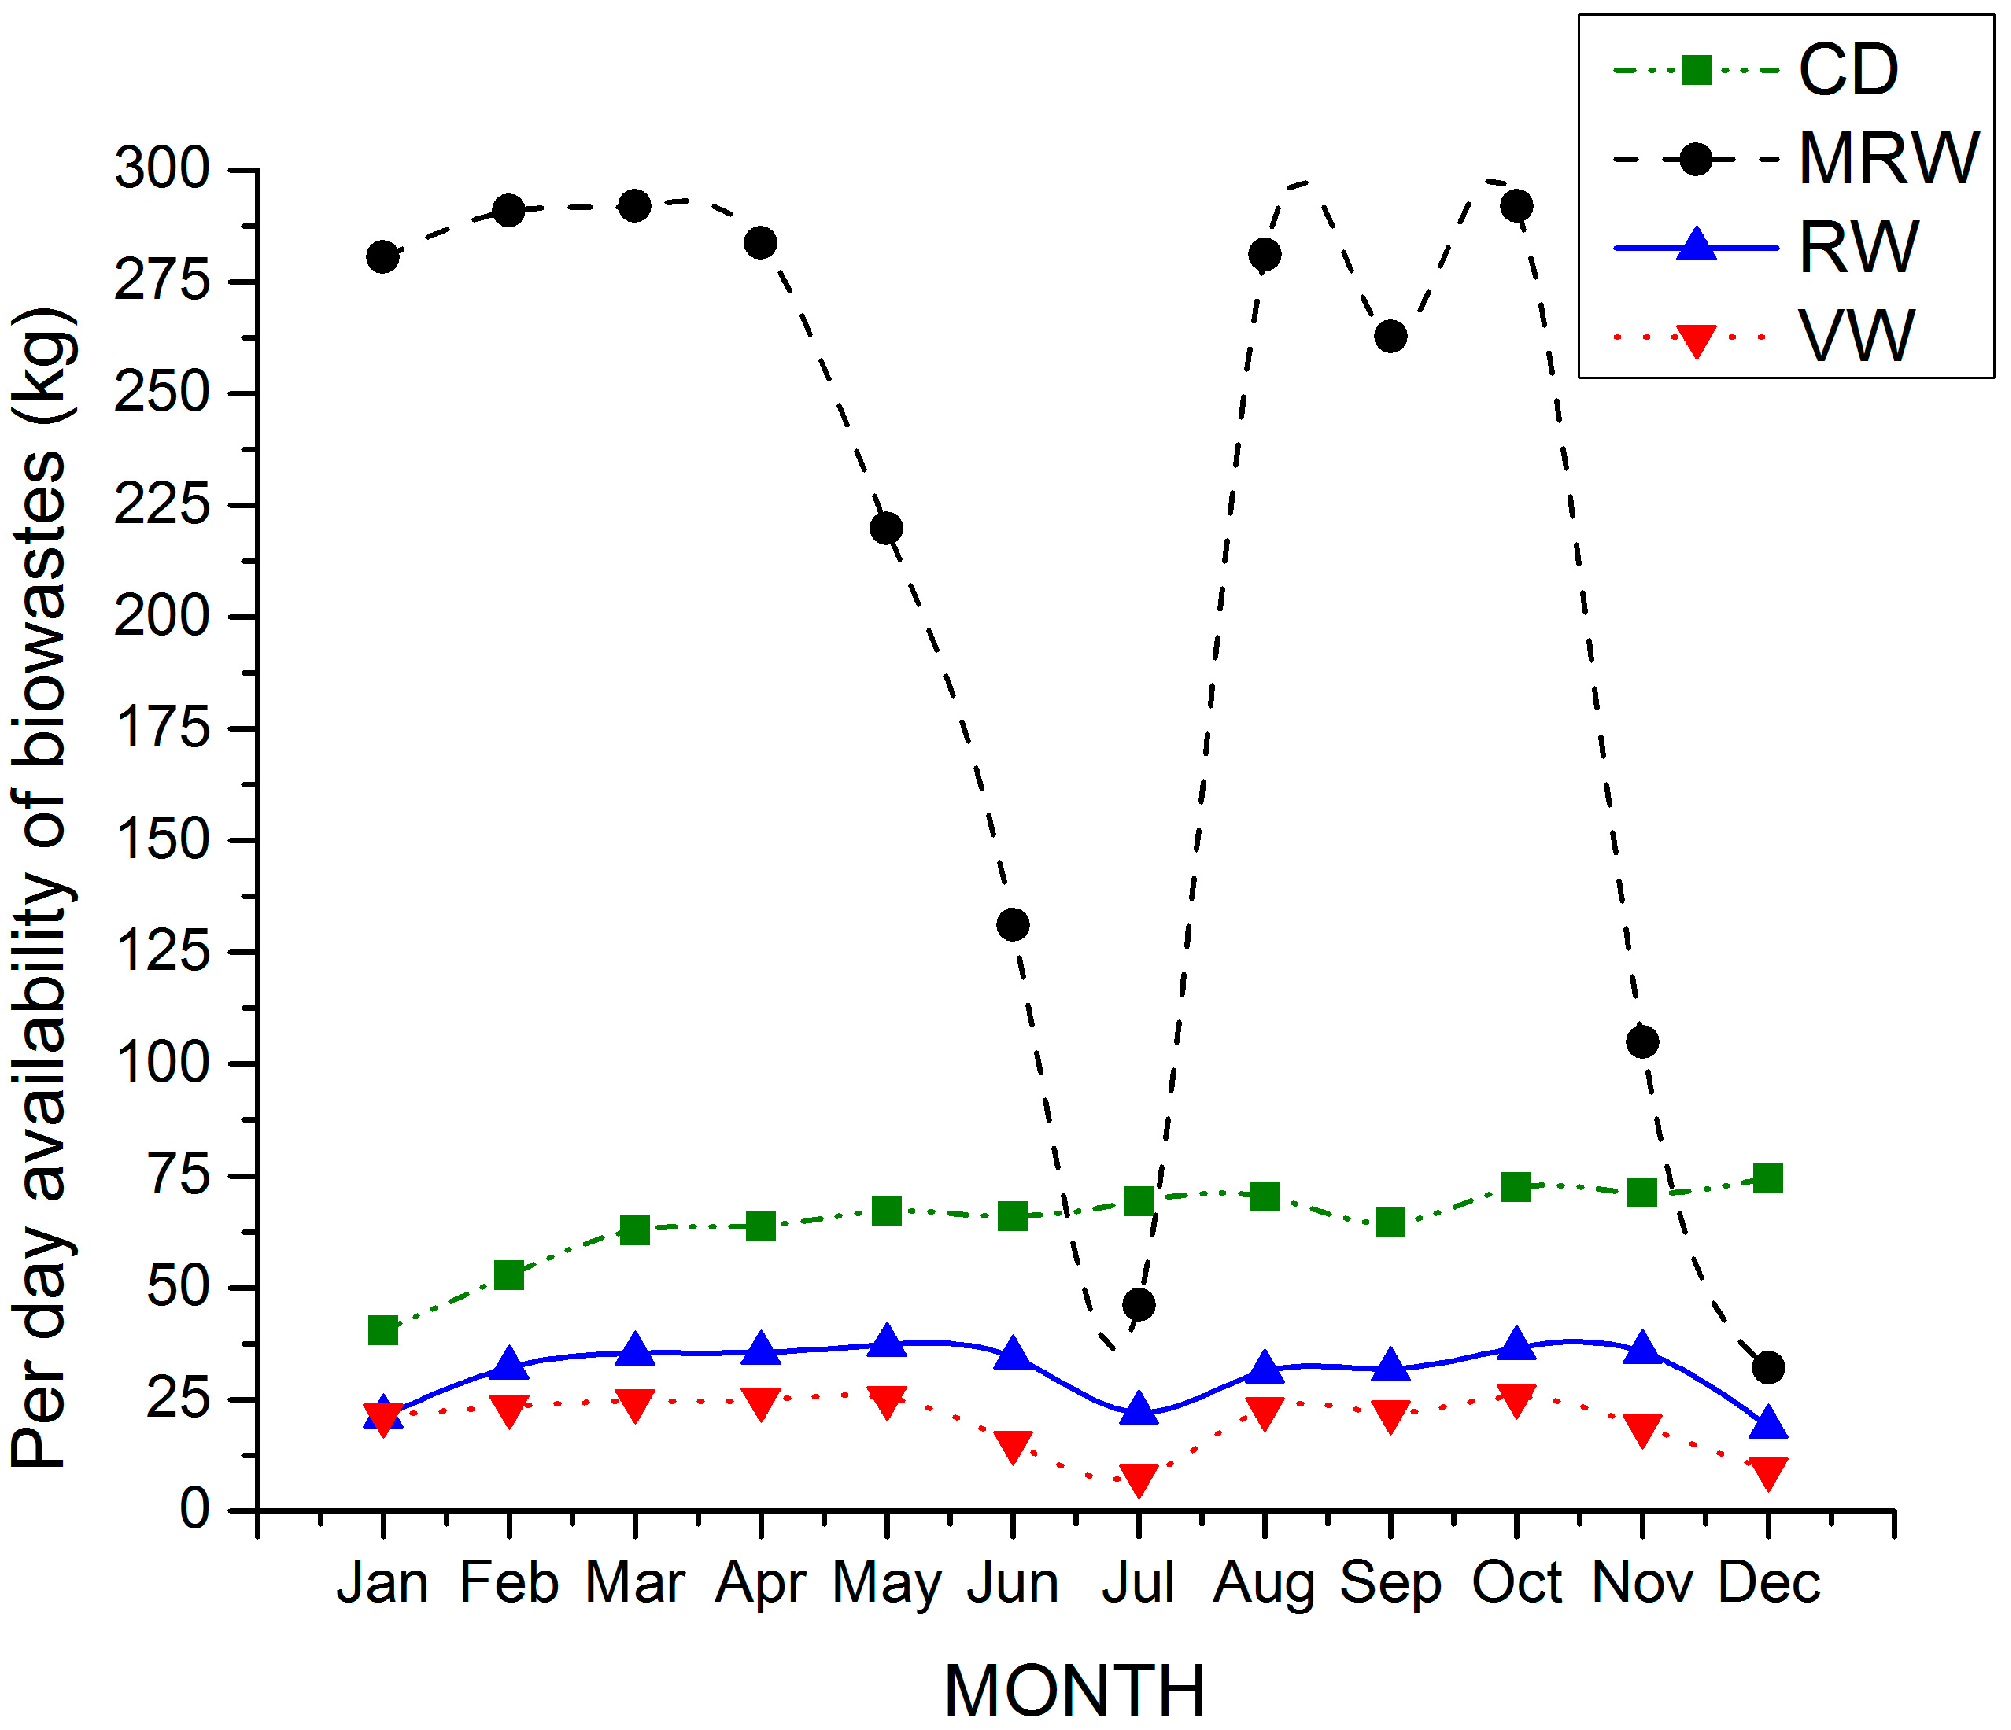
2.1. Identification and Characterization of Feedstock

The feedstock was collected from an educational institution situated in the southern part of India. The campus considered in this study is an engineering institution consisting of approximately 2700 students and 350 staff. Of this population, only 20% of the people reside inside the campus, and the male/female ratio is 45:55. Apart from cow dung, the wasted rice, vegetable, meat, fruits, etc., were the common biowastes generated in the campus. This biowaste was disposed of in a large amount without any use. The average biowaste for every month was calculated and is plotted in Figure 1. Feedstock availability data was collected from the hostels and the canteens on a daily basis.
The chemical properties which decide the quality of biowastes are pH, Total Solids (TS), and Volatile Solids (VS), and they were measured as per the standard procedure [21]. Table 1 shows the chemical properties of the biowastes obtained from the preliminary tests.
The percentage of TS was determined as per the standard procedure American Public Health Association (APHA, 1995). The percentage of TS in each sample is calculated by
T S = [ W d W w ] × 100
where Wd and Ww are the weights of the dry and wet samples, respectively. VS is calculated by
V S = [ W d W a W a ] × 100
where Wd and Wa are the weights of dry biowaste and the dry ash left after igniting the sample in a muffle furnace.
The pH of the biowastes (CD, RW, MRW, and VW) were determined with a pH electrode with an accuracy of 0.05%, which enabled a fast and accurate quantitative analysis of the sample [21].

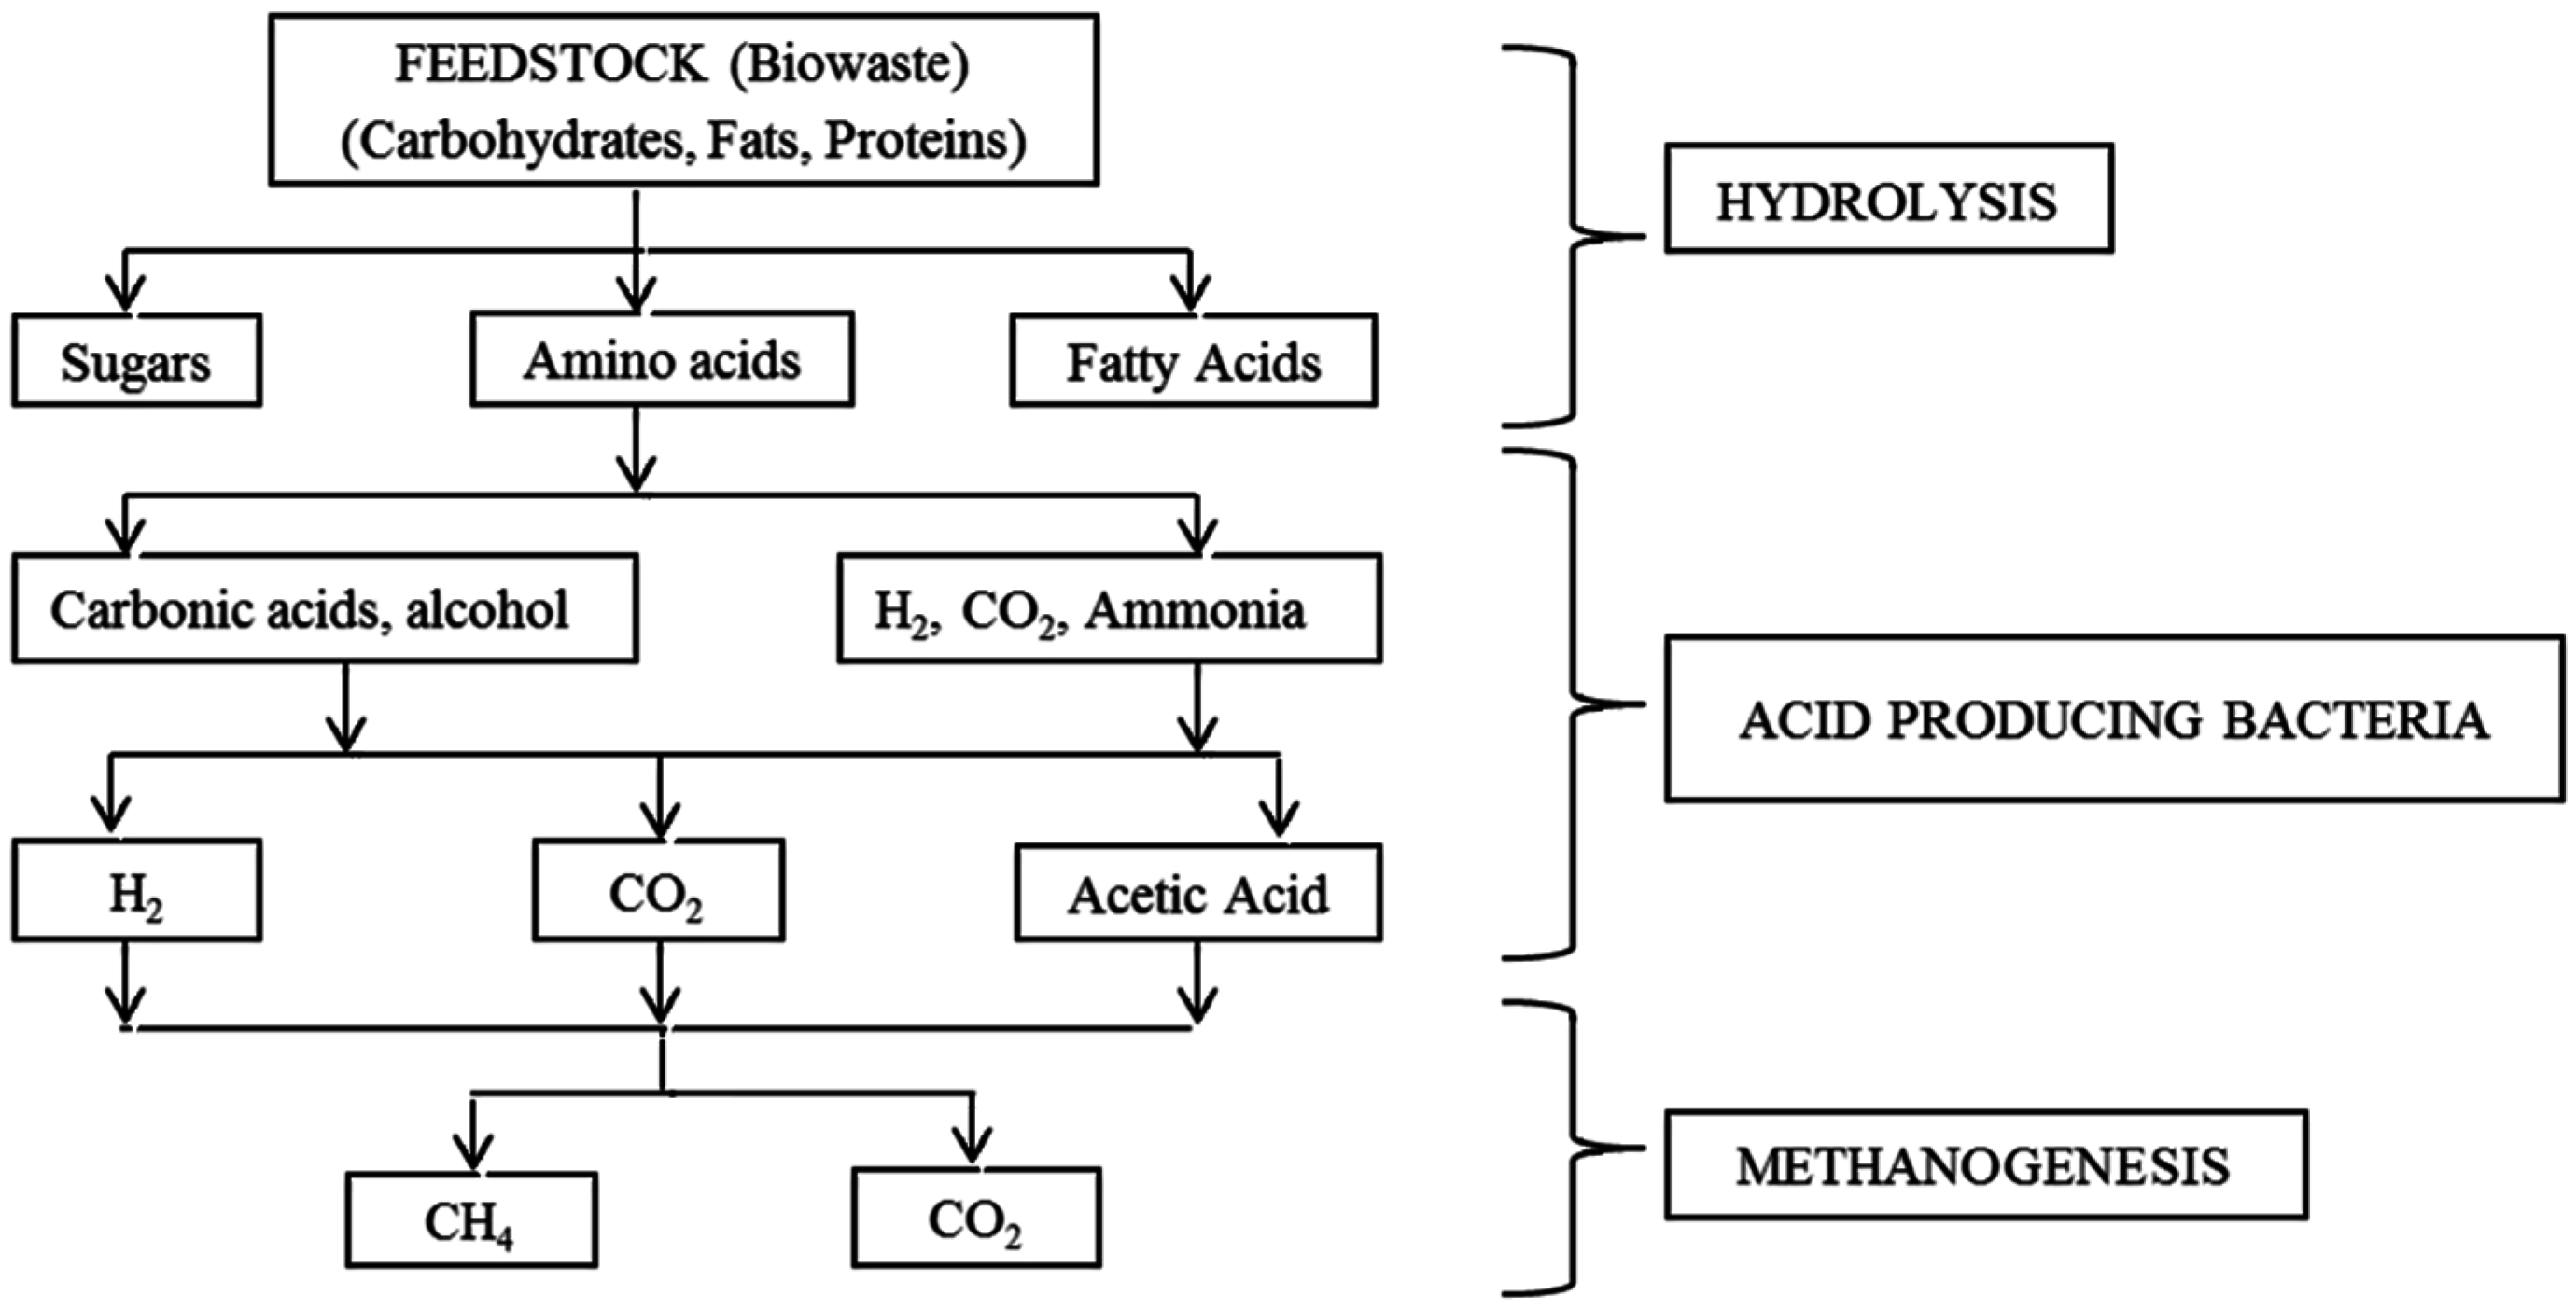
2.2. Simulation of the Anaerobic Digestion Process

Anaerobic Digestion Model 1 (ADM1), that uses the steps as shown in Figure 2, was used to theoretically analyse the anaerobic digestion for the selected biowaste. Nineteen biochemical processes and twenty four dynamic variables were used to analyse this complex model. Simulation was carried out with Matlab/Simulink [22]. Since the toolbox contained the values of most of the parameters needed for the simulation, the measured chemical properties of the biowaste as shown in Table 1 were used only as input parameters for the analysis. The change in methane percentage for each day was obtained from the analysis, and graphs were plotted for each biowaste. The results are compared with experimental values to prove the validity of the theoretical approach.

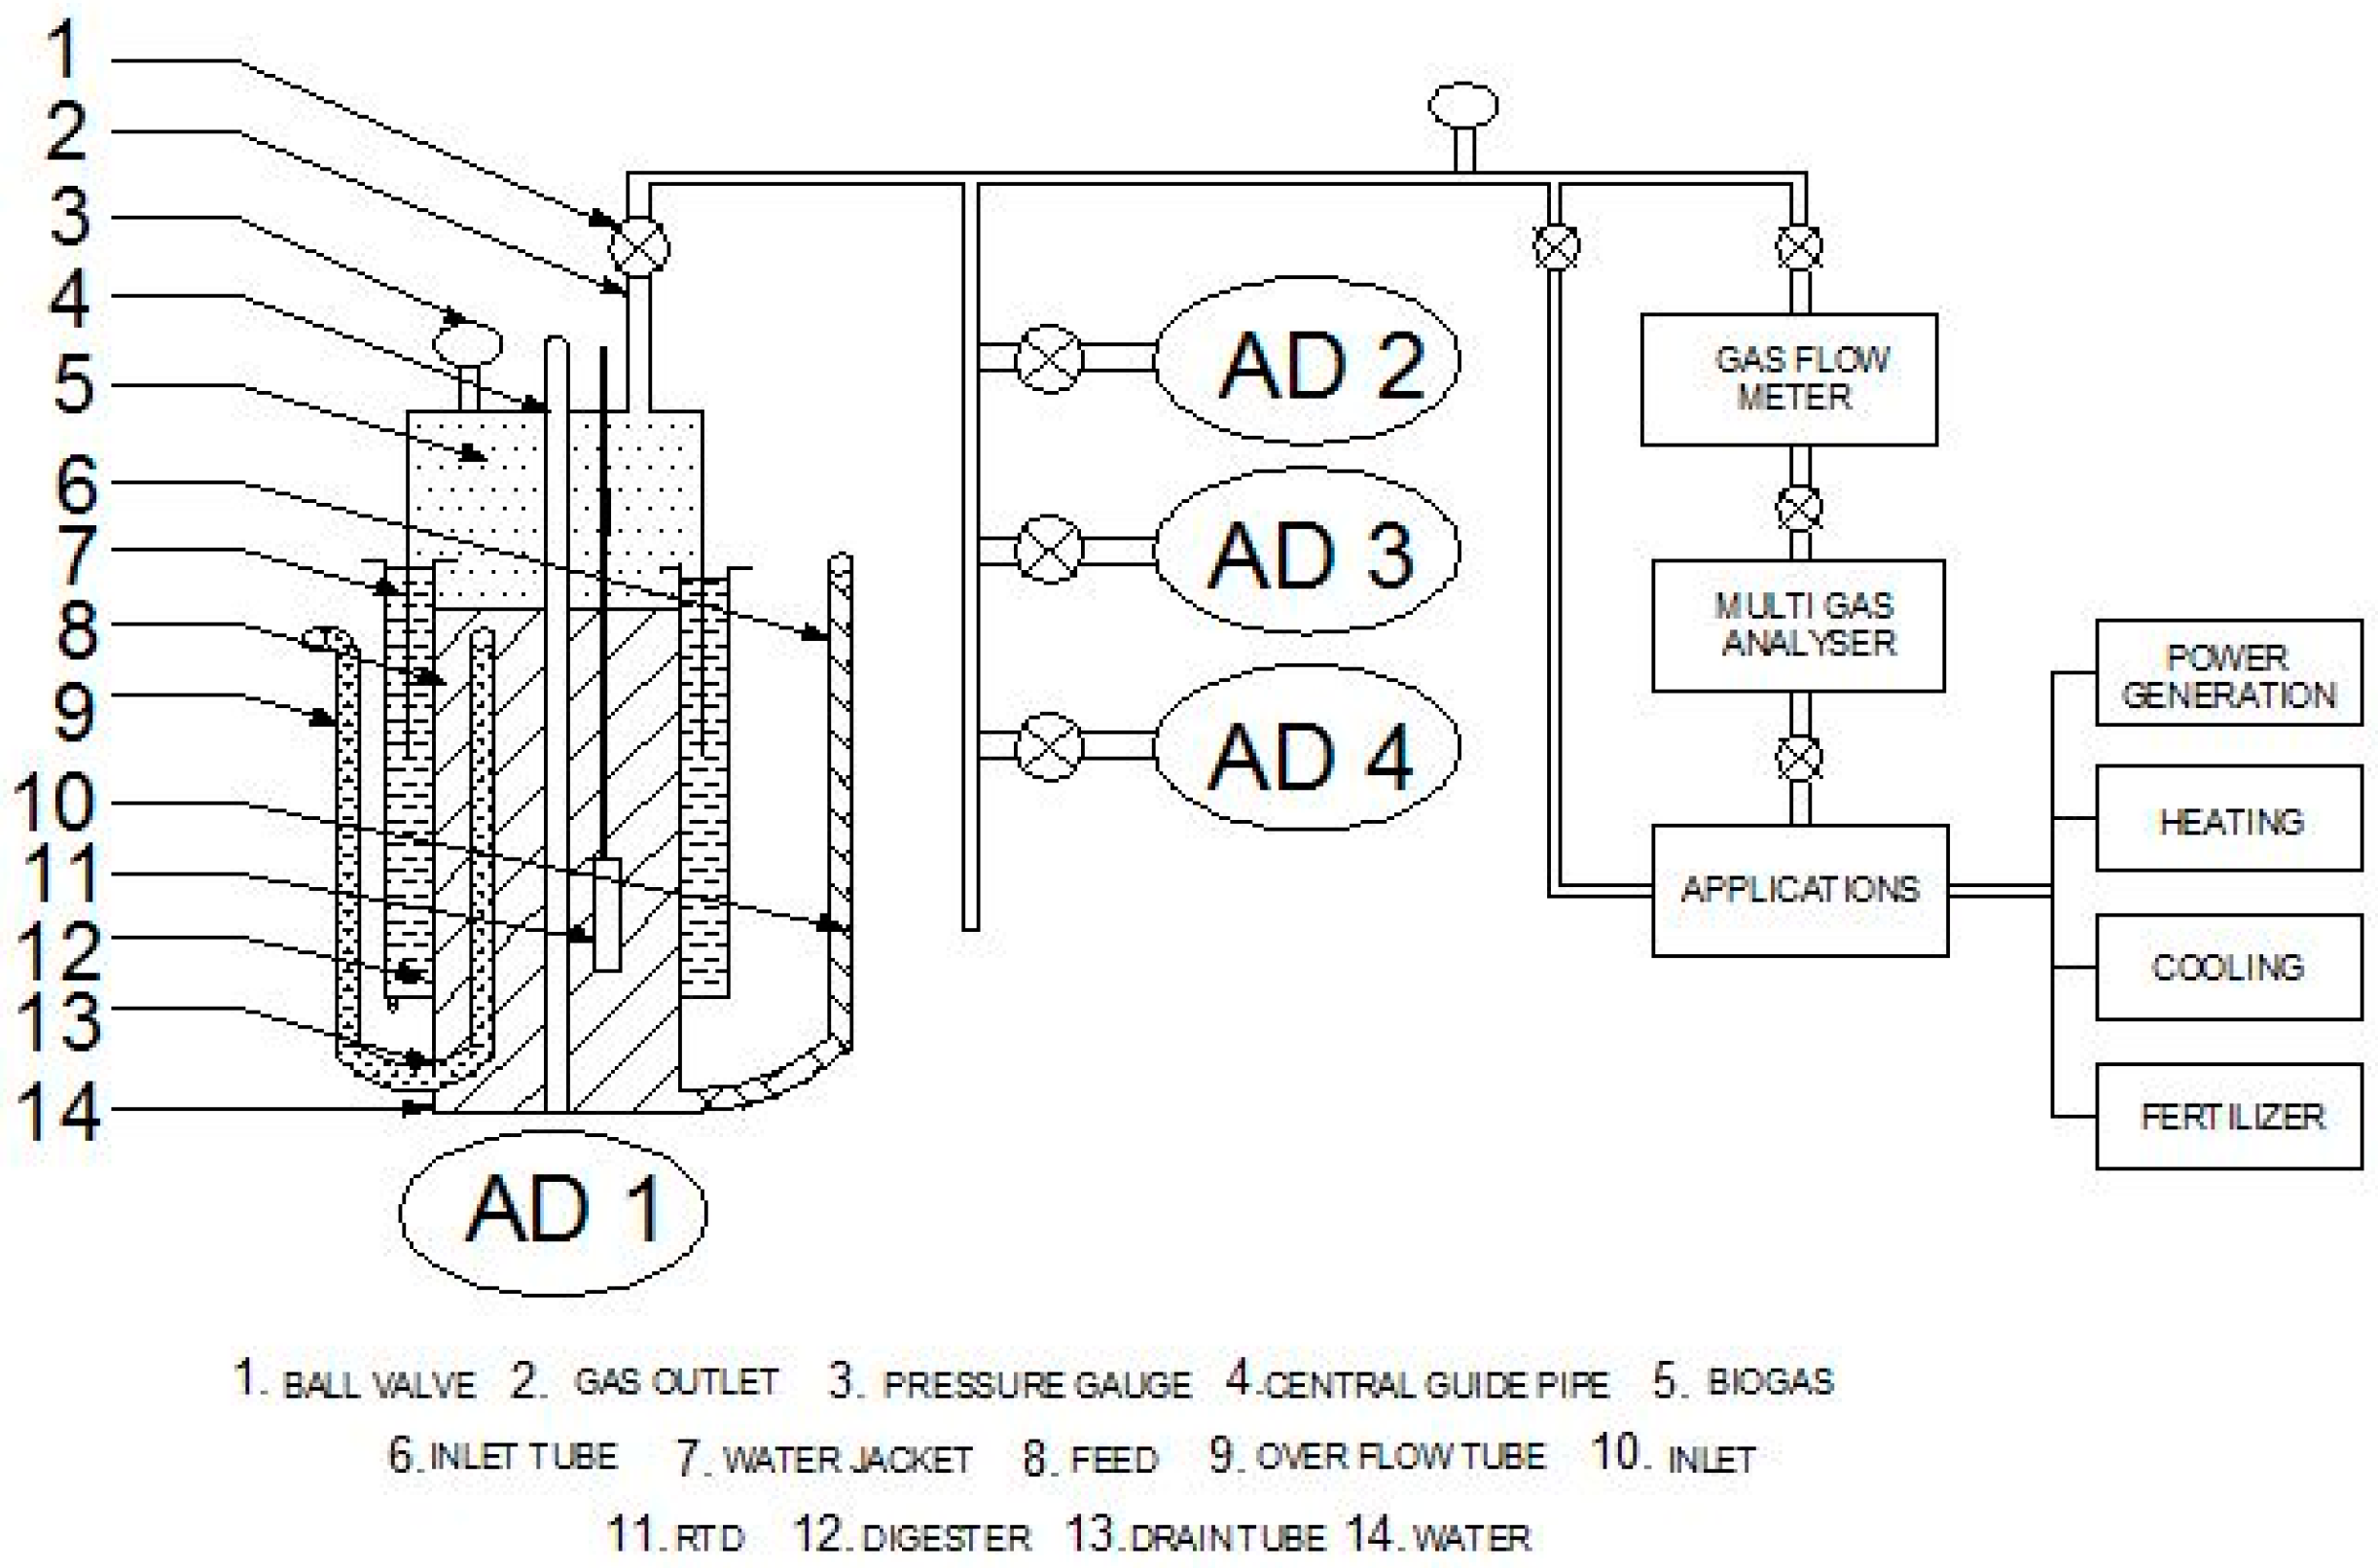
2.3. Experimental Setup

The experimental setup used in this study is schematically represented in Figure 3. The experiment was carried out in four anaerobic digesters (AD1, AD2, AD3, and AD4) fabricated with reinforced glass fibre composite materials. Table 2 shows the various biowastes used in each digester.
Each anaerobic digester consisted of an inlet and outlet to load the feed and drain out the digested feedstock, respectively. A floating drum with a water seal was provided to store the biogas. The gas outlet from the digesters was connected to a multigas analyser (NUCON) of 0.3% accuracy and a thermal gas flow meter of 0.5% accuracy Full Scale (FS). A pH electrode and a thermometer were kept inside the digester to measure the pH and temperature of the substrate, respectively.

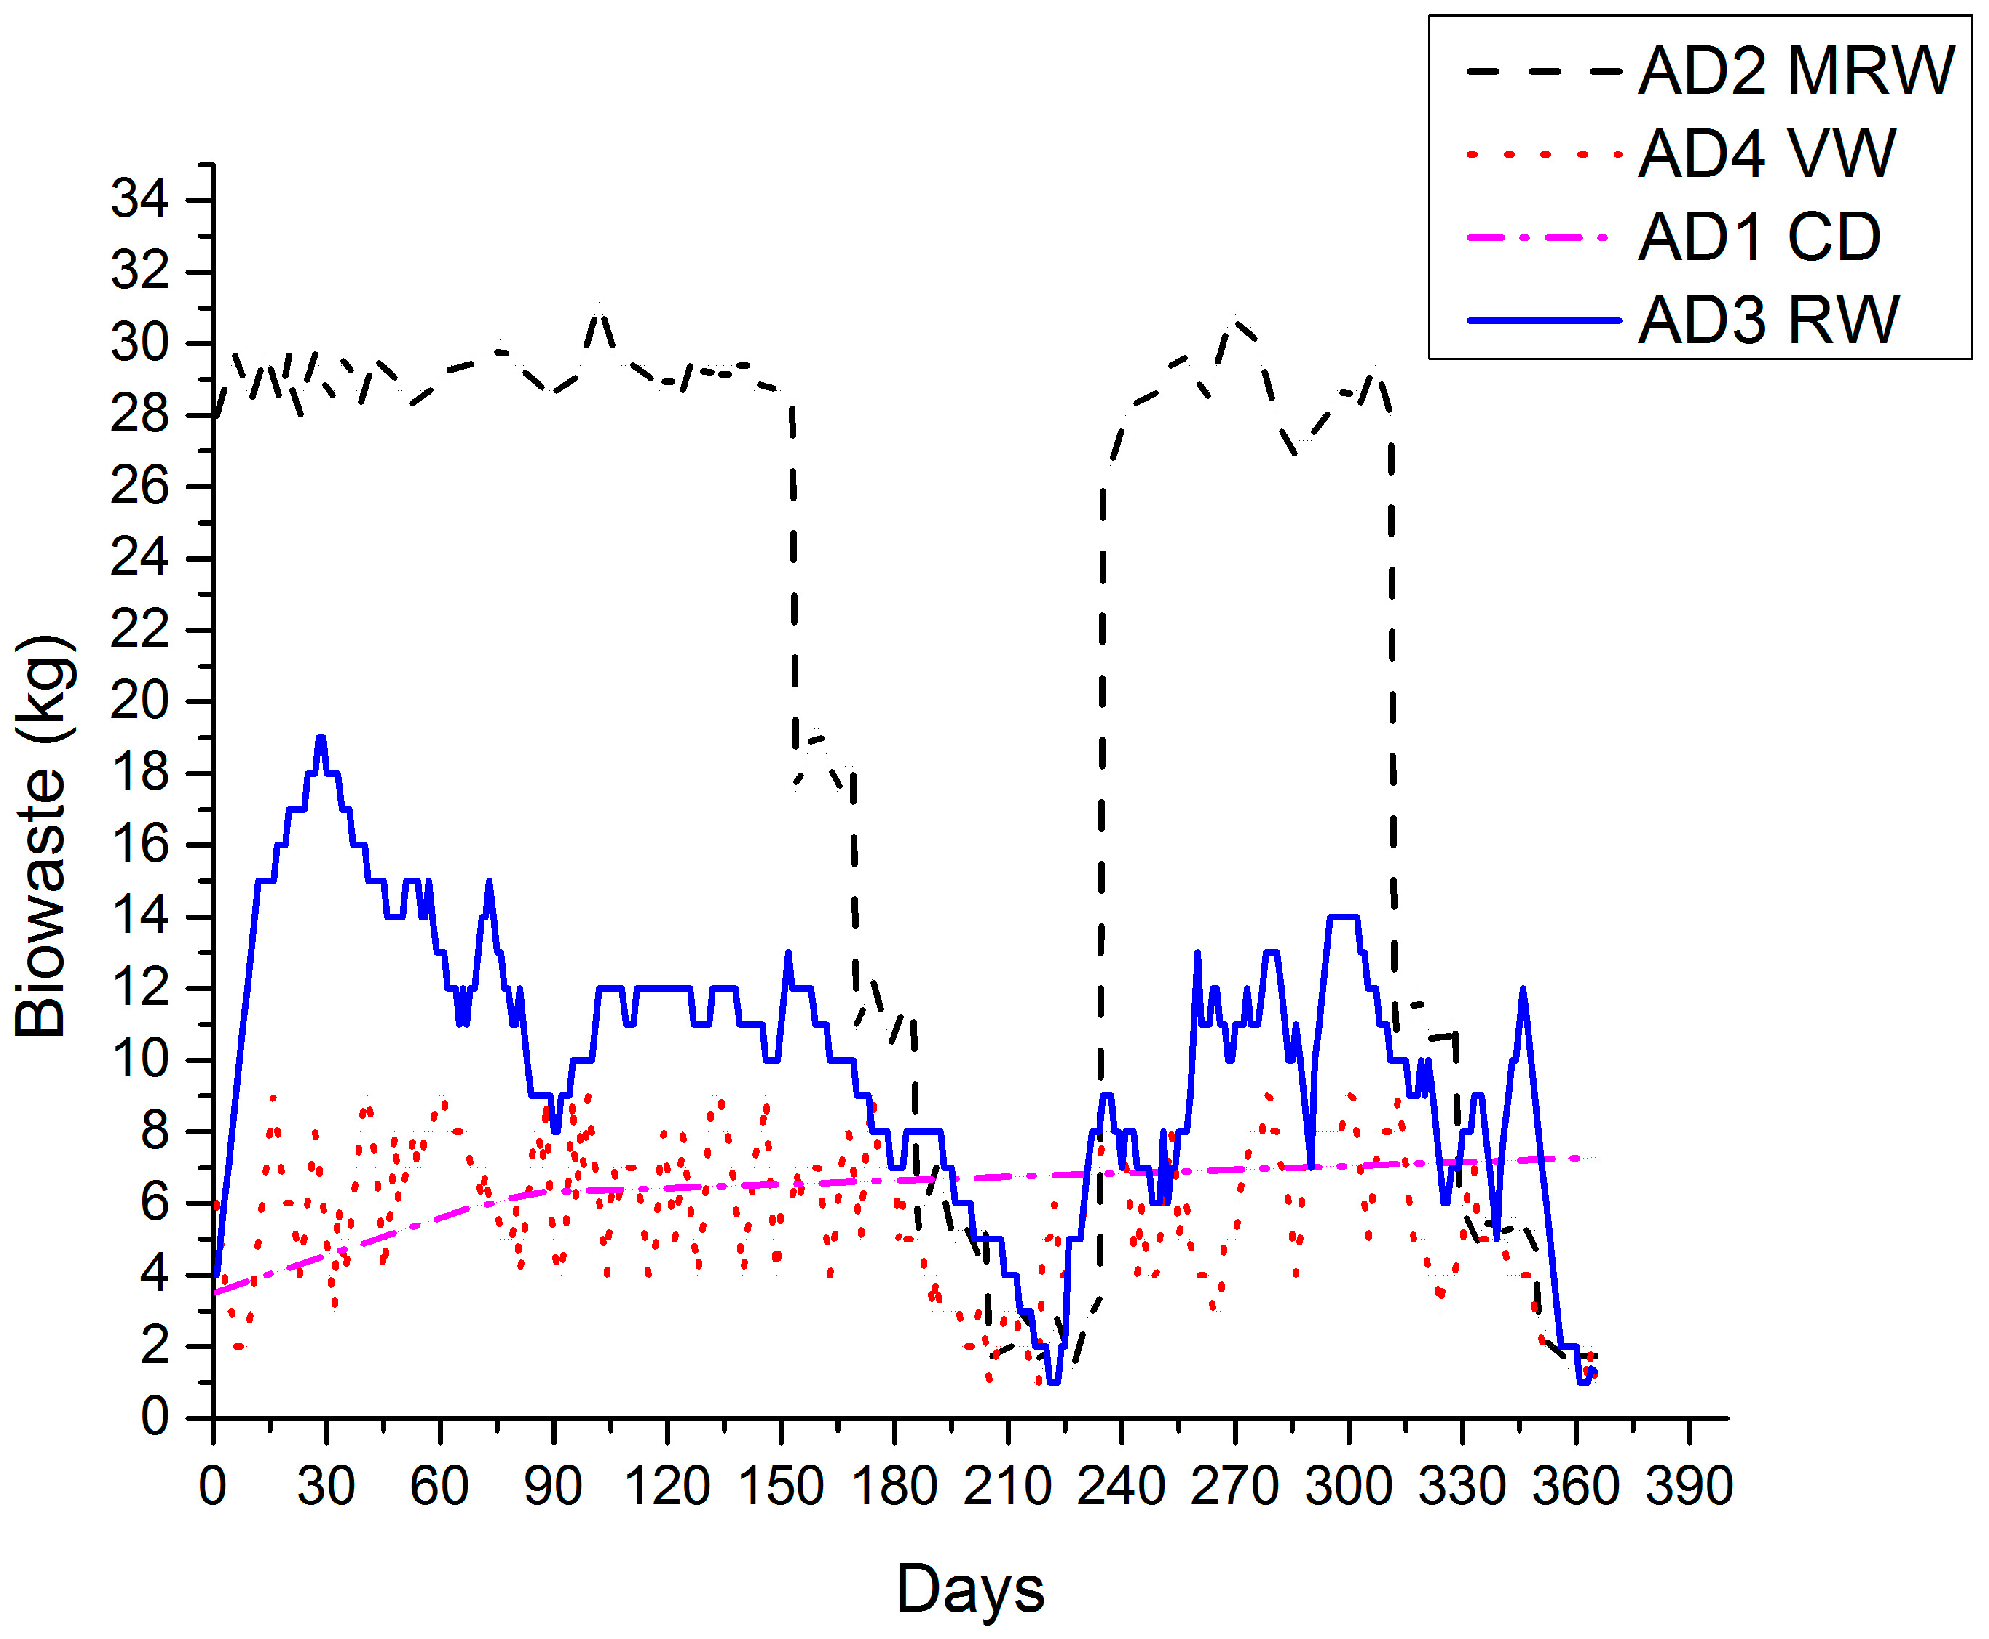
2.4. Experimental Procedure

The digesters were initially loaded with cow dung and water in a 1:1 ratio [2] as shown in Table 2. Approximately 50 days were required to produce an efficient quantity of methanogen bacteria and complete digestion of the cow dung [23]. After ensuring that the biogas production from cow dung had stopped and the bacteria were starving for feed, the biowastes were loaded gradually in each digester as mentioned in Table 2. Methane production had been observed and its quality and quantity per day were measured. The temperature, pH, and quality were also recorded for a minimum of four times a day, and the average was calculated. The atmospheric temperature throughout the year in the area where the study was conducted was between 19 °C to 34 °C; however, more than 90% of the readings showed the temperature above 28 °C.

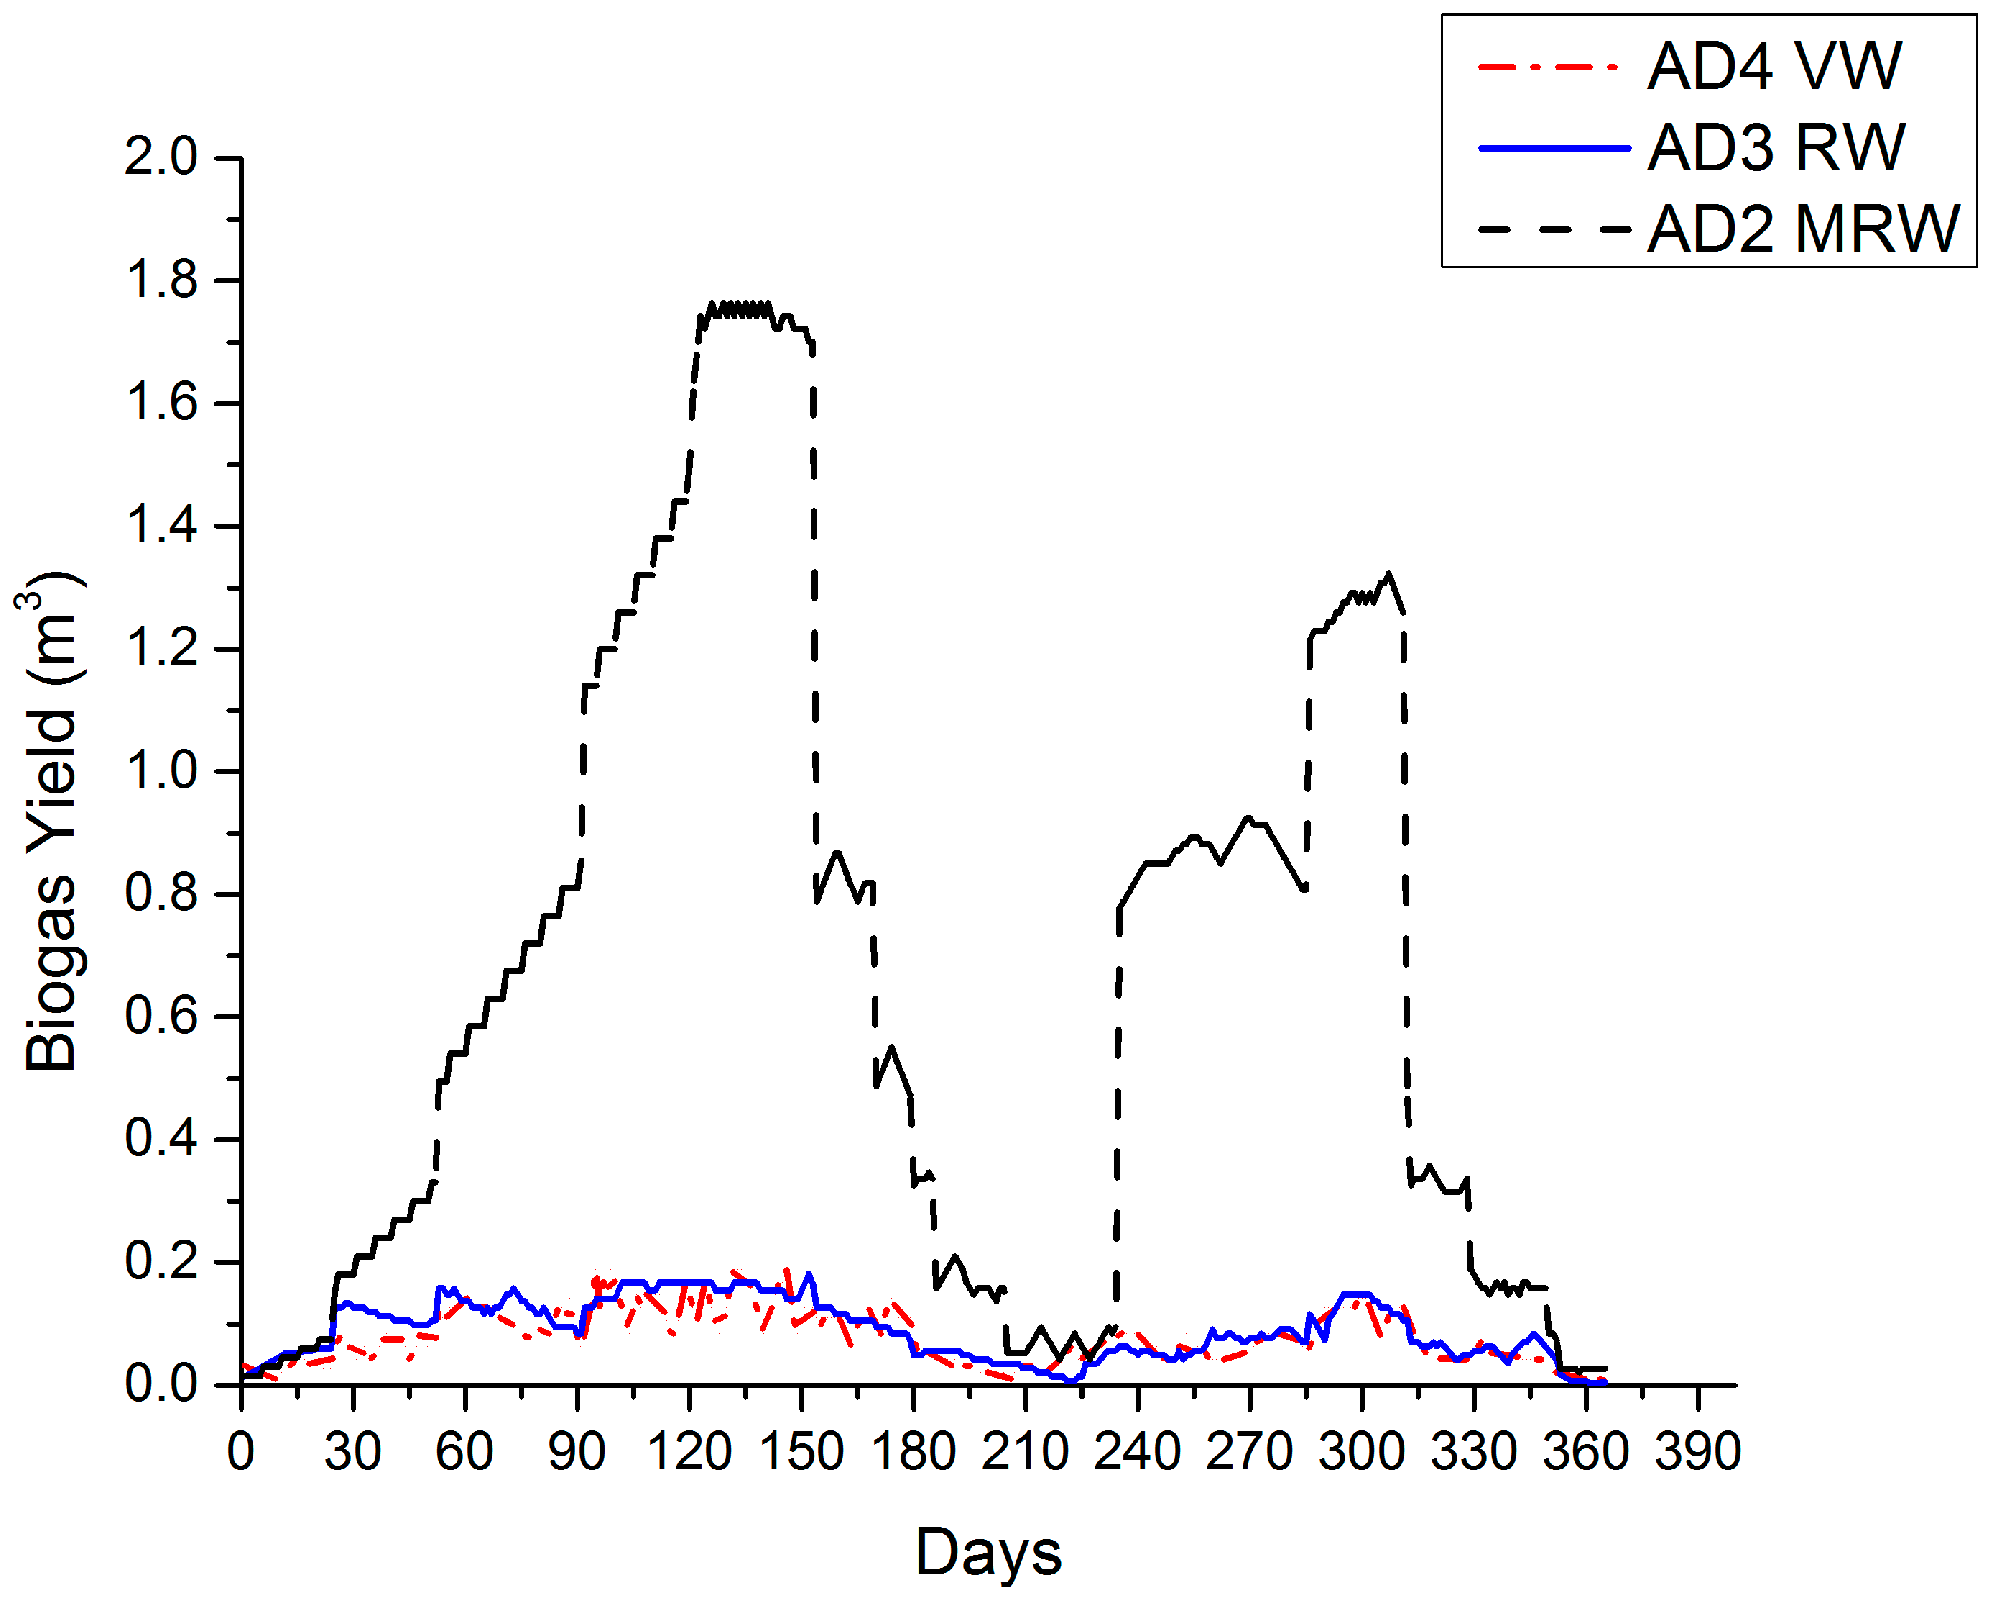
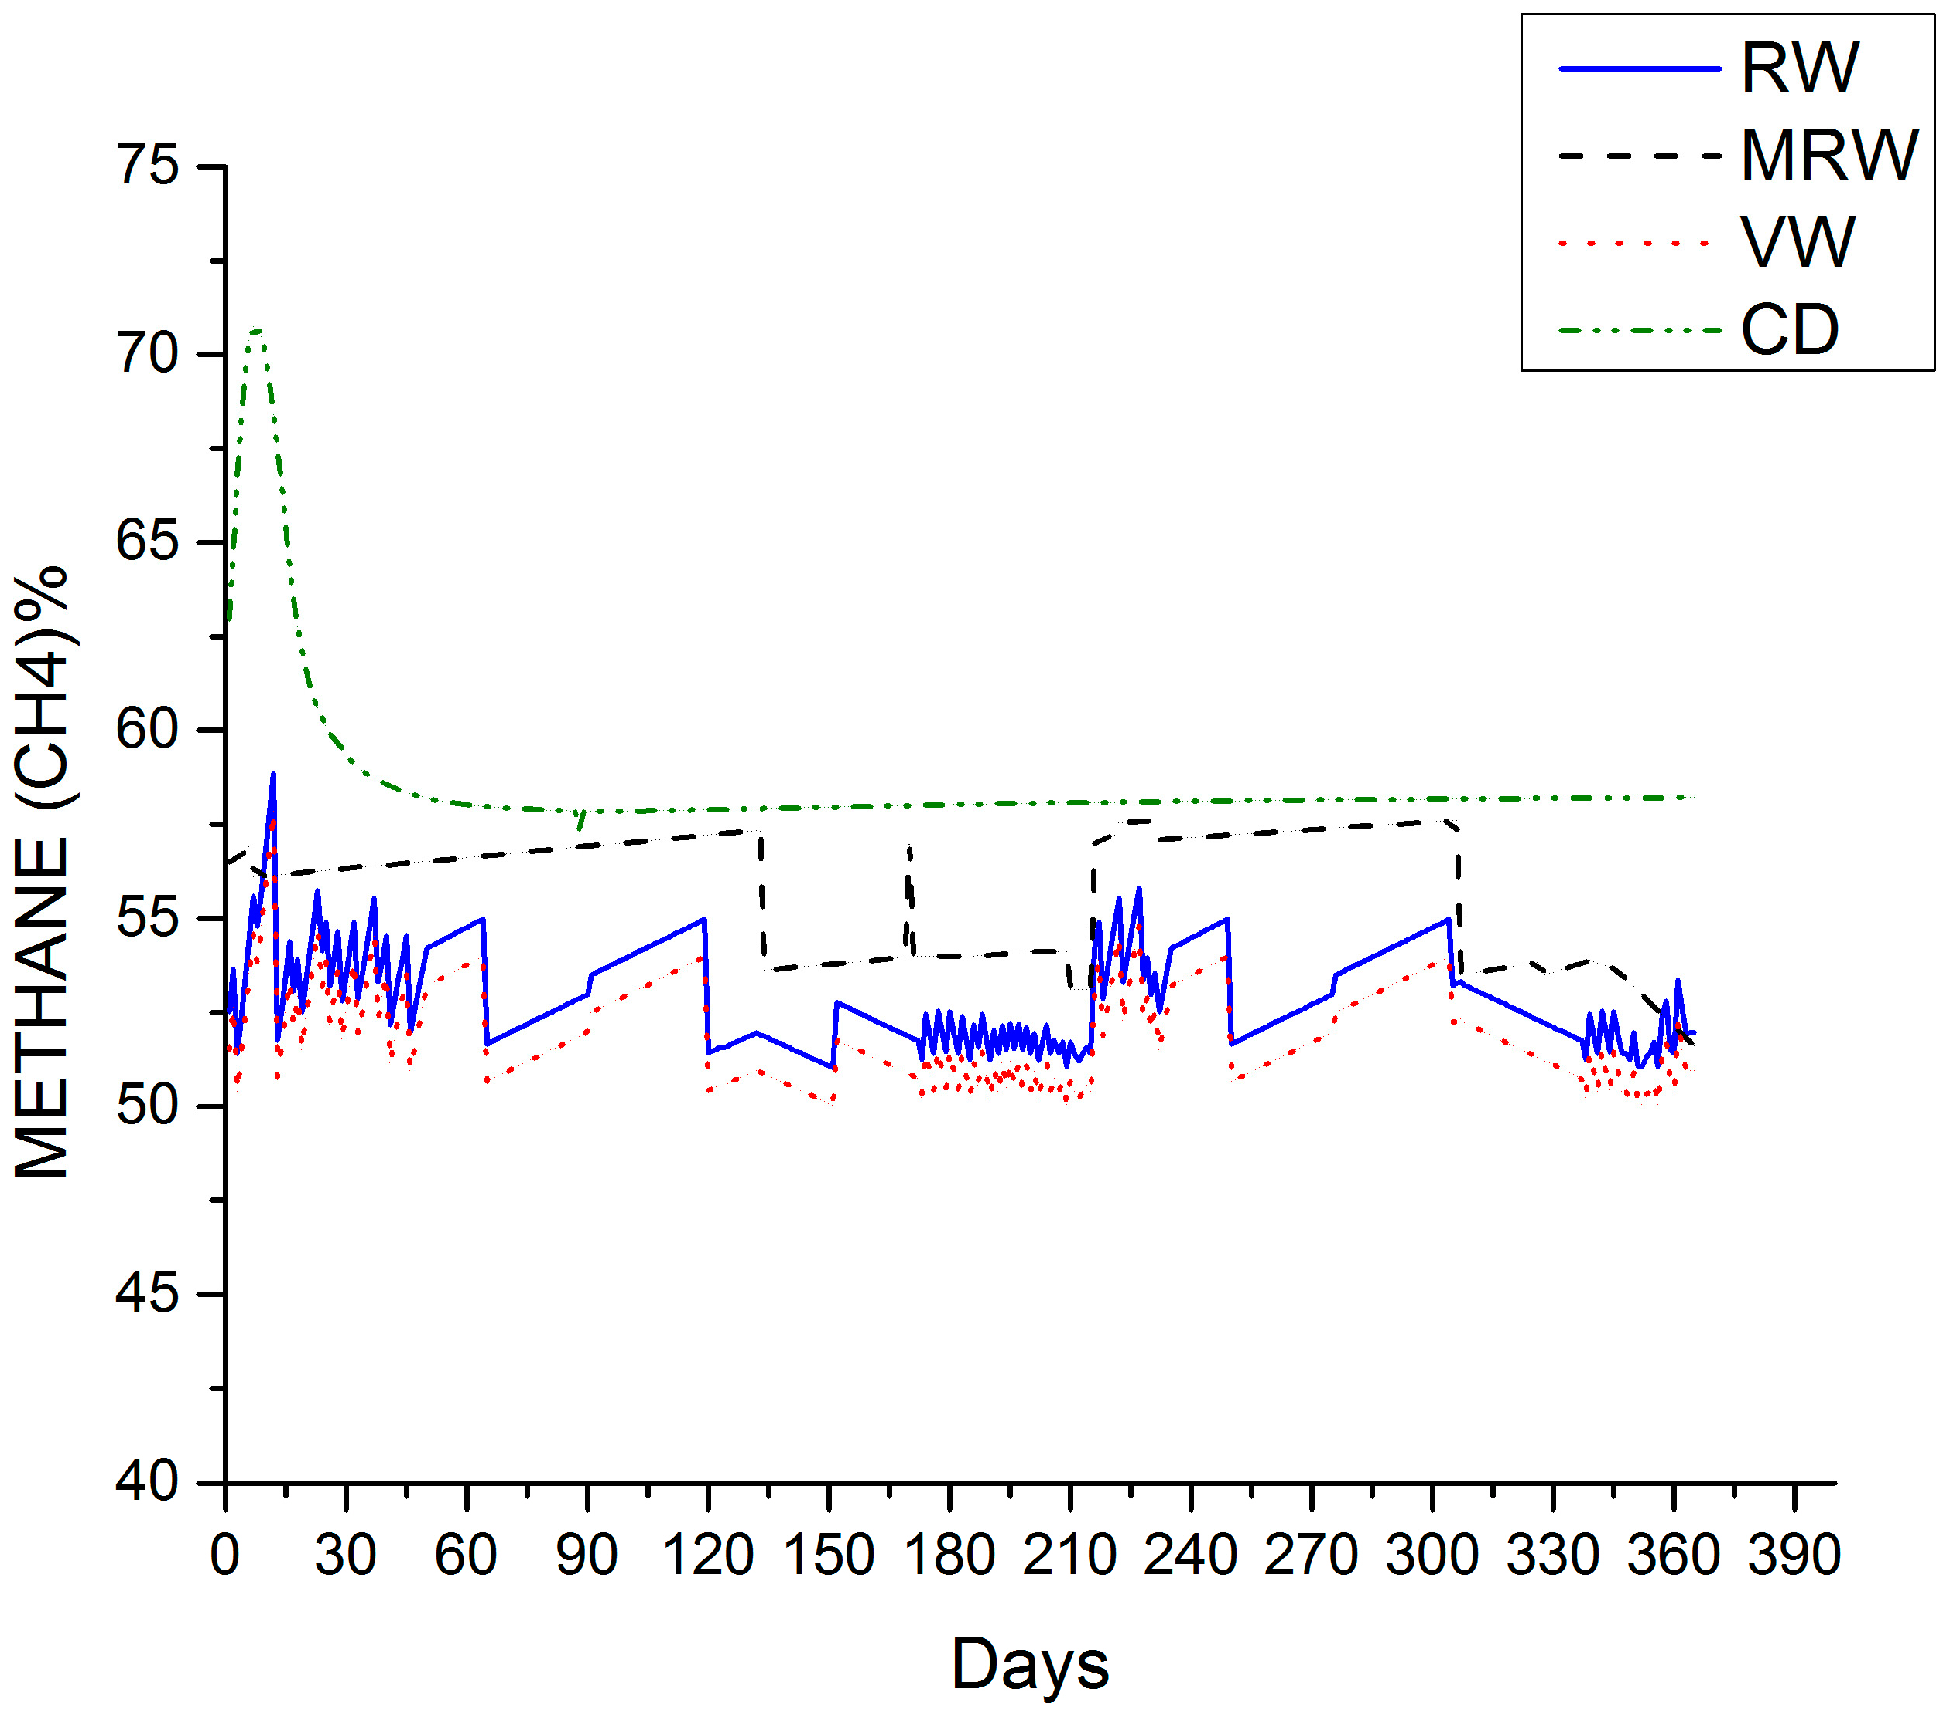
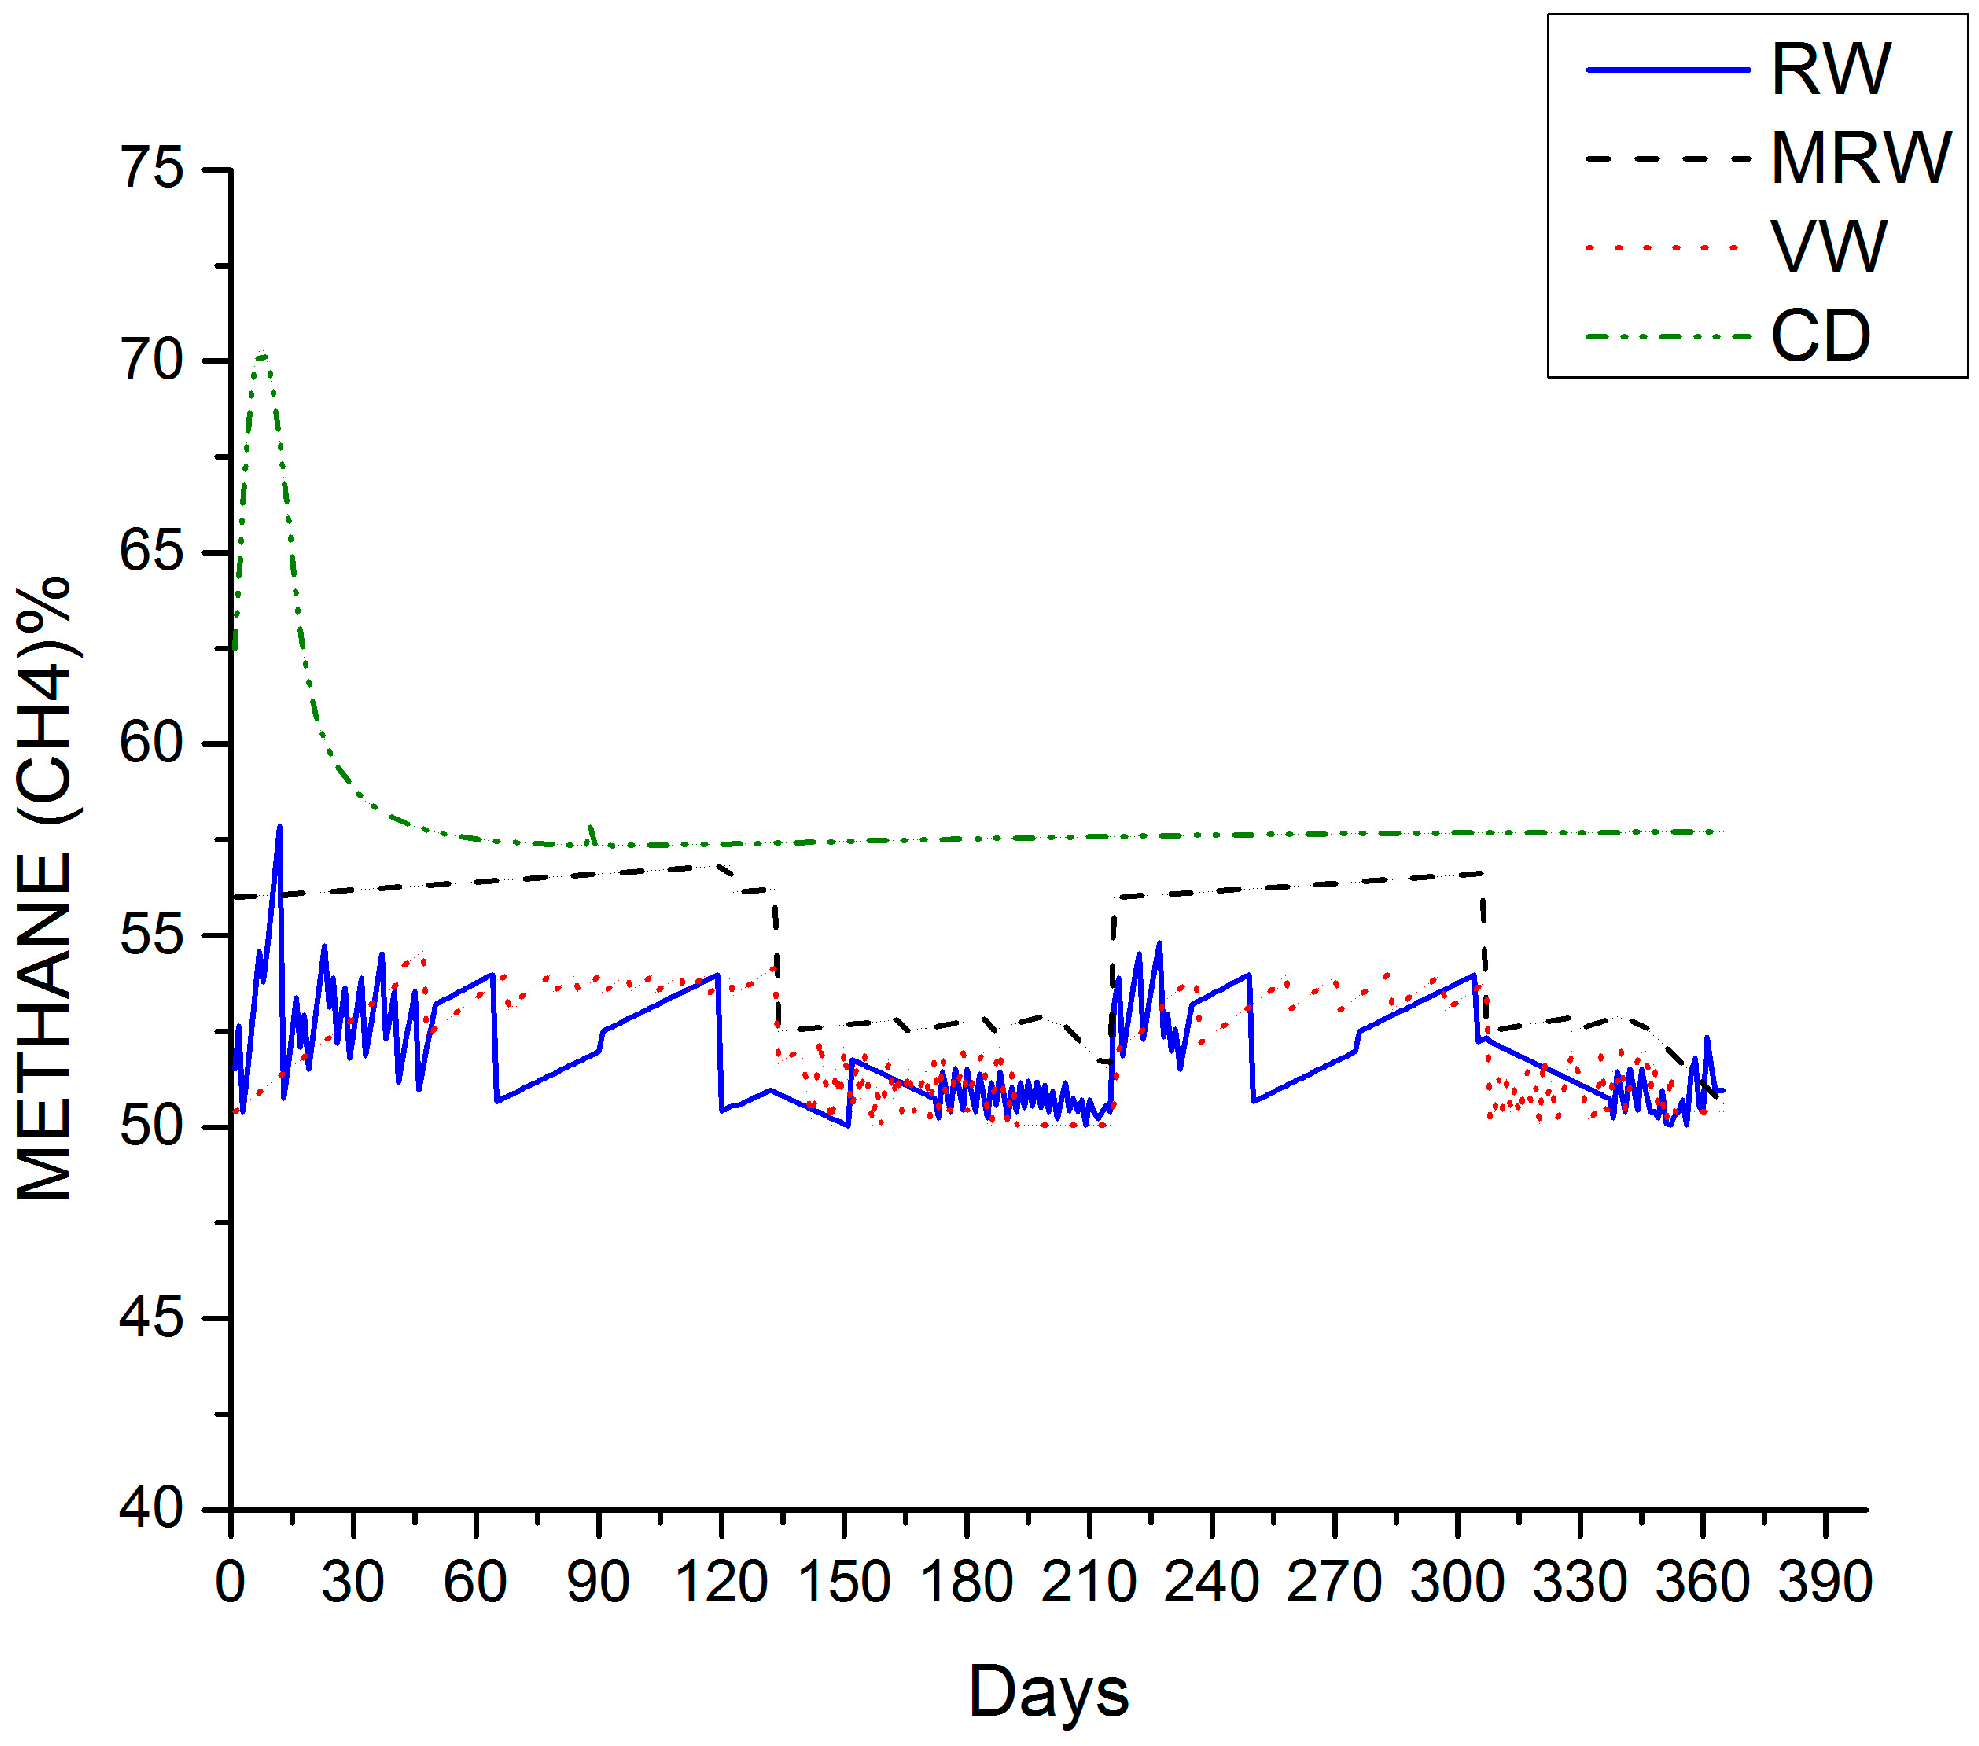
3. Results and Discussion

As discussed earlier, the biowastes collected from the campus of the institution during the period of a year is shown in Figure 1. From the available biowastes, 10% was used as feedstock for the digesters. Figure 1 shows that the availability of biowastes was low during June, July, November, and December. This variation was due to the academic schedule such as exam time, vacation, etc.
The loading pattern of the biowastes for a 365-day period is shown in Figure 4. The availability of CD, MRW, RW, and VW seems to be high with an average of 7 kg, 28 kg, 12 kg, and 8 kg per day during the busy schedule and 7 kg, 12 kg, 6 kg, and 2 kg during the non-busy schedule.
Based on the availability of biowastes, the digesters were loaded and the per day biogas yield was measured and plotted as shown in Figure 5. It was observed that the biogas yield varied according to the loading rate, and in the case of MRW, it was 0.03 m3 to 0.15 m3 for the first 25 days, and 0.1 m3 to 0.3 m3 was observed from day 26 to 52. The increase in biogas yield after the 25th day may be due to the increase in the generation of sufficient methanogen. With the constant availability of the biowastes, the loading rate was almost constant which again rose from 0.18 m3 to 0.76 m3 until approximately the 84th day. With the continuing constant availability of the biowastes, the loading rate was almost similar which again raised the yield from 0.77 m3 to 1.7 m3 and attained a constant level of 1.6 m3 until the 150th day. Even though the loading rate was almost constant during the first 150 days, due to the deficiency in the quantity of methanogen bacteria needed to digest the entire waste, the yield was not constant during that period. This deficiency of methanogen bacteria is the cause for the increasing trend in the generation of biogas from 0 to 1.7 m3 in the 2 m3 digester for the first 100 days, and then it is stable for the following 50 days. After 150 days, the loading rate falls due to exam and vacation schedules.
During this time, the yield was reduced to a minimum average of 0.01 m3. After that the loading rate increases, but the yield is not similar to that of the trend observed in the initial period. Though the yield increased with an increase in the loading rate, the value was lower, due to the fact that in the first busy schedule the biowastes were mixed with CD for generating methanogen, and slowly that CD was replaced with other available biowastes. As the loading rate was not affected during that season, the yield was high and constant. Next, due to the low loading rate in the non-busy schedule, the activity of methanogen was reduced with the lack of sufficient feed, which impacted the digestion of the second busy schedule. From the 335th day, the yield was lower due to the non-busy schedule which continued until the next busy schedule started. A similar trend was observed for both RW and VW. According to the availability of these biowastes, the digesters were loaded, and the yield was observed between 0.01 m3 and 0.18 m3 as shown in Figure 5. Similar to MRW, the yield also varied according to the loading rate during the busy and non-busy schedules.
The quality of the generated biogas was also measured and plotted as shown in Figure 6. The quality also seemed to vary according to the loading rate. CD showed an average of 58%, whereas for MRW, RW, and VW it was 57%, 53%, and 52% respectively. Though there was variation for all the biowastes except CD, the trend seemed to be similar according to the loading rate. During the first busy schedule, the methane percentage reduced from 57% to 54%, 55% to 51%, and 53% to 50% respectively. This shows that the quality of the biowastes differed like the quantity, according to the loading rate.
During the second busy schedule, the methane quality increased and attained an average of 57%, 56%, and 53%, respectively. This showed that the quality of the biogas was also influenced by the loading rate. The results obtained from the analytical and theoretical study depicted in Figure 7 showed that the average methane composition from CD was 58.01% and 58.60% in which the difference was 0.5%. RW showed an average of 51.96% and 52.92% with a difference of 0.96%. MRW showed an average composition of 54.85% and 55.69% in which the difference was 0.84%. VW showed an average of 52.28% and 53.26% with a difference of 0.98%. The above study showed that the variation for experimental and simulation studies was minimal, and was less than 1%. Among the 24 dynamic variables used in the simulation of anaerobic digestion in the Matlab toolbox, only 4 variables were changed for each biowaste in this simulation. The assumption of the other 20 variables being the same as that of the values available (inbuilt) in the toolbox may be the cause for the higher CH4 production for VW rather than RW in the analytical prediction when compared to the experimental values as shown in Figure 6 and Figure 7.
The biogas generated throughout a year can be used for various applications such as power generation, heating, cooling, lighting lamps, etc. The biogas generated from the campus considered in the study could reduce the usage of LPG in hostels from 30% to 35%. This study was carried out by utilizing only 10% of the available biowaste. By increasing the size of the digester and the loading rate, the generated biogas could be used for electricity generation. Apart from the applications of biogas, the slurry that drained out after the digestion process could be used as fertilizers by mixing it with water in a 1:10 ratio [24].

4. Conclusions

The experimental studies on the utilization of biowaste as an alternative energy source in an educational institution show that the production of waste is not uniform, and it depends on the student population, academic schedule, and on student awareness of waste management. The generally available biowastes such as cow dung, mixed rice waste, rice waste, and vegetable waste have been studied to check the viability of using biogas as a substitute for existing energy sources. The variations in the yield and quality of biogas produced during a year with different feeding rates were studied, and it was found that the quality of biogas did not vary due to the change in the loading rate.
During the experimental studies, the average methane compositions observed in the biogas produced from CD, MRW, RW, and VW were 57.86%, 51.11%, 52.98%, and 52.01%, respectively. The quality of biogas predicted by the analytical studies was close to the experimental values. These observations also confirm that the CH4 composition may not vary significantly with the loading rate or other operating conditions used in this study. Since the quality of biogas is similar for VW, MRW, and RW, all these wastes can be used individually or mixed for the anaerobic digestion process.
The variations of biogas predicted from CD, MRW, RW, and VW per cubic meter capacity of the digester were 0 to 0.96 m3, 0 to 0.85 m3, 0 to 0.72 m3, and 0 to 0.71 m3, respectively. The available quantity of MRW was at a maximum, and its variation throughout a year was also significant. Therefore, further study is needed to effectively improve the quality and the quantity of biogas generated for the non-uniform loading rate of this waste. The results also showed that the biogas generated in the educational institution was suitable for any relevant application such as the substitution for conventional cooking fuel, biogas lamping, electricity generation, etc., and further demonstrated that the drained out digestate could be used as fertilizer for gardening.
Previous studies conducted in schools, for the implementation of biogas technologies for energy generation, encountered a few problems due to the difficulties in creating awareness among the students regarding waste management [19]. This issue has been easily tackled in this study because the students are obtaining their engineering degrees and they are ready to be involved in environmentally-friendly technologies. Moreover, only a portion of the waste available in one institution is studied and presented in this paper. The other wastes available inside the institution, the waste availability pattern of similar campuses, and the possibilities of getting waste from the neighboring areas of the institutions should be studied along with economic factors to further implement this strategy.

Author Contributions

Godwin Glivin performed the analytical and experimental studies, and prepared the draft of the manuscript. S. Joseph Sekhar organized and interpreted data and approved the final version.

Conflicts of Interest

The authors declare no conflict of interest.

References

  1. Ziana, Z.; Rajesh, P. Production and Analysis of Biogas from Kitchen Waste. Int. Res. J. Eng. Technol. 2015, 2, 622–632. [Google Scholar]
  2. Agrahari, R.P.; Tiwari, G.N. The Production of Biogas Using Kitchen Waste. Int. J. Energy Sci. 2013, 3, 408–413. [Google Scholar] [CrossRef]
  3. Gwavuya, S.G.; Abele, S.; Barfuss, I.; Zeller, M.; Müller, J. Household energy economics in rural Ethiopia: A cost-benefit analysis of biogas energy. Renew. Energy 2012, 48, 202–209. [Google Scholar] [CrossRef]
  4. Rajendran, K.; Aslanzadeh, S.; Johansson, F.; Taherzadeh, M.J. Experimental and economical evaluation of a novel biogas digester. Energy Convers. Manag. 2013, 74, 183–191. [Google Scholar] [CrossRef]
  5. Walekhwa, P.N.; Lars, D.; Mugisha, J. Economic viability of biogas energy production from family-sized digesters in Uganda. Biomass Bioenergy 2014, 70, 26–39. [Google Scholar] [CrossRef]
  6. Liu, Y.; Kuang, Y.; Huang, N.; Wu, Z.C.; Xu, L. Popularizing household-scale biogas digesters for rural sustainable energy development and greenhouse gas mitigation. Renew. Energy 2008, 33, 2027–2035. [Google Scholar]
  7. Antognoni, S.; Ragazzi, M.; Ionescu, G.; Passamani, G.; Zanoni, S.; Rada, E.C.; Torretta, V. Respirometric index as a tool for biogas generation production from poultry manure. Manag. Environ. Qual. 2016, 27, 269–280. [Google Scholar] [CrossRef]
  8. García, J.; Davies, S.; Villa, R.; Gomes, D.M.; Coulon, F.; Wagland, S.T. Compositional analysis of excavated landfill samples and the determination of residual biogas potential of the organic fraction. Waste Manag. 2016, 55, 336–344. [Google Scholar] [CrossRef] [PubMed]
  9. Moedinger, F.; Ast, F.; Ragazzi, M.; Foldori, P.; Rada, E.C.; Binnig, R. Innovative biogas multi-stage biogas plant and novel analytical system first project experiences. Energy Procedia 2012, 18, 672–680. [Google Scholar] [CrossRef]
  10. Irene, P.; Marianna, G.; Erasmo, C.; Ivet, F. Technical, economic and environmental assessment of household biogas digesters for rural communities. Renew. Energy 2014, 62, 313–318. [Google Scholar]
  11. Lemea, M.M.V.; Rochaa, M.H.; Loraa, E.E.S.; Venturinia, O.J.; Lopesb, B.M.; Ferreirab, C.H. Techno-economic analysis and environmental impact assessment of energy recovery from Municipal Solid Waste (MSW) in Brazil. Resour. Conserv. Recycl. 2014, 87, 8–20. [Google Scholar] [CrossRef]
  12. Torretta, V.; Ionescu, G.; Raboni, M.; Merler, G. The mass and energy balance of an integrated solution for municipal solid waste treatment. In WIT Transactions on Ecology and the Environment; WIT Press: Boston, MA, USA, 2014; Volume 180, pp. 151–161. [Google Scholar]
  13. Rada, E.C. Energy from municipal solid waste. In WIT Transactions on Ecology and the Environment; WIT Press: Boston, MA, USA, 2014; Volume 190, pp. 945–958. [Google Scholar]
  14. Consonni, S.; Giugliano, M.; Massarutto, A.; Ragazzi, M.; Saccani, C. Material and energy recovery in integrated waste management systems: Project overview and main results. Waste Manag. 2011, 31, 2057–2065. [Google Scholar] [CrossRef] [PubMed]
  15. Karthik, R.; Kankanala, H.R.; Martinsson, R.; Taherzadeh, M.J. Uncertainty over techno-economic potentials of biogas from municipal solid waste (MSW): A case study on an industrial process. Appl. Energy 2014, 125, 84–92. [Google Scholar]
  16. Wilkie, A.C.; Graunke, R.E.; Cornejo, C. Food Waste Auditing at Three Florida Schools. Sustainability 2015, 7, 1370–1387. [Google Scholar] [CrossRef]
  17. Galli, F.; Brunori, G.; Di Iacovo, F.; Innocenti, S. Co-Producing Sustainability: Involving Parents and Civil Society in the Governance of School Meal Services. A Case Study from Pisa, Italy. Sustainability 2014, 6, 1643–1666. [Google Scholar] [CrossRef]
  18. Rojas, A.; Valley, W.; Mansfield, B.; Orrego, E.; Chapman, G.E.; Harlap, Y. Toward Food System Sustainability through School Food System Change: Think&EatGreen@School and the Making of a Community-University Research Alliance. Sustainability 2011, 3, 763–788. [Google Scholar]
  19. Rada, E.C.; Bresciani, B.; Girelli, S.; Ragazzi, M.; Schiavon, M.; Torretta, V. Analysis and Measures to Improve Waste Management in Schools. Sustainability 2016, 8, 840. [Google Scholar] [CrossRef]
  20. Gaida, D.; Christian, W.; Michael, B.; Thomas, B. MATLAB Toolbox for Biogas Plant Modelling and Optimization; Computing Center: Gummersbach, Germany, 2011. [Google Scholar]
  21. American Public Health Association (APHA). Standard Methods for the Examination of Water and Wastewater, 19th ed.; APHA: Washington, DC, USA, 1995. [Google Scholar]
  22. Batstone, D.J.; Keller, J.; Angelidaki, I.; Kalyuzhnyi, S.V.; Pavlostathis, S.G.; Rozzi, A.; Sanders, W.T.M.; Siegrist, H.; Vavilin, V.A. The IWA Anaerobic Digestion Model No 1 (ADM1). Water Sci. Technol. 2002, 45, 65–73. [Google Scholar] [PubMed]
  23. Singh, R.; Malik, R.K.; Tauro, P. Anaerobic Digestion of cattle dung at Various retention times—A pilot plant study. Agric. Wastes 1985, 12, 313–316. [Google Scholar] [CrossRef]
  24. Abubaker, J.; Risberg, K.; Pell, M. Biogas residues as fertilisers—Effects on wheat growth and soil microbial activities. Appl. Energy 2012, 99, 126–134. [Google Scholar] [CrossRef]
Figure 1. Biowaste availability per day throughout a year.
Sustainability 08 01128 g001
Figure 2. Model of the anaerobic digestion process.
Sustainability 08 01128 g002
Figure 3. Schematic diagram of the experimental setup.
Sustainability 08 01128 g003
Figure 4. Loading pattern of the biowastes for a 365-day period.
Sustainability 08 01128 g004
Figure 5. Biogas yield from biowastes for a 365-day period.
Sustainability 08 01128 g005
Figure 6. Experimental results of the methane composition in the biogas.
Sustainability 08 01128 g006
Figure 7. Simulation results of the methane composition in the biogas.
Sustainability 08 01128 g007
Table 1. Chemical characterization of feedstock.
Sl.No.FEEDpHTSVS
%%
1Cow Dung (CD)6.5015.9864.99
2Mixed Rice Waste (MRW)4.9120.2590.15
3Rice Waste (RW)6.6130.2890.11
4Vegetable Waste (VW)6.3510.5590.45
Table 2. Summary of the experimental design.
DigesterDigester SizeFeedstockTest DurationMixing Ratio
(Days)(Feed + Water)
AD 11 m3Cow dung (CD)3651:1
AD 22 m3Mixed Rice Waste (MRW)3651:1
AD 30.25 m3Rice waste (RW)3651:1
AD 40.25 m3Vegetable waste (VW)3651:1

