
Human Factors in Green Office Building Design: The Impact of Workplace Green Features on Health Perceptions in High-Rise High-Density Asian Cities


Abstract
:1. Introduction
2. Materials and Methods
2.1. Literature Review
2.2. Data Collection
2.3. Structure of Measurement
3. Delimitations and Limitations
4. Results
4.1. Comparison of Green Features
4.1.1. Green Certificate
4.1.2. Ventilation Mode
4.1.3. Building Morphology
4.2. Healing Perception vs Green Features
5. Discussion
6. Conclusions
Acknowledgments
Author Contributions
Conflicts of Interest
References
- World Green Building Council (WGBC). Health, Wellbeing & Productivity in Offices: The Next Chapter for Green Building. In Health, Wellbeing and Productivity; World Green Building Council, Ed.; World Green Building Council: London, UK, 2014. [Google Scholar]
- Hong, T.; Lin, H.-W. Occupant Behavior: Impact on Energy Use of Private Offices. In Presented at the ASim 2012—1st Asia Conference of International Building Performance Simulation Association, Shanghai, China, 25–27 November 2012.
- Sun, K.; Yan, D.; Hong, T.; Guo, S. Stochastic Modeling of Overtime Occupancy and Its Application in Building Energy Simulation and Calibration. Build. Environ. 2014, 79, 1–12. [Google Scholar] [CrossRef]
- Michie, S. Causes and Management of Stress at Work. Occup. Environ. Med. 2002, 59, 67–72. [Google Scholar] [CrossRef] [PubMed]
- Hraska, J. Chronobiological Aspects of Green Buildings Daylighting. Renew. Energy 2015, 73, 109–114. [Google Scholar] [CrossRef]
- Gou, Z.; Lau, S.Y. Sick Building Syndrome in Open-Plan Offices: Workplace Design Elements and Perceived Indoor Environmental Quality. J. Facil. Manag. 2012, 10, 256–265. [Google Scholar] [CrossRef]
- Shahzad, S.S.; Brennan, J.; Theodossopoulos, D.; Hughes, B.; Calautit, J.K. Building-Related Symptoms, Energy, and Thermal Control in the Workplace: Personal and Open Plan Offices. Sustainability 2016, 8, 331–350. [Google Scholar] [CrossRef]
- Byrd, H.; Rasheed, E.O. The Productivity Paradox in Green Buildings. Sustainability 2016, 8, 347–358. [Google Scholar] [CrossRef] [Green Version]
- Lam, K.; Zhang, R.; Wang, H.; Dong, B.; Zhang, R. Development of Web-Based Information Technology Infrastructures and Regulatory Repositories for Green Building Codes in China (Icodes). Build. Simul. 2013, 6, 195–205. [Google Scholar] [CrossRef]
- Lee, A.C.; Maheswaran, R. The Health Benefits of Urban Green Spaces: A Review of the Evidence. J. Public Health 2011, 33, 212–222. [Google Scholar] [CrossRef] [PubMed]
- Kaplan, S.; Kaplan, R. Health, Supportive Environments, and the Reasonable Person Model. Am. J. Public Health 2003, 93, 1484–1489. [Google Scholar] [CrossRef] [PubMed]
- Chang, C.-Y.; Chen, P.-K. Human Response to Window Views and Indoor Plants in the Workplace. HortScience 2005, 40, 1354–1359. [Google Scholar]
- World Health Organization (WHO). Workplace Health Promotion. Available online: http://www.who.int/occupational_health/topics/workplace/en/ (accessed on 10 August 2016).
- U.S. Green Building Council (USGBC). Leed V4 Reference Guide for Building Design and Construction; Green Building Council: Washington, DC, USA, 2013. [Google Scholar]
- BRE. Breeam International New Construction Technical Manual 2013; BRE Group Training: London, UK, 2013. [Google Scholar]
- U.S. Green Building Council (USGBC). Leed 2009 for Healthcare; Green Building Council: Washington, DC, USA, 2012. [Google Scholar]
- Gou, Z.; Prasad, D.; Lau, S.-Y. Impacts of Green Certifications, Ventilation and Office Types on Occupant Satisfaction with Indoor Environmental Quality. Archit. Sci. Rev. 2014, 57, 196–206. [Google Scholar] [CrossRef]
- Gou, Z.; Prasad, D.; Lau, S.-Y. Are Green Buildings More Satisfactory and Comfortable? Habitat Int. 2013, 39, 156–161. [Google Scholar] [CrossRef]
- Gou, Z.; Lau, S.-Y. Contextualizing Green Building Rating Systems: Case Study of Hong Kong. Habitat Int. 2014, 44, 282–289. [Google Scholar] [CrossRef]
- Kubba, S. Handbook of Green Building Design and Construction: Leed, Breeam, and Green Globes; Butterworth-Heinemann: Waltham, MA, USA, 2012. [Google Scholar]
- Seppänen, O.; Fisk, W.J.; Lei, Q.H. Ventilation and Performance in Office Work. Indoor Air 2006, 16, 28–36. [Google Scholar] [CrossRef] [PubMed]
- Pejtersen, J.; Allermann, L.; Kristensen, T.S.; Poulsen, O.M. Indoor Climate, Psychosocial Work Environment and Symptoms in Open-Plan Offices. Indoor Air 2006, 16, 392–401. [Google Scholar] [CrossRef] [PubMed]
- Boubekri, M.; Hull, R.B.; Boyer, L.L. Impact of Window Size and Sunlight Penetration on Office Workers’ Mood and Satisfaction: A Novel Way of Assessing Sunlight. Environ. Behav. 1991, 23, 474–493. [Google Scholar] [CrossRef]
- Leather, P.; Pyrgas, M.; Di, B.; Lawrence, C. Windows in the Workplace: Sunlight, View, and Occupational Stress. Environ. Behav. 1998, 30, 739–762. [Google Scholar] [CrossRef]
- Lottrup, L.; Grahn, P.; Stigsdotter, U.K. Workplace Greenery and Perceived Level of Stress: Benefits of Access to a Green Outdoor Environment at the Workplace. Landsc. Urban Plan. 2013, 110, 5–11. [Google Scholar] [CrossRef]
- Yeang, K. The Green Skyscraper: The Basis for Designing Sustainable Intensive Buildings; Prestel: Munich, Germany; London, UK; New York, NY, USA, 1999. [Google Scholar]
- Yeang, K. Eco Skyscrapers, 1st ed.; Images Publishing: Mulgrave, Australia, 2011; Volume 2. [Google Scholar]
- Yeang, K.; Spector, A. (Eds.) Green Design: From Theory to Practice; Black Dog: London, UK, 2011.
- Givoni, B. Climate Considerations in Building and Urban Design; Van Nostrand Reinhold: New York, NY, USA, 1998. [Google Scholar]
- Oke, T.R. Canyon Geometry and the Nocturnal Urban Heat Island: Comparison of Scale Model and Field Observations. J. Climatol. 1981, 1, 237–254. [Google Scholar] [CrossRef]
- Chan, K.B.; Lai, G.; Ko, Y.C.; Boey, K.W. Work Stress among Six Professional Groups: The Singapore Experience. Soc. Sci. Med. 2000, 50, 1415–1432. [Google Scholar] [CrossRef]
- Bowen, P.; Edwards, P.; Lingard, H.; Cattell, K. Occupational Stress and Job Demand, Control and Support Factors among Construction Project Consultants. Int. J. Proj. Manag. 2014, 32, 1273–1284. [Google Scholar] [CrossRef]
- Lau, S.-Y.; Gou, Z.; Liu, Y. Healthy Campus by Open Space Design: Approaches and Guidelines. Front. Archit. Res. 2014, 3, 452–467. [Google Scholar] [CrossRef]
- Vapaa, A.G. Healing Gardens: Creating Places for Restoration, Meditation, and Sanctuary. Master’s Thesis, Virginia Polytechnic Institute and State University, Blacksburg, WV, USA, 2002. [Google Scholar]
- Grad, F.P. Preamble to the Constitution of the World Health Organization. Bull World Health Organ. 2002, 80, 981–982. [Google Scholar] [PubMed]
- Malnar, J.M.; Vodvarka, F. Sensory Design; Minneapolis University of Minnesota Press: Minneapolis, MN, USA, 2004. [Google Scholar]
- Tveit, M.; Ode, Å.; Fry, G. Key Concepts in a Framework for Analysing Visual Landscape Character. Landsc. Res. 2006, 31, 229–255. [Google Scholar] [CrossRef]
- Hunter, M.D.; Eickhoff, S.B.; Pheasant, R.J.; Douglas, M.J.; Watts, G.R.; Farrow, T.F.D.; Hyland, D.; Kang, J.; Wilkinson, I.D.; Horoshenkov, K.V.; et al. The State of Tranquility: Subjective Perception Is Shaped by Contextual Modulation of Auditory Connectivity. NeuroImage 2010, 53, 611–618. [Google Scholar] [CrossRef] [PubMed]
- Gibson, J.J. The Senses Considered as Perceptual Systems; Houghton Mifflin: Boston, MA, USA, 1966. [Google Scholar]
- Brewer, J.M.; Shavit, A.Y.; Shepard, T.G.; Veldhuizen, M.G.; Parikh, R.; Marks, L.E. Identification of Gustatory—Olfactory Flavor Mixtures: Effects of Linguistic Labeling. Chem. Senses 2013, 38, 305–313. [Google Scholar] [CrossRef] [PubMed]
- Sternberg, E.M. Healing Spaces: The Science of Place and Well-Being; Belknap Press of Harvard University Press: Cambridge, MA, USA, 2009. [Google Scholar]
- Lea, J. Retreating to Nature: Rethinking ‘Therapeutic Landscapes’. Area 2008, 40, 90–98. [Google Scholar] [CrossRef]
- Field, A. Discovering Statistics Using SPSS, 3rd ed.; Sage: London, UK, 2009. [Google Scholar]
- Aron, A.; Coups, E.J.; Aron, E.N. Statistics for the Behavioral and Social Sciences: A Brief Course, 5th ed.; Pearson Prentice Hall: London, UK, 2008. [Google Scholar]
- Seppänen, O.A.; Fisk, W.J.; Mendell, M.J. Association of Ventilation Rates and CO2 Concentrations with Health and Other Responses in Commercial and Institutional Buildings. Indoor Air 1999, 9, 226–252. [Google Scholar]
- Browning, W.; Ryan, C.; Clancy, J. 14 Patterns of Biophilic Design. In Improving Health & Well-Being in the Built Environment, 62th ed.; Terrapin Bright Green LLC: New York, NY, USA, 2014. [Google Scholar]
- Wilson, E.O. Biophilia; Harvard University Press: Cambridge, MA, USA, 1984. [Google Scholar]
- Ulrich, R.S. Biophilia, Biophobia, and Natural Landscapes. In The Biophilia Hypothesis; Kellert, S.R., Wilson, E.O., Eds.; Island Press: Washington, DC, USA, 1993; pp. 73–137. [Google Scholar]
- HKGBC. Beam Plus New Buildings Version 1.2; BEAM Society Limited: Hong Kong, China, 2012. [Google Scholar]
- Building and Construction Authority (BCA). Bca Green Mark Certification Standard for New Buildings; BCA, Ed.; Building and Construction Authority: Singapore, 2012; p. 205.
- Eisen, K.P.; Allen, G.J.; Bollash, M.; Pescatello, L.S. Stress Management in the Workplace: A Comparison of a Computer-Based and an in-Person Stress-Management Intervention. Comput. Hum. Behav. 2008, 24, 486–496. [Google Scholar] [CrossRef]


| Green Features | Rating Systems | Criteria |
|---|---|---|
| Natural Ventilation | LEED V4 Building Design and Construction | Demonstrate that the system design for occupied spaces employs appropriate strategies in Chartered Institution of Building Services Engineers (CIBSE) Applications Manual AM10, March 2005, Natural Ventilation in Non-Domestic Buildings, Section 2.4. |
| BEAM Plus New Building V1.2 | The occupied premises designed to utilize natural ventilation request to provide a minimal background ventilation to control indoor air pollutants | |
| Green Mark New Building V4.1 | Encourage the building design to facilitate good natural ventilation with a minimum average wind velocity of 0.6 m/s within the functional space/units. | |
| Daylight and View Quality | LEED V4 Building Design and Construction | To connect building occupants with the outdoors, reinforce circadian rhythms, and reduce the use of electrical lighting by introducing daylight into space. |
| To give building occupants a connection to the outdoor environment by providing quality views with a direct line of sight to the outdoors via vision glazing for 75% of all regularly occupied floor area. View glazing in the contributing area must provide a clear image of the exterior. | ||
| BEAM Plus New Building V1.2 | Encourage a holistic examination of site layout, building design, and fenestration design, such as to maximize access to daylight for improved health and comfort. | |
| Green Mark New Building V4.1 | Encourage design that optimizes the use of effective daylighting to reduce energy use for artificial lighting. | |
| Green Space | LEED V4 Building Design and Construction | Provide outdoor space greater than or equal to 30% of the total site area (including building footprint). A minimum of 25% of that outdoor space must be vegetated (turf grass does not count) or have overhead vegetated canopy. |
| BEAM Plus New Building V1.2 | Using pervious materials for a minimum of 50% of hard landscaped areas; providing appropriate planting on site equivalent to at least 30%/40% of the site area. | |
| Green Mark New Building V4.1 | Provision of greenery within the developments including rooftop/sky garden and a green roof. Green Plot Ratio is calculated by considering the 3D volume covered by plants (Leaf Area Index). | |
| Programmes and Amenities | LEED V4 Building Design and Construction | To promote walkability, transportation efficiency and reduce vehicle distance traveled; to improve public health by encouraging daily physical activity. |
| BEAM Plus New Building V1.2 | Providing at least three amenity features that enhance the quality and functionality of a building to the benefit of building users, i.e., recreational facilities, balconies, common areas, etc. |
| List | Region | Property Program | Year of Built or Retrofit | Building Certificate | Building Morphology | Ventilation Mode |
|---|---|---|---|---|---|---|
| 1 | Hong Kong | Commercial Setting | 2003 | LEED O+M GOLD; Beam Plus EB Platinum | Building cluster | Air conditioning |
| 2 | Hong Kong | Commercial Setting | 2008 | Beam Plus NB Platinum | Building cluster | Air conditioning |
| 3 | Hong Kong | Commercial Setting | 1990s | NIL | Building cluster | Air conditioning |
| 4 | Hong Kong | Commercial Setting | 1990s | NIL | Individual building | Air conditioning |
| 5 | Hong Kong | Institutional Setting | 1990s | NIL | Individual building | Air conditioning |
| 6 | Hong Kong | Institutional Setting | 2012 | LEED BD+C Platinum; Beam Plus NB Platinum | Building cluster | Air conditioning |
| 7 | Hong Kong | Institutional Setting | 2012 | BEAM Plus NB Provisional Gold | Individual building | Mixed ventilation |
| 8 | Singapore | Commercial Setting | 2000s | NIL | Individual building | Mixed ventilation |
| 9 | Singapore | Commercial Setting | 2000s | NIL | Building cluster | Air conditioning |
| 10 | Singapore | Commercial Setting | 2010 | Green Mark Platinum | Building cluster | Mixed ventilation |
| 11 | Singapore | Commercial Setting | 2013 | Green Mark Platinum | Building cluster | Mixed ventilation |
| 12 | Singapore | Institutional Setting | 1990s | NIL | Building cluster | Mixed ventilation |
| 13 | Singapore | Institutional Setting | 2012 | Green Mark Platinum | Individual building | Mixed ventilation |
| 14 | Singapore | Institutional Setting | 2011 | Green Mark Platinum | Individual building | Mixed ventilation |
| Demographic Information | Number | Percentage |
|---|---|---|
| Region | ||
| Hong Kong | 203 | 49.2% |
| Singapore | 210 | 50.8% |
| Gender | ||
| male | 197 | 47.7% |
| female | 216 | 52.3% |
| Age | ||
| 25 and below | 86 | 20.8% |
| 26–40 | 240 | 58.1% |
| 41–60 | 80 | 19.4% |
| 61 and above | 7 | 1.7% |
| Education level | ||
| Secondary school | 23 | 5.6% |
| College/academy | 130 | 31.5% |
| Postgraduate | 260 | 63.0% |
| Self-reported health status | ||
| Healthy | 329 | 79.7% |
| Neutral | 76 | 18.4% |
| Unhealthy | 8 | 1.9% |
| Green Features | Number | Percentage |
|---|---|---|
| Certification | ||
| Green building | 245 | 59.3% |
| Non-green building | 168 | 40.7% |
| Ventilation mode | ||
| Air-conditioning | 193 | 46.7% |
| Mixed-ventilation | 220 | 53.3% |
| Visual connection | ||
| Connection with outdoor green space | 195 | 47.2% |
| No connection with outdoor green space | 218 | 52.8% |
| Building morphology | ||
| Building cluster | 223 | 54.0% |
| Individual building | 190 | 46.0% |
| Property programme | ||
| Commercial setting | 211 | 51.1% |
| Institutional setting | 202 | 48.9% |
| Domain | Category | Questions | Measurement |
|---|---|---|---|
| Health Evaluation | Personal Sensation | Physical feeling (PF) | 1 No concern to 5 Strong concern |
| Psychological perception (PP) | 1 No concern to 5 Strong concern | ||
| Sensorial Assumptions | Visual connection (VC) | 1 No concern to 5 Strong concern | |
| Aesthetics (LA) | 1 No concern to 5 Strong concern | ||
| Auditory perception (AP) | 1 No concern to 5 Strong concern | ||
| Olfactory perception (OP) | 1 No concern to 5 Strong concern | ||
| Haptic perception (HP) | 1 No concern to 5 Strong concern | ||
| Gustatory perception (GP) | 1 No concern to 5 Strong concern | ||
| Thermal comfort (TC) | 1 No concern to 5 Strong concern | ||
| Healing Performance | Meditation and relaxation (MR) | 1 No concern to 5 Strong concern | |
| Healing efficacy (HE) | 1 No concern to 5 Strong concern | ||
| Healing requirement (HR) | 1 No concern to 5 Strong concern |
| PF | PP | VC | LA | AP | OP | HP | GP | TC | MR | HE | HR | |
|---|---|---|---|---|---|---|---|---|---|---|---|---|
| PF | 1 | 0.782 ** | 0.477 ** | 0.444 ** | 0.384 ** | 0.317 ** | 0.336 ** | 0.311 ** | 0.110 * | 0.408 ** | 0.447 ** | 0.392 ** |
| PP | 1 | 0.463 ** | 0.440 ** | 0.385 ** | 0.314 ** | 0.310 ** | 0.292 ** | 0.099 * | 0.384 ** | 0.428 ** | 0.362 ** | |
| VC | 1 | 0.718 ** | 0.586 ** | 0.441 ** | 0.426 ** | 0.389 ** | 0.172 ** | 0.519 ** | 0.500 ** | 0.422 ** | ||
| LA | 1 | 0.572 ** | 0.469 ** | 0.498 ** | 0.413 ** | 0.206 ** | 0.491 ** | 0.527 ** | 0.469 ** | |||
| AP | 1 | 0.557 ** | 0.480 ** | 0.445 ** | 0.196 ** | 0.412 ** | 0.451 ** | 0.416 ** | ||||
| OP | 1 | 0.503 ** | 0.532 ** | 0.216 ** | 0.352 ** | 0.464 ** | 0.400 ** | |||||
| HP | 1 | 0.544 ** | 0.316 ** | 0.335 ** | 0.461 ** | 0.452 ** | ||||||
| GP | 1 | 0.240 ** | 0.350 ** | 0.418 ** | 0.371 ** | |||||||
| TC | 1 | 0.249 ** | 0.226 ** | 0.219 ** | ||||||||
| MR | 1 | 0.633 ** | 0.486 ** | |||||||||
| HE | 1 | 0.615 ** | ||||||||||
| HR | 1 |
| Category | Indicator | Group | Mean | Std. Deviation | t-Test for Equality of Means | |||
|---|---|---|---|---|---|---|---|---|
| t | Df | Sig. (2-Tailed) | Mean Diff. | |||||
| Integrated Index | Sensation index | Green | −0.043 | 0.935 | −1.124 | 411.000 | 0.262 | −0.106 |
| Non-Green | 0.063 | 0.957 | −1.119 | 353.492 | 0.264 | −0.106 | ||
| Assumption index | Green | −0.048 | 0.719 | −1.665 | 411 | 0.097 | −0.119 | |
| Non-Green | 0.070 | 0.697 | −1.675 | 366.161 | 0.095 | −0.119 | ||
| Performance index | Green | −0.062 | 0.832 | −1.808 | 411 | 0.071 | −0.153 | |
| Non-Green | 0.091 | 0.865 | −1.795 | 349.787 | 0.074 | −0.153 | ||
| Personal Sensation | Physical feeling | Green | 4.18 | 0.587 | −0.366 | 411 | 0.715 | −0.023 |
| Non-Green | 4.20 | 0.671 | −0.357 | 326.838 | 0.722 | −0.023 | ||
| Psychological perception | Green | 4.22 | 0.606 | −1.759 | 411 | 0.079 | −0.105 | |
| Non-Green | 4.32 | 0.582 | −1.772 | 368.052 | 0.077 | −0.105 | ||
| Sensorial Assumption | Visual connection | Green | 4.42 | 0.543 | −1.792 | 411 | 0.074 | −0.099 |
| Non-Green | 4.52 | 0.568 | −1.777 | 348.070 | 0.076 | −0.099 | ||
| Landscape aesthetics | Green | 4.37 | 0.562 | −1.957 | 411 | 0.051 | −0.111 | |
| Non-Green | 4.48 | 0.568 | −1.953 | 356.568 | 0.052 | −0.111 | ||
| Auditory stimulation | Green | 4.25 | 0.684 | −1.367 | 411 | 0.172 | −0.092 | |
| Non-Green | 4.35 | 0.657 | −1.378 | 368.580 | 0.169 | −0.092 | ||
| Olfactory stimulation | Green | 4.04 | 0.737 | 0.351 | 411 | 0.726 | 0.027 | |
| Non-Green | 4.02 | 0.815 | 0.344 | 334.709 | 0.731 | 0.027 | ||
| Haptic stimulation | Green | 3.98 | 0.768 | −0.057 | 411 | 0.955 | −0.004 | |
| Non-Green | 3.99 | 0.797 | −0.056 | 350.330 | 0.955 | −0.004 | ||
| Gustatory stimulation | Green | 3.99 | 0.741 | −1.137 | 411 | 0.256 | −0.086 | |
| Non-Green | 4.08 | 0.766 | −1.130 | 351.131 | 0.259 | −0.086 | ||
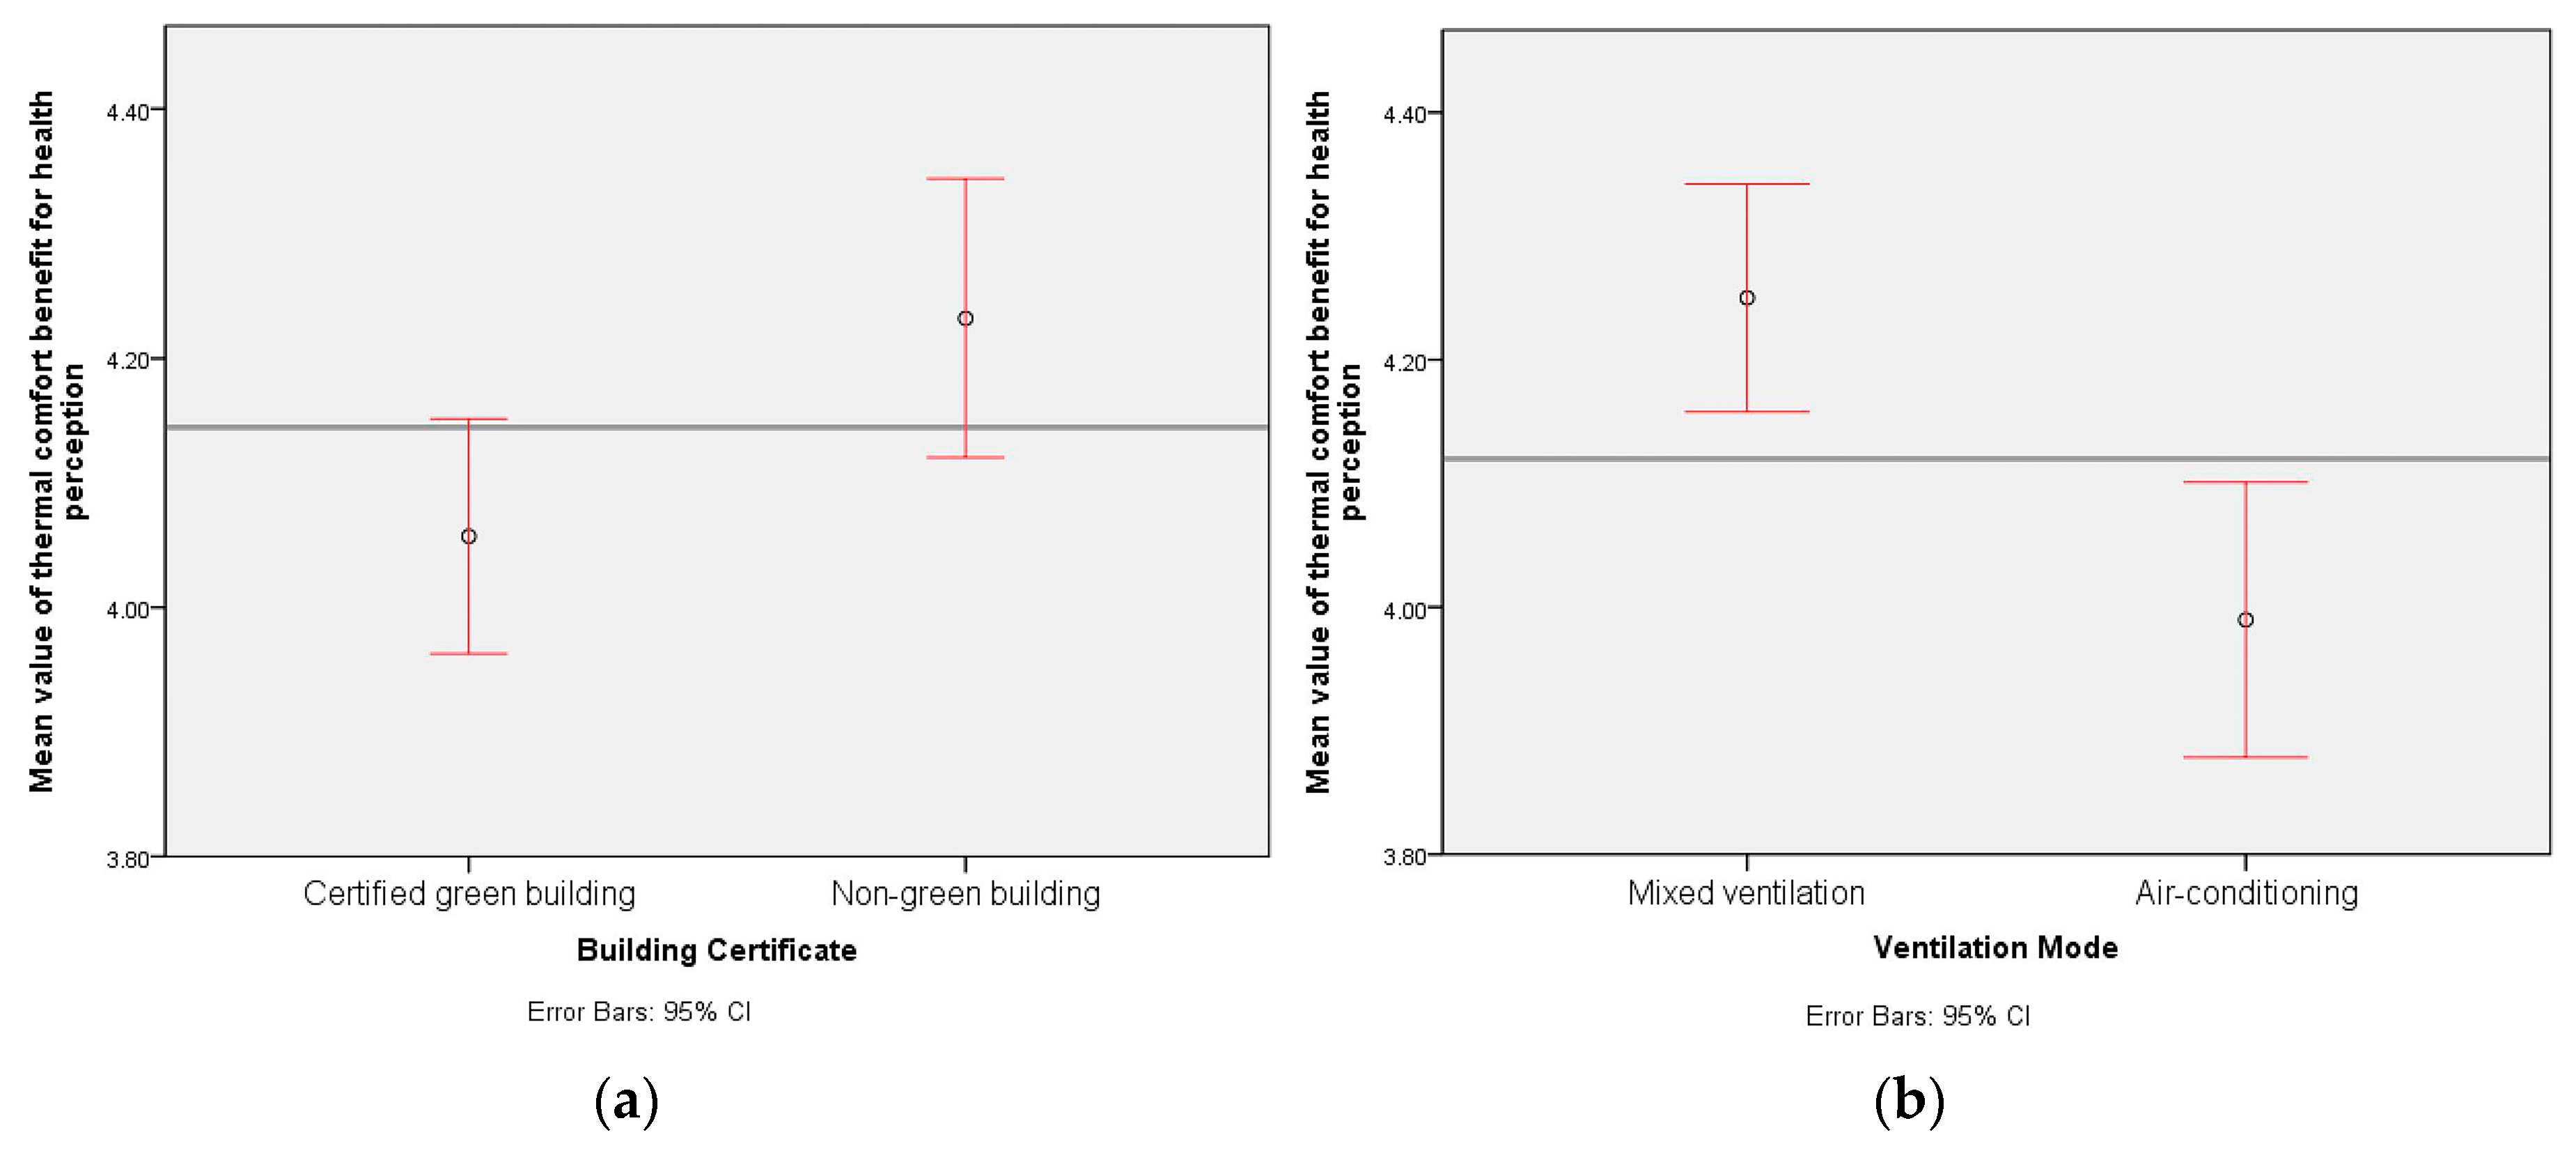
| Thermal comfort | Green | 4.06 | 0.750 | −2.350 | 411 | 0.019 * | −0.175 | |
| Non-Green | 4.23 | 0.734 | −2.359 | 364.010 | 0.019 | −0.175 | ||
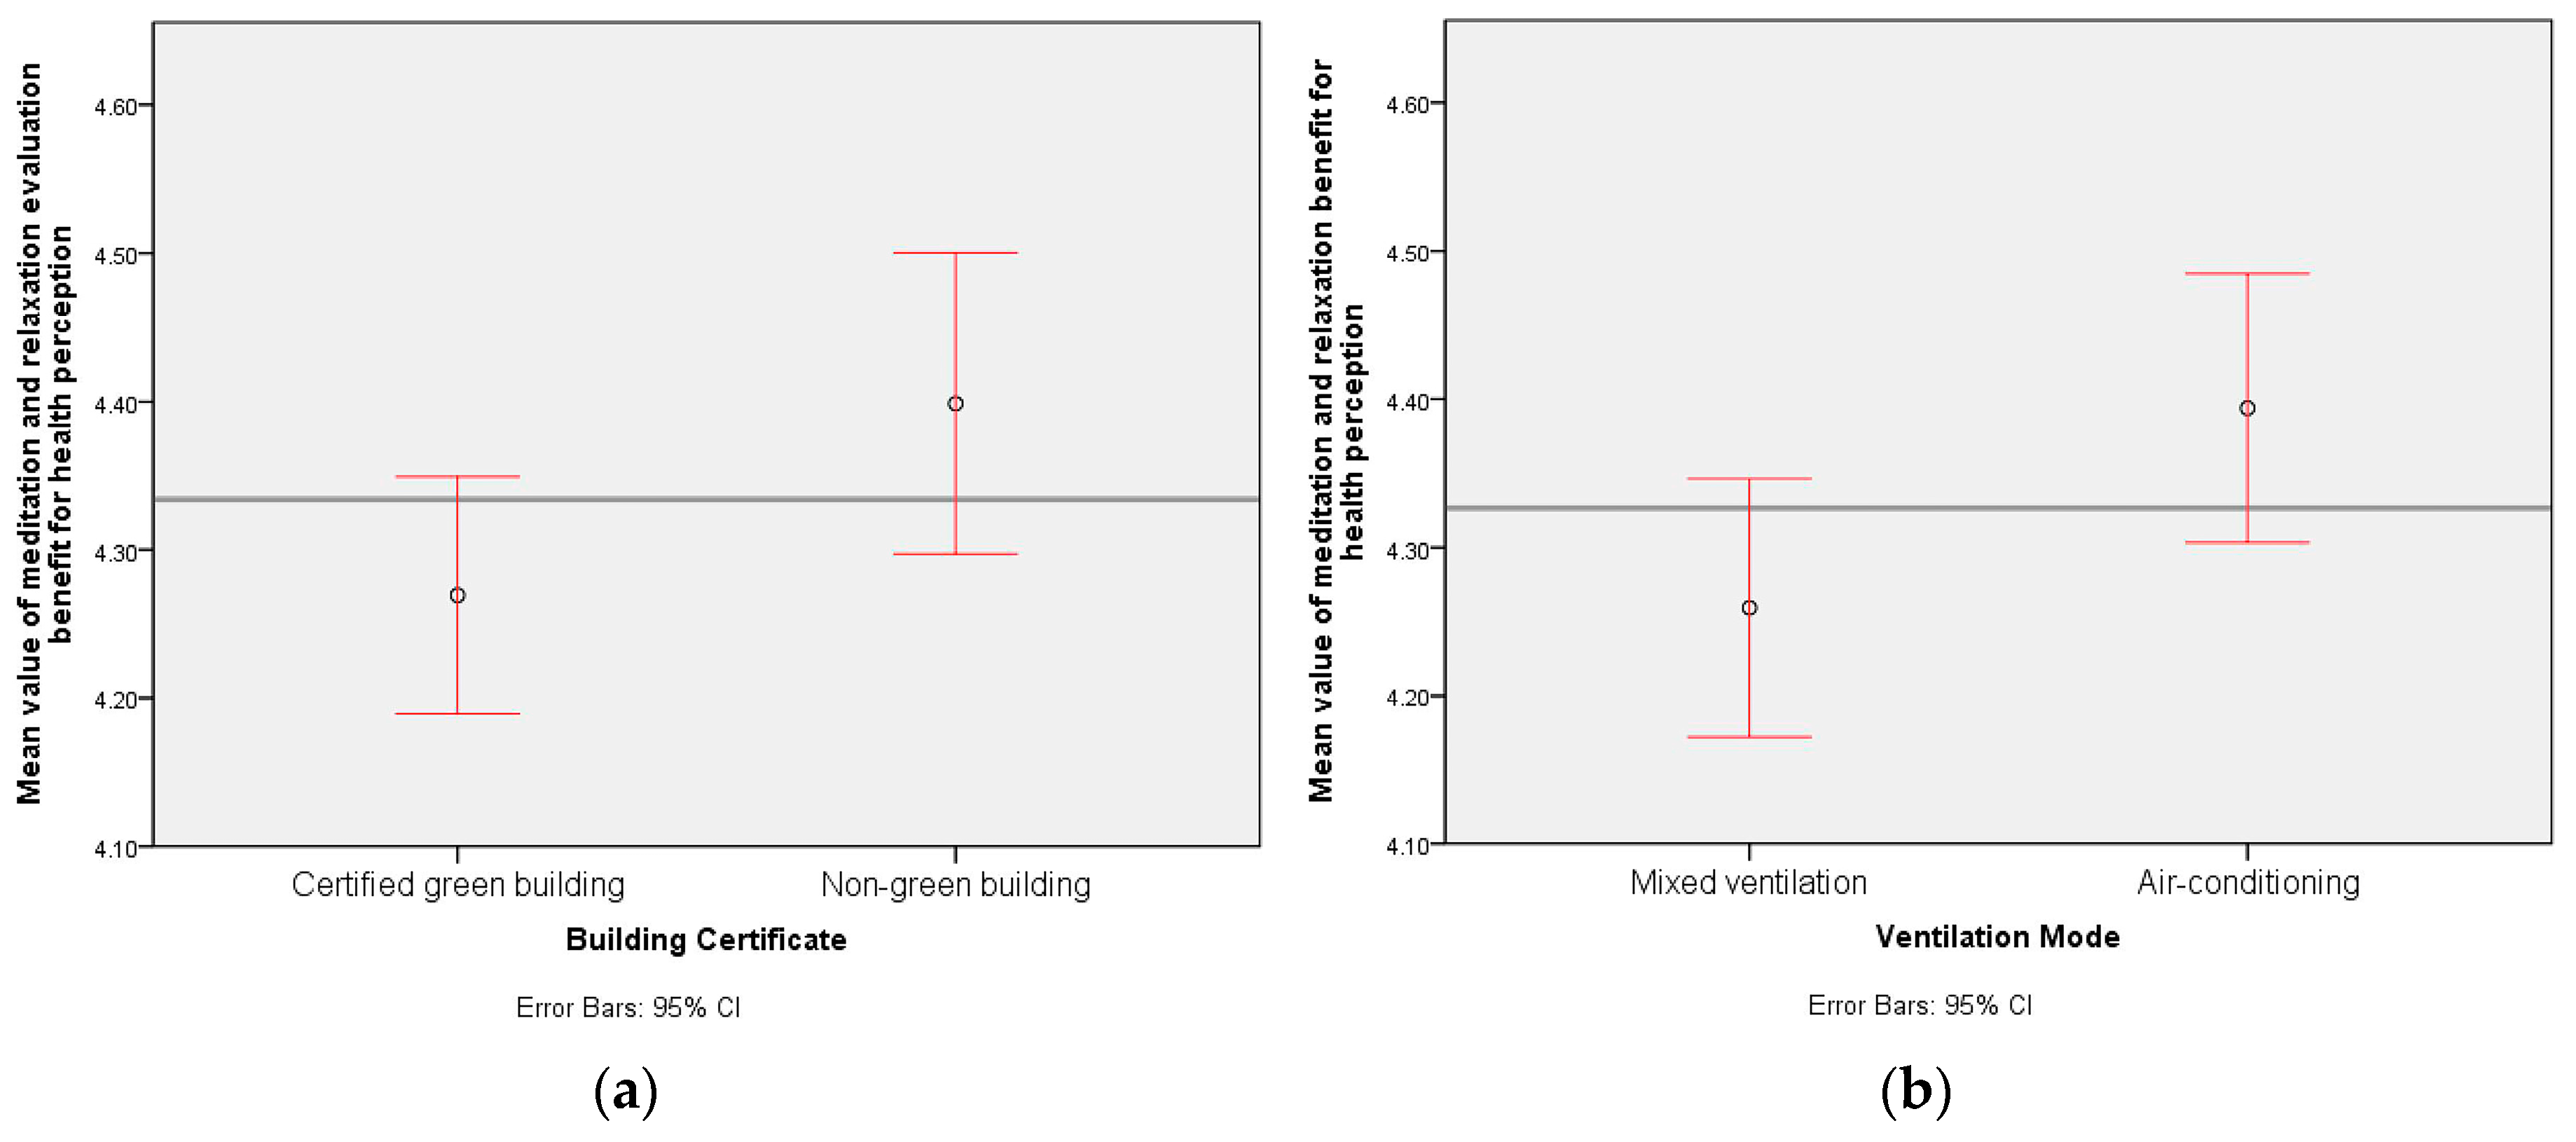
| Healing Performance | Meditation and relaxation | Green | 4.27 | 0.634 | −1.994 | 411 | 0.047 * | −0.129 |
| Non-Green | 4.40 | 0.667 | −1.976 | 347.099 | 0.049 | −0.129 | ||
| Healing efficacy | Green | 4.21 | 0.637 | −0.944 | 411 | 0.346 | −0.062 | |
| Non-Green | 4.27 | 0.672 | −0.934 | 346.191 | 0.351 | −0.062 | ||
| Healing requirement | Green | 4.04 | 0.748 | −1.657 | 411 | 0.098 | −0.124 | |
| Non-Green | 4.16 | 0.745 | −1.658 | 360.120 | 0.098 | −0.124 | ||
| Category | Indicator | Group | Mean | Std. Deviation | t-Test for Equality of Means | |||
|---|---|---|---|---|---|---|---|---|
| t | Df | Sig. (2-Tailed) | Mean Diff. | |||||
| Integrated Index | Sensation index | Mixed mode | −0.117 | 0.918 | −2.718 | 411.000 | 0.007 # | −0.251 |
| Air-con | 0.134 | 0.958 | −2.711 | 399.013 | 0.007 | −0.251 | ||
| Assumption index | Mixed mode | −0.035 | 0.702 | −1.072 | 411 | 0.284 | −0.075 | |
| Air-con | 0.040 | 0.723 | −1.070 | 400.792 | 0.285 | −0.075 | ||
| Performance index | Mixed mode | −0.117 | 0.835 | −3.029 | 411 | 0.003 ** | −0.251 | |
| Air-con | 0.134 | 0.844 | −3.027 | 402.919 | 0.003 | −0.251 | ||
| Personal Sensation | Physical feeling | Mixed mode | 4.11 | 0.610 | −2.807 | 411 | 0.005 # | −0.171 |
| Air-con | 4.28 | 0.625 | −2.802 | 401.298 | 0.005 | −0.171 | ||
| Psychological perception | Mixed mode | 4.20 | 0.584 | −2.321 | 411 | 0.021 # | −0.136 | |
| Air-con | 4.33 | 0.607 | −2.315 | 399.368 | 0.021 | −0.136 | ||
| Sensorial Assumptions | Visual connection | Mixed mode | 4.40 | 0.551 | −2.738 | 411 | 0.006 ** | −0.149 |
| Air-con | 4.54 | 0.549 | −2.738 | 404.478 | 0.006 | −0.149 | ||
| Landscape aesthetics | Mixed mode | 4.35 | 0.574 | −2.561 | 411 | 0.011 * | −0.142 | |
| Air-con | 4.49 | 0.551 | −2.568 | 407.644 | 0.011 | −0.142 | ||
| Auditory stimulation | Mixed mode | 4.22 | 0.674 | −2.343 | 411 | 0.020 * | −0.155 | |
| Air-con | 4.37 | 0.666 | −2.345 | 405.253 | 0.020 | −0.155 | ||
| Olfactory stimulation | Mixed mode | 4.06 | 0.722 | 0.711 | 411 | 0.478 | 0.054 | |
| Air-con | 4.01 | 0.820 | 0.705 | 385.731 | 0.481 | 0.054 | ||
| Haptic stimulation | Mixed mode | 3.92 | 0.764 | −1.752 | 411 | 0.080 | −0.134 | |
| Air-con | 4.06 | 0.792 | −1.748 | 399.787 | 0.081 | −0.134 | ||
| Gustatory stimulation | Mixed mode | 4.02 | 0.721 | −0.244 | 411 | 0.808 | −0.018 | |
| Air-con | 4.04 | 0.786 | −0.242 | 392.521 | 0.809 | −0.018 | ||
| Thermal comfort | Mixed mode | 4.25 | 0.693 | 3.582 | 411 | 0.000 *** | 0.260 | |
| Air-con | 3.99 | 0.784 | 3.554 | 386.388 | 0.000 | 0.260 | ||
| Healing Performance | Meditation and relaxation | Mixed mode | 4.26 | 0.656 | −2.109 | 411 | 0.036 * | −0.135 |
| Air-con | 4.39 | 0.638 | −2.113 | 406.678 | 0.035 | −0.135 | ||
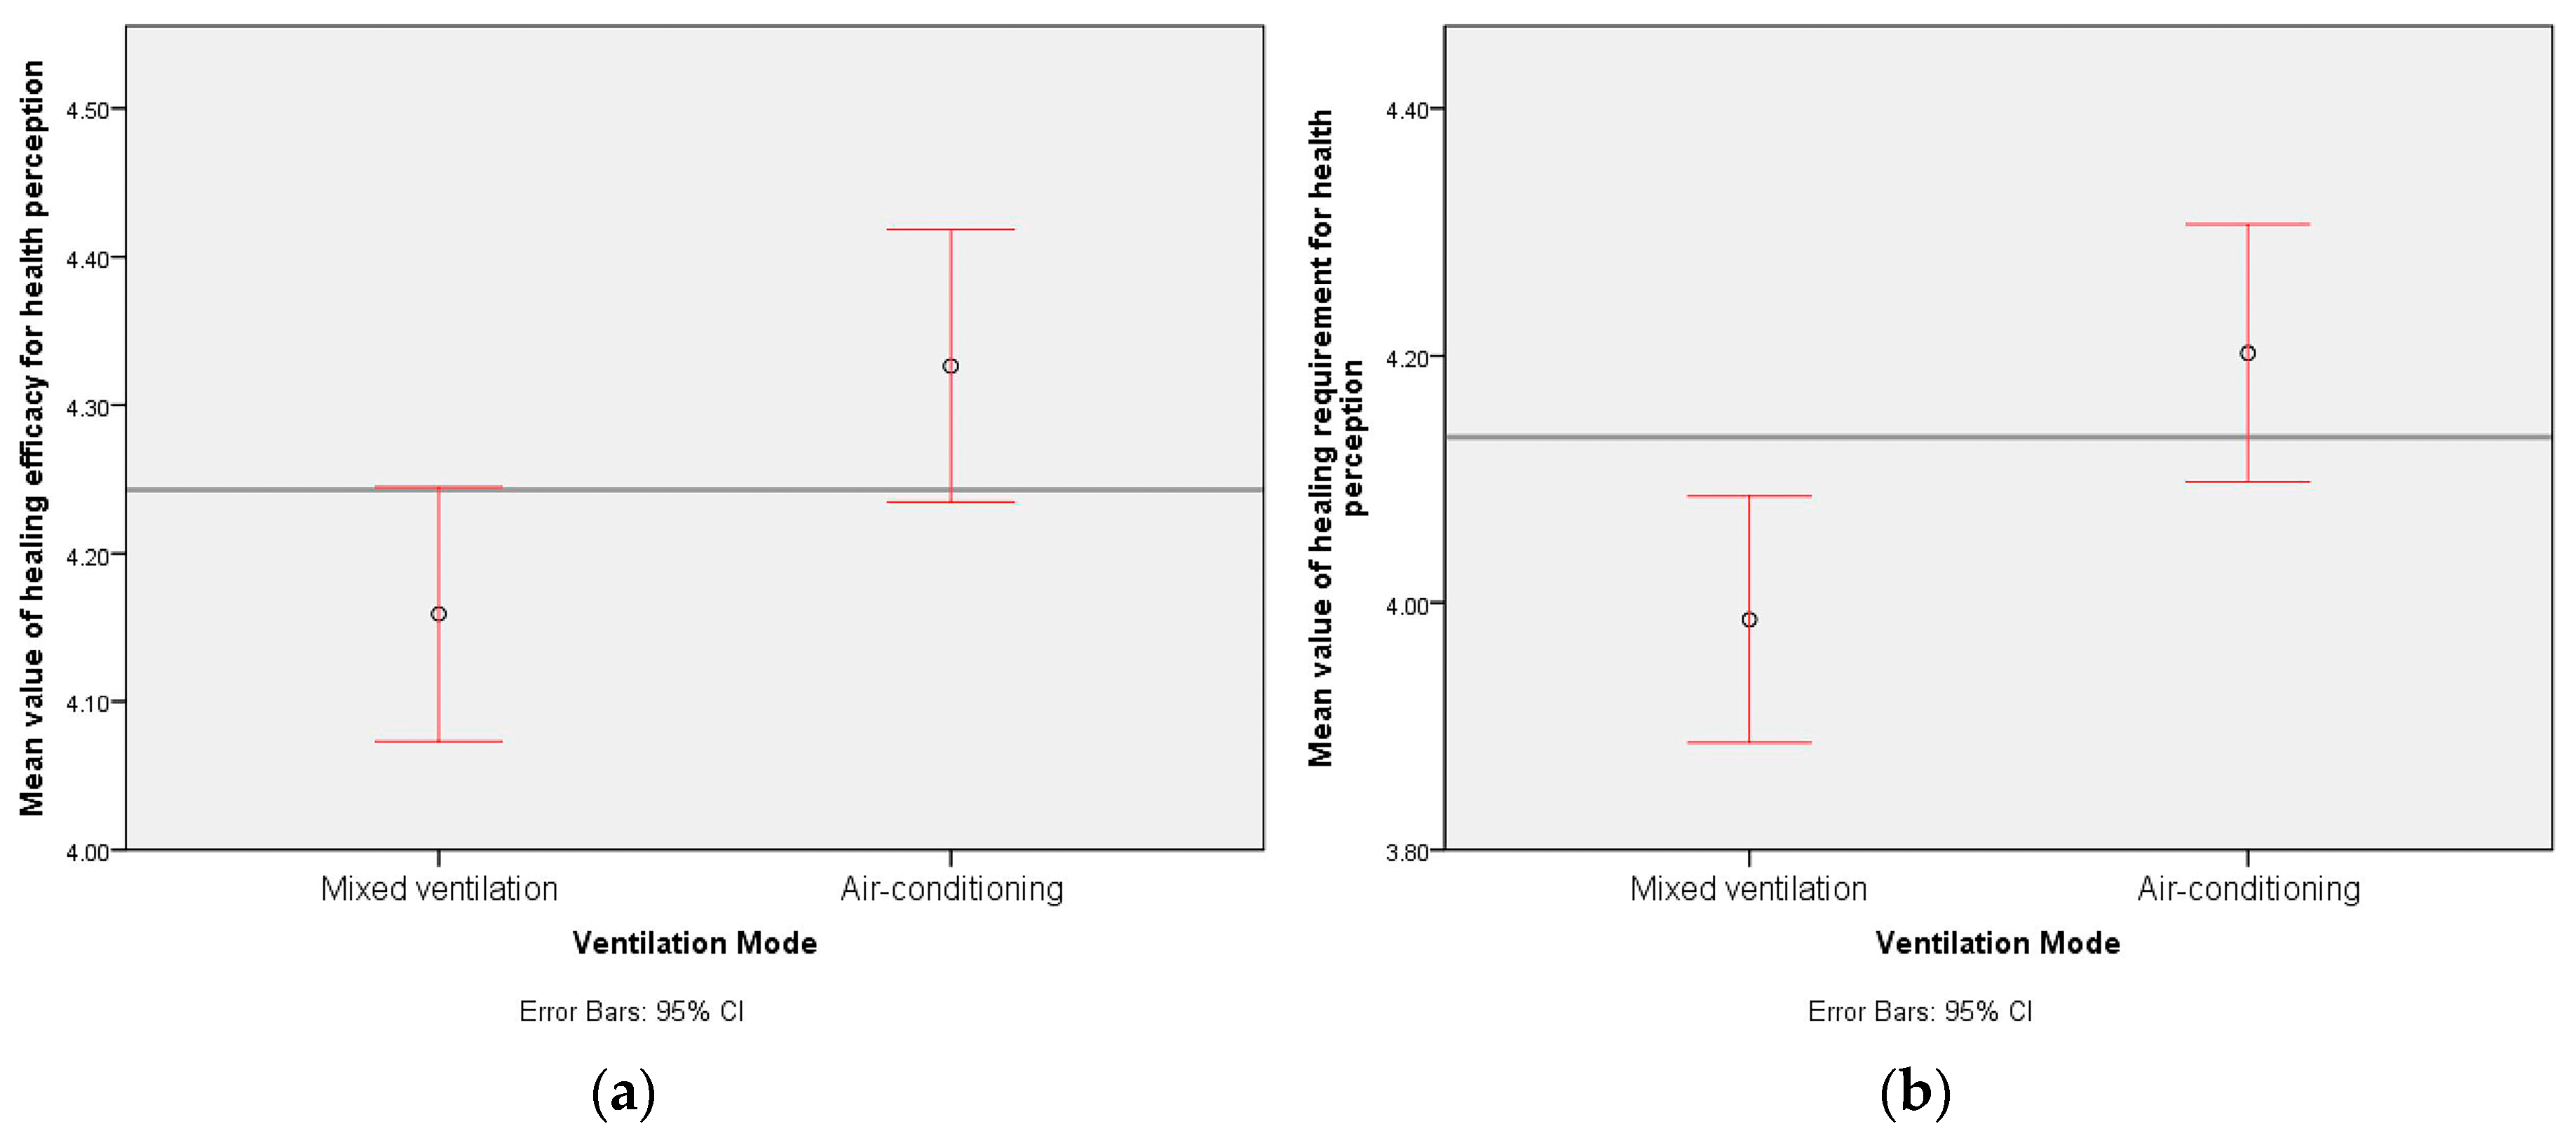
| Healing efficacy | Mixed mode | 4.16 | 0.646 | −2.624 | 411 | 0.009 ** | −0.167 | |
| Air-con | 4.33 | 0.647 | −2.623 | 403.849 | 0.009 | −0.167 | ||
| Healing requirement | Mixed mode | 3.99 | 0.749 | −2.949 | 411 | 0.003 ** | −0.216 | |
| Air-con | 4.20 | 0.733 | −2.953 | 406.159 | 0.003 | −0.216 | ||
| Category | Indicator | Group | Mean | Std. Deviation | t-Test for Equality of Means | |||
|---|---|---|---|---|---|---|---|---|
| t | Df | Sig. (2-Tailed) | Mean Diff. | |||||
| Integrated Index | Sensation index | Cluster | 0.0150 | 0.943 | 0.349 | 411 | 0.727 | 0.033 |
| Individual | −0.0176 | 0.947 | 0.349 | 400.066 | 0.727 | 0.033 | ||
| Assumption index | Cluster | −0.045 | 0.726 | −1.388 | 411 | 0.166 | −0.097 | |
| Individual | 0.053 | 0.693 | −1.393 | 405.653 | 0.164 | −0.097 | ||
| Performance index | Cluster | 0.004 | 0.861 | 0.097 | 411 | 0.922 | 0.008 | |
| Individual | −0.004 | 0.834 | 0.098 | 404.312 | 0.922 | 0.008 | ||
| Personal Sensation | Physical feeling | Cluster | 4.20 | 0.607 | 0.457 | 411 | 0.648 | 0.028 |
| Individual | 4.17 | 0.639 | 0.456 | 393.396 | 0.649 | 0.028 | ||
| Psychological perception | Cluster | 4.26 | 0.598 | 0.202 | 411 | 0.840 | 0.012 | |
| Individual | 4.25 | 0.599 | 0.202 | 400.387 | 0.840 | 0.012 | ||
| Sensorial Assumption | Visual connection | Cluster | 4.49 | 0.552 | 1.127 | 411 | 0.260 | 0.062 |
| Individual | 4.43 | 0.557 | 1.126 | 399.618 | 0.261 | 0.062 | ||
| Landscape aesthetics | Cluster | 4.42 | 0.546 | 0.022 | 411 | 0.982 | 0.001 | |
| Individual | 4.42 | 0.592 | 0.022 | 388.655 | 0.982 | 0.001 | ||
| Auditory stimulation | Cluster | 4.29 | 0.683 | −0.116 | 411 | 0.908 | −0.008 | |
| Individual | 4.29 | 0.665 | −0.116 | 403.837 | 0.907 | −0.008 | ||
| Olfactory stimulation | Cluster | 3.98 | 0.777 | −1.487 | 411 | 0.138 | −0.113 | |
| Individual | 4.09 | 0.757 | −1.490 | 403.645 | 0.137 | −0.113 | ||
| Haptic stimulation | Cluster | 3.95 | 0.809 | −1.111 | 411 | 0.267 | −0.085 | |
| Individual | 4.03 | 0.741 | −1.119 | 408.835 | 0.264 | −0.085 | ||
| Gustatory stimulation | Cluster | 3.96 | 0.788 | −1.836 | 411 | 0.067 | −0.136 | |
| Individual | 4.10 | 0.702 | −1.853 | 410.160 | 0.065 | −0.136 | ||
| Thermal comfort | Cluster | 4.01 | 0.805 | −3.565 | 411 | 0.000 *** | −0.259 | |
| Individual | 4.27 | 0.648 | −3.627 | 409.685 | 0.000 | −0.259 | ||
| Healing Performance | Meditation and relaxation | Cluster | 4.34 | 0.629 | 0.483 | 411 | 0.629 | 0.031 |
| Individual | 4.31 | 0.676 | 0.481 | 390.024 | 0.631 | 0.031 | ||
| Healing efficacy | Cluster | 4.22 | 0.653 | −0.442 | 411 | 0.659 | −0.028 | |
| Individual | 4.25 | 0.650 | −0.442 | 401.286 | 0.659 | −0.028 | ||
| Healing requirement | Cluster | 4.09 | 0.762 | 0.206 | 411 | 0.837 | 0.015 | |
| Individual | 4.08 | 0.734 | 0.206 | 404.895 | 0.837 | 0.015 | ||
| Comparative Category | Personal Sensation | Sensorial Assumption | Healing Performance | ||||||||||
|---|---|---|---|---|---|---|---|---|---|---|---|---|---|
| PF | PP | VC | LA | AS | OS | HS | GS | TC | MR | HE | HR | ||
| Green Features | Building certification | -- | -- | -- | -- | -- | -- | -- | -- | √ | √ | -- | -- |
| Ventilation mode | √ | √ | √ | √ | √ | -- | -- | -- | √ | √ | √ | √ | |
| Building morphology | -- | -- | -- | -- | -- | -- | -- | -- | √ | -- | -- | -- | |
| Building function | -- | -- | -- | -- | -- | -- | -- | -- | -- | -- | -- | -- | |
| Visual connection | -- | -- | -- | -- | -- | -- | -- | -- | -- | -- | -- | -- | |
© 2016 by the authors; licensee MDPI, Basel, Switzerland. This article is an open access article distributed under the terms and conditions of the Creative Commons Attribution (CC-BY) license (http://creativecommons.org/licenses/by/4.0/).
Share and Cite
Xue, F.; Gou, Z.; Lau, S.S.Y. Human Factors in Green Office Building Design: The Impact of Workplace Green Features on Health Perceptions in High-Rise High-Density Asian Cities. Sustainability 2016, 8, 1095. https://doi.org/10.3390/su8111095
Xue F, Gou Z, Lau SSY. Human Factors in Green Office Building Design: The Impact of Workplace Green Features on Health Perceptions in High-Rise High-Density Asian Cities. Sustainability. 2016; 8(11):1095. https://doi.org/10.3390/su8111095
Chicago/Turabian StyleXue, Fei, Zhonghua Gou, and Stephen Siu Yu Lau. 2016. "Human Factors in Green Office Building Design: The Impact of Workplace Green Features on Health Perceptions in High-Rise High-Density Asian Cities" Sustainability 8, no. 11: 1095. https://doi.org/10.3390/su8111095