Article

A Study of the Time–Space Evolution Characteristics of Urban–Rural Integration Development in a Mountainous Area Based on ESDA-GIS: The Case of the Qinling-Daba Mountains in China

College of Urban and Environmental Science, Northwest University, Xi’an 710127, China
*
Author to whom correspondence should be addressed.
Sustainability 2016, 8(11), 1085; https://doi.org/10.3390/su8111085
Submission received: 26 July 2016 / Revised: 21 September 2016 / Accepted: 10 October 2016 / Published: 25 October 2016
(This article belongs to the Section Sustainable Urban and Rural Development)

Abstract

:
The multi-index comprehensive evaluation method is used in this paper to estimate the urban–rural integration development level of the Qinling-Daba Mountains in China and build an evaluation index system that is composed by five subsystems and 18 basic indexes. The integration of the indexes is conducted through linear weight sum method and the weight of each index is determined through analytic network process to get the urban–rural integration development coordination indexes of each county in the Qinling-Daba Mountains. Meanwhile, the time–space evolution characteristic of urban–rural integration development in the Qinling-Daba Mountains in the past 10 years is studied through exploratory spatial data analysis and GIS technology. The results indicate that urban–rural integration displays a spatial imbalance, with a situation of polarization, i.e., high–level counties gathering with each other; the spatial aggregation rule of west–high, east–low is coupled with land conditions, industrial activity, and the transportation situation to affect the urban–rural development. Finally, we propose that development priorities should be circular industry, eco-agriculture, and tourism to accelerate urban–rural development and work towards a comprehensive modern transportation system and other infrastructure in the Qinling-Daba Mountains.

1. Introduction

Urban and rural areas are two entities that interact with and mutually influence each other in regional development. The urban–rural relationship is the most basic economic and social relationship of human beings. At present there is great disparity between urban and rural areas in terms of the level of development in China. As rapid industrialization and urbanization continue, urban–rural transformation and sustainable rural development have become important issues at the forefront of geographical research on the urban–rural relationship [1].
With the rapid development of new-type urbanization processes in China [2], achieving regional sustainable and balanced development has become an important part of overall harmonious urban–rural development [3], and a strategic mission to solve the urban–rural dual structure and reduce differences between urban and rural areas. Urban–rural integration development was put forward as a major strategy for sustainable rural development in the 18th Central Committee of the Communist Party of China, in 2012. In response to these policy propositions and requirements, the geographic study of coordinated urban–rural development and the construction of the modern countryside should be strengthened [4]. It will construct a kind of effective mechanism between urban and rural areas, create free mobility of resources and production factors between urban and rural areas, and foster sustainable and harmonious economic, societal, cultural, and ecological development between urban and rural areas. Inhabitants in cities and villages may have different lifestyles, but can still enjoy an equivalent living standard [5]. It aims to gradually get rid of urban–rural dualism, reduce the urban–rural gap between the rich and the poor, and balance economic development between urban and rural areas. It is also necessary to have a set of evaluation indicator system and methods that can embody the urban–rural gap and reflect the integrated development status of urban and rural areas objectively. It can be used as a method to measure the difference in development between urban and rural areas. By comparing the integrated development changes of urban and rural areas and their evolution in space and time, we can lay a foundation for exploring future industrial development, resource reserves, and ecological/environmental changes.
China covers a vast geographic area and has obvious regional features in different places, so the regional urban–rural integration development strategy has to be compatible with the local economic and social situation. Chinese mountainous areas cover an area of 6.636 million km2, 69.1% of total China’s territory. Mountainous areas have 674 million inhabitants, accounting for 55.7% of the total Chinese population. In China, the economic development level in mountainous areas is generally lower than in flat areas. Therefore, in order to solve the imbalance in urban–rural development in China, it is necessary to improve the overall development level of mountainous areas. Thus, a systematic evaluation of the urban–rural integration development level of this area from multiple perspectives is required to reveal the path of its evolution [6,7,8].
At present, studies on the evaluation of urban–rural integration development level mainly focus on flat, developed areas [9,10,11]. In recent years, studies on urban–rural integration development in the west have gradually increased, but these mainly take big cities as their core study area; there are few studies on mountain areas with small-medium cities as nodal points [4,12,13]. This disregard for mountain areas leads to a weakness in the research on differences in urban–rural integration development patterns [14]. The Qinling-Daba Mountains in southern Shaanxi (the study area in this paper) have huge mountains with deep valleys; there are frequent natural disasters and poverty in mountain areas especially. What is more, environmental protection is of high importance because of the national water conservation district of the South–to–North Water Diversion Project. This highlights the contradiction between development and protection. Through identification of the urban–rural integration development level of the Qinling-Daba Mountains, this study aims at grasping trends of urban–rural integration development and the characteristics of space–time evolution. This study also provides supports and references for the optimization of a mountain urban–rural integration model pattern through dynamic analysis.

2. Study Area and Data Processing

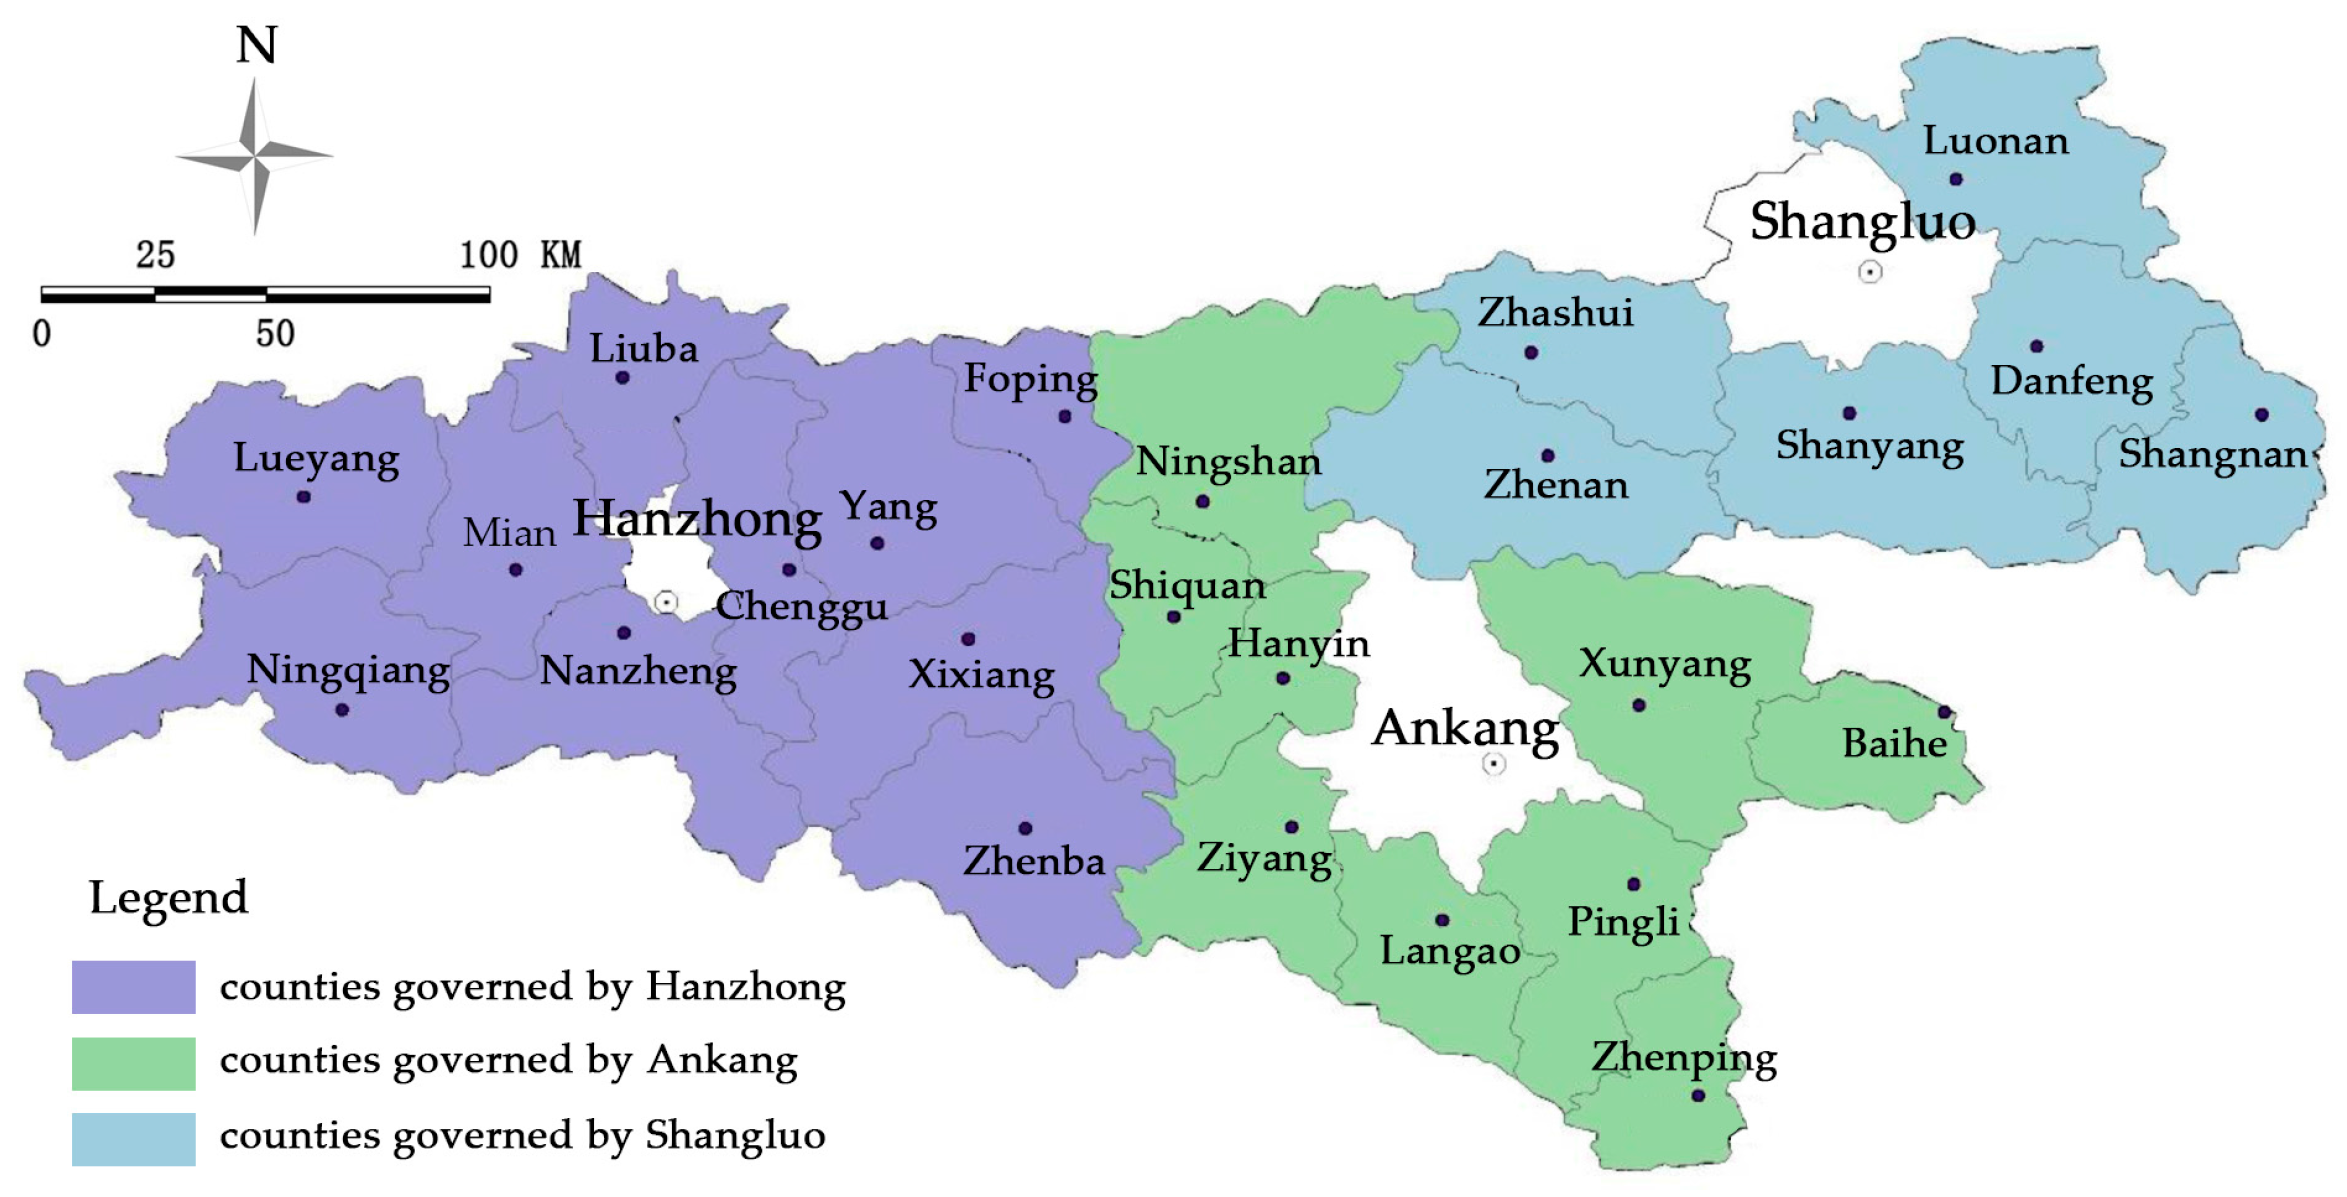
2.1. Overview of Study Area

2.1.1. Natural Resource and Environmental Basis

The Qinling-Daba Mountains are located in the south of Shaanxi province. A major ridge of the Qinling Mountains borders the Guanzhong Plain basin area and Micang Mountain, a major ridge of the Daba Mountains, borders Sichuan province. The Qinling-Daba Mountains stretch in the east–west direction with huge mountains, deep valleys, and numerous river valleys. The area of basin and flatland is less than 10%. The horizontal and vertical zonation of climate in the Qinling-Daba Mountains is noticeable. The Qinling-Daba Mountains have abundant forest specialties, mineral resources, and ecological diversity across their two climate zones, subtropical and warm temperate. In the southern Shaanxi Province, the rainfall is abundant, the topography is greatly changed, and rivers provide abundant water resources. Except for the broad valley basin along the Hanjiang River and a partial small graben basin concentrated with cultivated lands and densely populated, most areas are sparsely populated with good forest cover; a large area of old-growth forest is still reserved in the remote mountains.

2.1.2. Overview of Social and Economic Development

The Qinling-Daba Mountains are in three prefecture-level administrative districts (from west to east): Hanzhong, Ankang, and Shangluo. The national territorial area is 7.01 × 10⁴ km2, accounting for 34.1% of the whole province, and the total population is 8,390,000, accounting for 22.5% of the whole province, with a population density of 120 persons/km2. Compared with the other two areas of Shaanxi Province (Guanzhong and Northern Shaanxi), the overall economy of the Qinling-Daba Mountains is still weak, and economic development is lagging. Since 2000, the total output of southern Shaanxi has been less than 1/5 that of the whole province, with the proportion reducing year after year. GDP per capita has also been at a minimum among the three areas, equal to 1/2 of the average level of the whole province. In the Qinling-Daba Mountains land supply capacity is insufficient, road conditions are poor, and the lack of economic development leaves citizens living in poor conditions and experiencing strict ecological constraints. The lack of high–level talent, few job opportunities, and undeveloped industrial system mean that the region faces competition from Guanzhong and northern Shaanxi. In addition, Southern Shaanxi is also the source of the national Middle Route Project of the South-to-North Water Diversion and Hanjiang-to-Weihe River Diversion Project of Shaanxi Province, which subjects the region to high environmental protection pressures. Mineral resources, the secondary industry that development depends on, are mainly distributed within ecological preservation areas and water conservation areas, so the contradiction between resource development and ecological protection is serious.

2.2. Data Sources and Pre-Processing

In order to grasp the urban–rural integration development characteristics of the Qinling-Daba Mountains, it is necessary to make identifications for a certain historical period. In this paper, the essential data of 2003–2013 are adopted to analyze the urban–rural integration development level of the territory year after year. The original data used in this research derive from the Shaanxi Statistical Yearbook, the Socioeconomic Statistical Yearbook of County (city) in China, the Shaanxi Regional Statistical Yearbook, the Hanzhong Statistical Yearbook, the Ankang Statistical Yearbook, and the Shangluo Statistical Yearbook. Any index that is not included in the individual statistical yearbooks is derived from the related government department.
Original data will be given a data standardization treatment first, including data chemotaxis processing and dimensionless method. The data chemotaxis processing is conducted through taking the reciprocal for index of inverse correlation, and the reciprocal would be the mapped interval of [0, 1] by the Min-Max method.

3. Research Methods

3.1. Multi-Index Comprehensive Evaluation Method

The connotations of urban–rural integration development are abundant, not only in the economic field but also in terms of society, culture, and the environment [15,16,17]. In this highly complex situation, judgment depends on the technical support of a multi-index comprehensive evaluation method. The main elements of the urban–rural development evaluation index system were suggested by domestic scholars to reflect the contents of the human development index and the new millennium goals of the United Nations. For example, 17 specific indexes were selected and the regional urban–rural integration development evaluation index system was built from three dimensions [18]; three first class indicators and 23 second class indicators were adopted in the urban–rural integration development evaluation index system was designed to conduct an empirical analysis of the urban–rural integration development level of Nanjing [19]. The indicator system and methodology for evaluating urban–rural integration development degree was established [20]. On the operational level, the multi-index comprehensive evaluation turns a descriptive index with different evaluation objects and dimensions into a dimensionless, relative evaluation value to reach a general evaluation of this object. This approach is meant to solve the relative problems of different dimension indexes and reflect the general trends and proficiency of objects being evaluated, so as to make a fair comparison and solve sequencing problems, etc.
In this paper, the linear weight sum method is used to conduct an integration of the indexes Equation (1); the function of weight in the linear weight sum method is more obvious than in other synthesis methods. Linear compensation can be conducted between indexes; changes of index weight might reflect that there are some big and small functions each index plays in comprehensive assessment. The formula is as follows:
Z = i   =   1 n w i x i
where Z is the integrated assessment value gained by the object being evaluated, w is the weight of the index being evaluated, x is the evaluation value of a single indicator, and n is the number of the evaluation index.

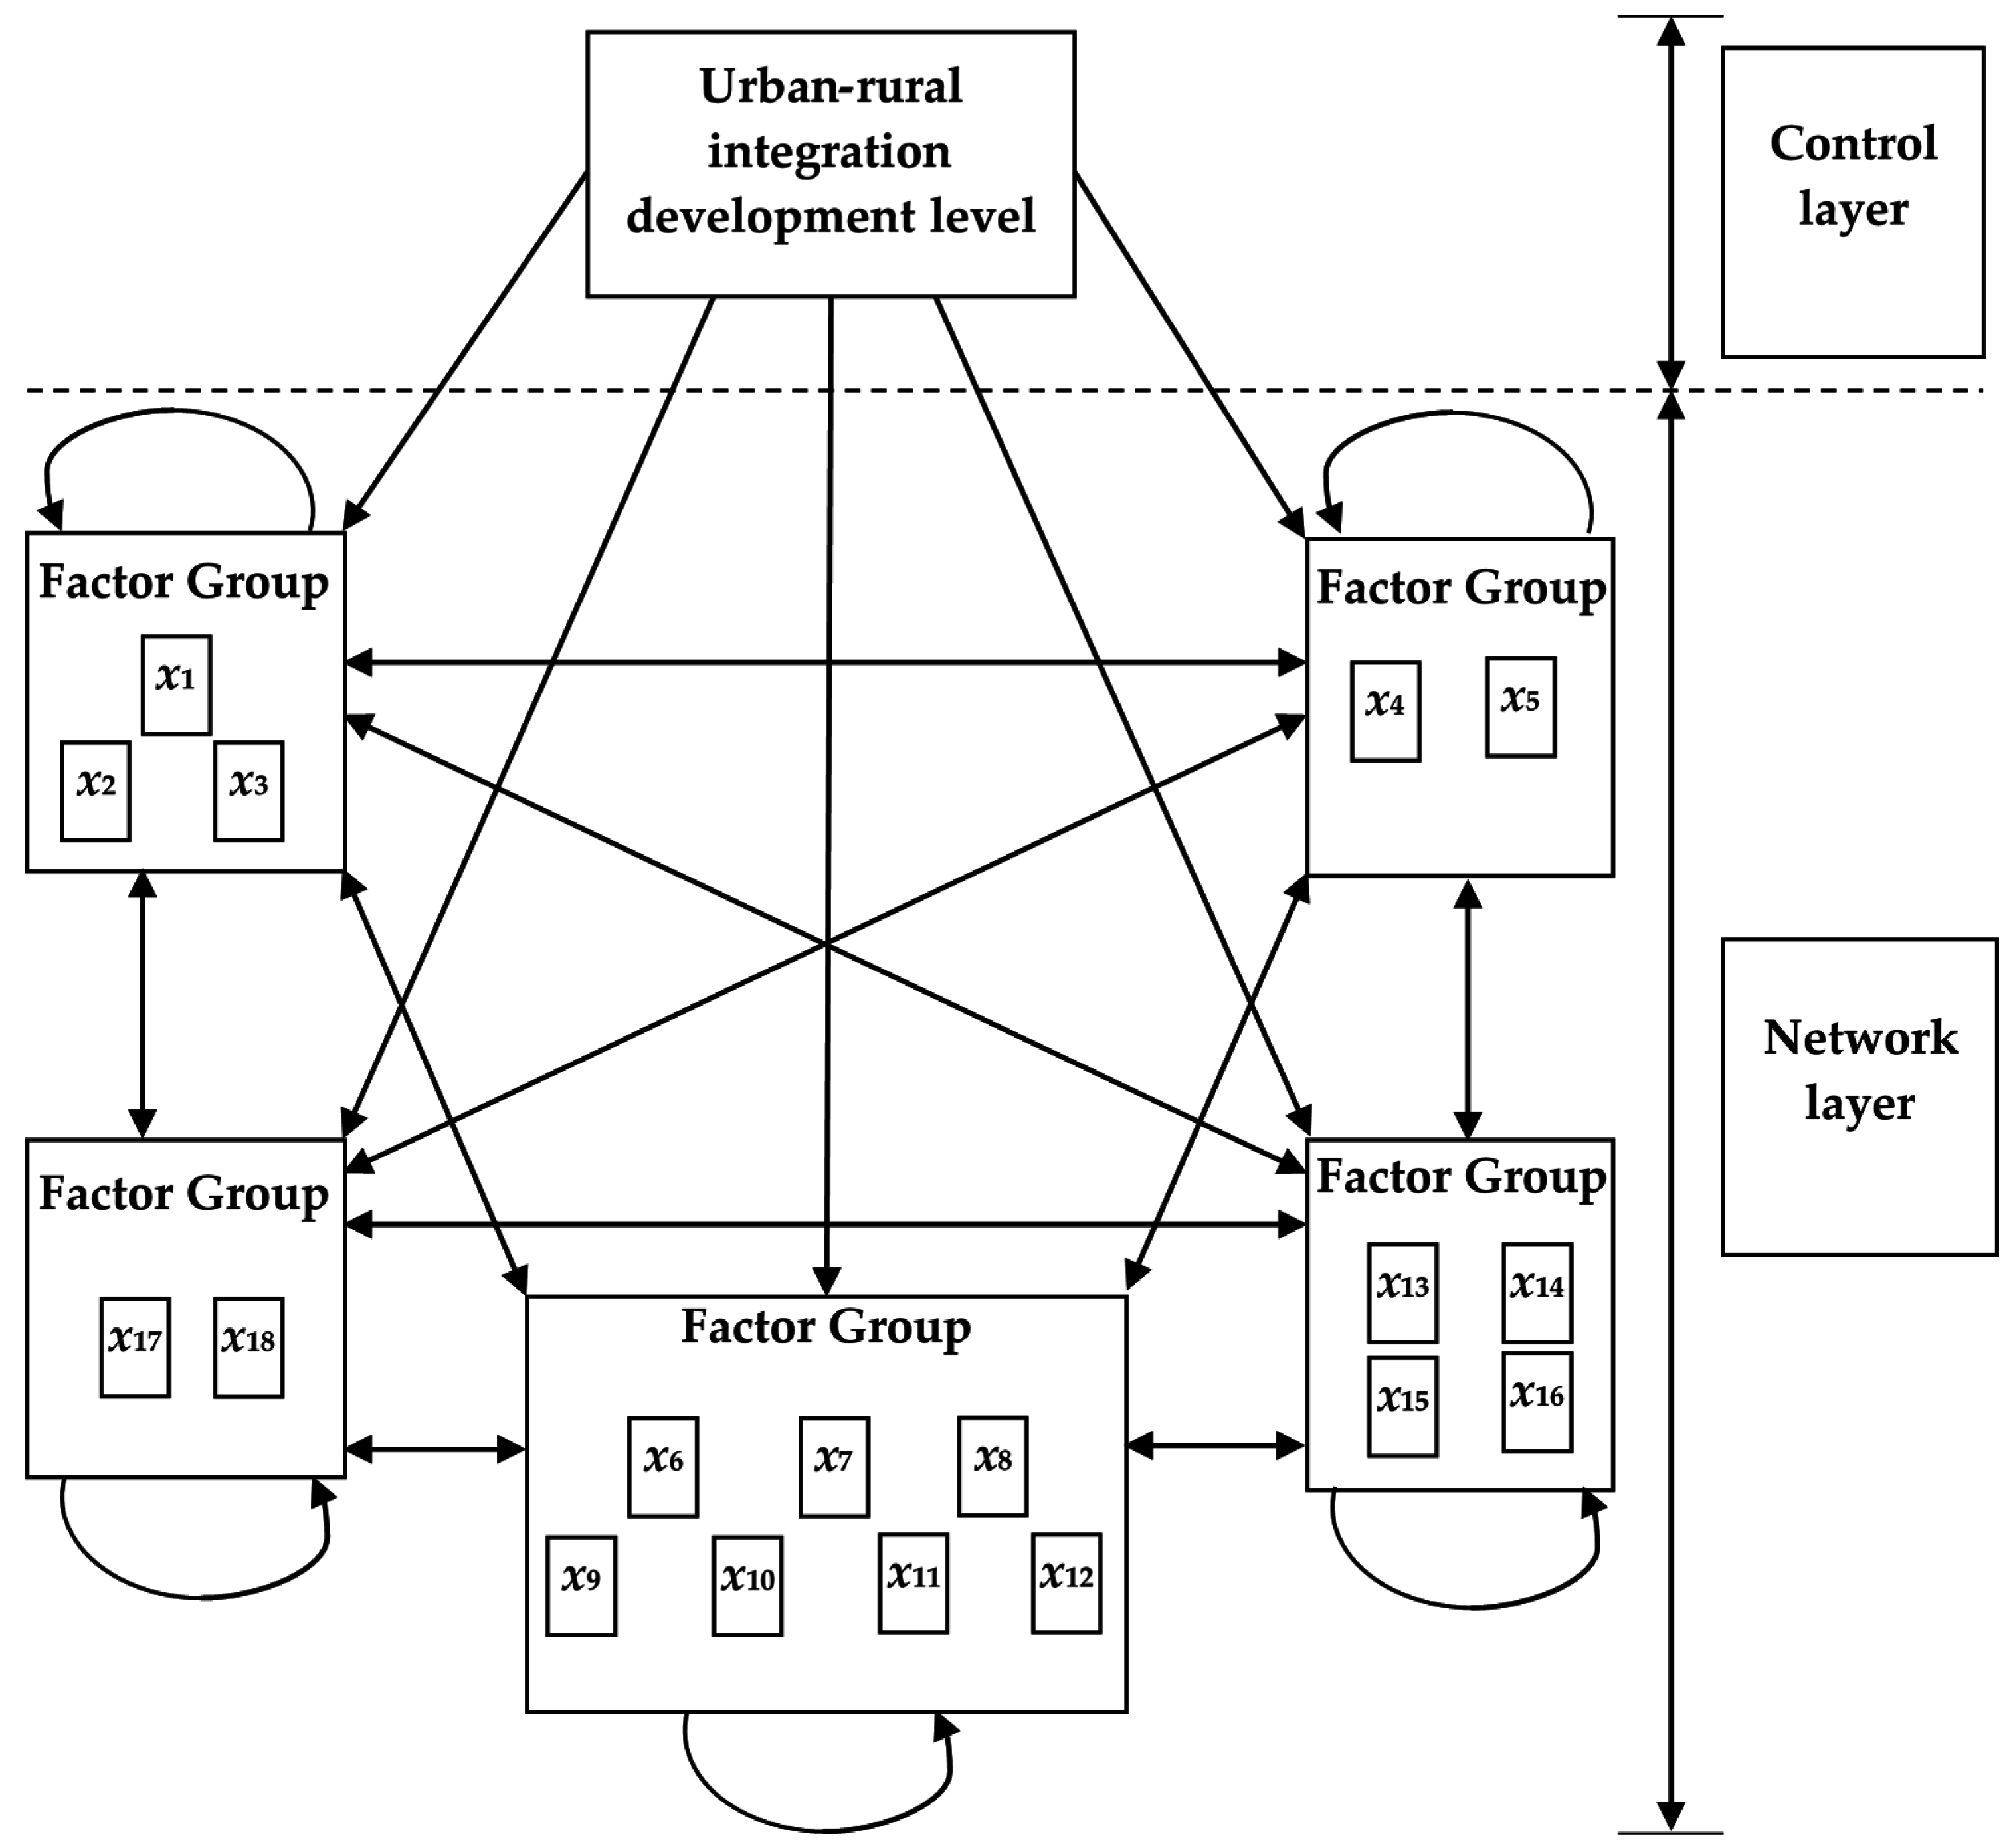
3.2. Network Analysis Method

The evaluation of regional urban–rural integration development requires a multi-factor and multilevel system assessment. The influences on urban–rural integration development of each index in the indicator system must be determined, namely the weight. There are many factors that influence urban–rural integration development, involving all aspects of society and the economy, with mutual effects and dependence relationships among the influence factors.
The predecessor of the Analytic Network Process (ANP) is the Analytic Hierarchy Process (AHP) proposed by Professor Thomas L. Saaty of the University of Pittsburgh. In the AHP, internal factors in the same hierarchy are relatively independent. There is no mutual influence or dependent relationship between the factors [21,22]. Nevertheless, various factors in urban–rural integration have a mutual impacted, making it hard to divide various factors into an internally independent, progressive, hierarchical structure. The interaction between factors mainly presents a network-like structure. The ANP exactly adapts to such a demand and is developed into a systematic decision-making method extended from the AHP. For an internally independent network structure, ANP may be more suitable.
The first step when conducting a network analysis is to construct the ANP structure, confirm a control layer, analyze the relationship between factors in accordance with control standards, and confirm the relationships between elements.
If there are control standards P 1 ,   P 2 , ,   P m in a control layer and there are factor groups U 1 ,   U 2 , ,   U N with factors u i 1 ,   u i 2 , ,   u i n i   ( i   =   1 ,   2 , ,   N ) in a network layer, P s   ( s   =   1 ,   2 , ,   m ) in the control layer are regarded as standards and factors u j k   ( k   =   1 ,   2 , , n j ) in the factor groups U j   ( j   =   1 ,   2 , ,   N ) as secondary standards. Concentrated factors U i will conduct pairwise comparison in line with the degree of influences to u j k Equation (2). The measurement of importance in pairwise comparison can also apply the rule of nine, and a judging matrix under standard P s is constructed.
u j k u i 1 , u i 2 , , u i n j N o r m a l i z e d   E i g e n v e c t o r s u i 1 w i 1 ( j k ) u i 2 w i 2 ( j k ) u i n j w i n j ( j k )
Next, an ordering vector [ w i 1 ( j k ) ,   w i 2 ( j k ) ,   ,   w i n i ( j k ) ] T is obtained by a group eigenvalue method. Moreover, the abovementioned characteristic vectors are subjected to a consistency check. Similarly, the ordering vector relative to other factors can be obtained. Moreover, the local weight vector matrix can be obtained Equation (3):
W i j = [ w i 1 ( j 1 ) w i 1 ( j 2 ) w i 1 ( j n j ) w i 2 ( j 1 ) w i 2 ( j 2 ) w i 2 ( j n j ) w i n i ( j 1 ) w i n i ( j 2 ) w i n i ( j n j ) ]
The column vector in W i j is the importance ordering vector of factors u i 1 , u i 2 , , u i n i in U i to factors u j 1 ,   u j 2 ,   ,   u j n j in U j . If factors in U j will not be impacted by U i , W i j   =   0 , the factor set in the network layer will require a pairwise combination to repeat the abovementioned steps. Finally, a hypermatrix W under the control standard P s can be obtained Equation (4). Thus s   =   1 ,   2 , ,   m , the amount of such a hypermatrix will be m:
W = [ W 11 W 12 W 1 N W 21 W 22 W 2 N W N 1 W N 2 W N N ]
In the hypermatrix, every element is a sub-matrix. The sum of every column is 1, but W is not a normalized matrix. In order to make subsequent calculations more convenient, we should regard P s as a standard when comparing the importance of factors. The judging matrix of factor groups Equation (5) under the standard P s is:
U j U 1 , U 2 , , U N N o r m a l i z e d   E i g e n v e c t o r s U 1 a 1 j U 2 a 2 j U N a N j
If factor groups are independent of U j , the importance vector is 0 and the weighting matrix is Equation (6):
A = [ a 11 a 12 a 1 N a 21 a 22 a 2 N a N 1 a N 2 a N N ]
After weighting elements of hypermatrix W, the weighting hypermatrix W ¯ is shown as follows Equation (7). The sum of columns in W ¯ is 1, and W ¯ i j = a i j W i j ( i = 1 , 2 , , N ) ( j = 1 , 2 , , N ) .
W ¯ = [ W ¯ 11 W ¯ 12 W ¯ 1 N W ¯ 21 W ¯ 22 W ¯ 2 N W ¯ N 1 W ¯ N 2 W ¯ N N ]
In order to reflect the dependence relationships between factors in the network, it is necessary to perform a stabilizing treatment on the weighting hypermatrix to calculate the relative limit ordering vector of every weight hypermatrix Equation (8):
W ¯ = l i m k ( 1 N ) k = 1 N W ¯ k
If the limit is convergent and unique, the value in the corresponding line of the original matrix is the stable weight of the factors, namely, column W ¯ k is the relative limit ordering vector of factors in the network layer on the factor j under the standard P s .
ANP is adopted to determine the weight of each index, and factors in the system are divided into two parts, a control layer and a network layer. The control layer also includes two parts, the target and the decision criterion. The decision criterion is independent, only controlled by target factors; there can be no decision criterion in the control layer, but a simple target is of the essence. The weight of each decision criterion can be determined through a traditional analytic hierarchy process. The network layer is composed of all factors governed by the control layer, and an interactional network structure is formed among the factors [23,24]. The calculation steps of ANP are complex and the core work is solving hypermatrix [25,26].

3.3. Exploratory Spatial Data Analysis

Exploratory Spatial Data Analysis (ESDA) is a spatial mechanism of interaction that, through calculating the spatial autocorrelation of research objects, would be used for the description and visual analysis of a geographic phenomenon spatial pattern to discover the spatial agglomeration and spatial anomalies as well as reveal the object of study [27]. ESDA includes two types of analytical perspectives, global spatial autocorrelation analysis and local spatial autocorrelation analysis [28,29,30].
Global spatial autocorrelation analysis is used for determining spatial features of geographic phenomena in the whole study area, whether or not spatial agglomeration exists. Moran’s I index is a measurement index of global spatial autocorrelation [31]. The value of Moran’s I is within the scope of [−1, 1]. Moran’s I > 0 means positive spatial correlation; Moran’s I < 0 means negative spatial correlation; Moran’s I = 0 means uncorrelated.
Local indicators of spatial association (LISA) are used for measuring the spatial difference and significance between a certain place and the surrounding areas. Global spatial autocorrelation analysis only reveals the spatial dependency of geographical phenomena as a whole and cannot provide local spatial difference comparison, so it is necessary to conduct local spatial autocorrelation analysis [32]. Local Moran’s I index is generally used as a local spatial autocorrelation measurement index to study local spatial distribution patterns by combining the Moran Scatter Plot and LISA Aggregation Plot; the aim is to resolve the global Moran’s I to each object of study [33].
Under the given significance level, spatial agglomeration will occur for similar values of geographic attributes if you want to show positive local spatial autocorrelation; spatial agglomeration will occur for dissimilar values of geographic attributes if you want to show negative local spatial autocorrelation. The “hot spot” and “cold spot” of local spatial agglomeration can be identified and the singular spatial value can be revealed by a LISA aggregation map, formed through a combination of Scatter Plot with LISA significance level [12].

4. Calculation of the Urban–Rural Integration Development Level of the Qinling-Daba Mountains

4.1. Evaluation Object

The 25 county territories of the Qinling-Daba Mountains act as elementary units (Figure 1) when evaluating the urban–rural integration development level in view of the country’s economy.

4.2. Establishment of Index System

Urban–rural integration development aims at changing the dual model of “urban industry, rural and agricultural” by combining urban and rural developments with unified coordination, following recent economic and social development thought on the integration of workers and peasants, and solving existing urban and rural questions by developing foresight.
There is no uniform indicator weighting system for assessing the integrated development of urban and rural areas in China. This has been one of the hotspots studied by Chinese scholars in recent years. Existing studies on urban–rural integration mainly apply an aggregative indicator system to select an indicator. In view of the development connotations of urban–rural integration, generally speaking, indicator selection should reflect the differences in population, space, economy, society, and the environment between urban and rural areas [5]. However, for undeveloped mountainous areas, besides a reduction of the urban–rural gap, it is extremely important to improve the overall development level [34,35,36,37,38]. In this paper, urban–rural development shows a dual structure, with different population, space, economy, society, and environment. Different subsystems of human society can be formed based on the five aspects mentioned above, namely population, space, economy, society, and the environment. In order to achieve the goal of urban–rural integration, benign interaction between urban and rural areas must be realized for these five subsystems that coordinate with each other. Construction of a multi-index evaluation index system should emphasize a systematic, scientific, feasible, and comparable approach. When measuring the urban–rural integration development level of a population subsystem, the indexes that need to be selected are as follows: three basic indexes of urbanization rate (x1), occupied population proportion of non-agricultural industries (x2), and non-agricultural industries proportion in country working population (x3); two basic indexes of urban density (x4) and penetration rate of telephone (x5) for space subsystem; seven basic indexes of Per Capita GDP (x6), economic density (x7), proportion of non-agricultural industries output value (x8), agricultural mechanization level (x9), fixed-asset investment per capita (x10), total retailing of social consuming goods per capita (x11), and urban and rural residents per capita income ratio (x12) for economy subsystem; four basic indexes of teacher/pupil ratio in common elementary and middle schools (x13), number of health agency beds per 10,000 people (x14), number of health workers per 10,000 people (x15), and number of social welfare adopting unit beds per 10,000 people (x16) for society subsystem; and two basic indexes of green coverage ratio in built-up areas (x17) and per capita public green areas in built-up areas (x18) for the environmental subsystem. Therefore, when judging the urban–rural integration development level, we can start with the five subsystems that represent stages in the process of urban–rural integration development.

4.3. Influence Factor Weight

The urban–rural integration development evaluation index system of the Qinling-Daba Mountains has been built as mentioned earlier. There are 18 basic indexes in the system, which can be regarded as factors of the network layer. The network layer should include the target layer and criterion layer; in this paper, there is only one target layer in the control layer and no evaluation criteria layer. Factors of the network layer can be directly compared through a comprehensive assessment of urban–rural integration development level as the judgment standard (Figure 2). The ANP evaluation model is established through Super Decisions 2.0.8 software to find a matrix solution and obtain the weight of each influencing factor (Table 1).
The control layer points to the factor group box in the network layer, indicating that the control layer is impacted by the Factor Group in Figure 2. In the box Factor Group in the network layer, it refers to the factor set of describing the same property. The arrow points to Factor Group B from Factor Group A, indicating that Factor Group A is impacted by Factor Group B. If both ends of the connecting line between Factor Group A and Factor Group B have an arrow, this indicates an interaction between Factor Group A and Factor Group B. A circular arrow indicates the interaction of factors in the Factor Group.
Corresponding values can be obtained by bringing each essential data point and influence factor weight into the formula of the linear weight sum method (Table 2).

5. Time–Space Analysis of Urban–Rural Integration Development Level

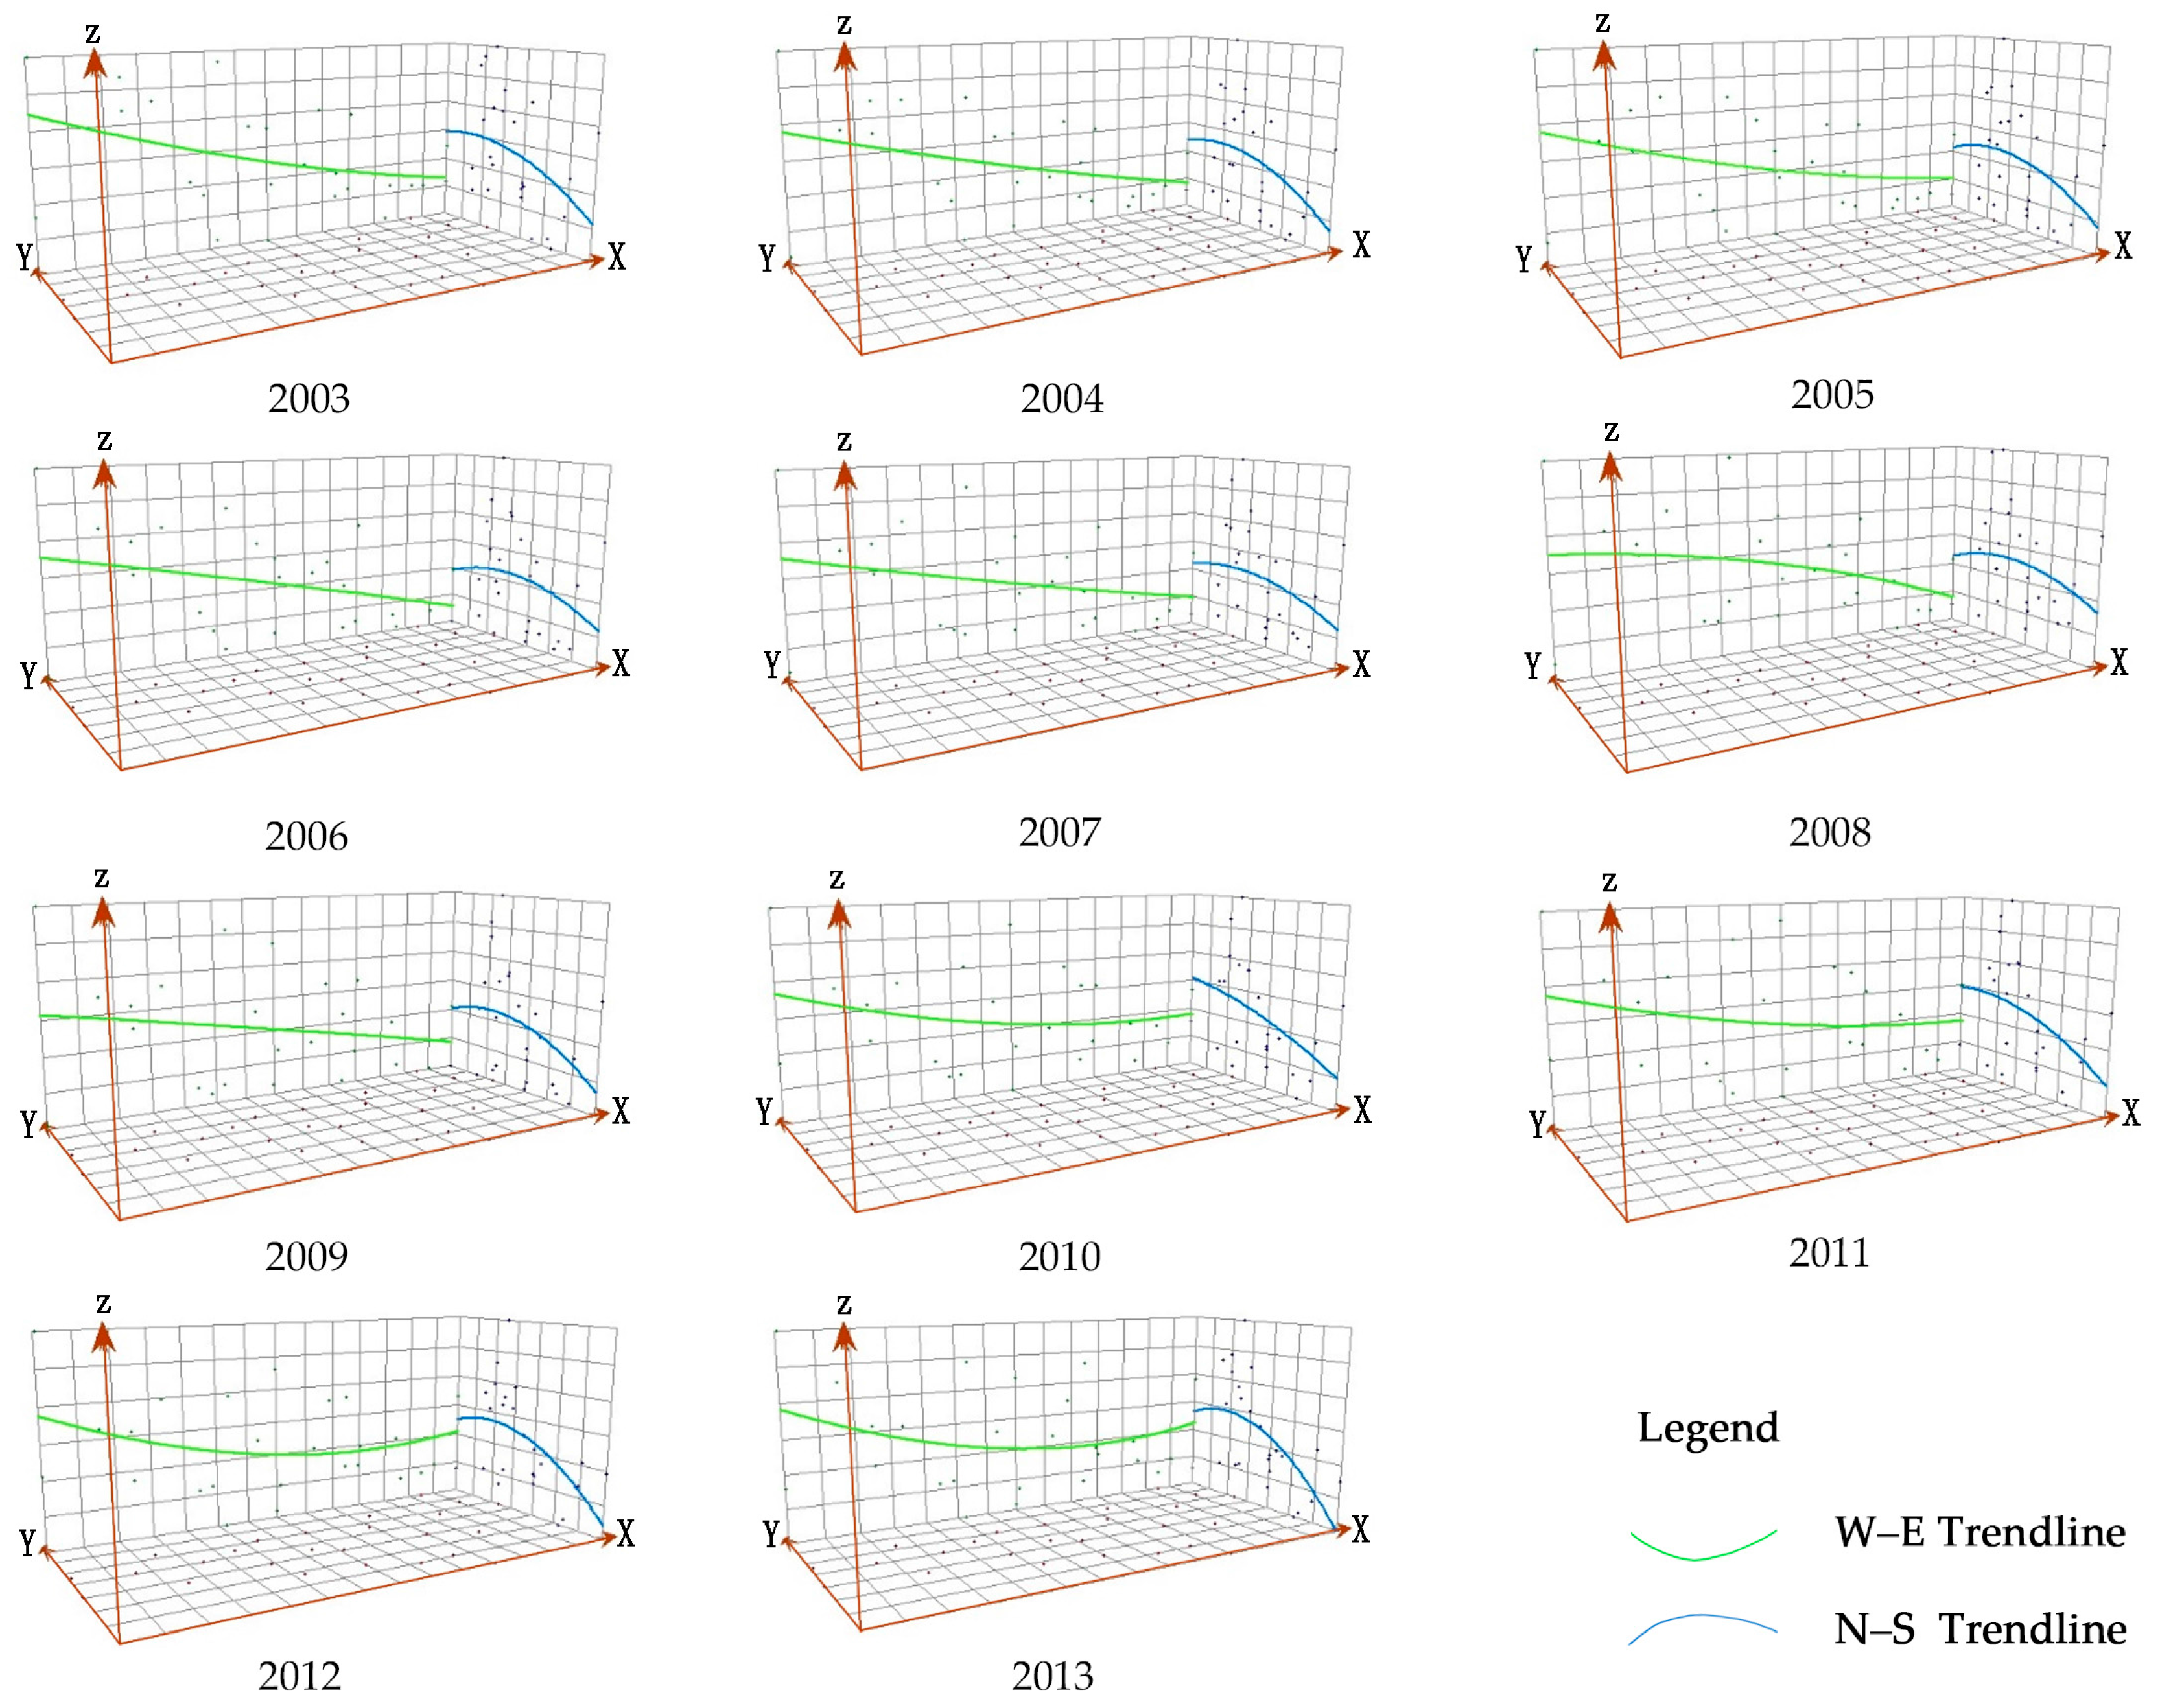
5.1. Historical Evolution of the Urban–Rural Integration Development Level of the Qingling-Daba Mountains

The urban–rural integration development coordination index of the Qingling-Daba Mountains is used in this paper as a kind of spatial attribute, and ArcGIS 10.0 is used to analyze and simulate its spatial trends to get a three-dimensional figure (Figure 3). The arrow direction of the X-axis in the figure is east, the arrow direction of the Y-axis is north, and the Z-axis is the coordination index of urban–rural integration development. Points on the XZ plane are the projection of the urban–rural integration development coordination index of each county in longitude direction, while curves on the XZ plane are the spatial trend of the urban–rural integration development level in the longitude direction. Points on the YZ plane are the projection of the urban–rural integration development coordination index of each county in the latitude direction, while curves on the YZ plane are the spatial trend of the urban–rural integration development level in the latitude direction.
The result of spatial trends analysis indicates that the urban–rural integration development level of the Qinling-Daba Mountains shows a high–west, low–east trend in the longitude direction and a trend of high in the middle area, relatively low in the north, and lowest in the south in the latitude direction. Specifically speaking, in the longitude direction, counties in the west are higher than the counties in the middle; the east part on the whole is not as good as the western part, although the eastern section of the trend line starts to rise slightly from 2010.
The Hanjiang River traverses the Qinling-Daba Mountains from the west to the east, then flows into Hubei Province. The main stream of Hanjiang River flows through six counties (Ningqiang, Mian, Nanzheng, Chenggu, Yang, and Xixiang) in the Hanzhong and four counties (Shiquan, Hanyin, Xunyang, and Baihe) in Ankang. A planting region of the leading grain crop of rice of the Qinling-Daba Mountains is also located along the main stream of the Hanjiang River. It is also an intensive belt of industries and cities and towns, and the main channel for communication, transportation, exchange of information, and personnel mobility. The intensive degree, average scale, and population density degree of the cities and towns along the main stream of Hanjiang River are all higher than those of the southern and northern mountains, providing more space for the social and economic development of the region. Urban and rural development cannot happen without an exchange of materials and information, a main railway, and a motorway. The national and provincial main roads located along the main stream of Hanjiang River provide obvious advantages in terms of communication and transportation. Under the joint action of the above advantages, the urban–rural integration development level of the Qinling-Daba Mountains reflects a spatial clustering characteristic: the zone along the main stream of Hanjiang River is higher than the southern and northern mountains.
The spatial rule of the urban–rural integration also has a close connection with the industrial basis and transportation conditions of the evaluated unit. As a significant zone of the Third-line Construction, Hanzhong has a preferable industrial location; industrial activity gets weaker the further east you go in the southern part of Shaanxi Province. The western part is higher than the eastern part and the urban–rural integration development level is identical to the spatial rule for industrial development. Hanzhong was the earliest zone to have a railway and highway. Summing up the above, the high–west, low–east spatial clustering rule of urban–rural integration development in the Qinling-Daba Mountains has a strong correlation with the spatial characteristics of the land, industrial activity, and the transportation network.

5.2. Exploratory Spatial Data Analysis of the Urban–rural Integration Development Level in the Qinling-Daba Mountains

GeoDa 1.4.6 software is used to calculate the overall and partial spatial relativity evaluation index of urban–rural integration development coordination index for each county in the Qinling-Daba Mountains year by year [39,40].
The Queen neighborhood space matrix technique is used to determine spatial weight Equation (9) [41], that is:
w i j = { 1 Area j and i have common boundary or common verte 0 i = j  or area J and I without common boundary or common vertex .
In this formula, w ij means the spatial weight of area j to area i.

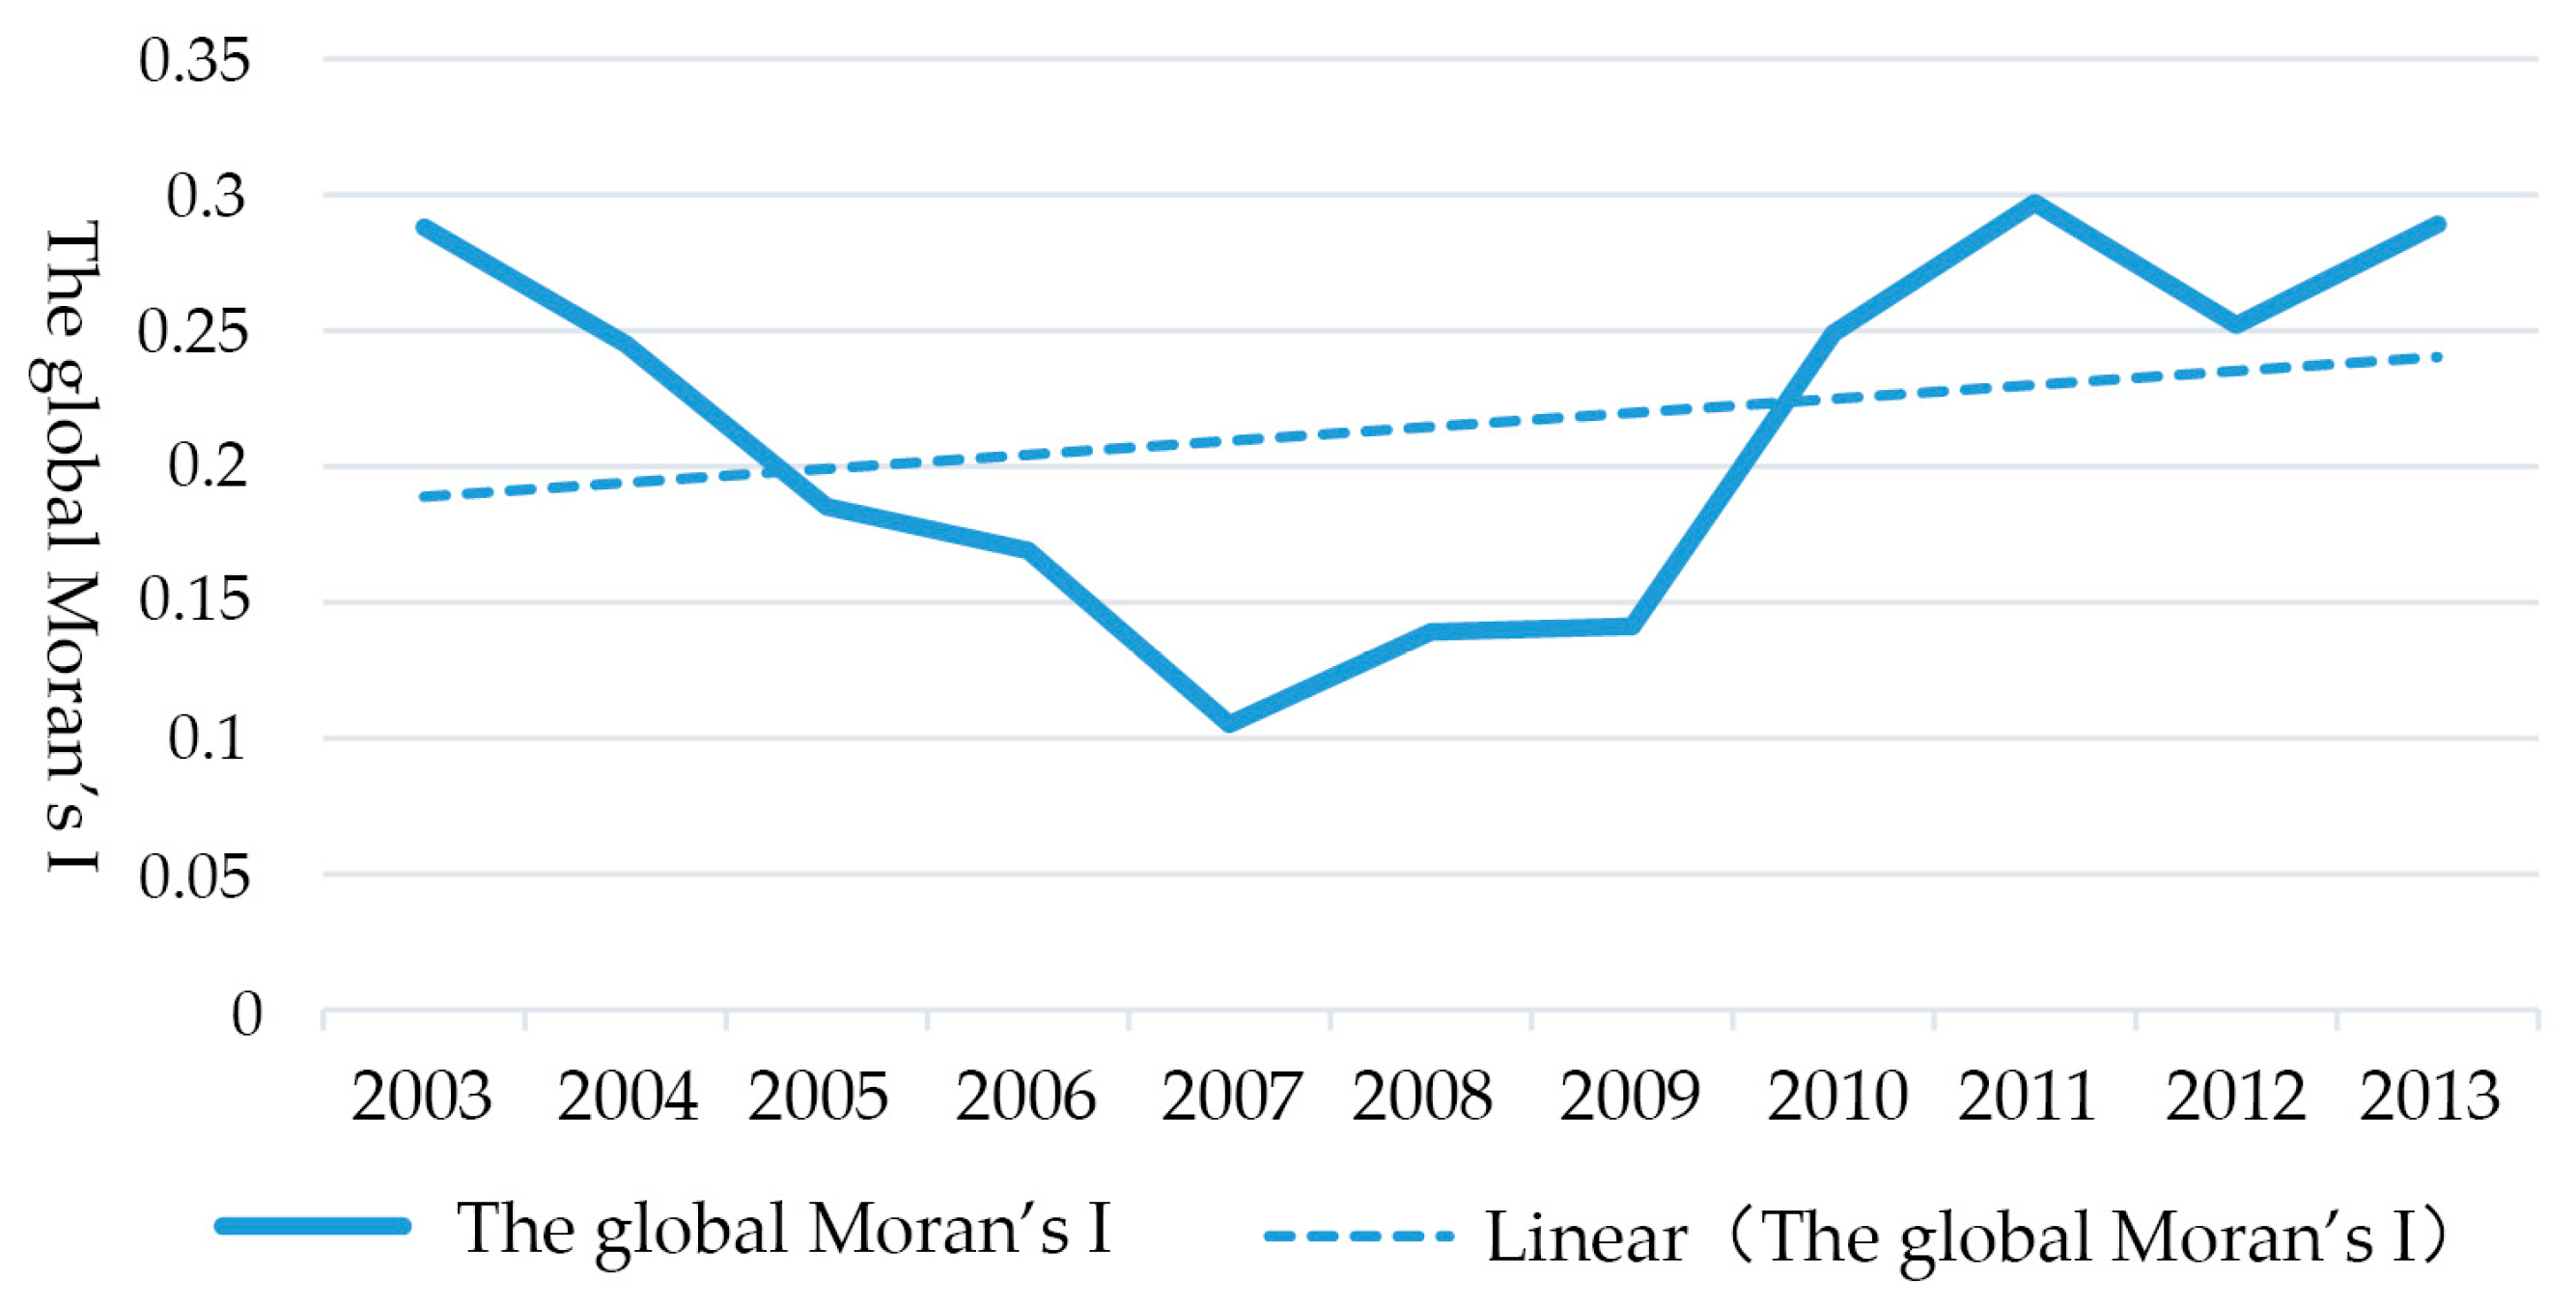
5.2.1. Global Spatial Autocorrelation Analysis

At a significance level of α = 0.05, Z-value ≥ 1.96 can be tested. The annual p-value and Z-value of global Moran’s I in counties in the Qinling-Daba Mountains can pass the test (Table 3). The global Moran’s I value of the urban–rural integration development coordination index in the Qinling-Daba Mountains is all positive, indicating a positive correlation in space, namely high value zones are close to high value zones and the low value zones are close to low value zones. It can be seen that spatial clustering existed in terms of the urban–rural integration development of counties in the Qinling-Daba Mountains, but the clustering intensity was not strong (0.105 < Moran’s I < 0.297). Among them, the year with the highest clustering intensity was 2011 and the year with the lowest clustering intensity was 2007.
According to the changing Moran’s I values over the years (Figure 4), the urban–rural integration development level in the Qinling-Daba Mountains can be divided into two phases. The first phase is from 2003 to 2007, when the spatial clustering extent of the urban–rural integration development decreased year after year. The polarization in space decreased, and there was a similar trend for regional development. The industrial development in the Qinling-Daba Mountains established a certain baseline during the Third-line Construction period in the late 1960s and 1970s, but the industry activity has reduced gradually due to inconvenient transportation, miscommunication of information, and slow update of techniques, etc. Thus, the spatial clustering of regional urban–rural integration development reduced, and the entire region was in a low-level, balanced development state.
The second phase is from 2008 to 2013, when the spatial characteristic of urban–rural integration development is aggregation and the spatial polarization starts to recover. The Shaanxi provincial party committee and provincial government put forward a regional development strategy of “breakthrough development in Southern Shaanxi”, and confirmed that green industry should be the main direction in the Qinling-Daba Mountains. In the meantime, environmentally sustainable travel has been another economic growth point for some counties. Moreover, the transportation situation has been tremendously improved. Thus, the overall economic and social development in the Qinling-Daba Mountains during this period has been rapid; some counties have green agriculture and ecological tourism resources in place, and have broken through the external traffic bottleneck. There has been a spatial clustering of transportation facilities and tourism resources.

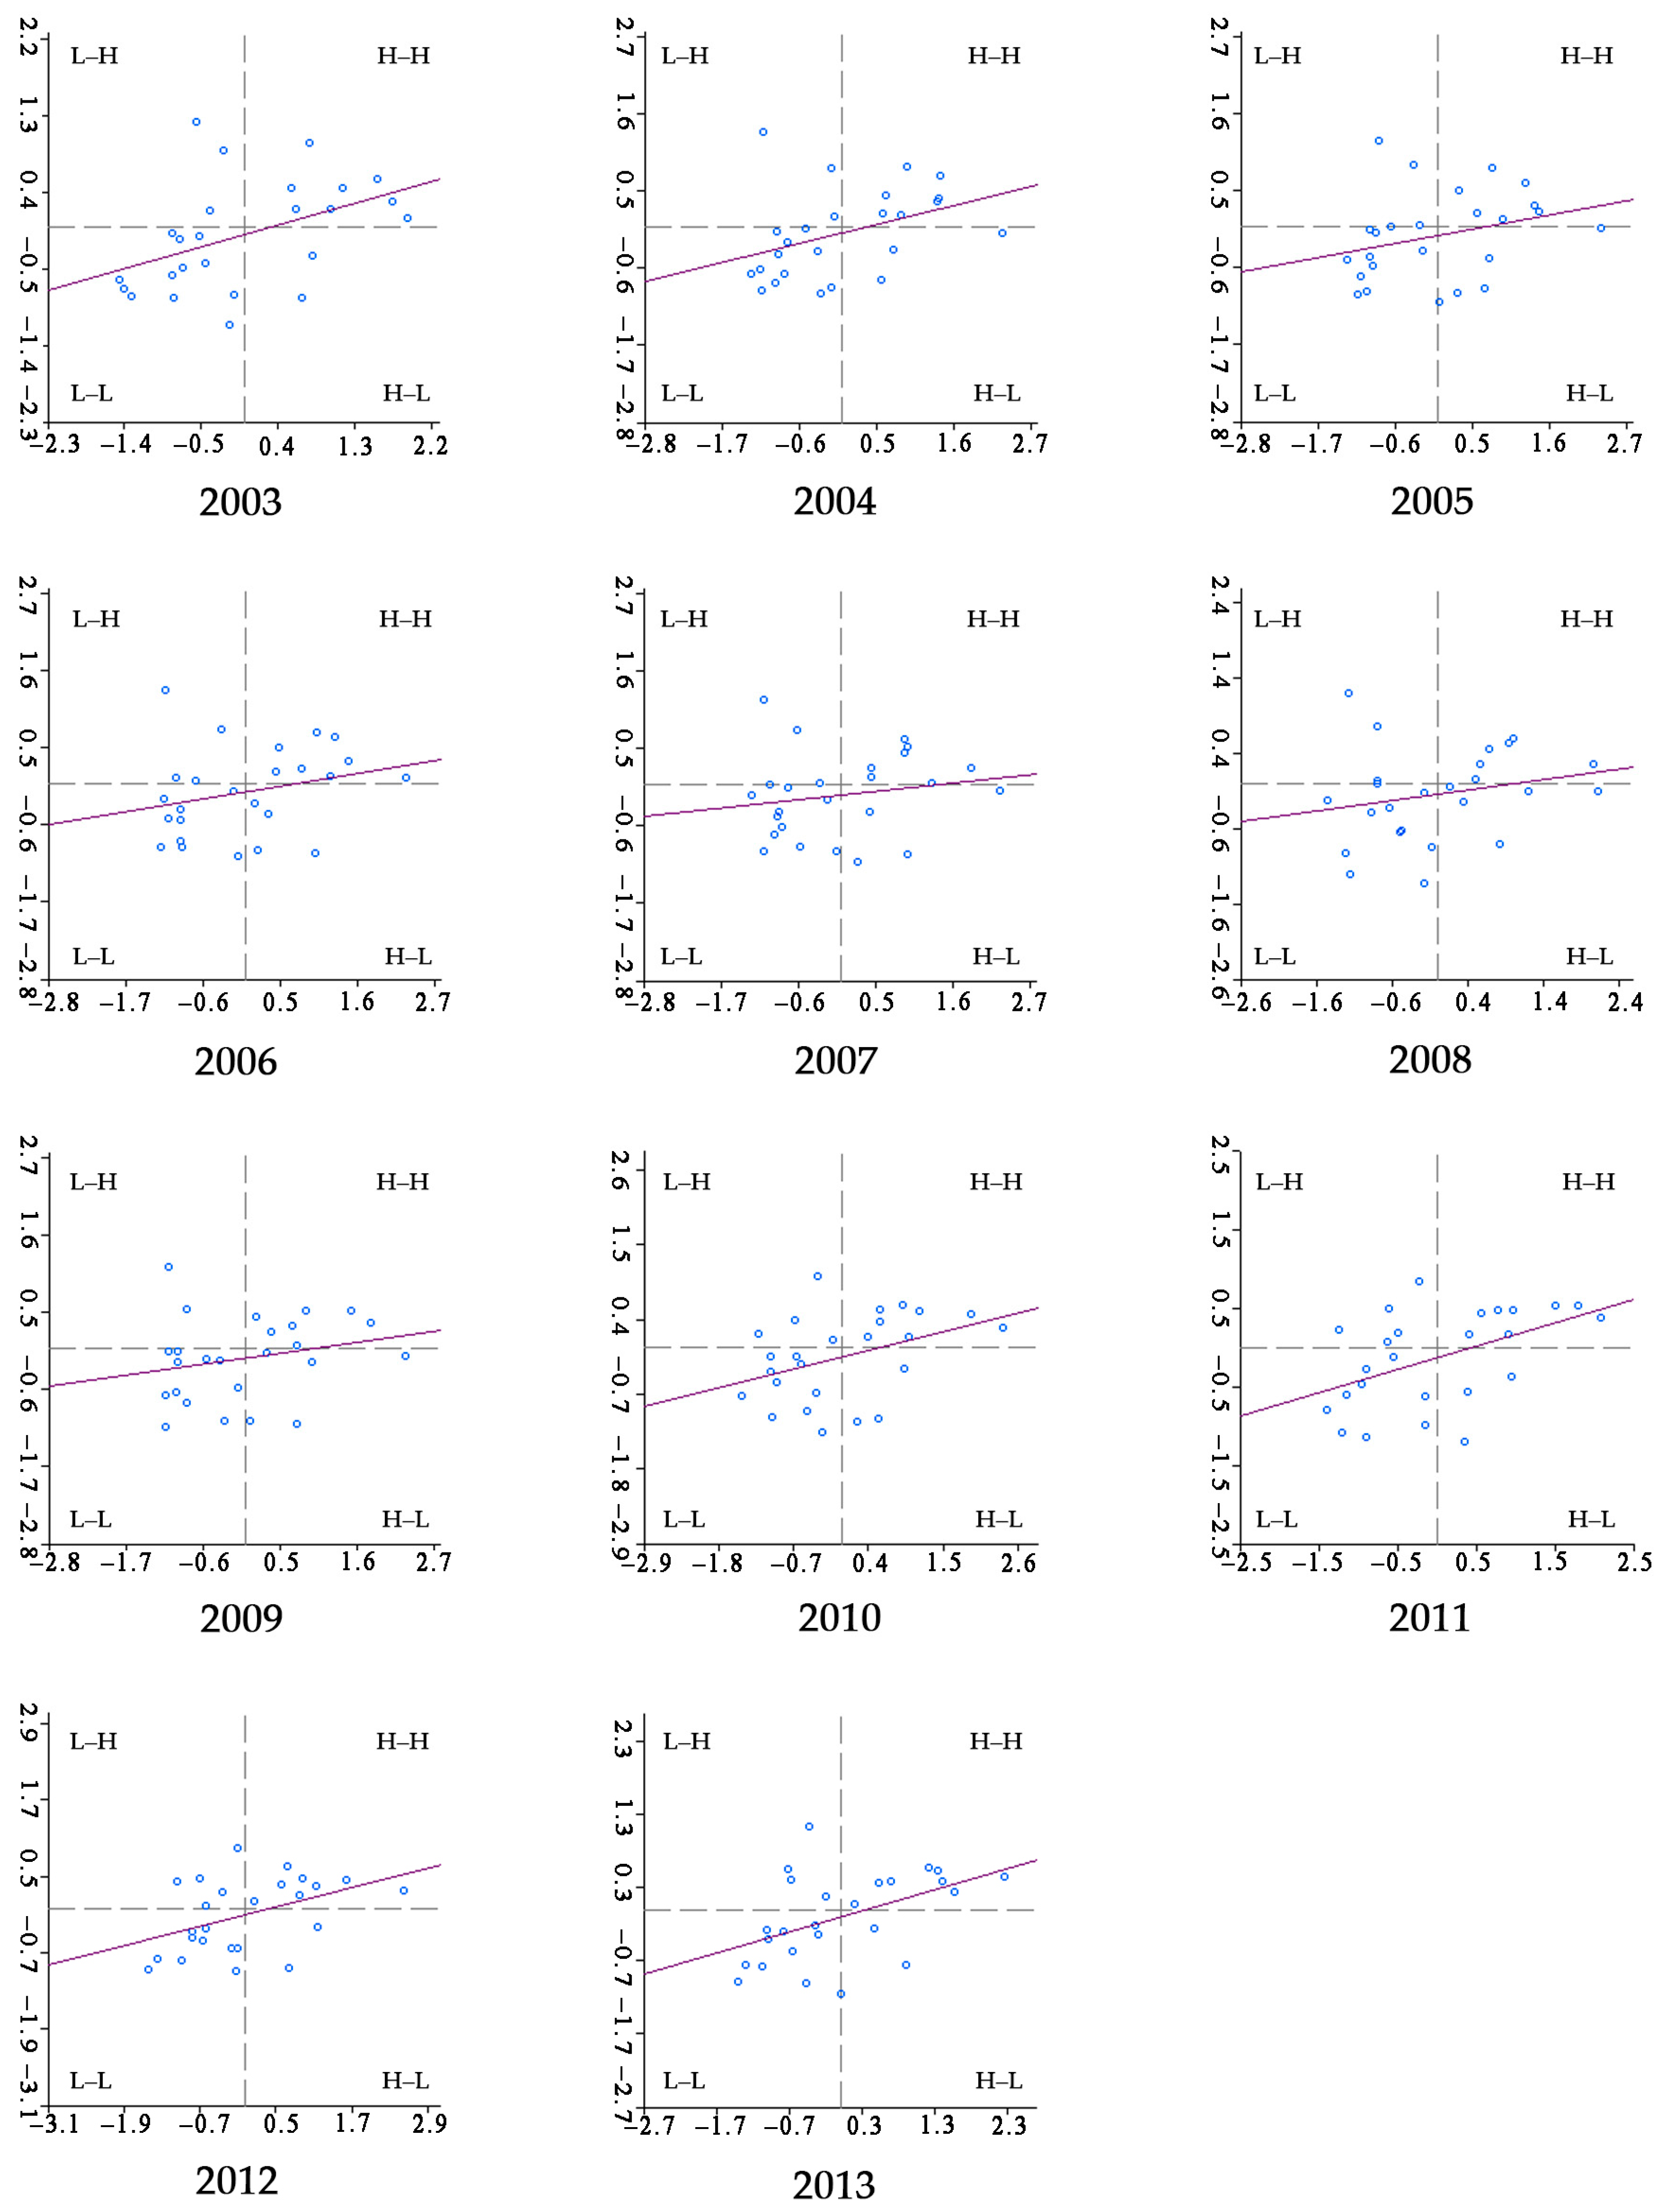
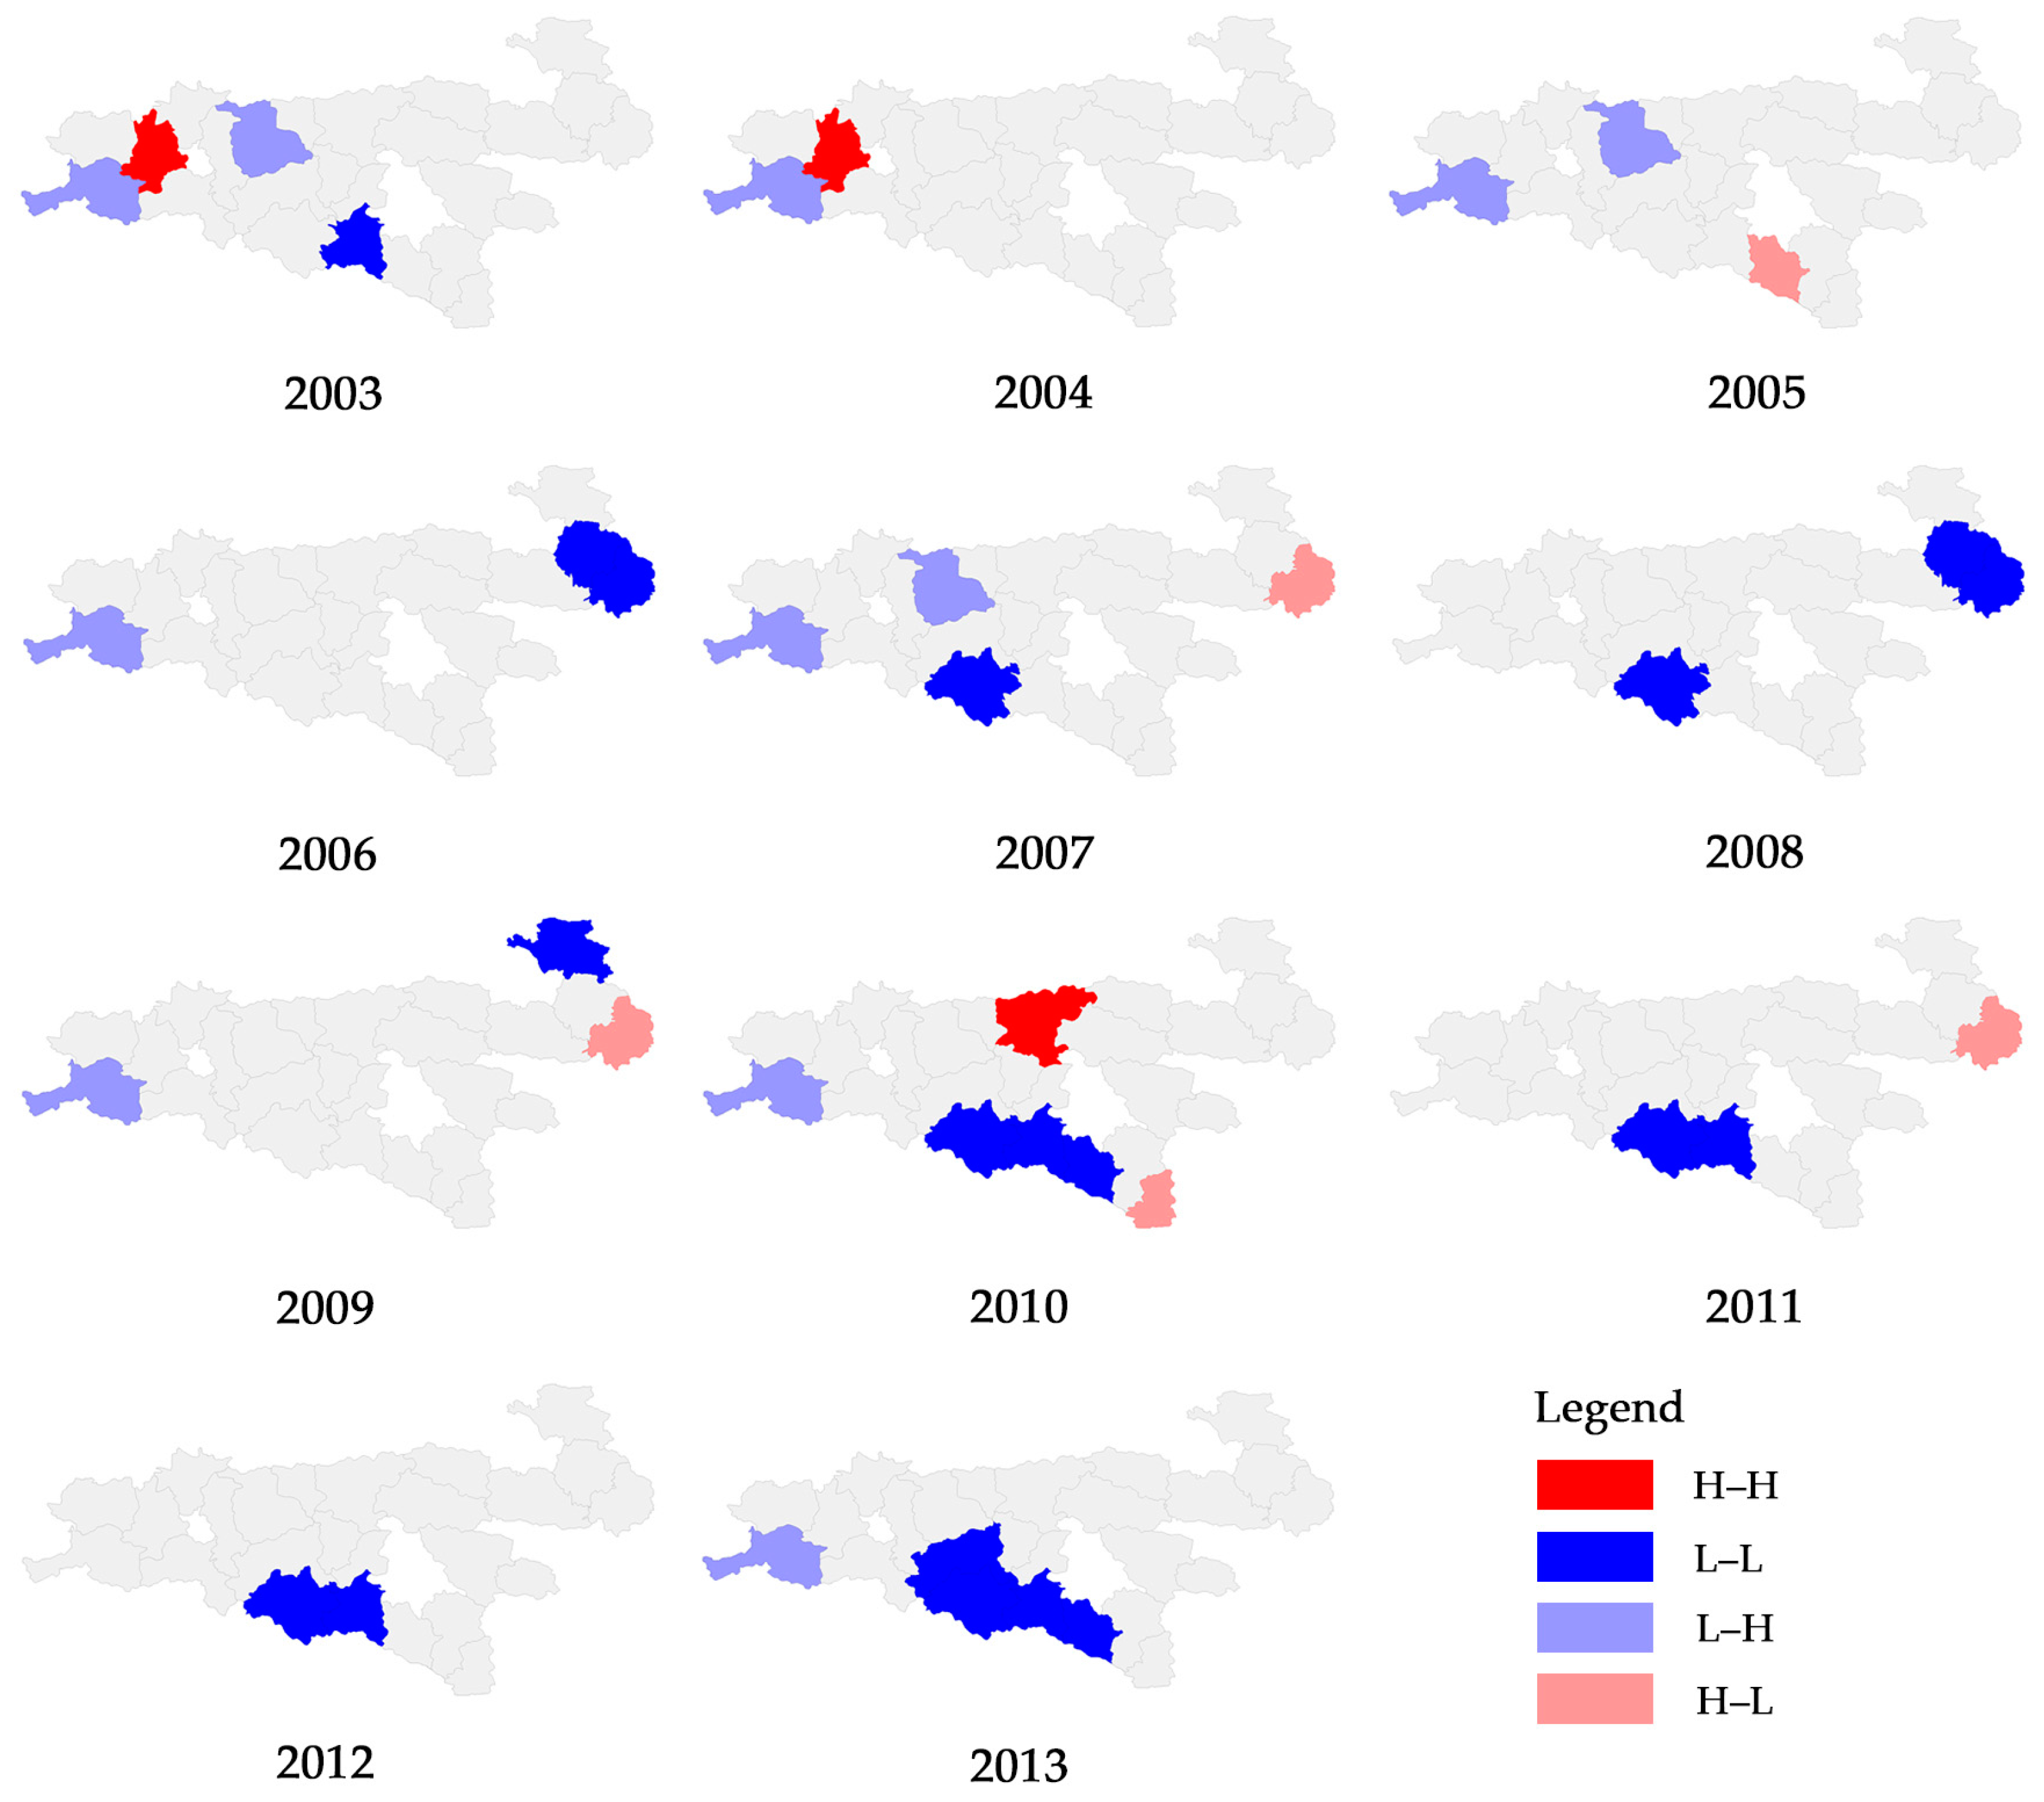
5.2.2. Local Spatial Autocorrelation Analysis

The spatial relationship between a certain territory unit and its adjacent units can be analyzed through the drawing of a Moran scatter diagram. The Moran scatter diagram for each year in the Qinling-Daba Mountains (Figure 5) indicates that the urban–rural integration development level of 25 counties in the Qinling-Daba Mountains was clustered around two terminals. The Moran scatter diagram can be divided into four quadrants, corresponding to four types of local spatial forms between the county and its neighbors. The first quadrant (H–H) shows that regional units of high observed value are enclosed by a high-value area. The third quadrant (L–L) shows that regional units of low observed value are enclosed by a low-value area. The counties in the H–H and L–L quadrants are different every year (Table 4).
It can be observed from Figure 3, Figure 5, and Figure 6 and Table 4 that the urban–rural integration development level of each county in the Qinling-Daba Mountains is clustered around two terminals—that is, the high-level counties cluster with the high-level counties and the low-level counties cluster with the low-level counties. Counties in the western part, located along the main stream of the Hanjiang River and the southern Qinling Mountains, are more likely to be in the first quadrant, while the opposite is true of the third quadrant. This shows that the urban–rural integration development of the Qinling-Daba Mountains lacks spatial balance. The development in this region is not balanced due to differences in resources endowment, land conditions, and transportation facilities in the 25 counties within the region; these are conditions that the urban–rural economies and social development rely on. The Qinling-Daba Mountains lack counties with strong leading effects, the spatial polarization is weak, and spatial clustering is still the overall trend for the urban–rural integration development during this period.

6. Conclusions and Discussion

Studies show that the urban–rural integration development level of the Qinling-Daba Mountains displays a spatial imbalance, with a “Higher in the West and Lower in the East” spatial variation and a situation of aggregating to the ends. Namely, high–level counties and low–level counties gather with each other, and the spatial characteristics couple with the land conditions, industrial activity, and transportation situation to affect the urban–rural development. The socioeconomic development in the study area is restricted by the land conditions, ecological protection requirements, etc. [42]. A new model for improving regional development and promoting a balance of urban and rural structures is necessary to solve a series of problems, such as urban and rural structural imbalance, rural development lag, etc. [43,44].
The spatial strategy for the integrated development of urban and rural areas in the Qinling-Daba Mountains of Southern Shaanxi should be concentrated on the Hanzhong Basin, the Yuehe River, and Shangdan Valley. These areas also have the highest integrated development of urban and rural areas. It is necessary to continue to develop the driving role of urban areas on rural development, form a core regional development area with stronger absorption and radiation, and encourage overall development.
The northern area of the Qinling-Daba Mountains in Southern Shaanxi is the ecological protection zone of the Qinling Mountains and has a relatively lower integrated development of urban and rural areas. The area is a water conservation area of Chinese South-to-North Water Diversion Project. Urban–rural development is strictly limited by the ecological protection policies. On the one hand, it is necessary to advocate the concept of a circular economy and an ecological economic development mode, to drive the optimization and promotion of traditional agriculture, develop a modern service industry with a focus on tourism, increase the income of branch agriculture industry, and help populations in mountainous areas overcome poverty. On the other hand, we must encourage populations in mountainous areas to move to flat areas with a good economic outlook along the Hanjiang River, increase urban capacity, and further reduce the gap between urban and rural development.
The improvement of regional traffic facilities is an important driver to promote the overall improvement of urban–rural development in the Qinling-Daba Mountains of Southern Shaanxi and reduce the gap between urban and rural development. Therefore, it is necessary to further speed up traffic system construction, especially the construction of modern traffic facilities such as airports, high-speed railways, and highways.

Acknowledgments

The study was supported by a Scientific Research Program funded by the Shaanxi Provincial Education Department (Program No. 16JK1744), the National Key Technology Research and Development Program of the Ministry of Science and Technology of China (Program No. 2015BAL01B04), the Key Technology Research and Development Program in Shaanxi Province of China (Program No. 2015SF295), and the Natural Science Basic Research Plan in Shaanxi Province of China (Program No. 2015JM5171).

Author Contributions

Peng Cui and Xin Wu designed the research. Xin Wu contributed to data collection, data processing, and drafting the manuscript; Peng Cui contributed to data analysis and paper revision.

Conflicts of Interest

The authors declare no conflict of interest.

References

  1. Liu, Y.S.; Long, H.L.; Chen, Y.F.; Wang, J.Y.; Li, Y.R.; Li, Y.H.; Yang, Y.Y.; Zhou, Y. Progress of research on urban-rural transformation and rural development in China in the past decade and future prospects. J. Geogr. Sci. 2016, 26, 1117–1132. [Google Scholar] [CrossRef]
  2. Wang, J.; Wang, X. New urbanization: A new vision of China’s urban-rural development and planning. Front. Arch. Res. 2015, 1, 166–168. [Google Scholar] [CrossRef]
  3. Su, C.W.; Liu, T.Y.; Chang, H.L.; Jiang, X.Z. Is urbanization narrowing the urban-rural income gap? A cross-regional study of China. Habitat Int. 2015, 48, 79–86. [Google Scholar] [CrossRef]
  4. Liu, Y.S.; Lu, S.S.; Chen, Y.F. Spatio-temporal change of urban-rural equalized development patterns in China and its driving factors. J. Rural Stud. 2013, 32, 320–330. [Google Scholar] [CrossRef]
  5. Zhan, J.Y.; Lu, Q.; Deng, X.Z. Construction of urban-rural interaction evaluation model and its application in Shandong Province. Geogr. Res. 2003, 22, 495–502. (In Chinese) [Google Scholar]
  6. Torre, A.; Wallet, F. Towards New Paths for Regional and Territorial Development in Rural Areas. Eur. Plan. Stud. 2015, 23, 175–181. [Google Scholar] [CrossRef]
  7. Amato, F.; Maimone, B.; Martellozzo, F.; Nolè, G.; Murgante, B. The Effects of Urban Policies on the Development of Urban Areas. Sustainability 2016, 8, 297. [Google Scholar] [CrossRef] [Green Version]
  8. Horlings, L.G.; Kanemasu, Y. Sustainable development and policies in rural regions; insights from the Shetland Islands. Land Use Policy 2015, 49, 310–321. [Google Scholar] [CrossRef]
  9. Yue, W.Z.; Zhang, Y.T.; Ye, X.Y.; Cheng, Y.Q.; Leipnik, M.R. Dynamics of Multi-Scale Intra-Provincial Regional Inequality in Zhejiang, China. Sustainability 2014, 6, 5763–5784. [Google Scholar] [CrossRef]
  10. Liu, Y.L.; Luo, T.; Liu, Z.Q.; Kong, X.S.; Li, J.W.; Tan, R.H. A comparative analysis of urban and rural construction land use change and driving forces: Implications for urban-rural coordination development in Wuhan, Central China. Habitat Int. 2015, 47, 113–125. [Google Scholar] [CrossRef]
  11. Tong, G.; Wang, T. The Estimated and Assessed Study on Urban–Rural Integration Course in Northeast China; Springer: Berlin/Heidelberg, German, 2015; pp. 637–644. [Google Scholar]
  12. Xuan, G.F.; Xu, J.G.; Zhao, J. An Analysis of Urban Social Space Based on ESDA—A Case Study of the Central Urban District in Shanghai. Sci. Geogr. Sin. 2010, 30, 22–29. [Google Scholar]
  13. Chen, D.; Wang, Y.; Ren, F.; Du, Q. Spatio-Temporal Differentiation of Urban-rural Equalized Development at the County Level in Chengdu. Sustainability 2016, 8, 422. [Google Scholar] [CrossRef]
  14. Qi, Y.J.; Yu, Y.; Dong, W. Coordination Analysis on Urbanization Level and Land Use Efficiency of Xinjiang Based on ESDA. Environ. Eng. Manag. J. 2013, 12, 1819–1823. [Google Scholar]
  15. Martellozzo, F.; Clarke, K.C. Measuring urban sprawl, coalescence, and dispersal: A case study of Pordenone, Italy. Environ. Plan. B Plan. Des. 2011, 38, 1085–1104. [Google Scholar] [CrossRef]
  16. Hayashi, T. Measuring rural-urban disparity with the Genuine Progress Indicator: A case study in Japan. Ecol. Econ. 2015, 120, 260–271. [Google Scholar] [CrossRef]
  17. Yu, A.T.W.; Wu, Y.Z.; Zheng, B.B.; Zhang, X.L.; Shen, L.Y. Identifying risk factors of urban-rural conflict in urbanization: A case of China. Habitat Int. 2014, 44, 177–185. [Google Scholar] [CrossRef]
  18. Zhao, J.; Guo, H.X.; Dang, X.H. A Study on Regional Coordinative Development of Urban-rural and Evaluation. Stat. Dec. 2015, 31, 102–105. (In Chinese) [Google Scholar]
  19. Li, Y.Y.; Chen, Y.; Sun, L. The Coordinative Development of Urban and Rural and its Evaluation Methods. J. Agrotech. Econ. 2004, 23, 24–30. (In Chinese) [Google Scholar]
  20. Zhao, C.Y. A Study on Coordinative Development of Urban-Rural Areas and Its Impact Factors in China. Ph.D. Thesis, Chinese Academy of Agricultural Sciences, Beijing, China, 2008. [Google Scholar]
  21. Saaty, T.L. How to make a decision: The analytic hierarchy process. Eur. J. Oper. Res. 1990, 48, 9–26. [Google Scholar] [CrossRef]
  22. Saaty, T.L. Decision Making with Dependence and Feedback: The Analytic Network Process. J. Syst. Sci. Syst. Eng. 2012, 95, 129–157. [Google Scholar]
  23. Wang, L.F. The Theory and Algorithm of Analytic Network Process. Syst. Eng. Theory Pract. 2001, 21, 44–50. (In Chinese) [Google Scholar]
  24. Golcuk, I.; Baykasoglu, A. An analysis of DEMATEL approaches for criteria interaction handling within ANP. Expert Syst. Appl. 2016, 46, 346–366. [Google Scholar] [CrossRef]
  25. Vinodh, S.; Balagi, T.; Patil, A. A hybrid MCDM approach for agile concept selection using fuzzy DEMATEL, fuzzy ANP and fuzzy TOPSIS. Int. J. Adv. Manuf. Technol. 2016, 83, 1979–1987. [Google Scholar] [CrossRef]
  26. Chatterjee, K.; Bandyopadhyay, A.; Ghosh, A.; Kar, S. Assessment of environmental factors causing wetland degradation, using Fuzzy Analytic Network Process: A case study on Keoladeo National Park, India. Ecol. Model. 2015, 316, 1–13. [Google Scholar] [CrossRef]
  27. Kim, D.; Lee, H.; Lim, U. Exploring the Spatial Distribution of Occupations Vulnerable to Climate Change in Korea. Sustainability 2016, 8, 34. [Google Scholar] [CrossRef]
  28. Wang, L.; Li, T.; Cao, X.S. Spatial Difference of Urban and Rural Harmonious Development with ESDA-GIS Framework in Guangdong Province. Econ. Geogr. 2012, 32, 44–50. (In Chinese) [Google Scholar]
  29. Yang, L.X.; Yang, G.S.; Yao, S.M.; Yuan, S.F. A Study on the Spatial Heterogeneity of Grain Yield Per Hectare and Driving Factors Based on ESDA-GWR. Econ. Geogr. 2012, 32, 120–126. (In Chinese) [Google Scholar]
  30. Anselin, L.; Syabri, I.; Kho, Y. GeoDa: An Introduction to Spatial Data Analysis. In Handbook of Applied Spatial Analysis: Software Tools, Methods and Applications; Fischer, M.M., Getis, A., Eds.; Springer: Berlin/Heidelberg, German, 2010; pp. 73–89. [Google Scholar]
  31. Sridharan, S.; Tunstall, H.; Lawder, R.; Mitchell, R. An exploratory spatial data analysis approach to understanding the relationship between deprivation and mortality in Scotland. Soc. Sci. Med. 2007, 65, 1942–1952. [Google Scholar] [CrossRef] [PubMed]
  32. Zeng, Q.Y.; Chen, Z.N. Reserach on the Regional Economic Disparity in Guangdong Province Based on GIS Spatial Analysis. Econ. Geogr. 2007, 27, 558–561. (In Chinese) [Google Scholar]
  33. Anselin, L. Local Indicators of Spatial Association—LISA. Geogr. Anal. 1995, 27, 93–115. [Google Scholar] [CrossRef]
  34. Wang, Y.F.; Liu, Y.S.; Li, Y.H.; Li, T.T. The spatio-temporal patterns of urban-rural development transformation in China since 1990. Habitat Int. 2016, 53, 178–187. [Google Scholar] [CrossRef]
  35. Zeng, L.; Lei, J.; Lu, Q. Construction of evaluating indicator system of urban-rural int eraction and the comparative analysis of regional urban-rural correlative-degree in China. Geogr. Res. 2002, 21, 763–771. (In Chinese) [Google Scholar]
  36. GU, Y.K.; Xu, Y.J. Study on the Evaluating Index of the Urban-rural Integration. Zhejiang Soc. Sci. 2004, 20, 95–99. (In Chinese) [Google Scholar]
  37. Zhang, S.M.; Liu, H.; Ren, J. A Quantitative Analysis and Study of Regional Urban- Rural Interaction in Shandong Province. J. Shandong Norm. Univ. Nat. Sci. 2004, 19, 65–68. (In Chinese) [Google Scholar]
  38. Wan, S.W. The Construction and Appliation of the Urban-rural Integration Evaluating Index System—Taking Henan Province as an Example. Econ. Surv. 2008, 25, 60–63. (In Chinese) [Google Scholar]
  39. Xie, H.L.; Kung, C.C.; Zhao, Y.L. Spatial disparities of regional forest land change based on ESDA and GIS at the county level in Beijing-Tianjin-Hebei area. Front. Earth Sci. 2012, 6, 445–452. [Google Scholar] [CrossRef]
  40. Lincaru, C.; Atanasiu, D.; Ciucă, V.; Pirciog, S. Peri-urban Areas and Land Use Structure in Romania at LAU2 Level: An Exploratory Spatial Data Analysis. Procedia Environ. Sci. 2016, 32, 124–137. [Google Scholar] [CrossRef]
  41. Hu, Y.; Zhang, J.X. Economic Space Evolution of Yangtze River Delta City Group Based on Country Scale. Econ. Geogr. 2010, 30, 1112–1117. (In Chinese) [Google Scholar]
  42. Tang, Y.; Mason, R.J.; Wang, Y. Governments’ functions in the process of integrated consolidation and allocation of rural-urban construction land in China. J. Rural Stud. 2015, 42, 43–51. [Google Scholar] [CrossRef]
  43. Gao, Z. Development Path of Urban-rural Integration. Asian Agric. Res. 2012, 4, 53–59. [Google Scholar]
  44. Li, Y.; Hu, Z. Approaching Integrated Urban-rural Development in China: The Changing Institutional Roles. Sustainability 2014, 7, 7031–7048. [Google Scholar] [CrossRef]
Figure 1. Division diagram of evaluation unit.
Sustainability 08 01085 g001
Figure 2. The structure of ANP comprehensive evaluation level of urban–rural integration development in the Qinling-Daba Mountains.
Sustainability 08 01085 g002
Figure 3. Spatial trend analysis of urban–rural integration development level in the Qinling-Daba Mountains.
Sustainability 08 01085 g003
Figure 4. Global Moran’s I changing values of urban–rural integration development coordination in the Qinling-Daba Mountains.
Sustainability 08 01085 g004
Figure 5. Moran scatter plot of urban–rural integration development coordination index for each year in the Qinling-Daba Mountains.
Sustainability 08 01085 g005
Figure 6. LISA maps of urban–rural integration development in the Qinling-Daba Mountains.
Sustainability 08 01085 g006
Table 1. Global weighted table of comprehensive assessment factors in urban–rural integration development, Qinling-Daba Mountains.
Factor GroupFactorsFactor NumberFactor Weight
Population subsystemUrbanization ratex10.077
Occupied population proportion of non-agricultural industriesx20.074
Non-agricultural industries proportion in country working populationx30.065
Space subsystemUrban densityx40.102
Penetration rate of telephonex50.042
Economic subsystemPer capita GDPx60.081
Economic densityx70.063
Proportion of non-agricultural industries output valuex80.061
Agricultural mechanization levelx90.016
Fixed-asset investment per capitax100.066
Total retailing of social consuming goods per capitax110.030
Urban and rural residents per capita income ratiox120.011
Social subsystemTeacher/pupil ratio in common elementary and middle schoolsx130.084
Number of health agency beds per 10,000 peoplex140.061
Number of health workers per 10,000 peoplex150.066
Number of social welfare adopting unit beds per 10,000 peoplex160.019
Environment subsystemGreen coverage ratio in built-up areasx170.051
Per capita public green areas in built-up areasx180.030
Table 2. Urban–rural integration development coordination index table of each county in the Qinling-Daba Mountains.
County20032004200520062007200820092010201120122013
Nanzheng0.4980.4370.4220.4190.4220.4240.4310.3730.3540.3740.414
Chenggu0.5170.5030.5270.5100.5280.5040.5050.4820.5220.5440.482
Yang0.3310.3150.3160.3260.2930.2800.3000.3140.3410.3330.365
Xixiang0.2950.2710.2790.2820.2790.2780.2830.2770.3000.3390.368
Mian0.4660.4480.4480.5180.4790.4750.4960.4810.5230.4920.572
Ningqiang0.2900.1980.2580.2320.2360.2370.2690.3490.3860.4030.391
Lueyang0.6180.6130.6300.6380.6450.6070.6610.6370.6540.6990.665
Zhenba0.1880.1770.2290.2370.2670.3150.2980.2780.2720.2430.291
Liuba0.5710.5050.5040.4880.4860.4460.4730.4450.4760.4810.488
Foping0.5930.4990.5190.5420.5950.6010.6040.5060.5860.5420.594
Hanyin0.3040.2930.3330.3830.3450.3480.3540.3240.3070.3210.334
Shiquan0.4440.4050.4650.4610.4230.4320.4390.4260.4580.4320.455
Ningshan0.4370.4100.3940.4240.4790.4800.5720.5870.6200.5950.558
Ziyang0.1690.1920.2070.2570.2590.2710.2820.2300.2480.2590.302
Langao0.3410.2980.3600.3860.3630.3590.3610.3570.3940.4000.435
Pingli0.2530.2410.2540.2480.2470.2780.2700.2750.3470.3450.332
Zhenping0.4530.4020.4350.4850.4840.4610.4820.4430.4560.3900.386
Xunyang0.2680.2240.2440.2570.2620.2960.3310.3150.3390.3450.400
Baihe0.1770.1960.2250.2600.2990.3120.3840.3460.3950.4010.404
Luonan0.2550.2180.2380.2230.2360.2380.2640.3320.3060.3010.326
Danfeng0.2520.2360.2480.2570.2540.2330.2650.2860.2780.3220.355
Shangnan0.3490.3150.3890.3540.3980.3490.4030.4090.4520.4940.528
Shanyang0.2630.2220.2430.2290.2140.2040.2850.2560.2670.2950.361
Zhenan0.4700.4250.4420.4050.4200.4080.4820.4900.5160.5130.505
Zhashui0.3100.3220.3280.3470.3320.3860.4140.4450.5020.5170.579
Table 3. Global Moran’s I value table for the urban–rural integration development coordination index of the Qinling-Daba Mountains.
Year20032004200520062007200820092010201120122013
Global Moran’s I0.2880.2450.1850.1690.1050.1390.1410.2490.2970.2520.289
p-value0.0200.0240.0370.0380.0450.0420.0410.0220.0010.0210.018
Z-value2.3502.2622.1122.1061.9872.0132.0572.2682.4762.2852.462
Table 4. H–H and L–L quadrant concentrated counties of urban–rural integration development coordination index in the Qinling-Daba Mountains.
YearCounties in H–H QuadrantCounties in L–L Quadrant
2003Lueyang, Foping, Liuba, Chenggu, Nanzheng, Mian, Shiquan, NingshanZiyang, Baihe, Zhenba, Danfeng, Pingli, Luonan, Shanyang, Xunyang, Xixiang, Hanyin, Langao, Shangnan
2004Liuba, Chenggu, Foping, Mian, Nanzheng, Ningshan, ShiquanZhenba, Ziyang, Baihe, Luonan, Shanyang, Xunyang, Danfeng, Pingli, Xixiang, Hanyin, Langao, Shangnan
2005Chenggu, Foping, Liuba, Shiquan, Mian, Nanzheng, NingshanZiyang, Baihe, Zhenba, Luonan, Shanyang, Xunyang, Danfeng, Pingli, Xixiang, Hanyin
2006Lueyang, Foping, Mian, Chenggu, Liuba, Shiquan, Ningshan, NanzhengLuonan, Shanyang, Zhenba, Ziyang, Xunyang, Danfeng, Baihe, Zhashui, Shangnan
2007Foping, Chenggu, Liuba, Ningshan, Mian, Shiquan, NanzhengShanyang, Luonan, Pingli, Danfeng, Ziyang, Xunyang, Zhenba, Xixiang, Baihe, Hanyin, Langao
2008Foping, Ningshan, Mian, Liuba, Shiquan, NanzhengShanyang, Danfeng, Luonan, Ziyang, Xixiang, Xunyang, Baihe, Zhenba, Hanyin, Shangnan, Langao
2009Foping, Ningshan, Mian, Zhenan, Liuba, Shiquan, ZhashuiLuonan, Danfeng, Pingli, Ziyang, Xixiang, Shanyang, Zhenba, Xunyang, Hanyin, Langao, Baihe
2010Lueyang, Ningshan, Foping, Zhenan, Mian, Zhashui, Liuba, ShiquanZiyang, Pingli, Xixiang, Zhenba, Danfeng, Xunyang, Hanyin, Luonan, Baihe, Langao
2011Lueyang, Ningshan, Foping, Mian, Zhenan, Zhashui, Liuba, ShiquanZiyang, Zhenba, Danfeng, Xixiang, Luonan, Hanyin, Pingli, Langao, Baihe
2012Lueyang, Ningshan, Foping, Zhashui, Zhenan, Mian, Liuba, ShiquanZhenba, Ziyang, Luonan, Hanyin, Danfeng, Xixiang, Pingli, Zhenping, Langao, Baihe
2013Lueyang, Foping, Zhashui, Mian, Ningshan, Zhenan, Liuba, ShiquanZhenba, Ziyang, Luonan, Pingli, Hanyin, Danfeng, Xixiang, Zhenping, Xunyang, Baihe, Langao

