Article

The Impact of Multinational Business Diversification on the Financial Sustainability of Construction Firms in Korea

1
Innovative Durable Building and Infrastructure Research Center, Hanyang University, 55 Hanyangdaehak-ro, Sangrok-gu, Ansan-si 426-791, Korea
2
School of Architecture and Architectural Engineering, Hanyang University, 55 Hanyangdaehak-ro, Sangrok-gu, Ansan-si 426-791, Korea
*
Author to whom correspondence should be addressed.
Sustainability 2016, 8(10), 997; https://doi.org/10.3390/su8100997
Submission received: 11 July 2016 / Revised: 13 September 2016 / Accepted: 27 September 2016 / Published: 7 October 2016
(This article belongs to the Section Economic and Business Aspects of Sustainability)

Abstract

:
This study investigated empirically whether multinational business diversification by Korean construction firms contributes to their financial sustainability using the vector error correction model. In this study, the current ratio and the debt ratio were used as proxy variables for financial sustainability. International construction orders and domestic construction orders were used as proxy variables for multinational business diversification for the analysis. Of the models used for analysis in this study, Model A used the current ratio and international and domestic construction orders, and Model B used the debt ratio and international and domestic construction orders. The time-series data utilized consisted of the quarterly data from Q1 of 2001 to Q4 of 2015. The results of the analysis imply that an increase in international construction orders undermines the financial viability of construction firms because of a decrease in the current ratio and an increase in the debt ratio. The results also show that the scrutinized analysis of profitability was insufficient because overseas project orders were not pursued based on a long-term business strategy but on short-term turnover. Therefore, Korean construction firms should recognize the overseas construction market as an independent market, not an alternative to the domestic market, and establish a long-term business strategy to enter overseas markets effectively to secure financial sustainability.

1. Introduction

Construction firms engage in complicated relations with various stakeholders such as investors, clients, and various types of contractors. These relations can be significantly influenced by external environment factors, for example, macroeconomics and policy change. Hence, construction firms should be flexible in responding to a rapidly changing market environment [1]. The performance of firms typically depends on their use of management resources and the sectors in which they develop their core competencies. Thus, firms can be sustainable in a rapidly changing market environment. Accordingly, firms establish a diversification strategy to minimize risk and maximize firm performance [2]. There are different types of diversification such as related, unrelated, project type, and regional and different outcomes of performance are obtained depending on the diversification [3,4,5].
Many global construction firms have promoted regional diversification through expansion into overseas construction with technical dominance. Expansion to an overwhelming scale overseas market is an advanced diversification strategy to maintain sustainable corporate management and secure various profit sources [6,7]. Korean construction firms also attempt to diversify project types as well as enter overseas construction markets. In other words, Korean construction firms have been searching for stable profit creation schemes through domestic construction and overseas construction. Various research has addressed overseas construction company expansion from regional diversification in domestic and overseas markets [8,9,10]. This construction company’s business strategy is based on an assumption that business expansion into overseas markets contributes to economic growth. However, the previous study mentioned that this assumption may not be significant [11].
As such, there are two implications to diversification: cost and profit. Diversification may contribute to the growth of corporate value by dispersing corporate risks while a negative impact on the corporate management effectiveness may occur due to inefficient investment of the firm’s resources in areas unrelated to the main business. This perspective implies that expansion to overseas construction, for which there are various risks, from the domestic market with a good business environment can create advantages and disadvantages for construction firms.
Therefore, recognition of the relation between domestic-overseas markets’ mutual connectivity, expansion scale change, and the financial sustainability of construction firms has implications for the measurement of the effectiveness of Korean construction firms’ diversification strategy.
In this context, we confirm the impact of Korean construction firms’ domestic and overseas regional diversification on their financial sustainability by analyzing the dynamics between Korean construction firms’ domestic and overseas construction order changes and the current ratio and/or the debt ratio using the vector error correction (VEC) model.

2. Background

2.1. Change Trends in Domestic and Overseas Construction Orders of Korean Construction Firms

The Korean construction market was seriously depressed when Korea was hit by the IMF crisis in 1998. However, the market was reactivated by the Korean government’s active market policy and demand-supply imbalance in the 2000s. Although the global financial crisis in 2008 hit the Korean construction market again and drove the economy into a severe recession, the market has gradually recovered with the influence of policy.
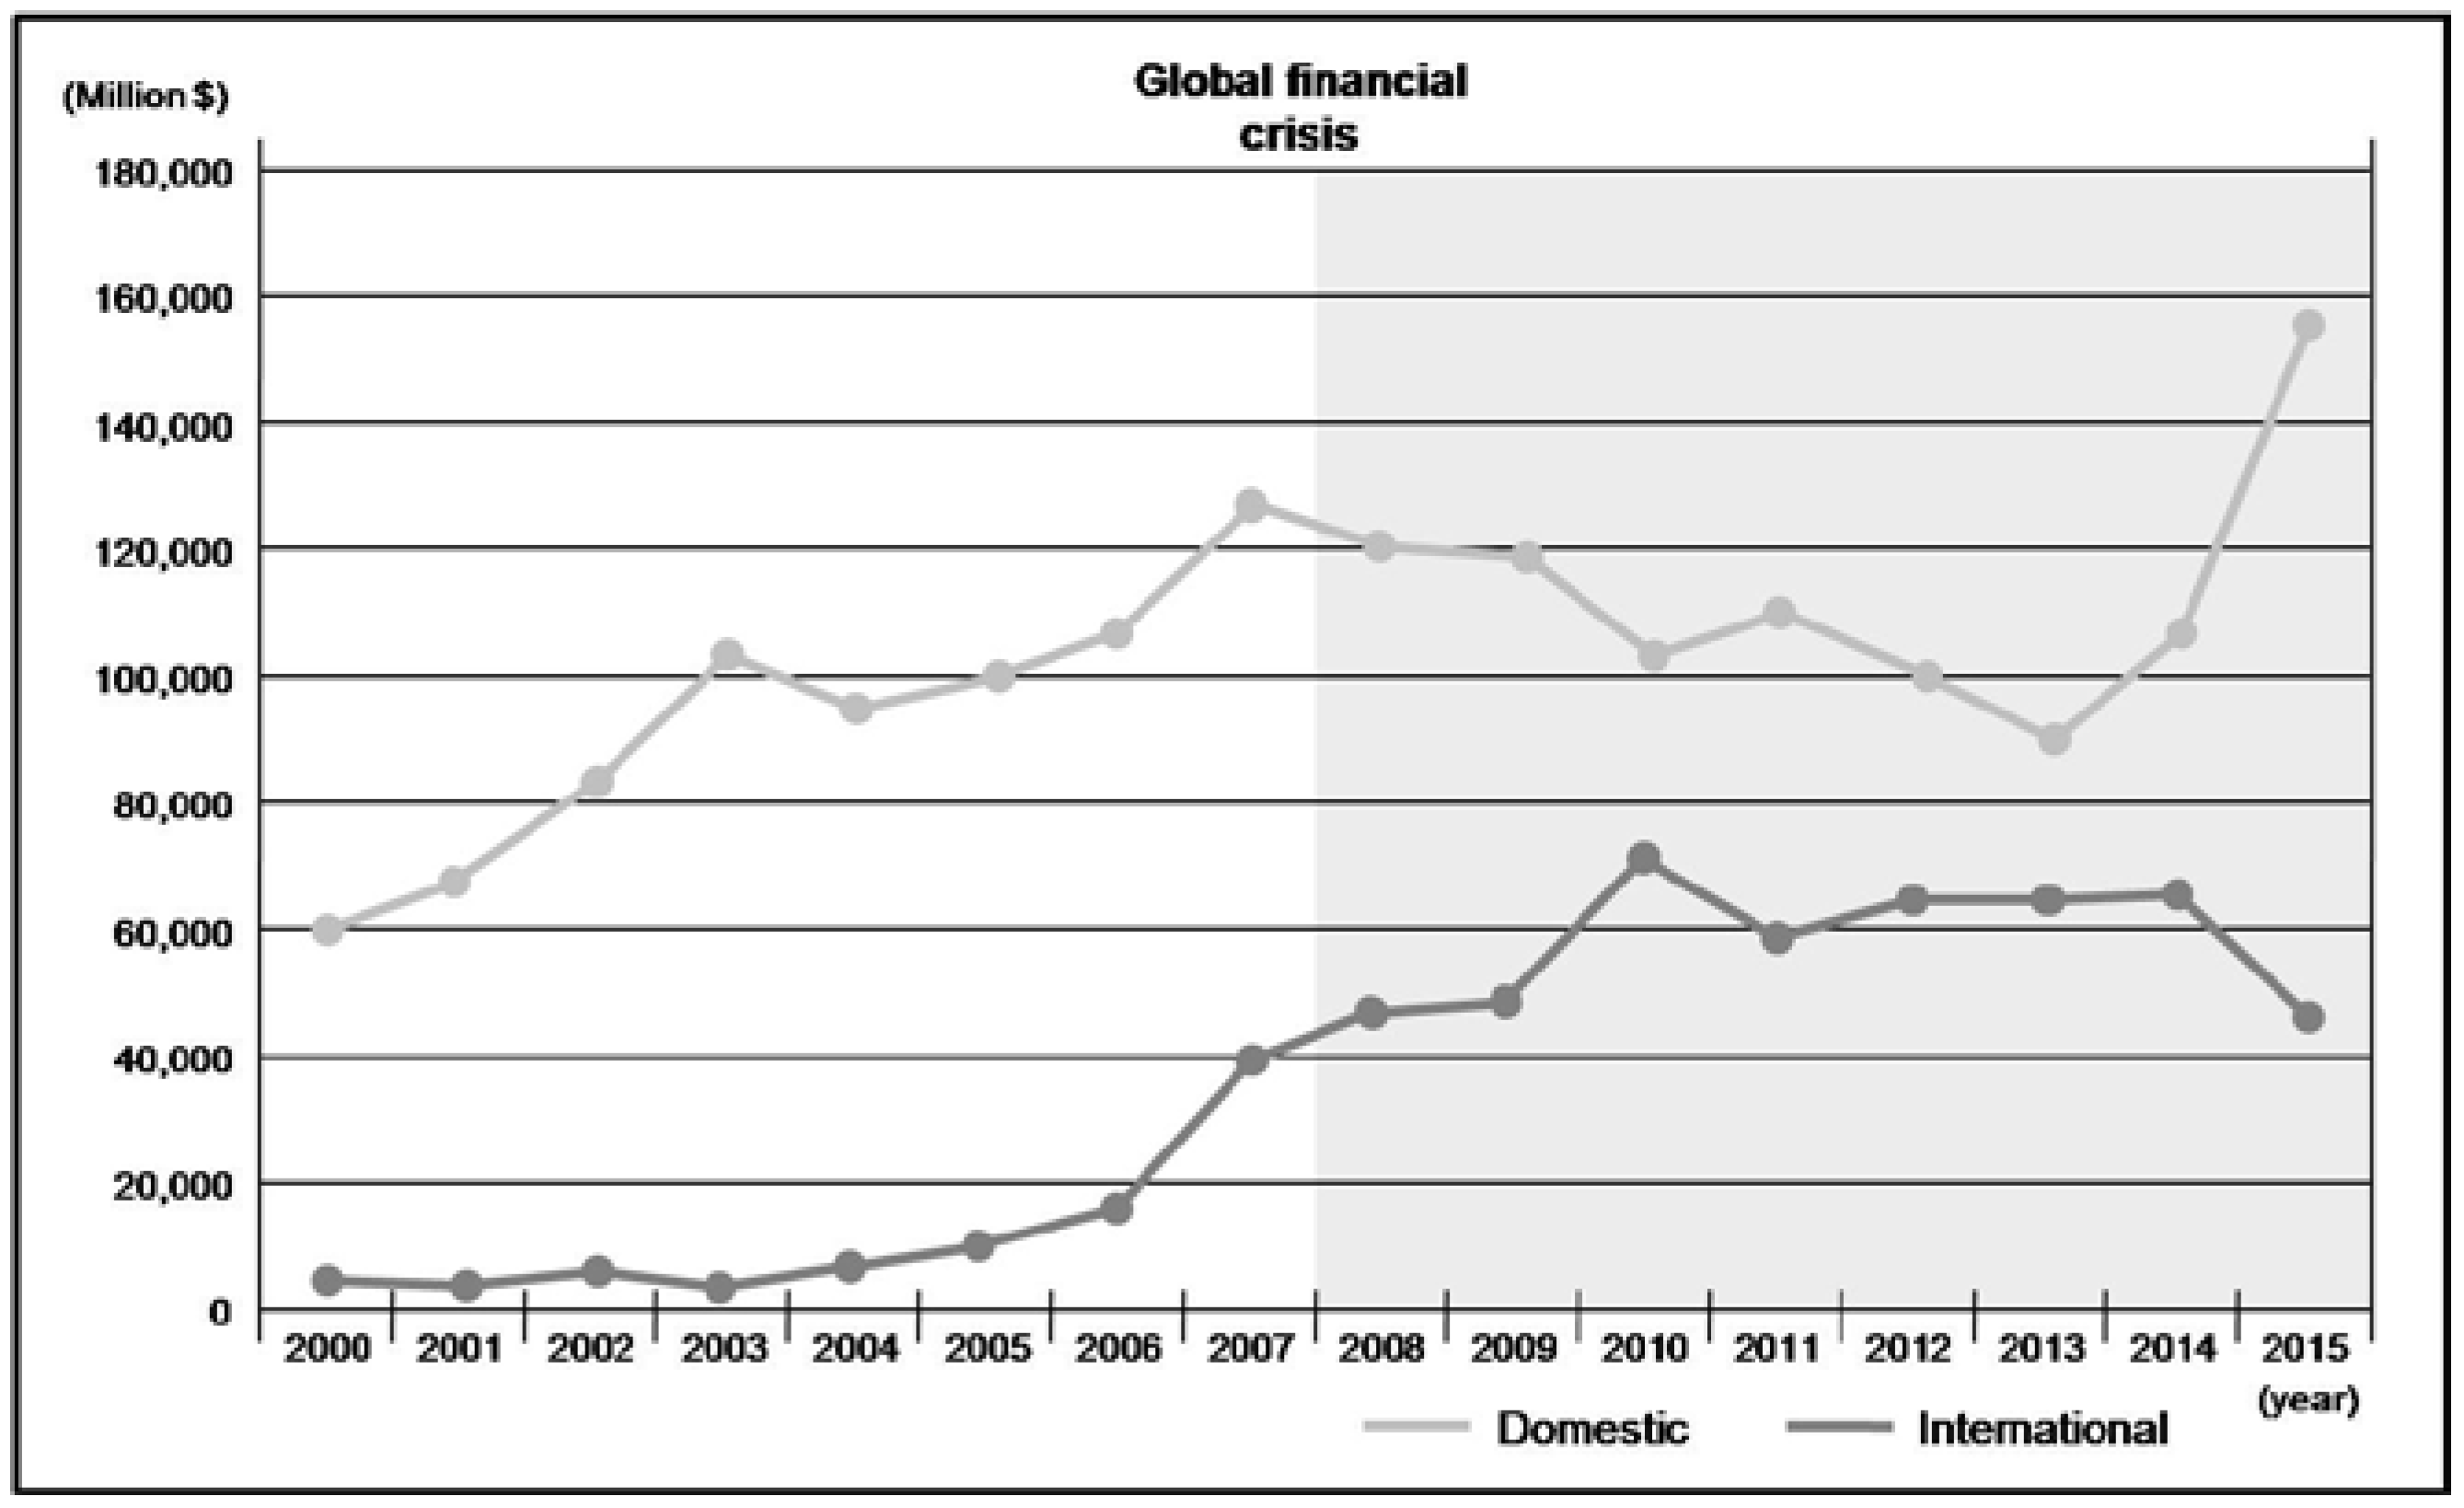
Figure 1 shows the domestic construction orders of Korean construction firms, which increased from approximately 60,152 million USD in 2000 to 102,447 million USD in 2003. Although this amount decreased again in 2004, domestic construction orders gradually increased and reached 127,912 million USD in 2007. Thus, domestic construction orders of Korean construction firms increased before the global financial crisis in 2008. If we examine overseas construction orders of Korean construction firms for the same period, the orders fluctuated widely from 5433 million USD in 2000 to 3677 million USD in 2003. However, orders continuously increased after they reached 7498 million USD in 2004 and recorded 39,788 million USD in 2007 before the global financial crisis. Therefore, Korean construction firms expanded actively in the domestic and overseas markets beginning in 2004 and before the global financial crisis.
However, after the global financial crisis, specific factors have been observed concerning the changes between domestic and overseas construction orders of Korean construction firms. After the domestic construction orders reached 120,085 million USD in 2008, orders gradually decreased to 91,307 million USD in 2013. In contrast, during the same period, overseas construction orders increased from 47,640 million USD in 2008 to 65,212 million USD in 2013, which was relatively satisfactory. Construction orders for Korean firms showed an increasing tendency despite the effects of the global financial crisis worldwide, which caused overall shrinkage in the overseas construction market.
This study aims to empirically analyze the influence of Korean construction firms’ regional diversification characteristics on management performance, particularly with respect to the financial sustainability of firms.

2.2. Literature Review

Korean construction firms enter the overseas construction market to diversify and maintain stable management. A diversification strategy is designed to achieve sustainable firm performance in the various markets and industries. Considerable research has been conducted on the relationship between business diversification and firms’ management performance. However, studies have shown conflicting results on the effect of diversification on firms’ performance.
Previous studies have noted a positive influence from diversification on firm performance because of resource management efficiency, enhancement of self-financing capability, and firms’ financial risk reduction effect. Rumelt (1974) showed that, in the research conducted on Fortune 500 companies between 1949 and 1974, related diversification was a superior strategy in terms of profitability than unrelated diversification [12]. Palepu (1985) discovered a similar result in research on US food companies. Additionally, several studies confirmed the effectiveness of business diversification strategy according to resource management efficiency [13]. Studies targeted the different countries, that is, Lecraw (1984) for Canada [14], Itami (1982) for Japan [15], and Buhner (1987) for Germany [16]. The results of these studies implied that related diversification has a positive effect on firm performance because the firm’s technology and resources are applied to the related market. Khanna et al. (2000), in an empirical analysis targeting emerging markets, noticed that the influence of business diversification on firm performance showed stronger positive aspects than negative aspects [17].
In contrast, the existing studies that address the contradictory aspects have noted that business diversification has a negative impact on firm management performance due to overinvestment, a cross-subsidization effect, and the occurrence of asymmetric information cost. Lang et al. (1994) insisted, from their analysis of companies with assets of over 100 million USD from 1978 to 1990 on the relationship between the rate of diversification and firm performance, that the performance of diversified firms is inferior to the performance of specialized firms. The authors noticed that enhancing self-financing capability through business diversification causes over investment and a negative impact on a firm’s performance [18]. Berger et al. (1995) analyzed the influence of firm diversification on the performance of companies for which total sales exceeded 20 million USD for six years, 1986 to 1991. The result showed that diversified companies suffered a value loss of, on average, 13%–15%. The authors insisted that cross-subsidization among business sectors was the cause, and the sectors with satisfactory investment performance supported the sectors with poor performance [19]. Comment et al. (1995) investigated 2000 companies listed on the NYSE and ASE for three years, 1987 to 1989, to identify the relationship between corporate focus and stock returns. The results revealed that the company group with intensified corporate focus had a higher rate of earnings while a weak corporate focus showed the lowest earnings rates [20]. Lins et al. (1999) examined whether the companies’ value loss occurred as a result of diversification in countries other than the US. The result showed that the decline in corporate value due to diversification was significant in Japan and the UK [21].
Diversification has also been adopted by construction firms. The studies related to diversification for the construction sector can be classified into diversification strategy and performance measurement studies. The research on diversification strategy in the construction sector mainly investigates the growth fundamentals in construction companies for one of the various strategies. Cheah (2002) investigated the diversification strategy of 21 construction firms that conduct business in overseas construction markets according to the market segmentation matrix. The market segmentation matrix suggested in this study categorized the diversification patterns of construction forms into (1) project type diversification (for example, residence construction, commercial construction, and industrial facility); (2) regional diversification (for example, domestic and overseas); and (3) service diversification (for example, validity verification, planning, design, and construction) [22]. Yee et al. (2006) [23] analyzed the globalization, diversification, and financial strategy of construction firms on 61 E&C companies in Korea, Japan, Europe, and the US. The results found that globalized firms show characteristics of a high current ratio and low leverage while diversified firms show a low current ratio and high leverage. Yee et al. (2006) [7] studied the relationships among companies’ scale, profitability, and diversification strategy for the same companies examined by Yee et al. (2006) [23]. The authors concluded that small-scale companies show a tendency to concentrate, and when the scale and resources of a company grow to a certain degree, the company expands to new market sectors.
The diversification performance measurement studies for the construction industry focused on the verification of diversification performance by measuring the rate of diversification and quantitatively analyzing the relationship with management performance. Choi et al. (2005) [24] investigated diversification and profitability of 59 contractors and 49 non-contractors—including, for example, material suppliers, construction engineers, and environmental firms—in the US based on 12 years of data. In this study, they divided the firms into two groups, specialized firms and diversified firms, and analyzed the difference between the two groups but found no significant difference between the firms in terms of either a high or low level of diversification. Kim et al. (2012) [25] examined the diversification performance of 400 construction companies and 500 construction design firms in the US between 1994 and 2009. This study executed four correlation analyses; diversification and corporate scale, diversification and corporate growth, diversification and stability, and corporate growth and scale. The results showed that large-scale companies were more diversified than small-scale companies; however, diversification was not related to the corporate growth rate. Additionally, corporate performances of diversified construction companies and design firms were more stable than the standard deviation of the companies that were the objects of study. This study concluded that construction companies might grow with specialization followed by diversification for stability and survival. Panagiotidis et al. (2016) examined the Greek market in their study of the potential interdependencies between the housing price index and various macroeconomic determinants utilizing a VECM framework. This study found that housing market fluctuations had a considerable influence on the whole construction market, concluding that when the housing market is depressed, the financial sustainability of the construction company is vulnerable [26].
In this study, we verify the performance of multinational business diversification—which has characteristically appeared in Korea—in terms of the corporate sustainability based on the business diversification studies. A number of studies on the overseas expansion of construction companies have been reported in the literature. For example, Han et al. (2004) looked at how financial portfolio risk management can be implemented for both individual and corporate international projects in order to integrate their risk hierarchies, recommending the use of a multicriterion decision-making method to maximize total value [27]. Gunhan et al. (2005) developed a decision-making model for construction firms intending to expand their business internationally [28], while Jung et al. (2012) [29] suggested several sustainable construction strategies for international construction companies that function well under changing market conditions. In particular, they found that regional diversification is a useful strategy for overcoming prolonged recessionary periods, and localization is also helpful, particularly during the subsequent post-recession boom. Jung et al. (2012) [30] suggested the use of a country portfolio model to manage such market uncertainties, proposing a quantitative diversification strategy to optimize country portfolio solutions based on four critical country-level objectives.
The mentioned papers typically recognize multinational business diversification from construction firms’ overseas expansion as an important strategy. However, the majority of study has been on the search for risk management measures, because the uncertainty of overseas expansion was comparably larger than the uncertainty associated with a domestic construction business. Therefore, these studies should differentiate between the influence of a construction firm business portfolio and the influence of overseas construction business as well as domestic business on the management performance of construction firms. In this study, we confirm the impact of multinational business diversification on the financial sustainability of construction firms, focusing particularly on the stability and continuity of Korean construction companies.

3. Research Methodology

The empirical analysis was conducted according to the vector error correction (VEC) model, which is a type of VAR model. Unlike other general structural models, a vector auto-regression (VAR) model is a multi-variable time-series model that is composed of correlations between variables and time lag correlations in a state of excluding prior economic theory [31]. A VAR model can use, without losing generality, practically effective information because it does not impose the use of a particular economic theory on the structural relationships between the model’s variables, so in addition to being dynamic, a VAR model exerts mutual influences on variables in order to analyze sets of time-series data [32].
A VAR model consists of linear regression equations, with each equation taking the currently observed values of each of the variables as the dependent variables and then assigns previously observed values of the other variables and the individual equations as explanatory variables. If p denotes the time lag for the macroeconomic variables of the vector (N × 1), Yt, can then be expressed as follows [33].
X t = B ( L ) X t +   e t =   k = 1 B k X t k +   e t =   k = 1 l B k X t k +   e t   ( if   the   number   of   time   lags   is   limited   to   l )
where Yt denotes macroeconomic variables of vector, N × 1, αt denotes a coefficient matrix, et denotes the stochastic error term, and L denotes the lag operator, L1Yt = Yt − 1, L2Yt = Yt − 1, ∙∙∙, A(L) = A1L1 + A2L2 + A3L3 + … [33].
The analytical results obtained are influenced by both the order of the variables and the lag length of the model [34], so for this study a unit root test was applied to confirm the variables’ stability. A Granger causality test was utilized to determine the order of the variables and the appropriate time lag calculated based on SIC by conducting a time lag test.
In the event of the time series data being unstable, it is necessary to differentiate the level variables before utilizing them for the analysis in order to avoid losing their unique information. If there is a long-term linear relation among them, i.e., cointegration, the VEC model can be used instead to perform the analysis [35]. The VEC model is a limited form of the VAR model when cointegration is available; therefore, this is a dynamic model in which the cointegration relation among time series is considered along with other short-term dynamic relationships [33].
Δ X t = i = 1 p 1 Γ i Δ X t i + α β X t p + u i
where β is a (n × r) vector that denotes cointegration relation. β’Xt - p, which is a linear combination of r, denotes disequilibrium error in the t-p point and influences {Xt} in the next time point, t, by coefficient α. Therefore, the (n × r) coefficient matrix, α, is called the error modification coefficient [33].
In this study, the cointegration test was performed, and the VEC model was applied because the result confirmed the existence of cointegration.
Because several studies have investigated the dynamic relations among the variables of the construction sector using the VEC model [36,37,38], which has been used in this study, this study investigated the impact of multinational business diversification on the financial sustainability of Korean construction firms using the VEC model.

4. Empirical Analysis

4.1. Variables and Data Collection

Table 1 shows a list of variables and Figure 2 shows trends of variables’ fluctuation in this study. There are various indexes—for example, profitability, stability, and growth potential—which represent firm management performance. To secure financial sustainability, it is important that companies avoid financial distress by coping with various business risks. Accordingly, in this study, the stability index, particularly the current ratio and the debt ratio, were selected as proxy variables for the financial sustainability of firms. The debt ratio was used to evaluate the dependence on outside capital while the current ratio was used as an index to measure the ability to repay short-term debt. Therefore, both indexes evaluate the financial soundness of firms. The debt ratio and current ratio can be calculated by the following equation.
C u r r e n t   r a t i o = C u r r e n t   a s s e t s C u r r e n t   l i a b i l i t i e s   × 100 ( % )
D e b t   r a t i o = T o t a l   D e b t T o t a l   A s s e t s   × 100 ( % )
The current ratio and debt ratio were calculated using financial statements of 25 construction companies out of 100 companies ranked during an assessment system for construction ability in 2005. The companies have overseas construction experience for which the financial data are easily obtained. The current ratio and debt ratio of sample construction firms were calculated by averaging each firm’s current assets, current debts, total debts, and total equities. These data were obtained from the Data Analysis, Retrieval, and Transfer System (DART) of Financial Supervisory Service of Korea. Overseas and domestic construction orders were applied as variables that substituted for multinational business diversification. The data for these overseas and domestic construction orders were calculated using the total sales of 25 samples of construction firms as stated above.
The analytical variables using the data of the higher-ranked 25 construction firms can be representative of general Korean construction companies for our analysis on the relations between multinational business diversification and financial sustainability because these companies ranked higher in the assessment system for construction ability. These companies also occupy a large proportion of total orders because of the actual project contract system in Korea, although there are many construction companies in Korea. The time series data of analytical variables are quarterly data between 2001 and 2015.
The models used for analysis in this study were Model A and Model B, where Model A used the current ratio and international and domestic construction orders, and Model B used the debt ratio and international and domestic construction orders in the analysis. A basic test of variables was performed to build the VEC model. Based on this test result, VEC models were built for each model followed by the empirical analysis.

4.2. Empirical Procedure

Stationary series data should be secured when performing series analyses, because if non-stationary serial data are used, spurious regression phenomena can occur where no such correlations exist even though the variables seem to be highly correlated [39]. It is necessary to confirm the existence of unit roots in the serial data to test the stationarity of series data, and the serial data are non-stationary if there is a unit root. Here, a representative unit root test known as the augmented Dickey-Fuller (ADF) test was applied to test the stationarity of the serial data. The results of this test are shown in Table 2. Most of the statistical values obtained for DF-t were larger than the significance levels of 1%, 5%, and 10% for both models A and B for the case of level variables. Therefore, the null hypothesis that the unit root exists cannot be rejected. However, the results of applying the unit root test for the first difference to the level variables of both models A and B lead to the rejection of the null hypothesis—that the unit root exists at the 1%, 5%, and 10% significance levels. This implies that the first difference variables are stationary.
The spurious regression phenomenon occurs when the conventional regression analysis is applied to the variables that were non-stationary time series data according to the unit root test results. Therefore, it is statistically meaningless to analyze the correlations between non-stationary time series using the simple regression analysis. However, although these time series have been shown to be non-stationary, the results of conventional regression analyses may be significant if there is a cointegration relationship between them. If there is cointegration, the VEC model should be applied to perform the analysis [40].
The proper time lag test was first performed to execute the cointegration test. The proper time lag should be tested to secure the reliability of the research according to information theory because the error occurs when the time lag length is randomly set up in the VAR model. Two methods—Akaike information criteria (AIC) and Schwarz information criteria (SIC)—can be used to determine the time lag, p, in the VAR(p) model; the point being minimized according to each standard would be identified as the proper time lag. The proper time lag derived from these methods has high explanatory power when a new variable is introduced; however, simultaneously, the degree of freedom might be decreased because of the expansion in model size. Accordingly, a smaller time lag would be selected to secure brevity of the model [41]. Table 3 shows that we tested the proper time lag according to the SIC standard and identified the proper time lag, ‘time lag 2’ for model A and ‘time lag 1’ for model B.
Based on the results of the Johansen test, the representative cointegration test method shown in Table 4, cointegration exists within a 5% significance level because the null hypothesis, “the number of cointegration vectors is less than or equal to r,” is rejected. Thus, we confirmed that cointegration existed among the level variables, and we performed the analysis using the VEC model.
In the VAR model, the analytical results are sensitive to relatively small changes, yielding different analytical results depending on the order in which the endogenous variables are arranged. Therefore, we decided the order of arrangement depending on the causal relationship of variables before constructing a VAR model. We performed the Granger causality test in this study. The Granger causality test is a method to classify the cause and effect variables in the state of excluding economic theory by applying the lag distribution model [42].
Table 5 shows the results of the Granger causality test in model A and shows the causal relations as DCO▷CR▷ICO. In the case of model B, the causal relations are identified as DR▷ICO▷DCO.
Based on the series of test results, we ultimately devised the equations of the VEC model for model A as Equations (5), (6), and (7) and for model B as Equations (8), (9), and (10).
Δ C R t = δ + α ( β y t 1 + ρ 0 ) + i = 1 p γ 1 , i Δ C R t i + i = 1 p γ 2 , i Δ D C O t i + i = 1 p γ 3 , i Δ I C O t i + u t
Δ D C O t = δ + α ( β y t 1 + ρ 0 ) + i = 1 p γ 1 , i Δ D C O t i + i = 1 p γ 2 , i Δ C R t i + i = 1 p γ 3 , i Δ I C O t i + u t
Δ I C O t = δ + α ( β y t 1 + ρ 0 ) + i = 1 p γ 1 , i Δ I C O t i + i = 1 p γ 2 , i Δ C R t i + i = 1 p γ 3 , i Δ D C O t i   + u t
Δ D R t = δ + α ( β y t 1 + ρ 0 ) + i = 1 p γ 1 , i Δ D R t i + i = 1 p γ 2 , i Δ D C O t i + i = 1 p γ 3 , i Δ I C O t i + u t
Δ D C O t = δ + α ( β y t 1 + ρ 0 ) + i = 1 p γ 1 , i Δ D C O t i + i = 1 p γ 2 , i Δ D R t i + i = 1 p γ 3 , i Δ I C O t i + u t
Δ I C O t = δ + α ( β y t 1 + ρ 0 ) + i = 1 p γ 1 , i Δ I C O t i + i = 1 p γ 2 , i Δ D R t i + i = 1 p γ 3 , i Δ D C O t i   + u t
where α is the adjustment coefficient, β is the long-run parameters of the VEC function, and γj,i reflects the short-run aspects of the relationship between the independent variables and the target variable. The impulse response analysis was performed using the VEC model, which has been derived in this manner.

4.3. Results

When the impulse of standard deviation 1 is applied to the variables in a model by checking the results of the variable itself or other variables changing for a certain period, the mutual correlations and spread effect can be analyzed by the impulse response analysis [43].
The process of changing the current ratio and debt ratio against the impulse of each variable is shown in Figure 3 and Table 6. The current ratio against the impulse of the current ratio’s own variables initially responded by approximately 0.056% in a positive (+) direction. However, the range of fluctuation sharply decreased in the second quarter and responded by approximately 0.027% in the final tenth quarter. Moreover, against the impulse of domestic construction orders, the current ratio initially responded by approximately 0.010% in a positive (+) direction, although the fluctuation occurred on the change in the current ratio as time passed, approximately 0.020% change was observed in the final tenth quarter. In contrast, against the impulse of overseas construction orders, the current ratio began to move in a negative (−) direction at the initial stage and, at the tenth quarter, approximately 0.012% of the fluctuation range was displayed.
The current ratio, against the impulse of the debt ratio’s own variables, initially responded by approximately 0.074% in a positive (+) direction. However, the range of fluctuation decreased sharply from the second quarter and displayed approximately 0.029% fluctuation in the tenth quarter. Against the impulse of domestic construction orders, the debt ratio initially moved in the negative (−) direction and, in the final tenth quarter, the fluctuation was approximately 0.021%. For the impulse of overseas construction orders, the debt ratio began to move in a positive (+) direction and displayed approximately 0.044% range in fluctuation in the final tenth quarter.
From the results of the impulse response analysis, the current ratio decreased when overseas construction orders increased. However, the current ratio also increased when domestic construction orders increased. In contrast, the debt ratio decreased when domestic construction orders increased; however, the debt ratio increased when overseas construction orders increased. Because the increase in the current ratio implies that short-term repayment capacity is rising, financial stability is becoming satisfactory. However, the increase in the debt ratio implies that financial stability is worse because the long and short-term debt is exceeding the corporate capital. Thus, an increase in domestic construction orders ensures that the financial stability of construction firms is in good condition because it increases the current ratio and decreases the debt ratio. However, we confirm that the increase in overseas construction orders results in a decrease in the current ratio and an increase in the debt ratio, which is detrimental to the financial stability of construction firms.
The results were similar to the results in studies that have noted that diversification affects the negative influence on the management of firms. In other words, although a construction firm that has grown based on the domestic construction market enters the overseas construction market. This market is very different from the domestic business environment with various risks, and the results reveal that multinational diversification eventually has a negative impact on financial sustainability.
From the construction industry’s perspective, an increase in order scale implies an increase in sales, which should result in financial stability from increased profit. However, the result of a negative impact on the financial stability of a firm from an increase in overseas construction orders implies poor profitability. Particularly, after the subprime mortgage crisis, the domestic construction business declined while the scale of overseas construction business increased rapidly. Ostensibly, growing the scale of expansion to overseas construction markets can be considered positive. However, considering the changing situation in the domestic construction business, expansion to overseas construction markets can be interpreted as a cause of capital turnover because of the rapid decline in the scale of domestic orders. From the perspective of financial stability, the optimistic recognition of the business portfolio changes of recent active expansion to overseas markets by Korean construction firms should be retrained.

5. Discussion and Conclusions

Recently, the Korean construction business has experienced challenges due to the recession in real estate business. The recession in the domestic residential construction business, which occupies a high proportion of the business portfolio of Korean construction firms, contributes to the deteriorating financial stability of construction firms. To resolve this situation, additional sources of profit should be secured by expanding to various markets based on the existing business sector. From this perspective, expansion to overseas markets by Korean construction firms can be considered reasonable in terms of multinational diversification. However, as noted in previous studies, a diversification strategy can be linked to poor corporate performance. Accordingly, in this study, empirical analysis was performed using the VEC model to determine whether this business strategy of Korean construction firms affects the financial sustainability of construction firms.
In this study, the current ratio and debt ratio were used as proxy variables of financial sustainability, and the relationship between domestic and overseas construction orders was analyzed. For the empirical analysis, the VEC model was introduced, and the period of analysis was set from the first quarter of 2001 to the fourth quarter of 2015.
From the result of the analysis, because an increase in domestic construction orders may increase the current ratio while decreasing the debt ratio, the financial stability of construction firms may become satisfactory. However, we found that an increase in overseas construction orders is detrimental to the financial stability of construction firms by reducing the current ratio and increasing the debt ratio. In general, an increase in the scale of orders in the construction business implies an increase in sales. As sales increase, profit should also increase, and there should be a positive effect on firm performance. Therefore, the above results mean that the many overseas projects contracted by Korean construction firms are likely to be a deficit.
However, Korean construction firms’ overseas construction expansion is blamed unconditionally based on the relevant results, which is problematic. Expansion to overseas markets is essential for construction firms’ survival because of the limitations of the domestic construction market. Actually, previous research mentioned that even if there is not profit directly, it is important to secure business opportunities consistently [44]. Accordingly, multinational diversification of Korean construction firms through expansion of the overseas construction market could be considered a rational decision.
Overall, multinational business diversification is advisable in terms of enhancement of business opportunities. However, for succeeding with this strategy, it is necessary to secure the capability to execute overseas construction business stably. In other words, because overseas construction business is more at risk than domestic construction business, construction firms have to prepare accurate feasibility examinations and systematic risk management strategies for overseas construction projects. For that, Korean construction firms need to establish diverse local business network for not only securing technical skills but planning business strategies effectively.

Acknowledgments

This research was supported by Basic Science Research Program through the National Research Foundation of Korea (NRF) funded by the Ministry of Education (NRF-2015R1D1A1A01059286).

Author Contributions

Sanghyo Lee developed the concept and drafted the manuscript. Yonghan Ahn revised the manuscript and supervised the overall work. Sungwoo Shin reviewed the manuscript. All authors read and approved the manuscript.

Conflicts of Interest

The authors declare no conflict of interest.

References

  1. Oyewobi, L.O.; Windapo, A.O.; Cattell, K.S. Impact of Business Diversification on South African Construction Companies’ Corporate Performance. J. Financ. Manag. Prop. Constr. 2013, 18, 110–127. [Google Scholar] [CrossRef]
  2. Ibrahim, Y.M.; Ibrahim, A.M.; Kabir, B. Geographic Diversification, Performance, and the Risk Profile of UK Construction Firms. J. Eng. Des. Technol. 2009, 7, 171–185. [Google Scholar]
  3. Amit, R.; Livnat, J. Diversification Strategies, Business Cycles and Economic Performance. Strateg. Manag. J. 1988, 9, 99–110. [Google Scholar] [CrossRef]
  4. Mathur, I.; Singh, M.; Gleason, K.C. Multinational Diversification and Corporate Performance: Evidence from European Firms. Eur. Financ. Manag. 2004, 10, 439–464. [Google Scholar] [CrossRef]
  5. Chakrabarti, A.; Singh, K.; Mahmood, I. Diversification and Performance: Evidence from East Asian Firms. Strateg. Manag. J. 2007, 28, 101–120. [Google Scholar] [CrossRef]
  6. Cheah, C.Y.J.; Garvin, M.J.; Miller, J.B. Empirical Study of Strategic Performance of Global Construction Firms. J. Constr. Eng. Manag. 2004, 130, 808–817. [Google Scholar] [CrossRef]
  7. Yee, C.Y.; Cheah, C.Y.J. Interactions between Business and Financial Strategies of Large Engineering and Construction Firms. J. Manag. Eng. 2006, 22, 148–155. [Google Scholar] [CrossRef]
  8. Jung, W.; Han, S.H.; Park, H.; Kim, D.Y. Empirical Assessment of Internationalization Strategies for Small and Medium Construction Companies. J. Constr. Eng. Manag. 2010, 136, 1306–1316. [Google Scholar] [CrossRef]
  9. Park, H.; Han, S.H.; Rojas, E.M.; Son, J.; Jung, W. Social Network Analysis of Collaborative Ventures for Overseas Construction Projects. J. Constr. Eng. Manag. 2011, 137, 344–355. [Google Scholar] [CrossRef]
  10. Kim, D.Y.; Ashuri, B.; Han, S.H. Financial Valuation of Investments in International Construction Markets: Real-Options Approach for Market-Entry Decisions. J. Manag. Eng. 2013, 29, 355–368. [Google Scholar] [CrossRef]
  11. Sharma, A.; Panagiotidis, T. An Analysis of Exports and Growth in India: Cointegration and Causality Evidence (1971–2001). Rev. Dev. Econ. 2005, 9, 232–248. [Google Scholar] [CrossRef]
  12. Rumelt, R.O. Strategy, Structure and Economic Performance; Harvard University Press: Cambridge, MA, USA, 1974. [Google Scholar]
  13. Palepu, K. Diversification Strategy, Profit Performance, and the Entropy Measure. Strateg. Manag. J. 1985, 6, 239–255. [Google Scholar] [CrossRef]
  14. Lecaw, D.J. Bargaining Power, Ownership, and Profitability of Transnational Corporations in Developing Countries. J. Int. Bus. Stud. 1984, 15, 27–43. [Google Scholar] [CrossRef]
  15. Itami, H.; Kagono, T.; Yoshihara, H.; Sakuma, A. Diversification Strategies and Economic Performance. Jpn. Econ. Stud. 1982, 8, 398–405. [Google Scholar] [CrossRef]
  16. Buhner, R. Assessing International Diversification of West German Corporations. Strateg. Manag. J. 1986, 8, 25–37. [Google Scholar] [CrossRef]
  17. Khanna, T.; Palepu, K. Is Corporate Affiliation Profitable in Emerging Markets? J. Financ. 2000, 55, 867–891. [Google Scholar] [CrossRef]
  18. Lang, L.H.P.; Stulz, R.M. Tobin’s Q, Corporate Diversification, and Firm Performance. J. Polit. Econ. 1994, 102, 1248–1280. [Google Scholar]
  19. Berger, P.G.; Ofek, E. Diversification’s Effect on Firm Value. J. Financ. Econ. 1995, 37, 39–65. [Google Scholar] [CrossRef]
  20. Comment, R.; Jarrell, G.A. Corporate Focus and Stock Returns. J. Financ. Econ. 1995, 37, 67–87. [Google Scholar] [CrossRef]
  21. Lins, K.; Servaes, H. International Evidence on the Value of Corporate Diversification. J. Financ. 1999, 54, 2215–2239. [Google Scholar] [CrossRef]
  22. Cheah, Y.J. Fundamental Analysis and Conceptual Model for Corporate Strategy in Global Engineering and Construction Markets. Ph.D. Thesis, Massachusetts Institute of Technology, Cambridge, MA, USA, 2002. [Google Scholar]
  23. Yee, C.Y.; Cheah, C.Y.J. Fundamental Analysis of Profitability of Large Engineering and Construction Firms. J. Manag. Eng. 2006, 22, 203–210. [Google Scholar] [CrossRef]
  24. Choi, J.; Russell, J.S. Long-term Entropy and Profitability Change in US Public Construction Firms. J. Manag. Eng. 2005, 21, 17–26. [Google Scholar] [CrossRef]
  25. Kim, H.; Reinschmidt, K. Market Structure and Organizational Performance of Construction Organizations. J. Manag. Eng. 2012, 28, 212–220. [Google Scholar] [CrossRef]
  26. Panagiotidis, T.; Printzis, P. On the macroeconomic determinants of the housing market in Greece: A VECM approach. Int. Econ. Econ. Policy 2016, 13, 387–409. [Google Scholar] [CrossRef]
  27. Han, S.H.; Diekmann, J.E.; Lee, Y.; Ock, J.H. Multicriteria Financial Portfolio Risk Management for International Projects. J. Constr. Eng. Manag. 2004, 130, 346–356. [Google Scholar] [CrossRef]
  28. Gunhan, S.; Arditi, D. International Expansion Decision for Construction Companies. J. Constr. Eng. Manag. 2005, 131, 928–937. [Google Scholar] [CrossRef]
  29. Jung, W.; Han, S.H.; Koo, B.; Jang, W. Which Strategies Are More Effective for International Contractors during Boom and Recession Periods? J. Manag. Eng. 2012, 28, 281–290. [Google Scholar] [CrossRef]
  30. Jung, W.; Han, S.H.; Lee, K. Country Portfolio Solutions for Global Market Uncertainties. J. Manag. Eng. 2012, 28, 372–381. [Google Scholar] [CrossRef]
  31. Baffoe-Bonnie, J. The Dynamic Impact of Macroeconomic Aggregates on Housing Prices and Stock of Houses: A National and Regional Analysis. J. Real Estate Financ. Econ. 1998, 17, 179–197. [Google Scholar] [CrossRef]
  32. Cooley, T.F.; Leroy, S.F. AtheoreticalMacroeconometrics: A Critique. J. Monet. Econ. 1985, 16, 283–308. [Google Scholar] [CrossRef]
  33. Xu, J.; Moon, S. Stochastic Forecast of Construction Cost Index Using a Cointegrated Vector Autoregression Model. J. Manag. Eng. 2013, 29, 10–18. [Google Scholar] [CrossRef]
  34. Wong, J.M.W.; Ng, S.T. Forecasting Construction Tender Price Index in Hong Kong Using Vector Error Correction Model. Constr. Manag. Econ. 2010, 28, 1255–1268. [Google Scholar] [CrossRef]
  35. DeJong, D.N. Reconsidering Trends and Random Walks in Macroeconomic Time Series. J. Monet. Econ. 1991, 28, 221–254. [Google Scholar] [CrossRef]
  36. Lean, C.S. Empirical Tests to Discern Linkages between Construction and Other Economic Sectors in Singapore. Constr. Manag. Econ. 2001, 19, 355–363. [Google Scholar] [CrossRef]
  37. Chan, S. Responses of Selected Economic Indicators to Construction Output Shocks: The Case of Singapore. Constr. Manag. Econ. 2002, 20, 523–533. [Google Scholar] [CrossRef]
  38. Shahandashti, S.M.; Ashuri, B. Forecasting Engineering News-Record Construction Cost Index Using Multivariate Time Series Models. J. Constr. Eng. Manag. 2013, 139, 1237–1243. [Google Scholar] [CrossRef]
  39. Granger, C.; Newbold, P. Spurious Regressions in Econometrics. J. Econ. 1974, 2, 111–120. [Google Scholar] [CrossRef]
  40. Eagle, R.; Granger, C. Cointegration and Error Correction: Representation, Estimation and Testing. Econometrica 1987, 55, 251–276. [Google Scholar]
  41. Boswijk, H.P. Efficient Inference on Cointegration Parameters in Structural Error Correction Models. J. Econ. 1995, 69, 133–158. [Google Scholar] [CrossRef]
  42. Granger, C.W.J. Investigating Causal Relations by Econometric Models and Cross-Spectral Methods. Econometrica 1969, 37, 424–438. [Google Scholar] [CrossRef]
  43. Sims, C. Are Forecasting Models Usable for Policy Analysis? Fed. Reserve Bank Minneap. Q. Rev. 1986, 10, 2–16. [Google Scholar]
  44. Chortareas, G.; Magkonis, G.; Moschos, D.; Panagiotidis, T. Financial Development and Economic Activity in Advanced and Developing Open Economies: Evidence from Panel Cointegration. Rev. Dev. Econ. 2015, 19, 163–177. [Google Scholar] [CrossRef]
Figure 1. Change trends in domestic and overseas construction orders of Korean construction firms.
Sustainability 08 00997 g001
Figure 2. Graphs of variables. (a) CR (Current ratio); (b) DR (Dept ratio); (c) DCO (Domestic construction orders); (d) ICO (Overseas construction orders).
Sustainability 08 00997 g002
Figure 3. Impulse response graph. (a) Impulse response of CR—Model A; (b) Impulse response of DR—Model B.
Sustainability 08 00997 g003
Table 1. Variables and descriptions.
VariablesDescriptionsPeriodFrequency
CRCurrent ratio2001:01–2015:04Quarterly
DRDebt ratio2001:01–2015:04Quarterly
DCODomestic construction orders2001:01–2015:04Quarterly
ICOOverseas construction orders2001:01–2015:04Quarterly
Table 2. Tests for unit roots (augmented Dickey-Fuller tests).
ModelVariablesLevelFirst Differencing
t-Statisticp-Valuet-Statisticp-Value
Model ACR−1.8738890.6552−12.110310.0000
DCO−0.6309380.9731−8.1257680.0000
ICO−2.8444680.1880−9.2228690.0000
Model BDR−2.3611630.3952−4.8911410.0011
DCO−0.6309380.9731−8.1257680.0000
ICO−2.8444680.1880−9.2228690.0000
Notes: The number of lags is selected using the Schwarz information criterion with pmax = 10.
Table 3. Lag specification results.
LagModel AModel B
0−0.5608310.395486
1−4.493991−3.910419 *
2−5.039847 *−3.782307
3−4.656913−3.436031
4−4.230129−3.285931
5−3.774241−2.925051
*: The number of lags is selected using the Schwarz information criterion.
Table 4. Co-integration test results.
PeriodNull HypothesisTest Statistic0.05 Critical Valuep-Value
Model Ar = 0 *41.5725235.192750.0090
r ≤ 116.5276020.261840.1511
r ≤ 24.8339059.1645460.3021
Model Br = 0 *44.9441829.797070.0005
r ≤ 1 *23.3898715.494710.0026
r ≤ 2 *6.3156663.8414660.0120
*: Significant at the 5% level; r is the co-integration rank.
Table 5. Results of the Granger causality test.
Model AModel B
CausalityLagF-Statisticp-ValueCausalityLagF-Statisticp-Value
DCOCR11.853130.1790DCODR10.524070.4722
CRDCO11.131510.2921DRDCO13.488230.0671
ICOCR12.439300.1241ICODR10.152490.6977
CRICO128.53022.E-06DRICO11.883330.1755
ICODCO10.363550.5490ICODCO10.363550.5490
DCOICO10.065320.7992DCOICO10.065320.7992
DCOCR22.065800.1370DCODR20.584880.5608
CRDCO20.704890.4988DRDCO21.016050.3691
ICOCR21.193870.3112ICODR20.106120.8995
CRICO215.56575.E-06DRICO21.409690.2534
ICODCO21.105870.3386ICODCO21.105870.3386
DCOICO20.443650.6441DCOICO20.443650.6441
DCOCR31.384490.2586DCODR32.188070.1013
CRDCO31.124010.3485DRDCO31.154050.3368
ICOCR31.508380.2240ICODR30.260600.8534
CRICO310.10633.E-05DRICO32.281850.0908
ICODCO31.020770.3916ICODCO31.020770.3916
DCOICO30.408640.7475DCOICO30.408640.7475
Table 6. Impulse response results—Model A.
Period (Quarter)CRDR
CRDCOICODRDCOICO
10.0561370.0098090.0000000.0735650.0000000.000000
20.0228100.020224−0.0116900.038738−0.0034850.011761
30.0288800.015867−0.0085910.040269−0.0111610.027101
40.0286490.013038−0.0076870.036414−0.0140550.029271
50.0294790.018065−0.0097980.033499−0.0161530.036461
60.0277570.017650−0.0101300.032306−0.0182480.038176
70.0284070.017779−0.0108910.030982−0.0190520.041095
80.0275250.018759−0.0112060.030290−0.0200520.042195
90.0277450.019310−0.0117620.029729−0.0204750.043443
100.0273940.019706−0.0123110.029371−0.0209170.044038

