Article

A Reflection on Low Energy Renovation of Residential Complexes in Southern Europe

by
Helena Corvacho
1,*,
Fernando Brandão Alves
2 and
Cecília Rocha
2
1
Civil Engineering Department, Faculty of Engineering, LFC-CONSTRUCT, Laboratory of Building Physics, University of Porto, Porto 4200-465, Portugal
2
Civil Engineering Department, Faculty of Engineering, CITTA—Research Centre for Territory, Transports and Environment, University of Porto, Porto 4200-465, Portugal
*
Author to whom correspondence should be addressed.
Sustainability 2016, 8(10), 987; https://doi.org/10.3390/su8100987
Submission received: 30 July 2016 / Revised: 15 September 2016 / Accepted: 24 September 2016 / Published: 30 September 2016

Abstract

:
The transformation of European existing building stock towards very low energy buildings requires a new approach. In this context, it seems reasonable to think that buildings should no longer be renovated individually but as part of a global energy system. Focusing on larger urban units may present some scale advantages and may constitute an opportunity to change the urban environment in a smart energy way. Specificities of Southern European countries are addressed. Due either to the climate or the life style, there are large differences in energy consumption per dwelling among southern and northern European countries. How much heating energy will be saved by over-insulating building envelopes if people do not feel the need to heat their houses in the first place? In addition, real energy use in buildings frequently shows major differences with respect to the predicted consumption. The definition of realistic solutions demands the availability of realistic predictions. A case of a residential complex in Portugal is used to illustrate the main questions and to conclude that moving from a building to a group of buildings scale may be an interesting challenge for policy makers to look closer in the near future.

1. Introduction

The building sector is one of the most significant energy consumers in EU, representing around 40% of final energy consumption and 60% of electricity consumption. In recent years, new and more demanding regulation came into force at a national level, in each Member State, implementing the Energy Performance of Buildings Directive (EPBD) and its 2010 recast.
However, the low volume of new construction, mainly since 2008, has limited the impact of the new energy requirements. Energy efficiency measures must therefore focus on the existing building stock. Its transformation towards very low energy buildings must take into account technical, economic and social restrictions. Furthermore, regulatory requirements to be applied to the renovation of existing buildings must work as an incentive rather than an obstacle for that renovation. This demands a very realistic and careful approach.
A NZEB is defined in article 2 of the EPBD recast [1] as “a building that has a very high energy performance. The nearly zero or very low amount of energy required should be covered to a very significant extent by energy from renewable sources, including energy from renewable sources produced on-site or nearby”. This vague definition raises several justified questions: what do “a very high energy performance”, “a very significant extent”, and “nearby” mean?
The exchange of experience regarding the already existing “high energy performance” buildings (ranging from low energy buildings to passive houses, zero-energy and zero emissions buildings and even to energy surplus houses) helped the many attempts to clarify NZEB concept and its diverse assumptions. Figure 1 shows two examples of existing high energy performance buildings.
Pless and Torcellini [4] present a classification for net-zero energy buildings based on the following four different definitions:
  • Net-Zero Site Energy: A site NZEB produces at least as much renewable energy (RE) as it uses in a year, when accounted for at the site.
  • Net-Zero Source Energy: A source NZEB produces (or purchases) at least as much RE as it uses in a year, when accounted for at the source. Source energy refers to the primary energy used to extract, process, generate, and deliver the energy to the site. To calculate a building’s total source energy, imported and exported energy is multiplied by the appropriate site-to-source conversion multipliers based on the utility’s source energy type.
  • Net-Zero Energy Costs: In a cost NZEB, the amount of money the utility pays the building owner for the RE the building exports to the grid is at least equal to the amount the owner pays the utility for the energy services and energy used over the year.
  • Net-Zero Emissions: A net-zero emissions building produces (or purchases) enough emissions-free RE to offset emissions from all energy used in the building annually. To calculate a building’s total emissions, imported and exported energy is multiplied by the appropriate emission multipliers based on the utility’s emissions and on-site generation emissions (if there are any).
The extension of NZEB boundaries leads to the idea of a Net Zero Energy Community (NZEC) [5].
“As the concept of NZEBs becomes technically feasible, extending its boundary to groups of buildings, campuses, communities, towns, bases, or cities becomes possible. […] For a large organization or a neighborhood, it is often more cost effective and efficient to generate RE in a central location on the campus or in the community, rather than on (or in addition to) each building. Community-scale systems allow for a single point for all maintenance and offer economies of scale—larger, central systems can be better optimized and cost less per kilowatt of generation capacity” [4].
“Applying the net zero energy concept at urban scale can provide opportunities for seasonal storage, implementation of smart grids for power sharing between housing units, controlling peak electricity production timing and reducing utility peak demand. Additional advantages of net zero energy neighborhoods include enabling design flexibility and increasing available surface areas for the integration of photovoltaic systems” [6].
Figure 2 shows an example of installation of PV modules in a parking lot providing energy to the nearby buildings.

2. Mediterranean Climate

In Southern European countries, the climate is classified as Mediterranean (either Csa or Csb).
The regions with a Mediterranean climate have normally relatively mild winters and quite warm summers. However, winter and summer temperatures can vary greatly between different regions. Temperatures of the Mediterranean climate zone are influenced by the geomorphology of the regions. In the West zone, closer to the Atlantic Ocean, temperatures are affected by sea breezes and are moderate during most of the year. In the east, temperatures are influenced by the climate of central Europe and Africa and are, comparatively to the western part, hotter in summer and colder in winter. Some examples of those variations are given below.
From the available European climate data, for example in [8], one can observe that in winter, Lisbon experiences very mild temperatures, without frost or snow (mean temperature of 11.6 °C, in January, the coldest month), whereas Madrid has colder winters with annual frosts and snowfall (a mean temperature of 5.5 °C, in January). In summer, Athens experiences very high temperatures, with a mean temperature of 27.9 °C in July, the hottest month. The mean temperature in Lisbon in the hottest month (August) is 23.5 °C.
In the maps shown in Figure 3 and Figure 4, the numbers of heating degree days and cooling degree days are presented. Very clear differences between the region around Mediterranean Basin and the other European regions can be observed. In Table 1, some examples of heating and cooling degree days for European cities are given.
Solar irradiation differences are also quite relevant, as can be observed in Figure 5.

3. Energy Consumption in Residential Buildings

Due either to the climate or the life style, there are large differences in energy consumption per dwelling among southern and northern European countries. Figure 6, Figure 8 and Figure 9 show some evidences of this.
According to an analysis based on ODYSSEE and MURE databases [12], the comparison between countries is more relevant if the heating consumption is adjusted to the same climate, highlighting differences related to building characteristics and to type of uses and life style. After adjustment to the EU average climate, Figure 6 shows that Luxembourg and Belgium turn out to have the highest consumption, at around 2 toe/dwelling (i.e., 23,000 kWh), compared to 0.3 toe/dwelling (3500 kWh) in Malta or 0.8 toe/dwelling (9300 kWh) in Portugal and Bulgaria.
Space heating is the most important end-use in the residential sector in the EU (67% in 2012, according to Figure 7) but its share has been slightly declining.
However, in a great part of European southern countries, as could be expected, its share is much less than EU average: in Malta, Cyprus and Portugal, the share of space heating is below 30% and below 50% in Spain (Figure 8 and Figure 9).
Figure 8. Breakdown of household energy consumption by end-use for each EU country in 2012 [12].
Sustainability 08 00987 g008
Figure 9. Energy consumption for space heating per m2 for each EU country [12].
Sustainability 08 00987 g009

4. Case Study

4.1. Scope

In order to identify the questions raised by low energy renovation at neighborhood level in a European southern country, a preliminary study was carried out in the scope of a M.Sc. work [13], where a residential complex in Porto, Portugal, was evaluated in terms of energy use and possible renovation measures were identified and tested. This will be presented as a case study allowing the discussion of the main issues.

4.2. Characterization of the Neighborhood

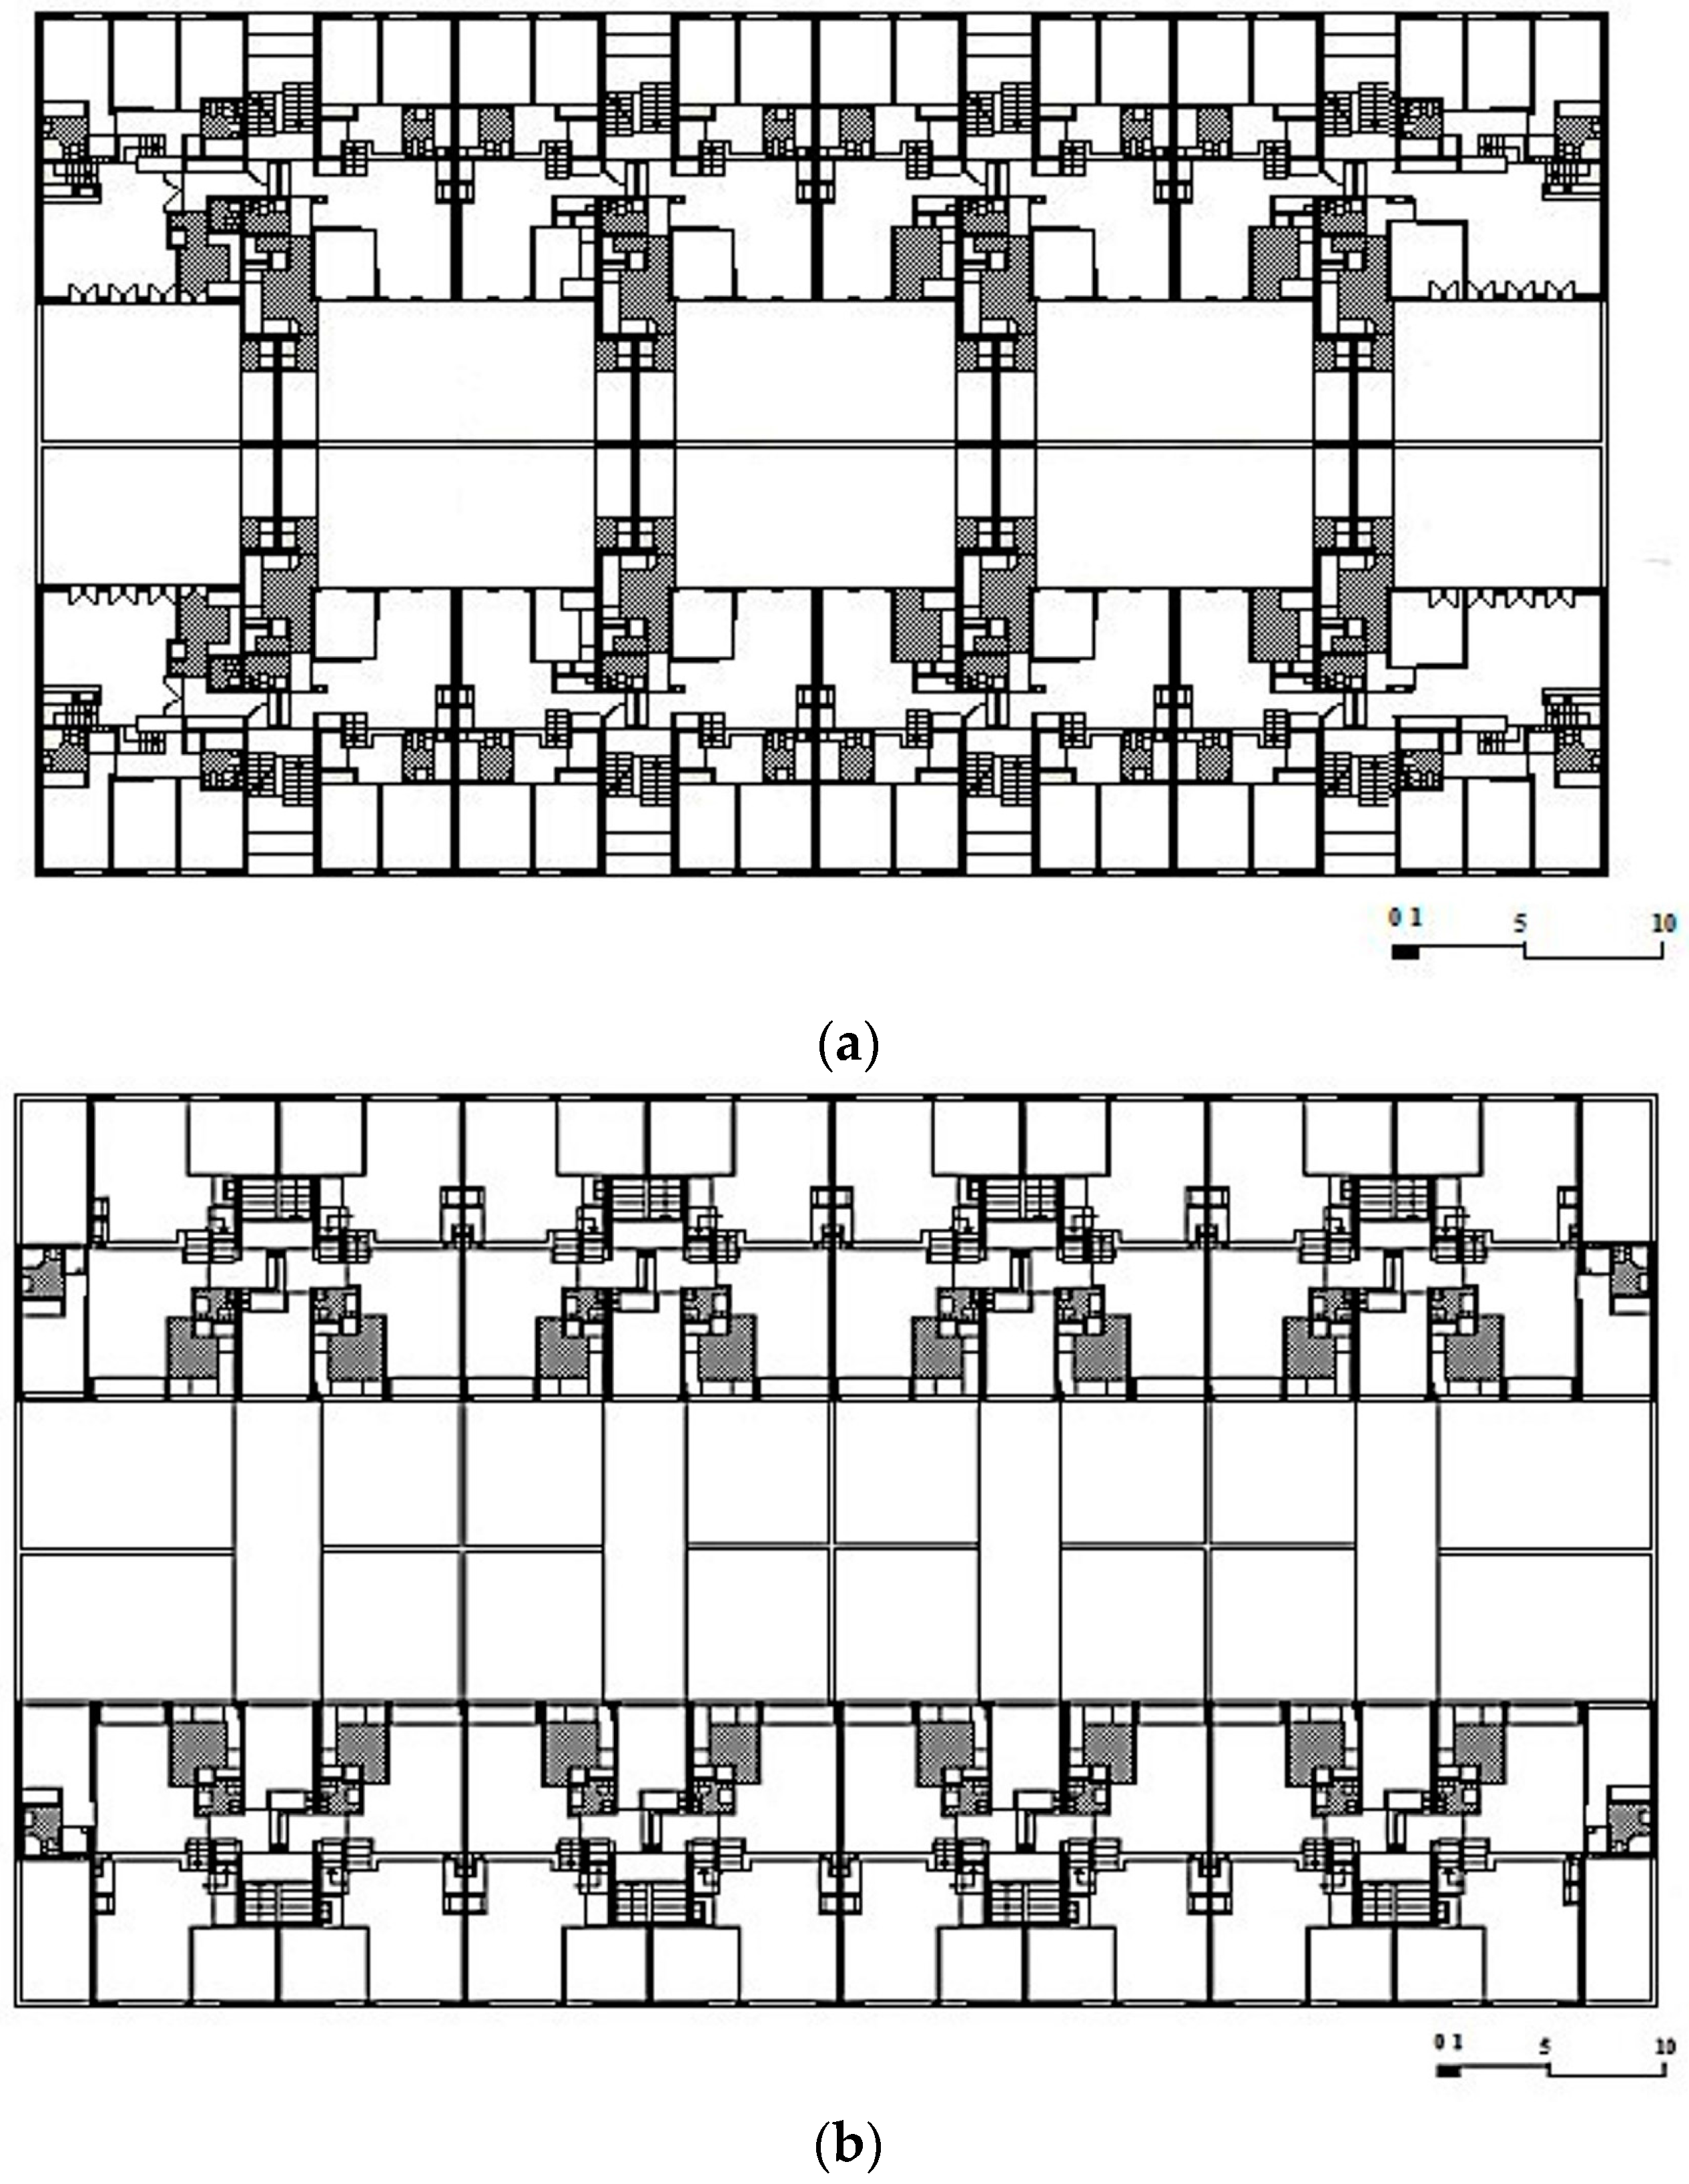
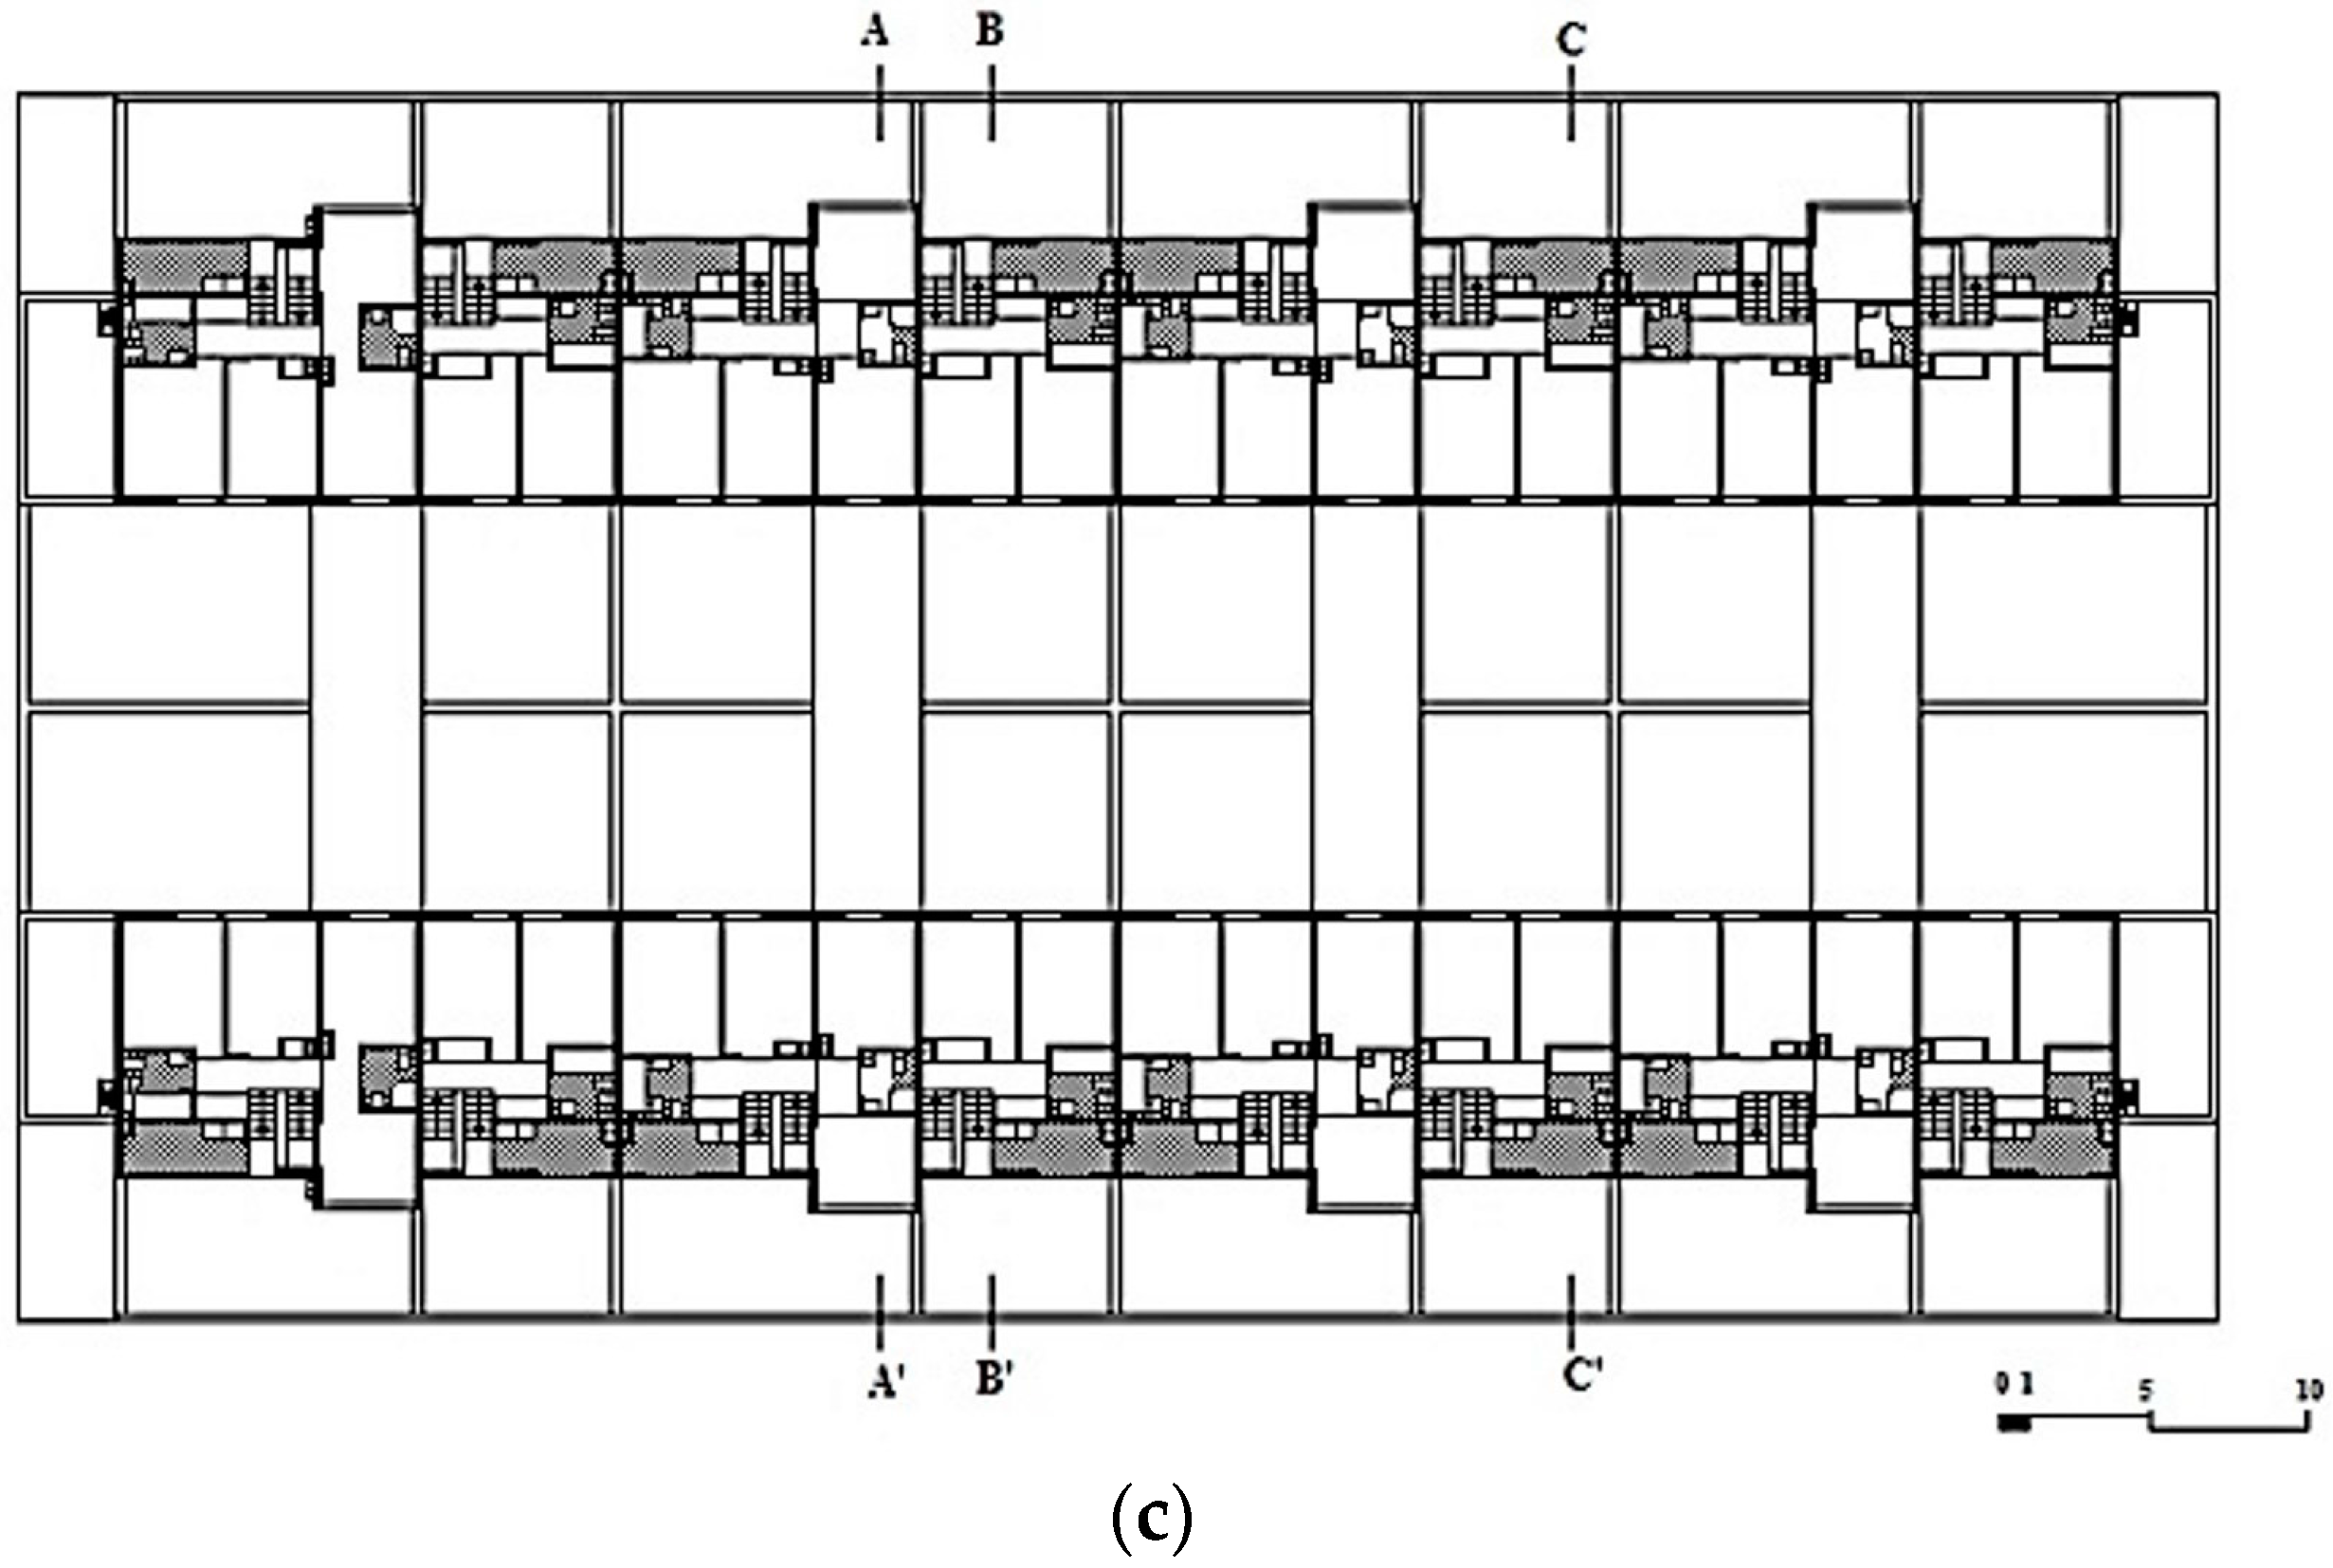
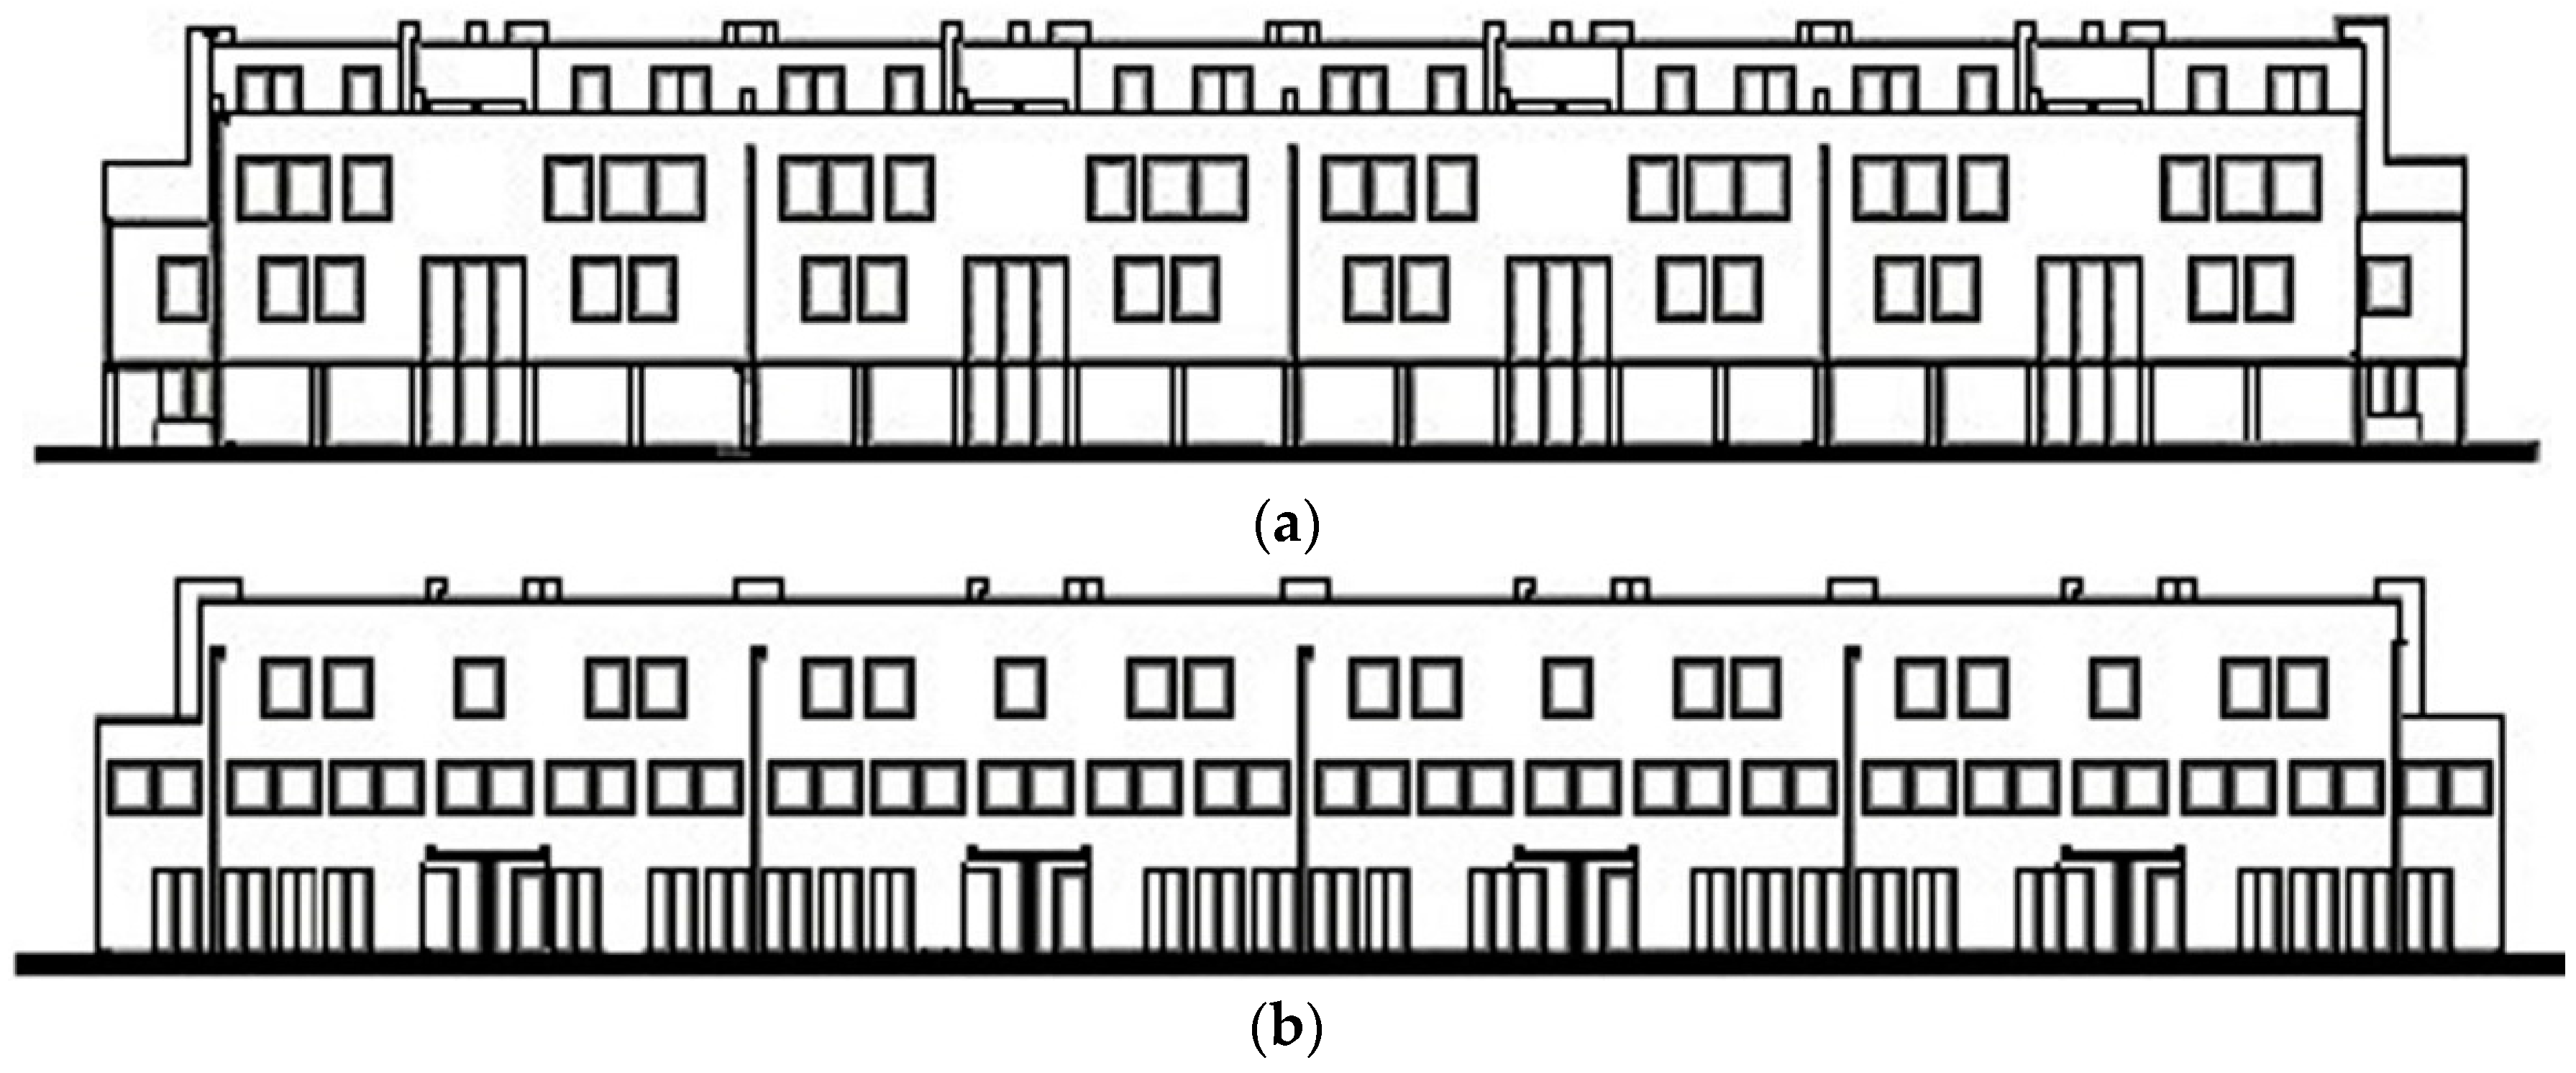
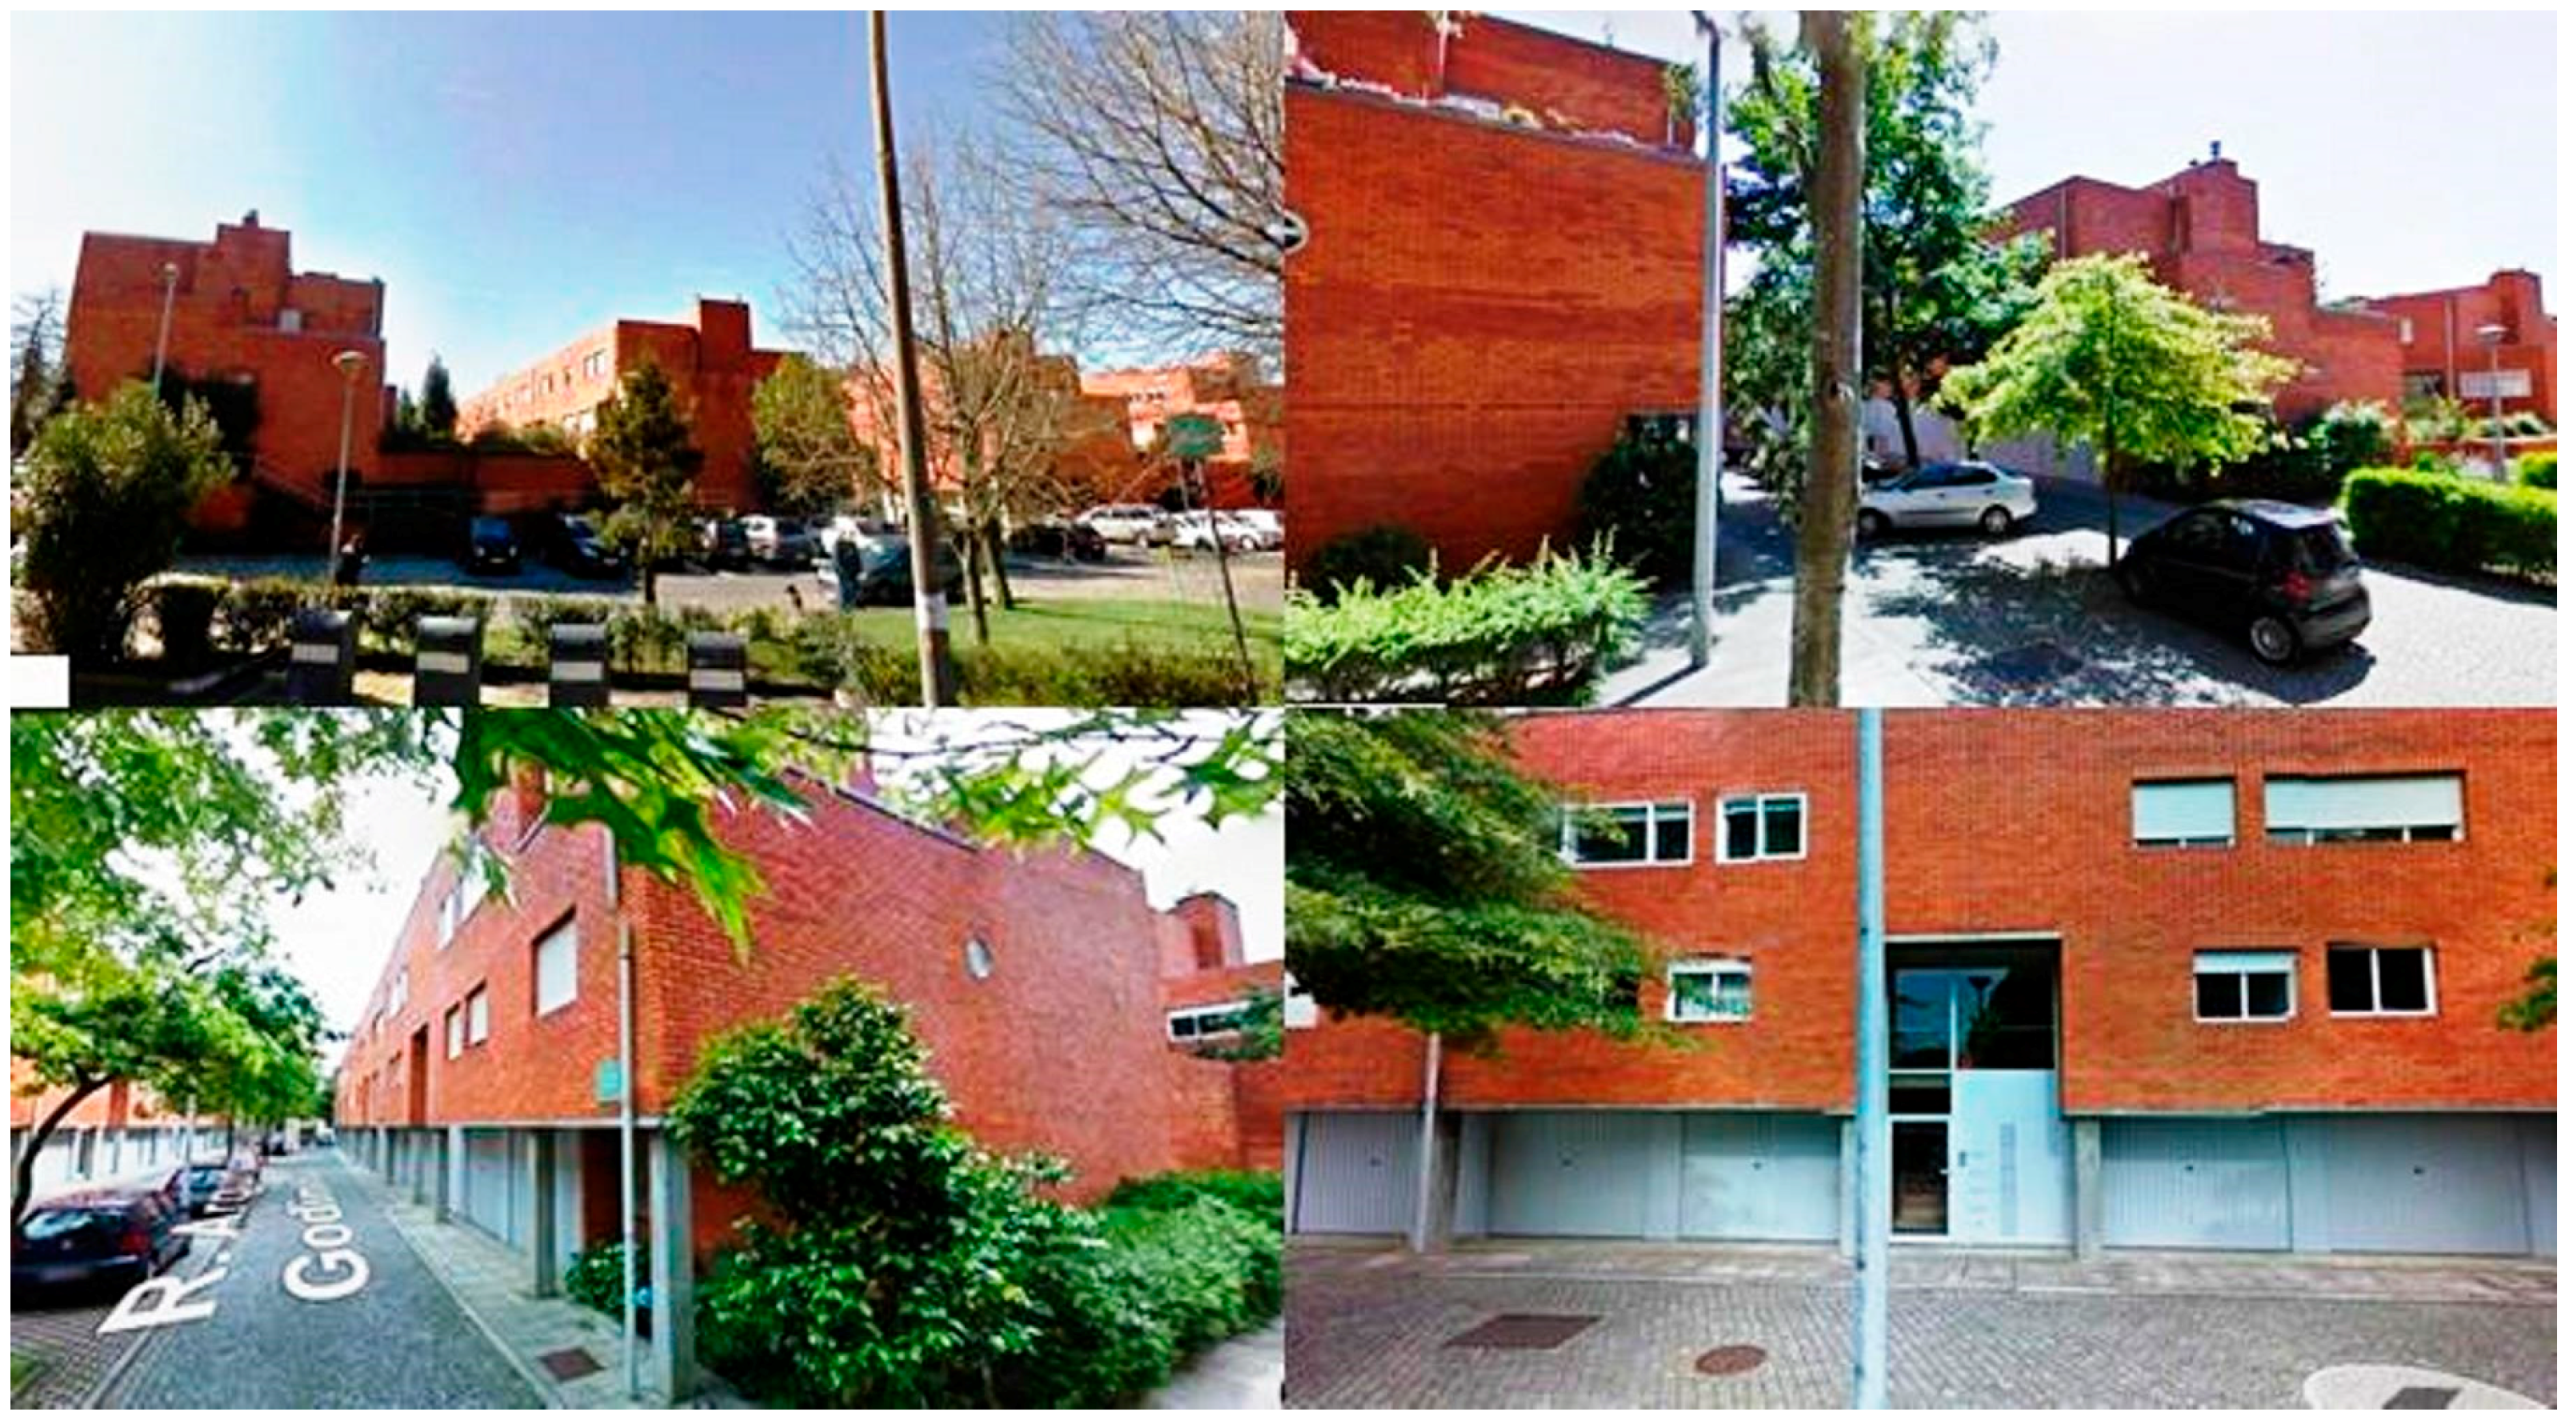
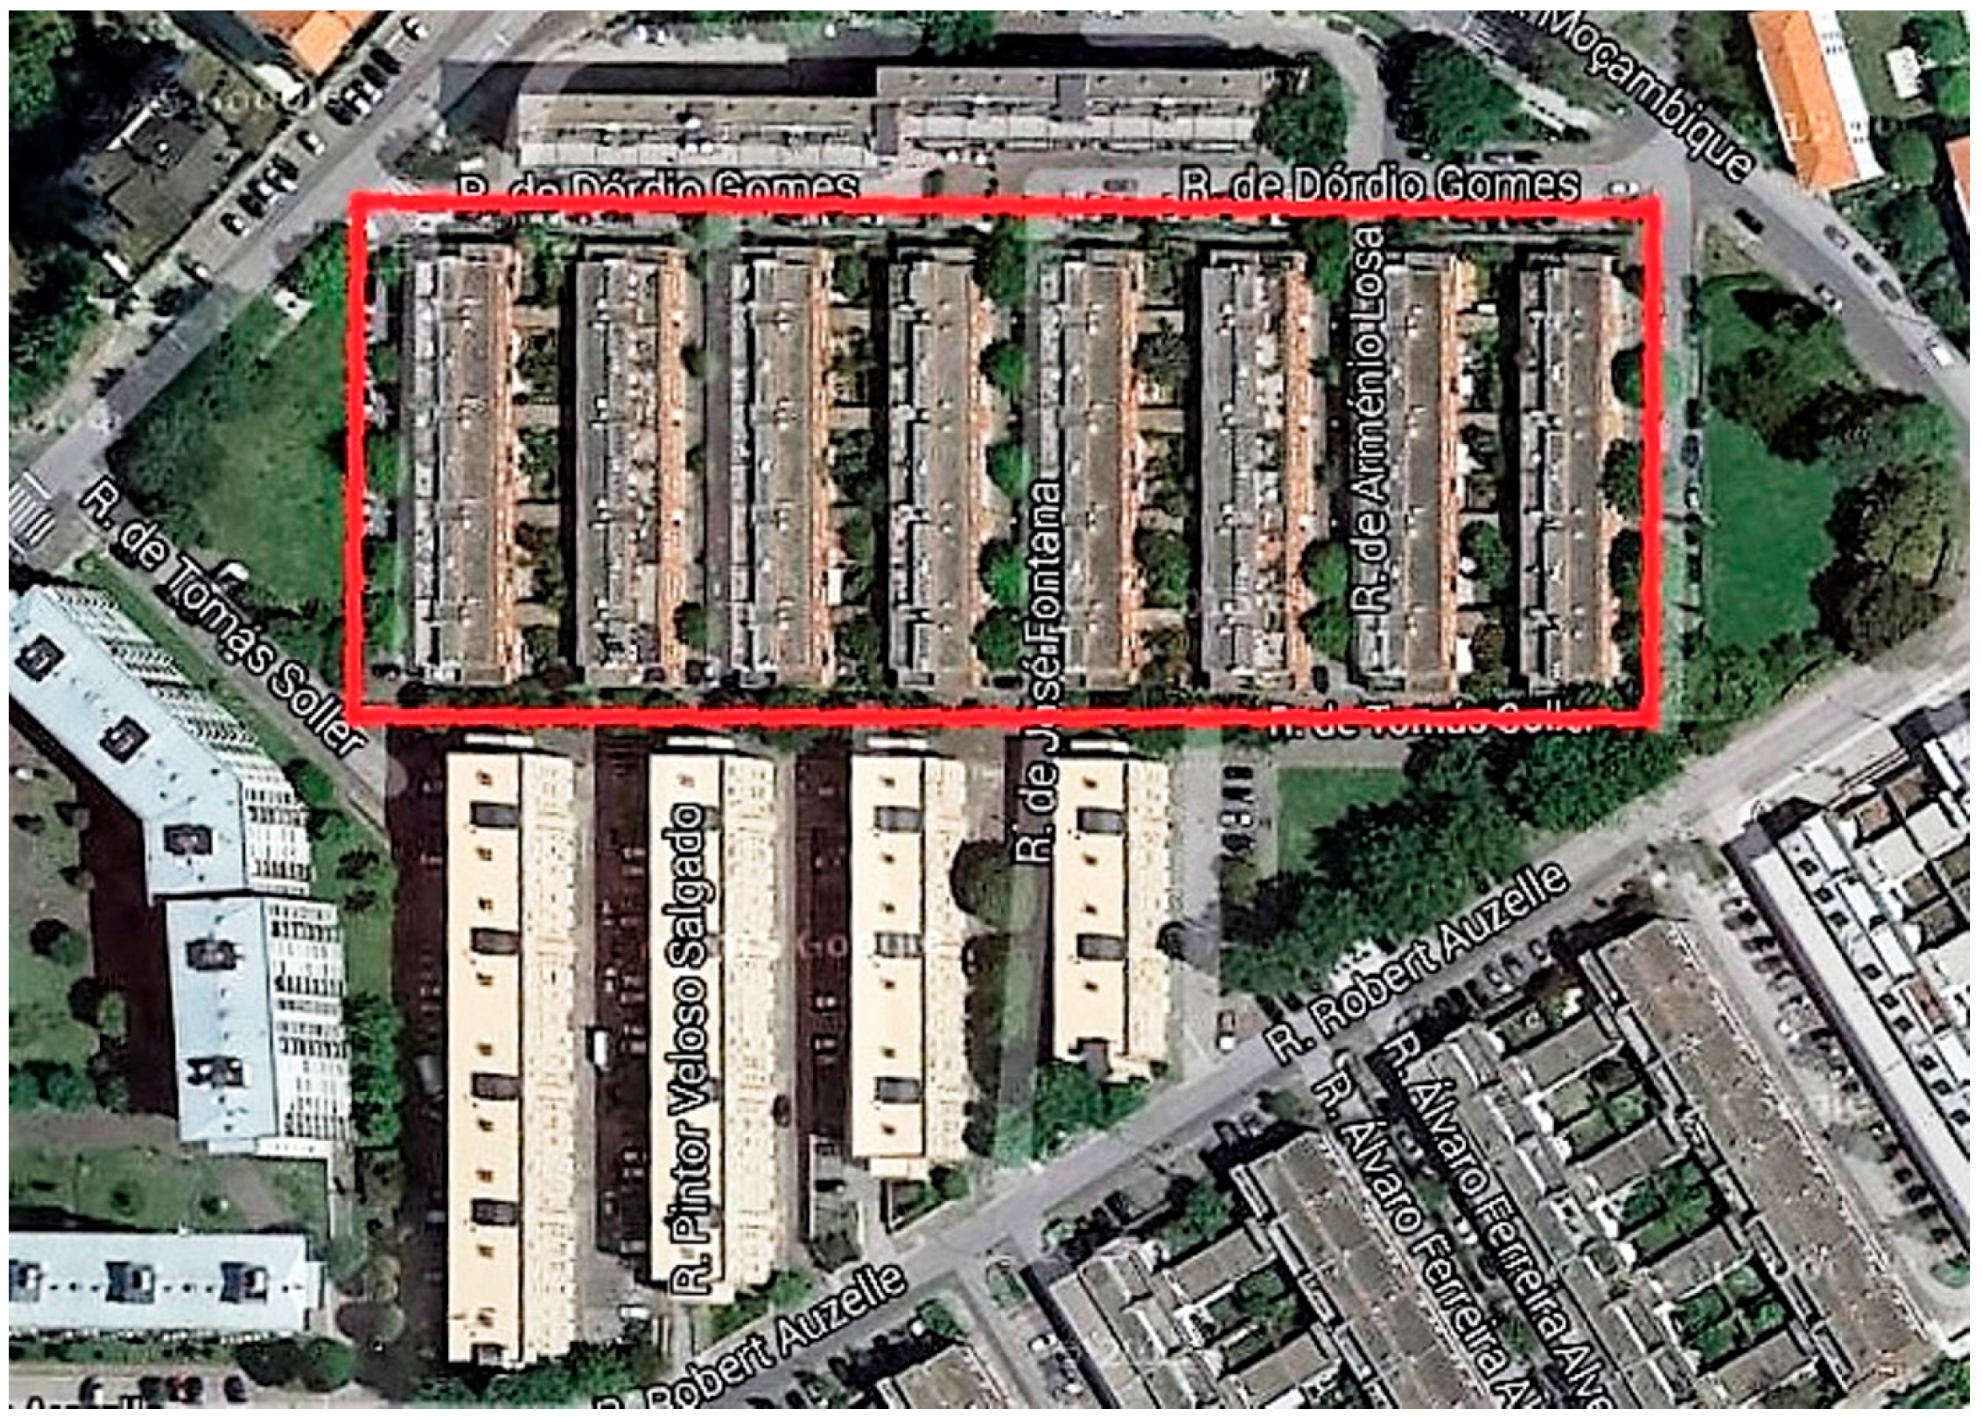
The object of the study was a set of buildings that constitutes the second phase of a wider complex, a neighborhood, promoted by a housing cooperative. The set of buildings under study (bordered by a red line in Figure 10) is a residential complex built in 1991 and designed by architect Manuel Correia Fernandes. It consists of eight buildings (numbered from A1 to A6 and B1 and B2), with 16 apartments each, in a total of 128 apartments distributed by typology, as shown in Table 2.
This residential complex is located in Porto, Portugal. The climate of Porto is classified as Csb Mediterranean. The mean temperature in the coldest month (January) is 9.5 °C and in the warmest month (August), 20.8 °C. The standard number of heating degree-days is 1250 °C d.
In Figure 11, Figure 12 and Figure 13, some architectural drawings and photos of the residential complex are presented.
The envelope of the buildings consists of external double walls (hollow brick + air space + solid brick, with no thermal insulation) and a flat roof (a concrete slab with 0.04 m of thermal insulation). The internal concrete slabs in contact with the garages have no thermal insulation. The windows have PVC frames, a single glass with a thickness of 5 mm and external roller shutters. In Table 3, the U-values of these construction elements are presented.

4.3. Field Survey

A field survey was carried out gathering all possible information about the following:
  • Type of occupation (permanent or temporary);
  • Energy consumption habits;
  • Type of equipment used to meet space heating (Figure 14) and cooling needs (Figure 15);
  • Type of ventilation system (Figure 16); and
  • Type of equipment to prepare Domestic Hot Water (DHW) (Figure 17).
The field survey allowed gathering some energy bills. However, since it was a preliminary study of short duration, and given the small number of replies, it would not be possible to draw reliable conclusions about the actual energy consumption; however, with the help of the energy matrix of Porto, it was possible to define an average user profile.
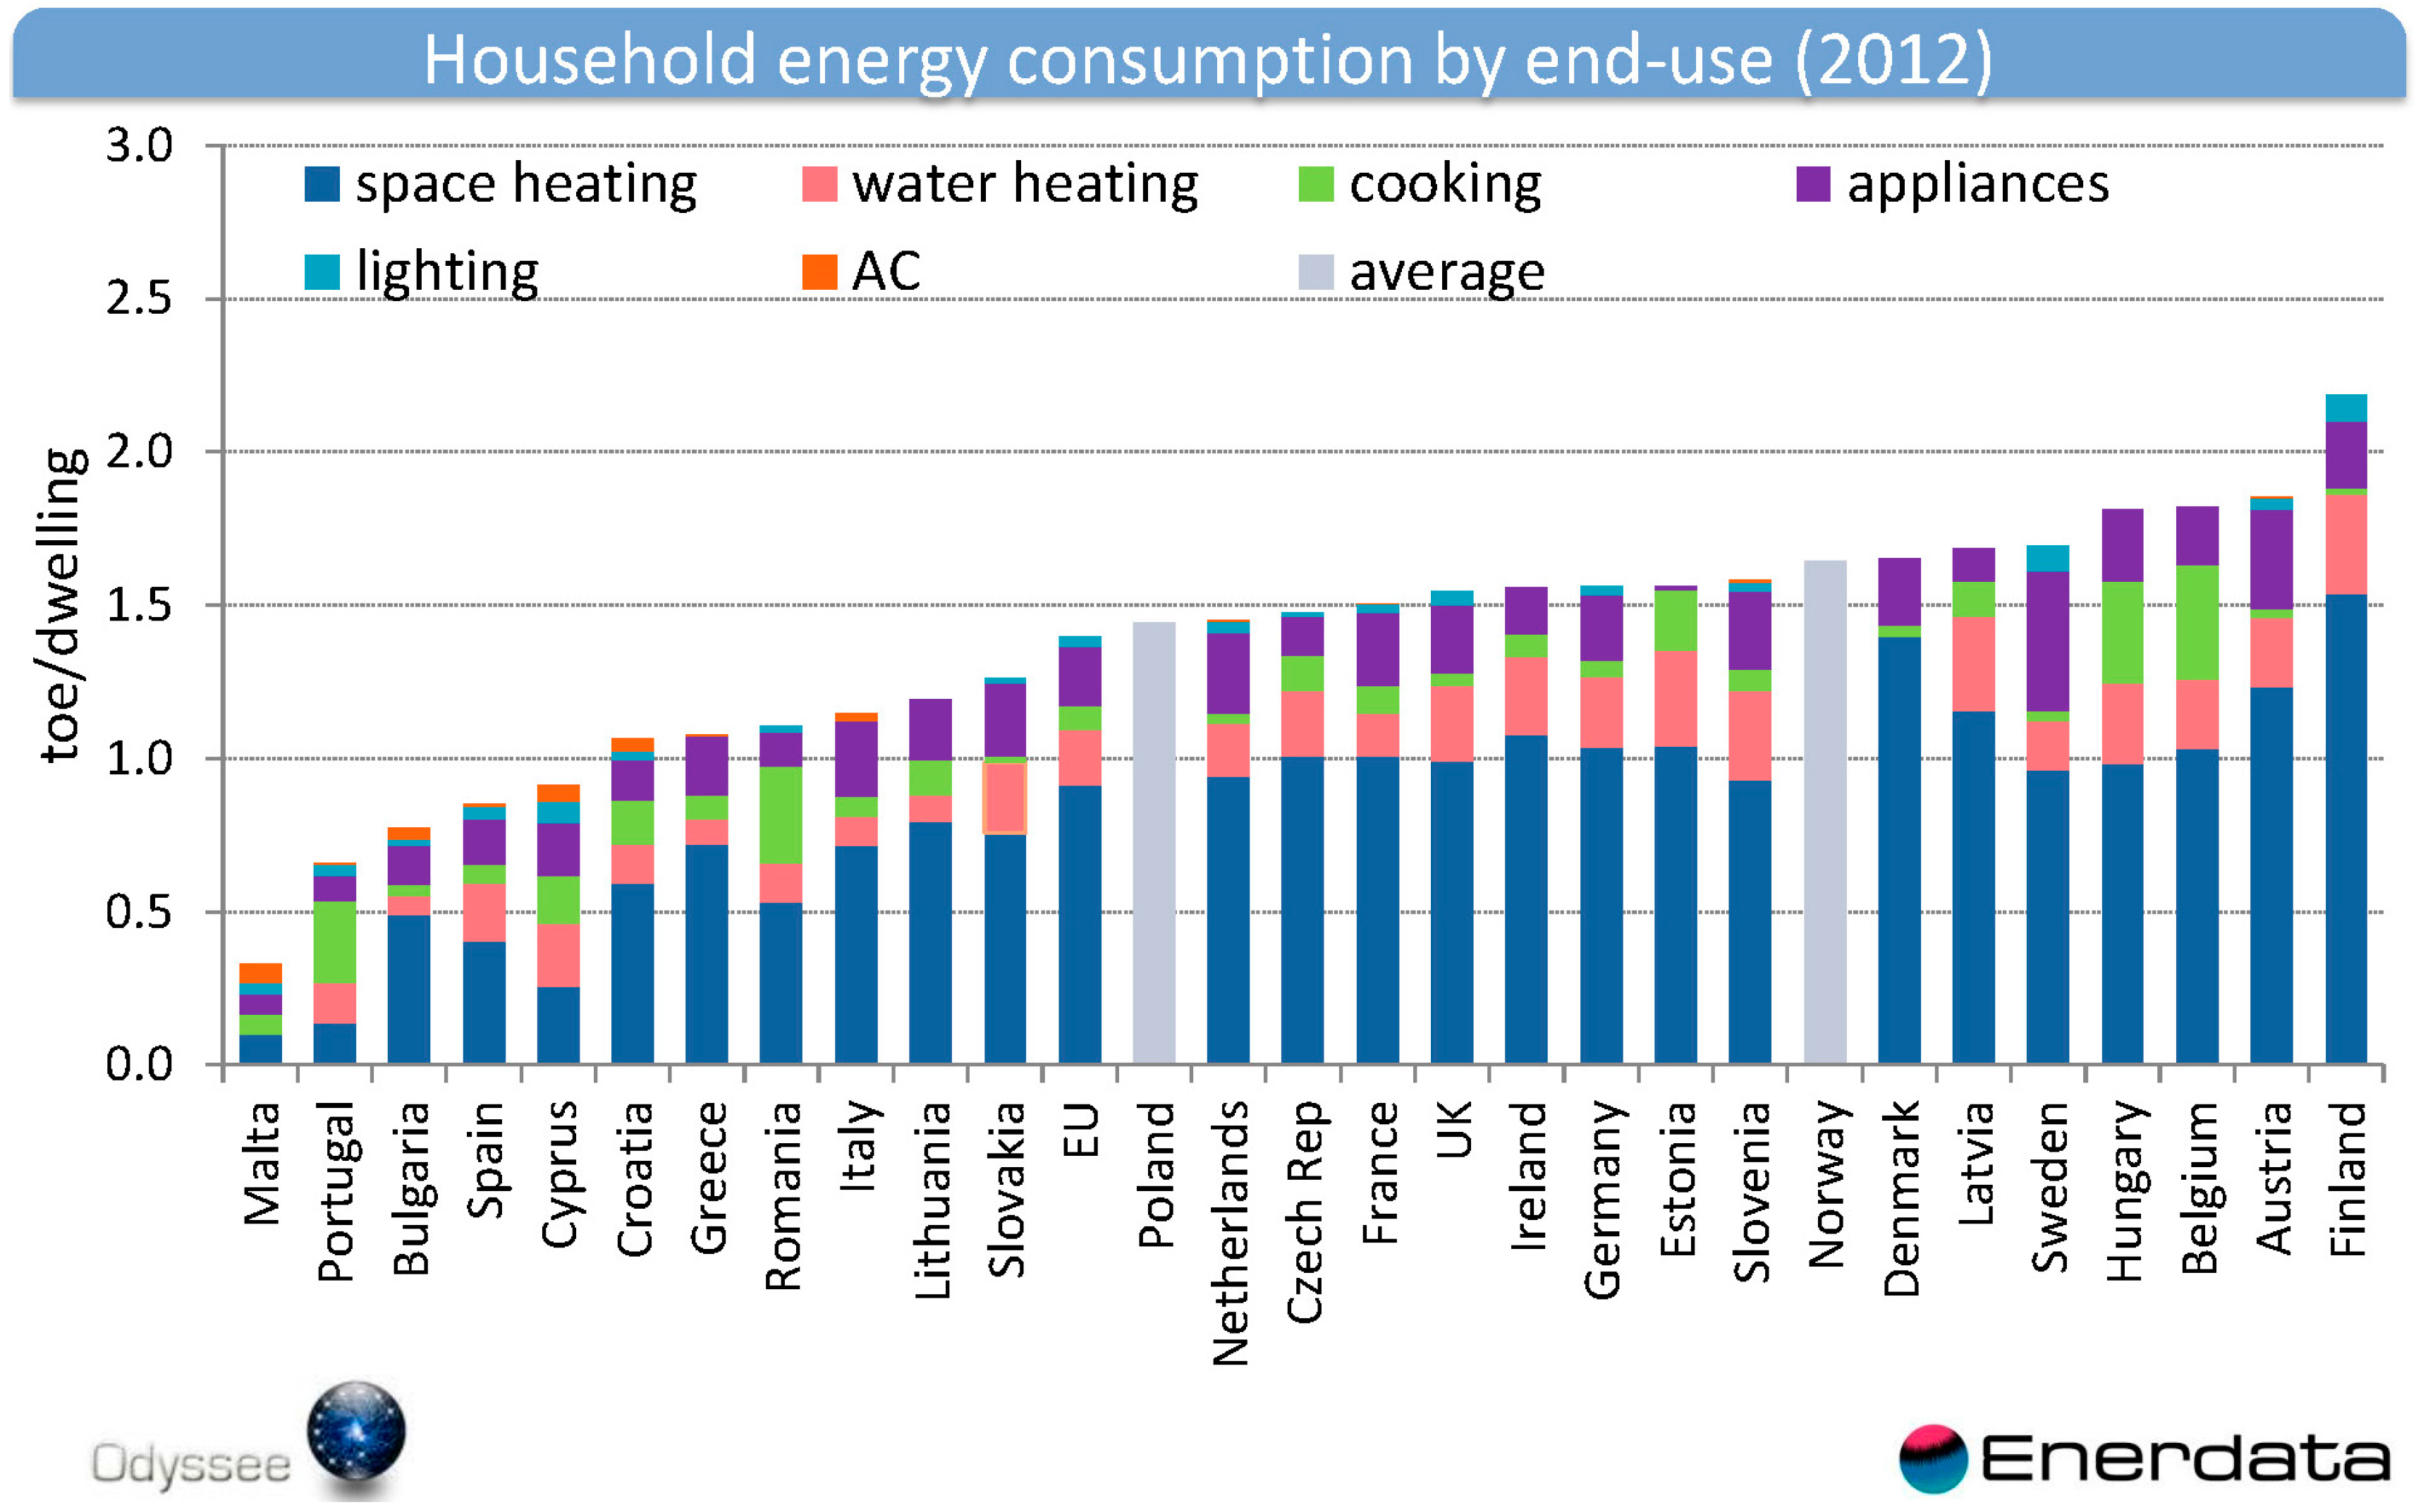
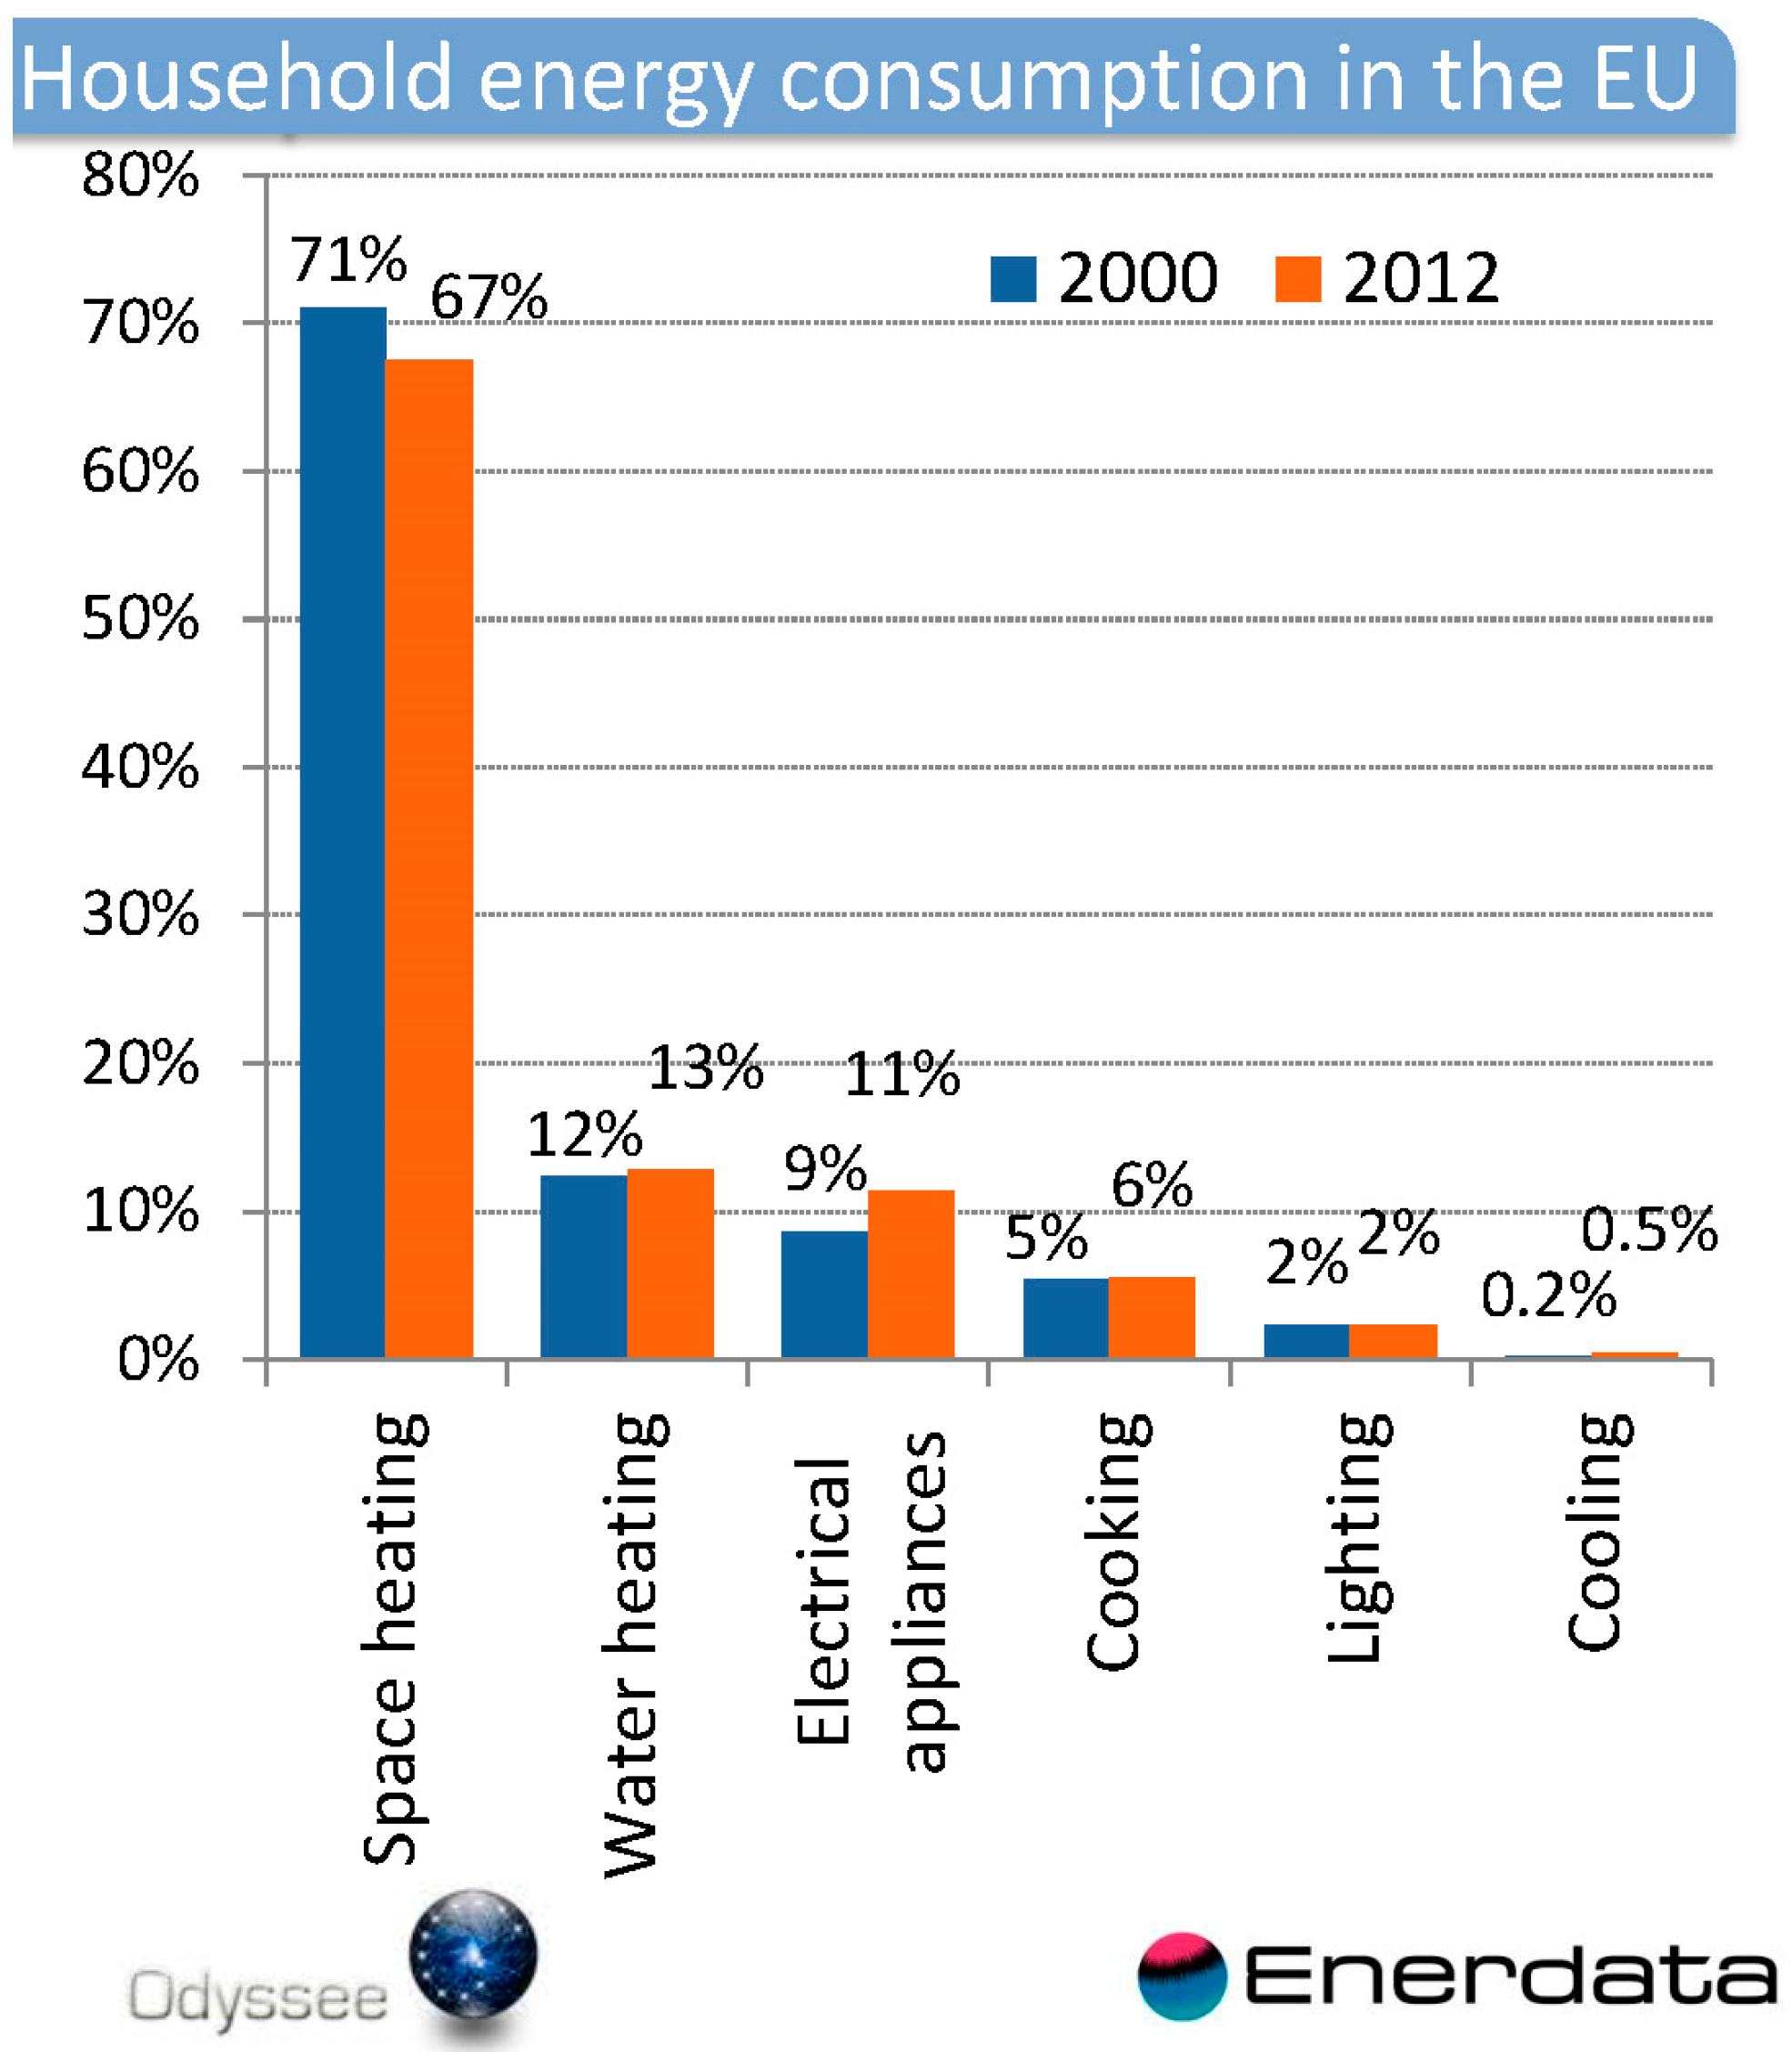
The energy matrix of the metropolitan area of Porto [14] presents, for the residential sector, in terms of final energy consumption, the following estimation for each type of use: space heating (22%); DHW (22%); domestic cold, i.e., fridges and freezers (17%); cooking (16%); appliances (16%); lighting (6%); and space cooling (1%). These are average figures and of course it is possible to find specific examples of different behaviors, depending on the building and especially on its use. However, an analysis of all the information gathered for the studied residential complex made it possible to accept this distribution as an average user profile, suitable for the purpose of the present preliminary study although certainly not enough accurate for a real intervention.

4.4. Estimation of Energy Needs

Buildings energy needs were estimated using the methodology of Portuguese thermal regulation for residential buildings, which is a steady-state methodology that follows European standards and assumes the conditions described below. It takes into account heating energy needs, cooling energy needs, energy for DHW and the contribution of possible local production of renewable energy.
For winter, the regulatory methodology considers a comfort indoor temperature of 18 °C, 24/24 h during the entire heating season. The duration of this season is defined in the regulation, for each location, based on the period for which the number of Degree Days is quantified. For Porto, the standard duration of the heating season is of 6.2 months. This means that the regulation assumes that residential buildings in Porto region are permanently heated at 18 °C during 6.2 months in the year.
For cooling season, a duration of four months and an indoor comfort temperature of 25 °C are considered by the regulation.
For the estimation of energy need for DHW, the hot water consumption is of 40 liters per person per day. The existing buildings characterized above have no installed solar collectors or any other renewable energy source.
Among the 128 dwellings of the residential complex, 16 groups were identified of apartments sharing the same relevant characteristics for the calculation. In Table 4, Table 5 and Table 6, the results for the heating, cooling and DHW conventional energy needs of the buildings are presented.

4.5. Low Energy Renovation Measures

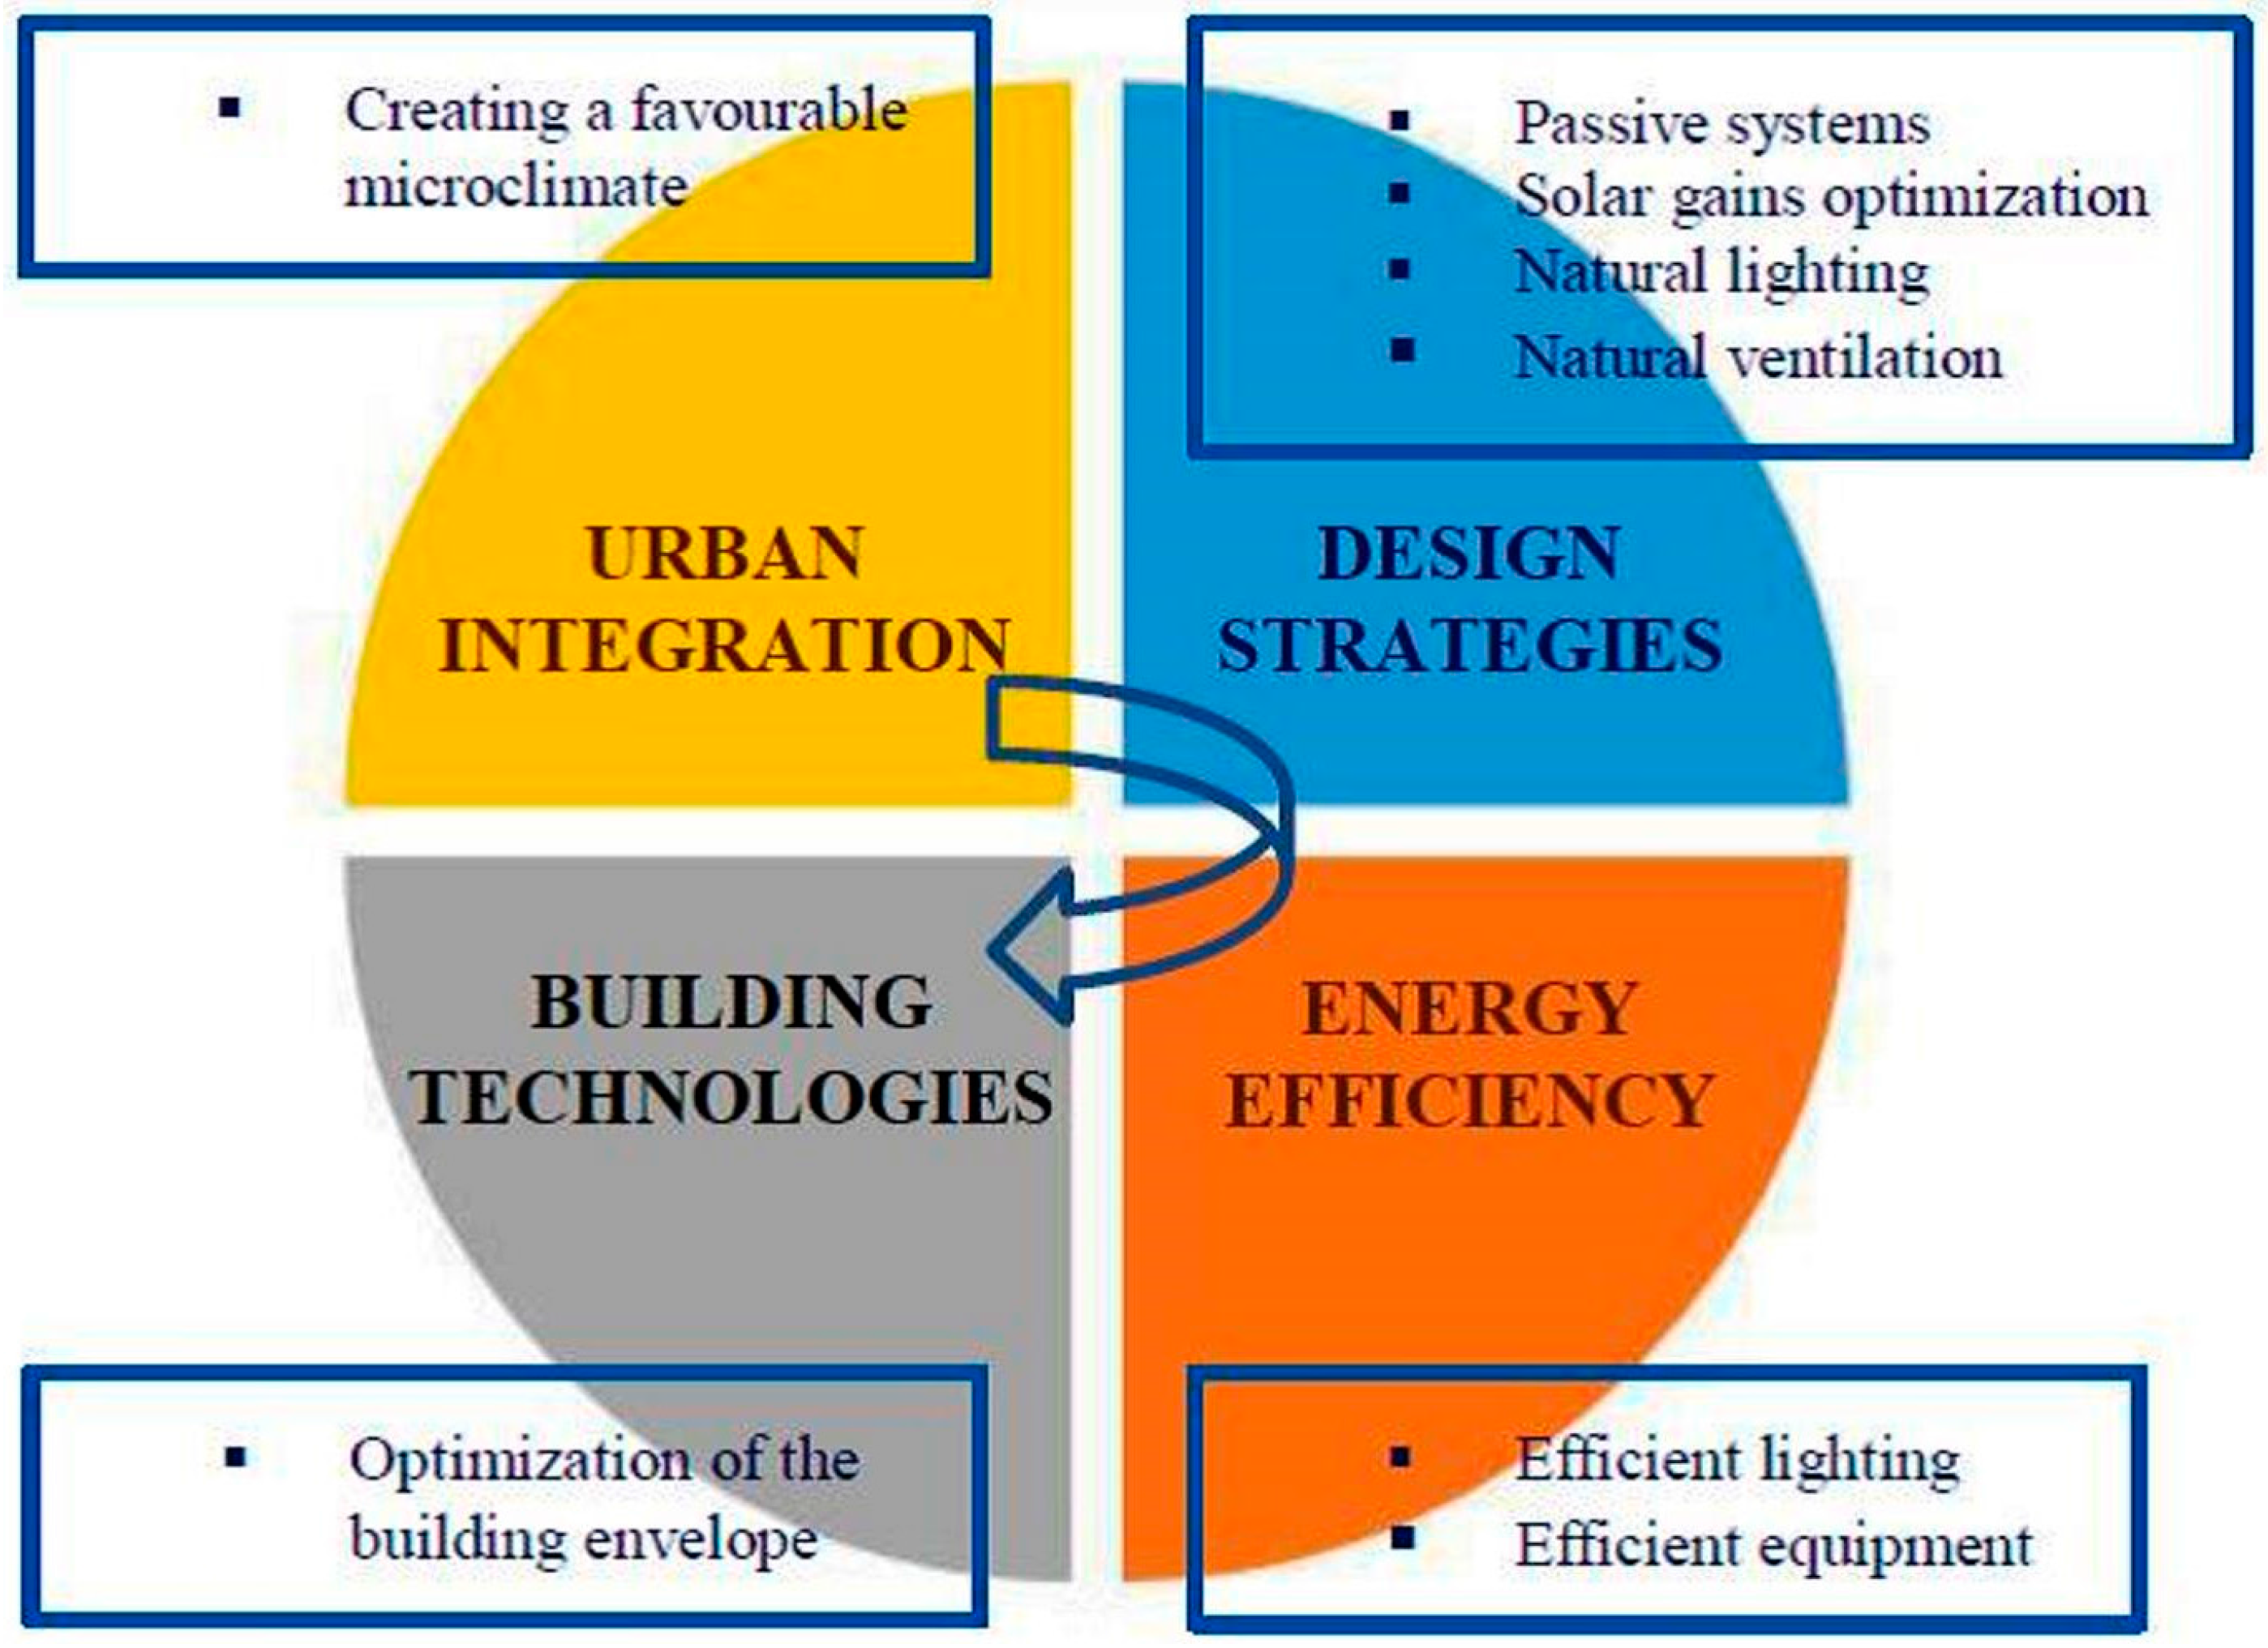
The reduction of a building energy needs can be pursued through an adequate combination of four key points: urban integration (which defines the surrounding microclimate), design strategies (whose options influences the way the building interact with the climate), building technologies (sustainable and economical viable construction solutions must be chosen) and energy efficiency of all systems and equipment used in the building. Figure 18 represents this idea.
For existing buildings, the options are of course more limited when compared to new buildings. There can be several restrictions either physical or economical. One of the aims of the present study was the test of some possible low energy renovation measures.
After analyzing the energy needs and consumption of the studied buildings some measures were defined in order to reduce the energy needs: (a) to add thermal insulation to internal concrete slabs in contact with the garages to which important heat losses were calculated (new U-value of 0.67 W/m2 K); (b) to insulate the external walls (new U-value of 0.47 W/m2 K); (c) replacement of all the incandescent light bulbs for LED lights; and (d) replacement of all the electrical appliances presenting low energy efficiency for Class A appliances.
As seen before, the estimation of the energy needs was done for the conventional heating conditions assumed by the regulation methodology but as several field surveys have showed before and the one undertaken for the residential complex under analysis confirmed, this conventional scenario has little correspondence to the reality of heating energy consumption. In fact, the heating habits are far below this level. For the average user profile in the present case study, the percentage of 22% of total energy consumption for space heating pointed out by the energy matrix of Porto [12] seemed to be a very plausible figure, compared to the gathered energy bills and to the inquiry to the residents. It was also noticed that the value of 22% corresponds roughly to one third of the estimated conventional heating energy needs. In practical terms this can be looked at as describing a situation where the residents only heat their houses for eight hours each day or in a third of the duration of the conventional heating season. Knowing the heating habits of Portuguese families, this seems to be a fairly accurate portrayal of the situation.
In Table 7, a synthesis of the results for the insulation of the concrete slabs over the garages is given.
A simple calculation of the payback period for the first renovation measure (Table 7) gives us a value of 5.3 years for standard conditions and a value of 16.3 years for the adopted average user profile. In Table 8, the results for the thermal insulation of external walls are presented.
From Table 8, the payback period for the second renovation measure would be 7.9 years for standard conditions and 24.2 years for the estimated average user profile.
The use of LED light bulbs saves, when compared to incandescent bulbs, about 80% of energy. Table 9 presents a comparison between the typical 60 W incandescent light bulb and 11 W LED light bulb, with respect to cost, energy consumption and service life.
An estimation was done for replacement of 20 light bulbs in each dwelling, choosing LED bulbs with a price of 4.99 euros, meaning an investment of 99.8 euros per dwelling.
Considering the actual energy consumption of an average dwelling of the neighborhood under analysis, based on the energy bills gathered, the annual energy consumption for lighting was estimated of about 580 kWh. If this consumption were related mainly to the use of incandescent light bulbs, their simple replacement would reduce energy consumption for lighting to 116 kWh per year. Table 10 presents the analysis in terms of costs and savings of the application of this measure, considering an electricity unit cost of 0.17 euro/kWh.
Table 10 shows that the savings would pay the investment in LED light bulbs in just a little more than a year.
In order to study the impact of the replacement of all the less efficient electrical equipment for more efficient ones, based on the analysis of current energy consumption, a value of 3500 kWh per year was considered for electricity consumption of that equipment in each apartment. For a reduction of 30% of that consumption, the acquisition of the following Class A equipment for each apartment was evaluated: a washing machine, a dishwasher, a fridge, a freezer and a stove with oven. The investment would be around €1500 per dwelling. Table 11 presents the significant numbers for this measure.
The payback period for this measure would be at least 8.4 years.
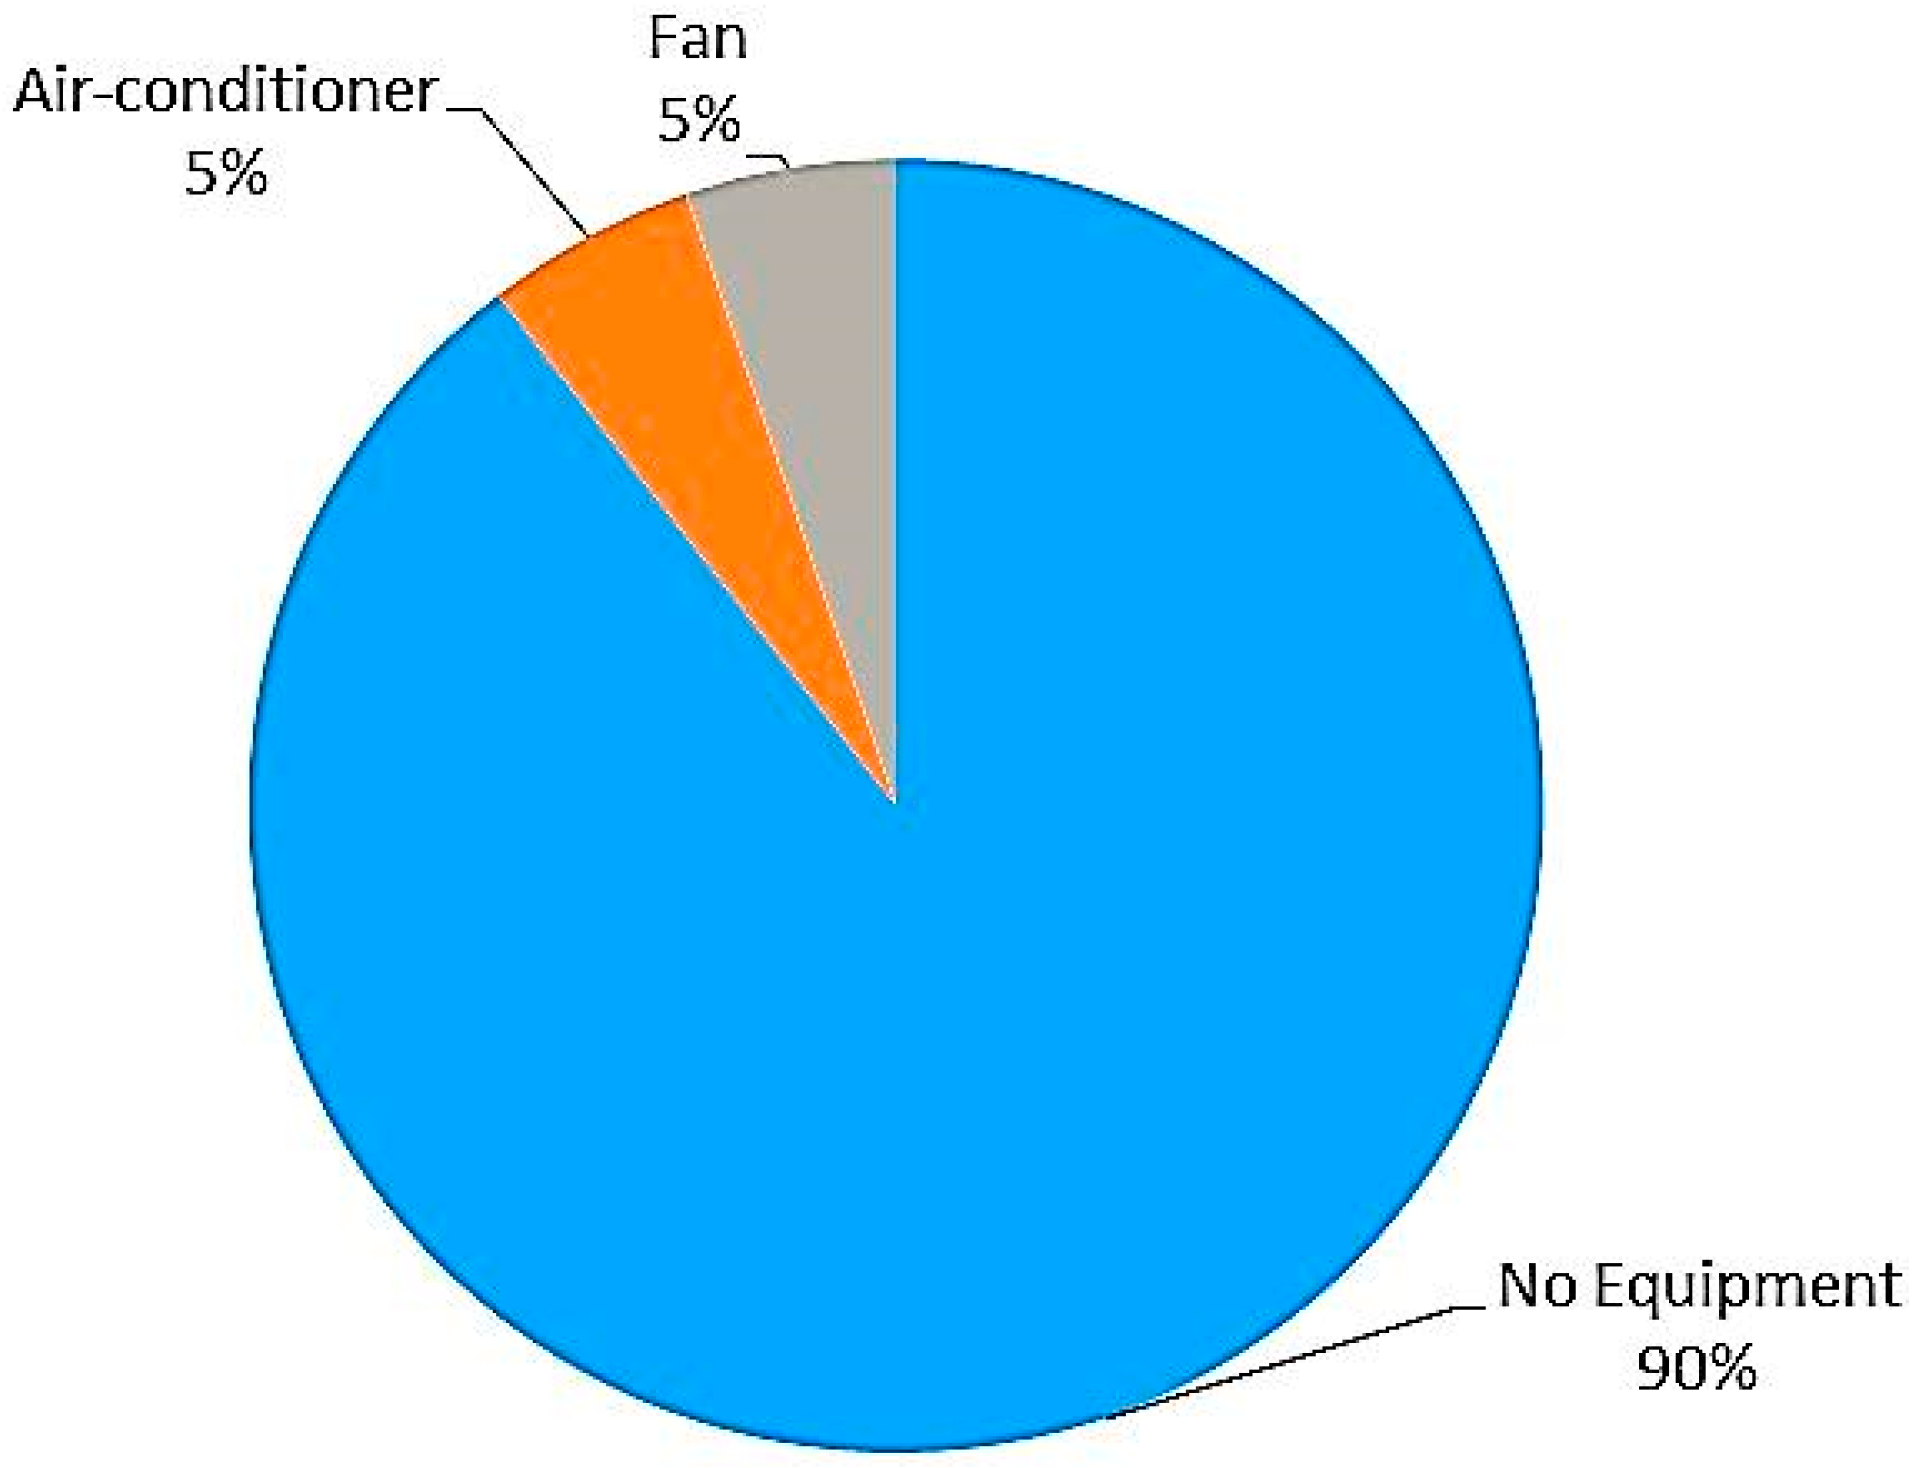
Concerning the equipment for space heating and cooling, no replacements were considered. In the case of cooling, as Figure 15 shows, the great majority of the apartments have no equipment. The few that have fans or air-conditioners use them for very short periods during the year so it is not significant.
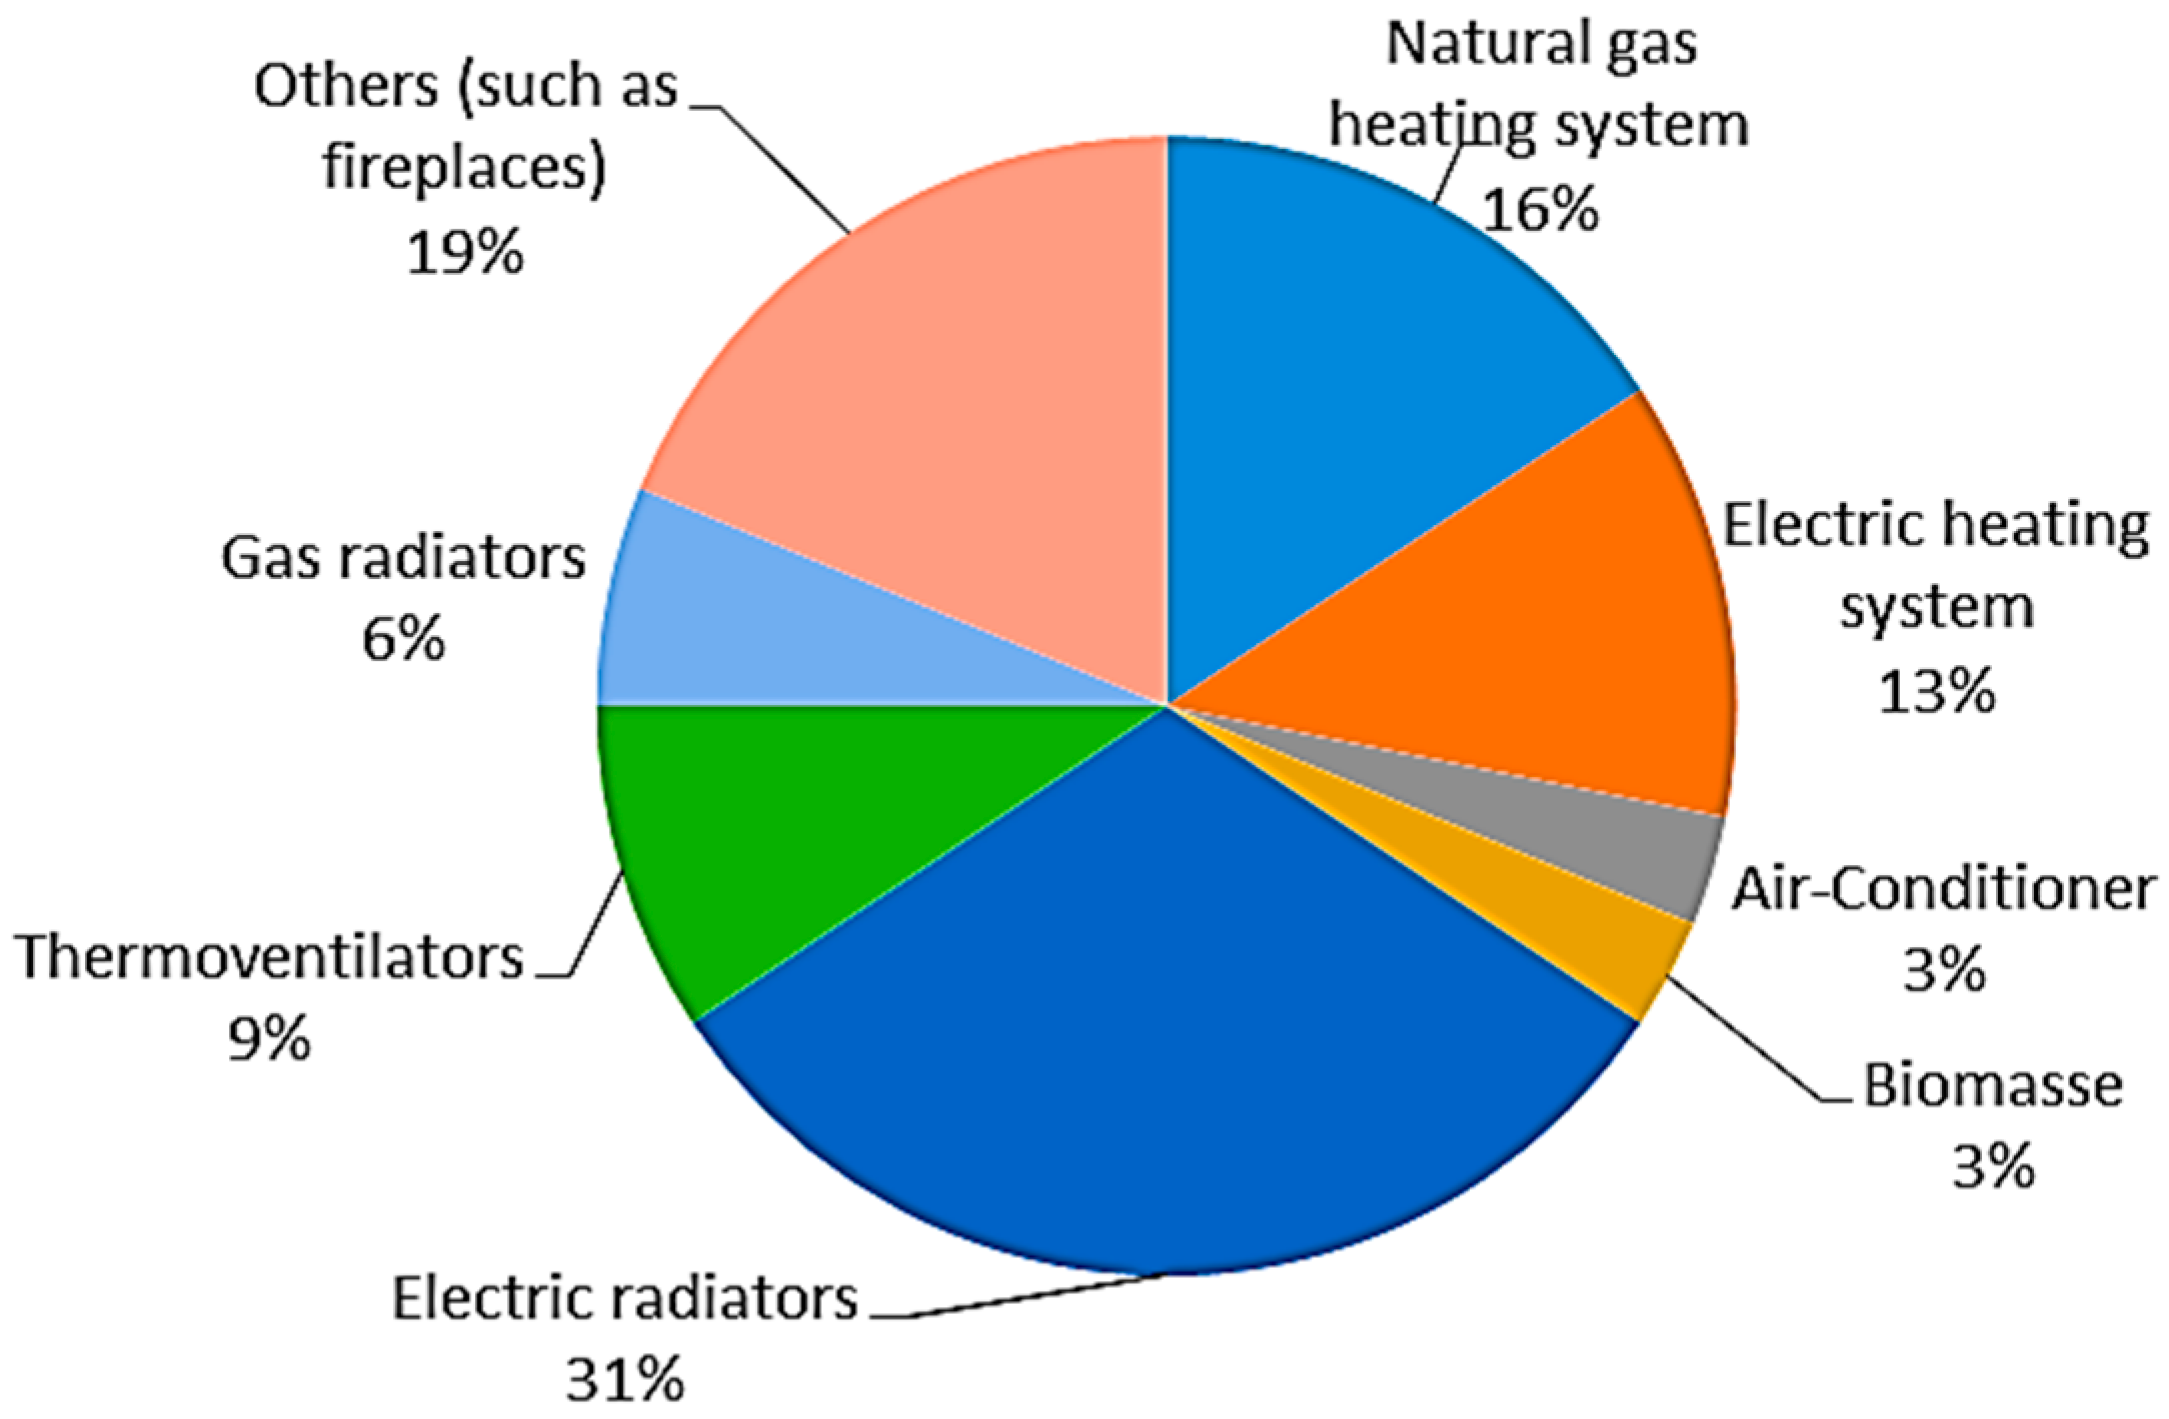
In the case of heating, since very diverse solutions were found in the studied buildings and the way they are used also vary a lot, it would take a deeper analysis to be able to define a realistic approach which would fall out of the scope of the preliminary study undertaken.

4.6. Renewable Energy

Concerning local renewable energy production, the installation of thermal and PV solar systems was evaluated. For this evaluation, SolTerm software application was used which simulates and analyses the performance of solar systems, tuned to the specific climate and technical environment prevalent in Portugal. SolTerm is also the oficial certification software for calculating the energy balance of renewable energy systems, which are mandatory for all new buildings. To meet the energy needs for DHW, presented in Table 6, solar thermal collectors were designed to be installed on the roof with an area of 1.9 m2 each and an optical efficiency of 82%. Very well-insulated water tanks are necessarily components of the global system. Table 12 summarizes the performed calculation.
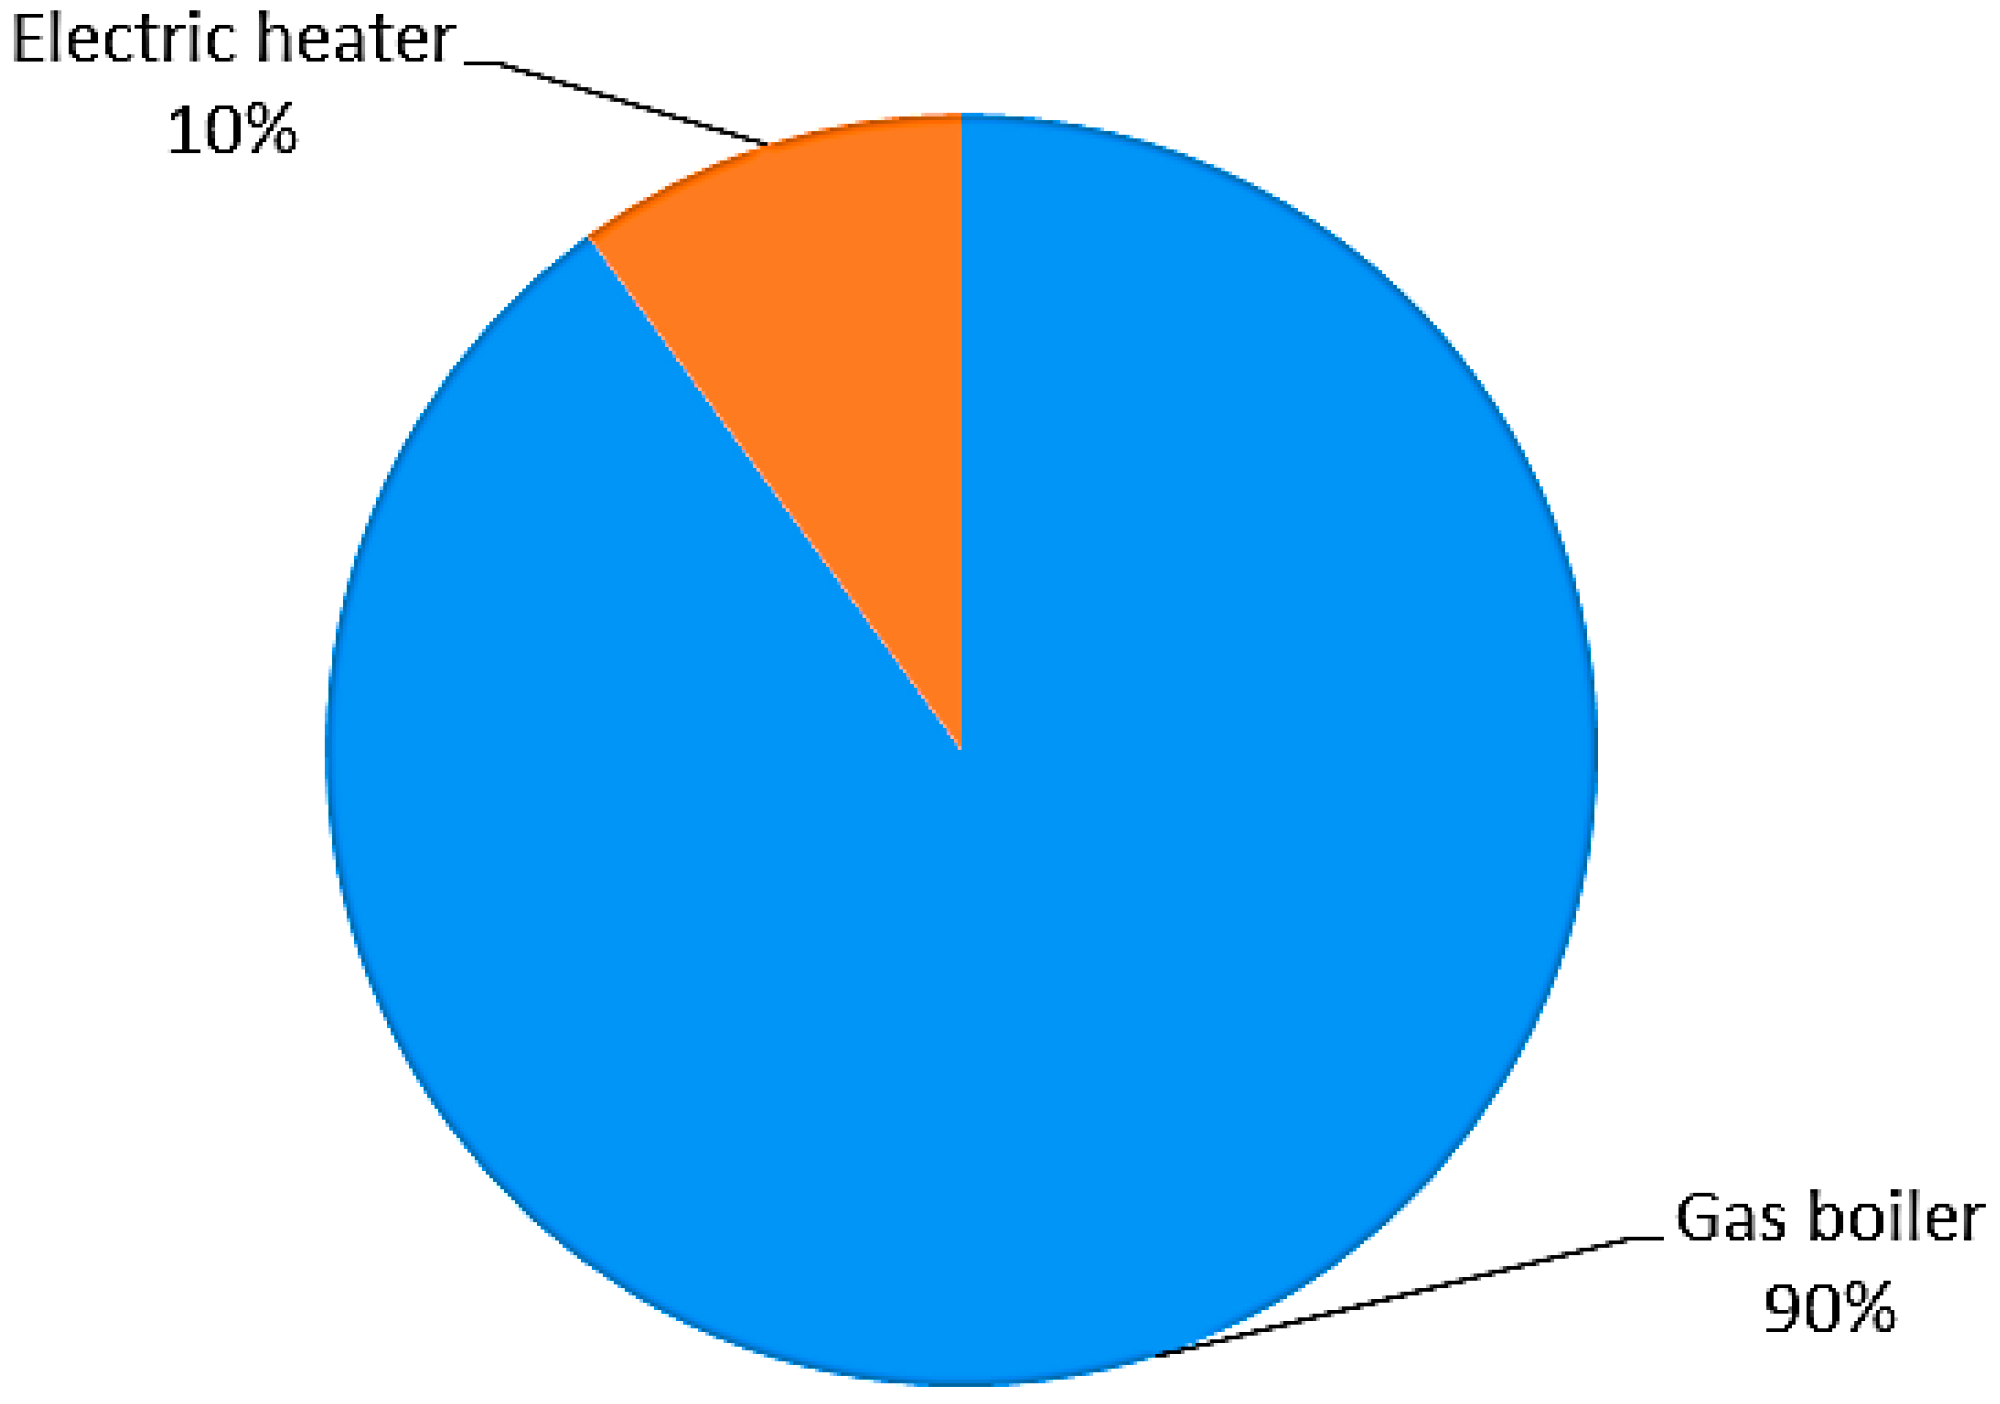
Taking into account that, in the absence of solar systems, energy needs for DHW are covered 90% by gas (0.10 euro/kWh) and 10% by electricity (0.17 euro/kWh), a weighted energy cost of 0.107 euro/kWh was considered. The annual savings were estimated as 34,793 euros for the residential complex which means that the payback period would be around 11.5 years.
After applying the measures to reduce energy needs and sizing solar thermal collectors for the preparation of DHW, if net zero energy standard is to be meet it is possible to try to cover the remaining energy needs with PV solar panels.
To produce the energy necessary to meet the needs of the buildings, photovoltaic panels were designed as follows: groups of PV panels which comprises two modules with an area of 1.142 m2 each, with an open circuit voltage of 24.5 V, intensity of current of 8.1 A for short circuit and a nominal power of 150 W, connected to an inverter with an output of 3300 W and an efficiency of 95% at full load and an output of 330 W and an efficiency of 88% at 10% of the load. Table 13 presents the main information related with the foreseen installation of a PV solar system.
The annual savings with the installation of the PV system, in the theoretical hypothesis of an integral use of the produced energy, would be of 62,398 euros which means that PV system would have a payback period around 7.6 years. However, this figure can be deceiving since it would only be possible if either some storage capacity was implemented or an efficient energy exchange with the grid was in place, preferably through a smart grid. Furthermore, the preliminary calculation presented in this paper pointed to an area of thermal and PV solar systems bigger than the available area in the buildings roofs. Adaptations of the façades or the use of public common spaces would be necessary. This would imply an even more significant investment.

4.7. Smart Energy Management

As mentioned above, for the presented case study, storage capacity and its costs were not evaluated nor the sale of electricity to the grid nor the costs of the implementation of a smart energy management system. This means that no reliable calculation of the global payback period is possible. However, further research will address these important topics.
In terms of energy management a neighborhood is a geographically localized community within a larger city, town or suburb sharing a common service infrastructure, a group of households and public services served by a same electricity local Distribution System Operator (local DSO). In this context, it is important to bring together the different prosumers (consumers that also produce energy) and the DSO in order to maximize energy efficiency.
In the context of the EU FP-7 NOBEL project [15] the relevant components for a neighborhood-oriented system were identified, from intelligent appliances to a smart distribution at a local level. Furthermore implementing a smart grid must include the following typical components [16]:
  • Intelligent appliances capable of deciding when to consume power based on preset customer preferences;
  • Smart power meters empowering bidirectional communication between consumers and power providers for better data collection, maintenance, outage detection etc.;
  • Smart substations that include monitoring and control of critical and non-critical operational data;
  • Smart distribution that depicts self-features such as self-healing, self-balancing and self-optimization;
  • Smart generation capable of “learning” the unique behavior of power generation resources to optimize energy production; and
  • Universal access to affordable, low-carbon electrical power generation (e.g., wind turbines, concentrating solar power systems, and photovoltaic panels) and storage (e.g., in batteries, flywheels or super-capacitors).

5. Discussion

Table 14 presents a synthesis of the results presented in previous paragraphs.
From Table 7, Table 8 and Table 14, it can be observed that in the actual conditions of use of the buildings, the increase of thermal insulation has just a slight influence on annual savings. Payback periods ranging from 15 to 25 years are in fact too long.
Portuguese regulation, following the European Directive, demands the compliance with certain requirements in buildings subjected to renovation. The requirement to be applied to walls, floors and roofs is a maximum allowable U-value. Those values have been gradually reduced in accordance to European trend. From January 2016 on, the maximum U-value for external walls ranges from 0.35 to 0.50 W/m2 K, depending on the climatic zone and the maximum U-value for floors and roofs ranges from 0.30 to 0.40 W/m2 K.
As seen in this case study, the actual savings obtained with the increase of thermal insulation are usually not very significant due to the climate and to low space heating habits. This means that this extra investment may expect a quite long payback period. In fact, a slight energy consumption reduction is not an argument convincing enough for the owners. Furthermore, if an extra insulation can bring some advantages in terms of thermal comfort in winter, this is not assured in summer for Mediterranean climate. A computer simulation study carried out on the influence of increasing thermal insulation on summer thermal comfort [17] showed there is a turning point where, depending on thermal inertia, ventilation and heat gains, an increase in thermal insulation leads to an increase of the number of hours of discomfort in summer. In the left side of Figure 19, an example of the variation of the percentage of hours of discomfort in summer, for a location in Portugal, in function of the level of insulation of the envelope is given for different values of the shading factor. If solar gains are high (non-existing or non-efficient shading), it can be observed that a high level of insulation may be harmful. An efficient night ventilation can reduce that effect as shown in the right side of Figure 19.

6. Conclusions

In countries where space heating energy consumption represents just a small percentage of total energy consumption in buildings, the argument in favor of a higher level of thermal insulation should be an increase in comfort and not energy consumption reduction or financial savings. In fact, those reduction and savings are not very significant and lead to long payback periods. Besides, concerning summer comfort, particular care must be taken. Beyond a certain level of insulation, the intervention is useless or even harmful. Regulatory requirements should take these facts into account in order not to be an obstacle to renovation but an incentive.
Concerning energy efficiency of domestic appliances and equipment, the replacement of less efficient ones may represent a considerable investment for a household so it is important that this replacement lead to significant and demonstrable savings. Efficiency in lighting is easily improved by replacing old light bulbs by LED bulbs, which represent a low investment with a short payback period.
The knowledge of the actual energy consumption has proved to be crucial, especially in countries with a favorable climate like in European southern countries. In these conditions life style determines in a great measure the energy consumption and so this can vary a lot due to social and economic factors. In order to be efficient, stakeholders should be aware of these facts.
The studied residential complex can be considered as representative of a great part of Portuguese building stock, especially of the one built before any thermal regulation came into force, which means before 1991. This part of the building stock needs refurbishment and moving the focus of those works from adding excessive thermal insulation to a reasonable integrated approach, moving from looking at each building individually to looking at a set of buildings would allow a higher flexibility of solutions. As seen in the case study, the implementation of renewable energy local production, in the present case solar systems, can only meet the full use of its potential in an integrated approach, comprising a number of buildings and shared infrastructures, places and a common energy management system. Moving from a building to a building complex scale may be an interesting challenge for policy makers to look closer in the near future.

Acknowledgments

The authors are thankful to Marco Aires for allowing the use of data gathered in his Master Thesis [13], which studied the residential complex used as a case study in this paper.

Author Contributions

Authors contributed equally to the article.

Conflicts of Interest

The authors declare no conflict of interest.

References

  1. The European Parliament and the Council of the European Union. DIRECTIVE 2010/31/EU on the Energy Performance of Buildings (recast). 2010. Available online: http://eur-lex.europa.eu/LexUriServ/LexUriServ.do?uri=OJ:L:2010:153:0013:0035:EN:PDF (accessed on 26 September 2016).
  2. Garde, F.; Donn, M. Solution Sets and Net Zero Energy Buildings—A Review of 30 Net ZEBs Case Studies Worldwide. 2014. Available online: https://www.iea-shc.org/data/sites/1/publications/T40A52-DC-TR1-30-Net-ZEBs.pdf (accessed on 26 September 2016).
  3. Gonçalves, H.; Aelenei, L.; Rodrigues, C. SOLAR XXI: A Portuguese Office Building towards Net Zero-Energy Building. REHVA J. 2012, 49, 34–40. [Google Scholar]
  4. Pless, S.; Torcellini, P. Net-Zero Energy Buildings: A Classification System Based on Renewable Energy Supply Options. 2010. Available online: http://www.nrel.gov/docs/fy10osti/44586.pdf (accessed on 26 September 2016). [Google Scholar]
  5. Carlisle, N.; Van Geet, O.; Pless, S. Definition of a “Zero Net Energy” Community. 2009. Available online: http://www.nrel.gov/docs/fy10osti/46065.pdf (accessed on 26 September 2016). [Google Scholar]
  6. Hachem-Vermette, C.; Cubi, E.; Bergerson, J. Energy performance of a solar mixed-use community. Sustain. Cities Soc. 2015, in press. [Google Scholar] [CrossRef]
  7. Parking Covered with PV Solar Panels. Available online: http://s.glbimg.com/jo/g1/f/original/2011/05/09/solar-powered-zoo_fran.jpg (accessed on 26 September 2016).
  8. Climate Data. Climate Europe. Available online: http://www.climatedata.eu/continent.php?cid=150&lang=en (accessed on 28 January 2016).
  9. Tsikaloudaki, K.; Laskos, K.; Bikas, D. On the Establishment of Climatic Zones in Europe with Regard to the Energy Performance of Buildings. Energies 2012, 5, 32–44. [Google Scholar] [CrossRef]
  10. Boermans, T.; Petersdorff, C. U-Values for Better Energy Performance of Buildings. 2007. Available online: http://www.eurima.org/reports/u-values-for-better-energy-performance-of-buildings (accessed on 15 November 2015).
  11. Solargis. Global Horizontal Irradiation in Europe. Available online: http://solargis.com/assets/graphic/free-map/GHI/Solargis-Europe-GHI-solar-resource-map-en.png (accessed on 26 September 2016).
  12. Gynther, L.; Lapillone, B.; Pollier, K. Energy Efficiency Trends and Policies in the Household and Tertiary Sectors. An Analysis Based on the ODYSSEE and MURE Databases. 2015. Available online: http://www.odyssee-mure.eu/publications/br/energy-efficiency-trends-policies-buildings.pdf (accessed on 26 September 2016).
  13. Aires, M. Viabilidade da Aplicação do Conceito NZEB à Reabilitação de Conjuntos Habitacionais em Países do Sul da Europa (Viability of the Application of NZEB Concept to the Renovation of Residential Complexes in Southern European Countries). Master’s Thesis, University of Porto, Porto, Portugal, 2015. [Google Scholar]
  14. Oliveira, F.E.; Varela, A.; Samúdio, M.J.; Sá, E.; Silva, J. Matriz de Energia da Área Metropolitana do Porto—Norte do Douro (Energy Consumption Matrix of Porto Metropolitan Area). 2014. Available online: http://www.adeporto.eu/fotos/editor2/matriztotal.pdf (accessed on 26 September 2016). (In Portuguese)
  15. EU FP-7 NOBEL Project. Neighborhood Oriented Brokerage Electricity and Monitoring System. 2010–2012. Available online: http://web.ict-nobel.eu:91/ (accessed on 26 September 2016).
  16. Karnouskos, S.; Serrano, M.; Marrón, P.J.; Marqués, A. Prosumer Interactions for Efficient Energy Management in Smartgrid Neighborhoods. In Proceedings of the CIB W78-W102 International Conference, Sophia Antipolis, France, 26–28 October 2011.
  17. Chvatal, K.M.S.; Corvacho, H. The impact of increasing the building envelope insulation upon the risk of overheating in summer and an increased energy consumption. J. Build. Perform. Simul. 2009, 2, 267–282. [Google Scholar] [CrossRef]
Figure 1. Two examples of high energy performance buildings: (a) solar settlement in Freiburg, Rolf Disch Solar Architecture [2]; and (b) solar XXI, Net zero energy office building in Lisbon [3].
Sustainability 08 00987 g001
Figure 2. Parking covered with PV solar panels [7].
Sustainability 08 00987 g002
Figure 3. European heating degree days (HDD), Eurostat method, provided by “Ecofys studies for Eurima” [10].
Sustainability 08 00987 g003
Figure 4. European cooling degree days (CDD), ASHRAE method, provided by “Ecofys studies for Eurima” [10].
Sustainability 08 00987 g004
Figure 5. Global Horizontal Irradiation in Europe [11].
Sustainability 08 00987 g005
Figure 6. Household energy consumption per dwelling. Source: ODYSSEE; Malta and Cyprus no adjustment given their low number of degree days [12].
Sustainability 08 00987 g006
Figure 7. Breakdown of household energy consumption by end-use in the EU [12].
Sustainability 08 00987 g007
Figure 10. Aerial view of the studied residential complex.
Sustainability 08 00987 g010
Figure 11. (a) Ground-floor; (b) First floor; and (c) Second floor plans.
Sustainability 08 00987 g011aSustainability 08 00987 g011b
Figure 12. Façades of the buildings: (a) Main façade; and (b) Rear façade.
Sustainability 08 00987 g012
Figure 13. Some photos of the studied residential complex.
Sustainability 08 00987 g013
Figure 14. Equipment used for space heating.
Sustainability 08 00987 g014
Figure 15. Equipment used for space cooling.
Sustainability 08 00987 g015
Figure 16. Ventilation system.
Sustainability 08 00987 g016
Figure 17. Equipment for DHW.
Sustainability 08 00987 g017
Figure 18. Possible steps toward the reduction of building energy needs.
Sustainability 08 00987 g018
Figure 19. The influence of increasing thermal insulation upon thermal comfort in a residential building (indoor temperature maximum for summer comfort: 25 °C) in summer in Portugal.
Sustainability 08 00987 g019
Table 1. Number of Heating Degree Days (HDD) and Cooling Degree Days (CDD) for different European Cities [9].
CITYAberdeenAthensBelgradeBerlinBilbaoBrusselsLarnacaLisbonMadridMalagaMilanRomeStockholmTampereWarsaw
Degree DaysHDD3530111227983155161229117591087196579626391443423950203614
CDD210754231701719512604746287913806483623103
Table 2. Number of dwellings and inhabitants of the studied residential complex.
TypologyNumber of DwellingsNumber of Inhabitants
2 bedrooms42126
3 bedrooms1456
4 bedrooms36180
5 bedrooms36216
Total128578
Table 3. U-values of the buildings envelope.
ElementU [W/(m2·K)]
External walls1.14
Flat roof0.7
Internal slabs2.56
Windows3.80
Table 4. Heating and cooling conventional energy needs for buildings from A1 to A6.
Group of ApartmentsApartment Area (m2)Heating Conventional Energy Needs (kWh/m2·Year)Cooling Conventional Energy Needs (kWh/m2·Year)Energy Class
Group 160.4049.63 */58.517.89 */7.02C
Group 278.2337.00 */46.778.00 */7.63C
Group 3109.5149.34 */60.198.23 */6.49C
Group 494.9554.68 */64.478.02 */7.49C
Group 5119.2536.46 */36.4517.33 */17.33B
Group 6109.6530.49 */30.5317.07 */17.06B
Group 7123.0450.68 */47.3216.87 */14.92B
Group 8134.0051.27 */47.5415.99 */16.86B
* In buildings A2 and A5.
Table 5. Heating and cooling conventional energy needs for buildings B1 and B2.
Group of ApartmentsApartment Area (m2)Heating Conventional Energy Needs (kWh/m2·Year)Cooling Conventional Energy Needs (kWh/m2·Year)Energy Class
Group 972.0723.0910.35B
Group 10131.2434.6810.79B
Group 1192.3725.8511.15B
Group 12102.541.499.69B
Group 13103.1156.9114.25C
Group 14117.0476.3613.90C
Group 15104.3463.3213.62C
Group 16115.8173.1613.87C
Table 6. Conventional energy needs for DHW (kWh/year).
BuildingConventional Energy Needs for DHW (kWh/Year)
A142,793
A242,793
A342,793
A442,793
A542,793
A642,793
B143,387
B243,387
Table 7. Results of the application of thermal insulation to the slabs over the garages.
BuildingUnit Cost (€/m2)Area of Application (m2)Total Cost (€)Annual Savings for Standard Conditions (1) (€)Annual Savings for Average User Profile (2) (€)
A1, A3, A4, A641.58193.1280301470479
A2, A541.58193.1280301378449
B1, B241.58193.1280301724562
Residential complex41.581544.9664,24012,0853939
(1) Considering the heating energy needs calculated through the methodology of Portuguese regulation. For the calculation of annual savings, the reduction in energy losses through the slabs was determined and multiplied by an energy cost of 0.17 euro/kWh; (2) Considering that 22% of the total energy consumption of a dwelling is used for space heating, according to the adopted average user profile, which corresponds roughly to one third of the consumption for standard conditions.
Table 8. Results for the thermal insulation of external walls.
BuildingUnit Cost (€/m2)Area of Application (m2)Total Cost (€)Annual Savings for Standard Conditions (1) (€)Annual Savings for Average User Profile (2) (€)
A1, A3, A4, A630.10522.2615,7201997651
A2, A530.10522.2615,7201943633
B1, B230.10571.7817,2112272740
Residential complex30.104277.12128,74116,2975313
(1) Considering the heating energy needs calculated through the methodology of Portuguese regulation. For the calculation of annual savings, the reduction in energy losses through the external walls was determined and multiplied by an energy cost of 0.17 euro/kWh; (2) Considering that 22% of the total energy consumption of a dwelling is used for space heating, according to the adopted average user profile, which corresponds roughly to one third of the consumption for standard conditions.
Table 9. Comparison between incandescent and LED light bulbs.
Incandescent (60 W)LED (11 W)
Service life (hours)10008000
Price of each light bulb (€)1.204.99
Energy consumption (kWh) (8000 operating hours)48088
Total cost of light bulbs (€) (for 8000 operating hours)9.604.99
Energy cost (€)81.6014.96
Total cost (€)91.2019.95
Table 10. Costs and savings concerning the replacement of light bulbs.
Unit Cost (€)Number of Replaced Light Bulbs Total Cost (€)Estimated Annual Savings (€)
Apartment4.992099.878.88
Building4.993201596.81262.00
Residential complex4.99256012,774.410,097.00
Table 11. Replacement of less efficient equipment for Class A equipment.
Cost (€)Energy Consumption Reduction (kWh/Year)Estimated Annual Savings (€)
Apartment15001050178.5
Building24,00016,8002856.0
Residential complex192,000134,40022,848.0
Table 12. Solar collectors for heating DHW.
BuildingEnergy Needs for DHW (kWh/Year)Number of Solar CollectorsTotal Area of Collectors (m2)Cost (€)Energy Provided by the Collectors (kWh/Year)Energy Required from the Support System (kWh/Year)
A1 to A642,7933770.349,81040,6462147
B1, B243,3873770.349,81040,6462741
Residential complex343,532296562.4398,480325,16818,364
Table 13. PV solar Panels.
BuildingEnergy Needs (kWh/Year)Number of Groups of PanelsTotal Area of Panels (m2)Total Energy Provided by the PV System (kWh/Year)Unit Cost of a Group of Panels (€)Total Cost (€)
A1, A3, A4, A643,685123280.943,847461.556,764.5
A2, A541,649115262.740,996461.553,072.5
B1, B245,146128292.445,630461.559,072.0
For DHW (all buildings)18,36450114.218,405461.523,075.0
Residential complex366,69410282348.0367,045461.5474,422.0
Table 14. Synthesis of results.
Renovation MeasureTotal Cost (€)Reduction in Energy Consumption (kWh/Year)Annual Savings (€)Payback Period (Years)
Insulation of the slabs over the garages64,24023,173 (1)393916.3
Insulation of external walls128,74131,251 (1)531324.2
Replacement of light bulbs12,77459,39210,0971.3
Replacement of energy non-efficient equipment192,000134,40022,8488.4
Installation of solar thermal collectors398,480 (2)325,168 (3)34,79311.5
Installation of PV solar panels474,422 (2)367,045 (3)62,3987.6
Total1,270,657940,429139,3889.1
(1) For the adopted average user profile; (2) It does not take into account the cost of any infrastructure or equipment necessary to guarantee the full use of the produced energy; (3) This corresponds to the energy provided by the system and presupposes the full use of the produced energy.

