Article

Performance Analysis of the Combined Operation of Interconnected-BCCHP Microgrids in China

1
School of Electrical Engineering, Southeast University, Nanjing 210096, China
2
State Grid Jilin Electric Power Supply Company, Changchun 130021, China
3
State Grid Power Research Institute/NARI Group Corporation, Nanjing 210003, China
4
Jiangsu Electric Power Company Research Institute, Nanjing 210003, China
*
Author to whom correspondence should be addressed.
Sustainability 2016, 8(10), 977; https://doi.org/10.3390/su8100977
Submission received: 25 July 2016 / Revised: 7 September 2016 / Accepted: 18 September 2016 / Published: 28 September 2016
(This article belongs to the Section Energy Sustainability)

Abstract

:
From the Internet of Energy point of view, adjacent building combined cooling, heating and power with microgrids (BCCHP microgrids) should be interconnected, which will generate better benefits, both economically and environmentally, from scarce energy resources through intelligent coordination. The interconnected-BCCHP (IBCCHP) microgrids will not only support energy with each other but also bring better benefits compared to the non-interconnected-BCCHP (NBCCHP) microgrids. A mixed-integer linear programming (MILP) economic dispatching approach incorporating piecewise linear efficiency curves model is proposed to compares the performance of IBCCHP microgrids and NBCCHP microgrids. Three buildings with CCHP microgrids in Shanghai are studied as an example, and simulation results are presented to demonstrate that the primary energy consumption (PEC), the carbon dioxide emissions (CDE) and the operation cost of the proposed IBCCHP microgrids are better than the NBCCHP microgrids, and the overall lifetime of the complete battery is improved. Furthermore, a sensitivity analysis is presented to provide various policy recommendations to promote the interconnection among buildings with the change of electricity prices and gas prices.

1. Introduction

The energy crisis and rising air pollution have led to a greater worldwide focus on the Internet of Energy, which will improve energy resource through intelligent coordination [1]. There has been much research on Internet of Energy concept and operation [1,2,3,4,5,6,7,8,9]. What is an Energy Internet? In many versions, information and communication technologies are directly borrowed into electric power flow or energy flow, while others technologies also utilize the descriptions in smart grid [10]. In China, the future Internet of Energy, with the smart grid as the core part, will develop into a reliable, cost-efficient, environmentally clean and interactive integrated energy system. The demands of various user-side energy forms and the energy quality must be satisfied by developing distributed generation, microgrids; a combined cooling, heating and power (CCHP) system and electric vehicle technology, at the distribution network side [11]. To ensure energy security effectively, a top-level design is necessary. With electricity as the main transmission medium, the Internet of Energy can flexibly accept the electricity converted by a variety of energy resources (coal, oil, natural gas, wind, solar, etc.). Due to these advantages, it is recognized as an important direction for future energy revolution. Meanwhile, it is also the inevitable trend for the construction of low carbon lifestyle and will become the valid carrier of the “Third Industrial Revolution”.
Buildings energy consumption (BEC) currently account for approximately 40% in many countries, which are significant source of carbon dioxide emissions (CDE) [12]. In the EU, approximately half of the BEC is used for space heating, 25% for domestic hot water and 11% for electricity [13]. In US, BEC account for 38.9% of the total end energy consumption [14]. In China, BEC has increased by more than 10% a year over the past 20 years [15]. With the high rate of real estate, China is facing a crucial challenge of improving energy production and energy efficiency. Thus, buildings have been considered as one of the most cost-effective way to reduce primary energy consumption (PEC) in China. Moreover, by reducing the energy end demand, improving energy utilization efficiency in buildings can significantly reduce CDE.
An interesting candidate for domestic power generation is the combined cooling, heating and power (CCHP) system, which, as the name states, can provide cooling, heating and power energy at the same time. CCHP system is also referred to as the tri-generation system, and it has been widely applied in hospitals, supermarkets, schools, etc. As an energy-efficient technology, the CCHP microgrids is broadly identified as an alternative that can solve energy-related problems worldwide, including increasing energy demands, higher energy cost, energy supply security, and environmental concerns [16,17,18,19,20]. A CCHP microgrids integrates power generation units, auxiliary boilers, heat recovery systems, refrigeration equipment, energy storage devices and renewable energy sources to implement the cascading utilization of energy. The main difference between CCHP microgrids and traditional CCHP systems is that the former not only satisfy the cooling, heating, and power demands of certain types of customers (such as office buildings, hotels, schools, commercial malls, and industrial loads), but also interacts with the main grid to provide a reserve, peak-shaving, and demand response services, as well as improved capabilities for integrating renewable energy sources [21]. When a CCHP microgrids is used for a building, integrating renewable energy into buildings to capture the savings potential of the buildings sector, it is called a building cooling, heating and power (BCCHP) microgrids [22]. BCCHP microgrids is cost-effective and therefore has a good prospect of becoming popular. Meanwhile, BCCHP microgrids are considered important, hopeful measures to perform the strategy of energy sustainability and thus getting people’s growing attention.
Currently, the application of BCHP systems have been studied and compared in different climate zones. The environmental impact of BCHP systems were analyzed and compared in [23] and the configuration and operation strategy of the biomass gasification based on BCHP system were analyzed, and an integrated optimization design model combined a case study was proposed in Harbin, China [24]. The performances of optimal BCHP systems were evaluated in five climate conditions including the perspective of operational cost, PEC, and CDE in [25]. The energy and environmental performance of poly-generation systems were evaluated by introducing a novel and unified model in [26]. There were various optimization algorithms adopted to solve the BCHP optimization problem, including linear programming [27] and mixed integer nonlinear programming [28,29]. There are also various special and intelligent optimization methods such as Lagrangian relaxation [30], genetic algorithms (GA) [31], and particle swarm optimization (PSO) [32,33]. The optimization model for planning operation of CCHP systems was presented in [34,35,36], and the BCHP optimization problem was solved by converting the mixed integer nonlinear programming (MINLP) model into a mixed integer linear programming (MILP) model by appropriate piecewise linear approximation of the nonlinear performance curve.
In China, different buildings with CCHP microgrids are designed and constructed by different developers that are not equipped with networked devices. From the societal point of view, the interconnected buildings with CCHP microgrids can obtain increased profits both economically and environmentally by taking advantages of the complementary characteristics of loads in different buildings and providing energy support among buildings. However, the current policy does not support the benefit assignment under interconnected BCCHP (IBCCHP) microgrids. Previous work only studied a single building with a CCHP system or CCHP microgrids, considering the running cost, PEC, and CDE. Therefore, we employ a MILP economic dispatching model incorporating piecewise linear efficiency curves model for the IBCCHP microgrids in this paper. Simulation results are presented and compared the comprehensive performance of IBCCHP microgrids and the non-interconnected BCCHP (NBCCHP) microgrids. To the authors’ best knowledge, the system performance of interconnected buildings with CCHP microgrids compared to that of the independent buildings with CCHP microgrids, based on PEC, operation cost, and CDE, has not been previously investigated in the literature.
The remainder of this paper is organized as follows. Section 2 proposes an MILP model to implement operation of the IBCCHP microgrids. Section 3 describes four operational modes of the IBCCHP microgrids in China and formulates three performance criteria (PEC, operation cost and CDE) to evaluate system performance between the NBCCHP microgrids and the IBCCHP microgrids. Section 4 demonstrates the case studies based on three buildings with CCHP microgrids. Finally, we conclude this paper in Section 5.

2. IBCCHP Microgrids Model

Figure 1 shows the structure of a single BCCHP microgrids. There are three energy flows in the BCCHP microgrids (thermal energy flow, cooling energy flow and electricity energy flow). In this paper, we consider a BCCHP microgrids that includes a photovoltaic cell (PV), a battery, a micro gas turbine (MT), a gas boiler, an absorption chiller, an electric chiller, and heat exchanger, along with cooling, heating and electricity loads.
A schematic of the energy flows for IBCCHP microgrids is given in Figure 2. Three areas with CCHP microgrids were connected by a steam and electricity bus. The electric power between the IBCCHP microgrids and the main grid may be bidirectional; renewable energy and MT are adopted to generate electricity to supply the end user needs. In some cases, extra electric power can be sold back to the main grid or used to charge batteries. Thus, IBCCHP microgrids can purchase power from the main grid or sell power to the main grid according to the demand. The rejected heat from the MT is recovered by the heat recovery system to produce cooling using an absorption chiller or heating using a heating exchangers. When there is not enough recovered heat, the gas boiler of the IBCCHP microgrids is used to provide extra heat.

2.1. Assumptions in the Research

We make various necessary assumptions to facilitate the following analysis. These assumptions are given below.
(1)
The structure and capacity of the BCCHP microgrids have been fixed, and the rated capacity is sufficient to satisfy the peak load of the cooling, heating and power load. Furthermore, the power exchange is completed instantaneously.
(2)
All of the involved equipment can operate ranging at between 0% and 100% of its rated capacity. Additionally, the efficiency of CCHP devices drops at partial load operation and the transmission loss of exchange power with the main grid and heat exchange power of all of the distribution equipment are neglected to simplify the analysis and calculation.
(3)
Based on the subsidy policy for PV from the government, the efficiency of PV generation that is adopted by the main grid is assumed to be 100%.

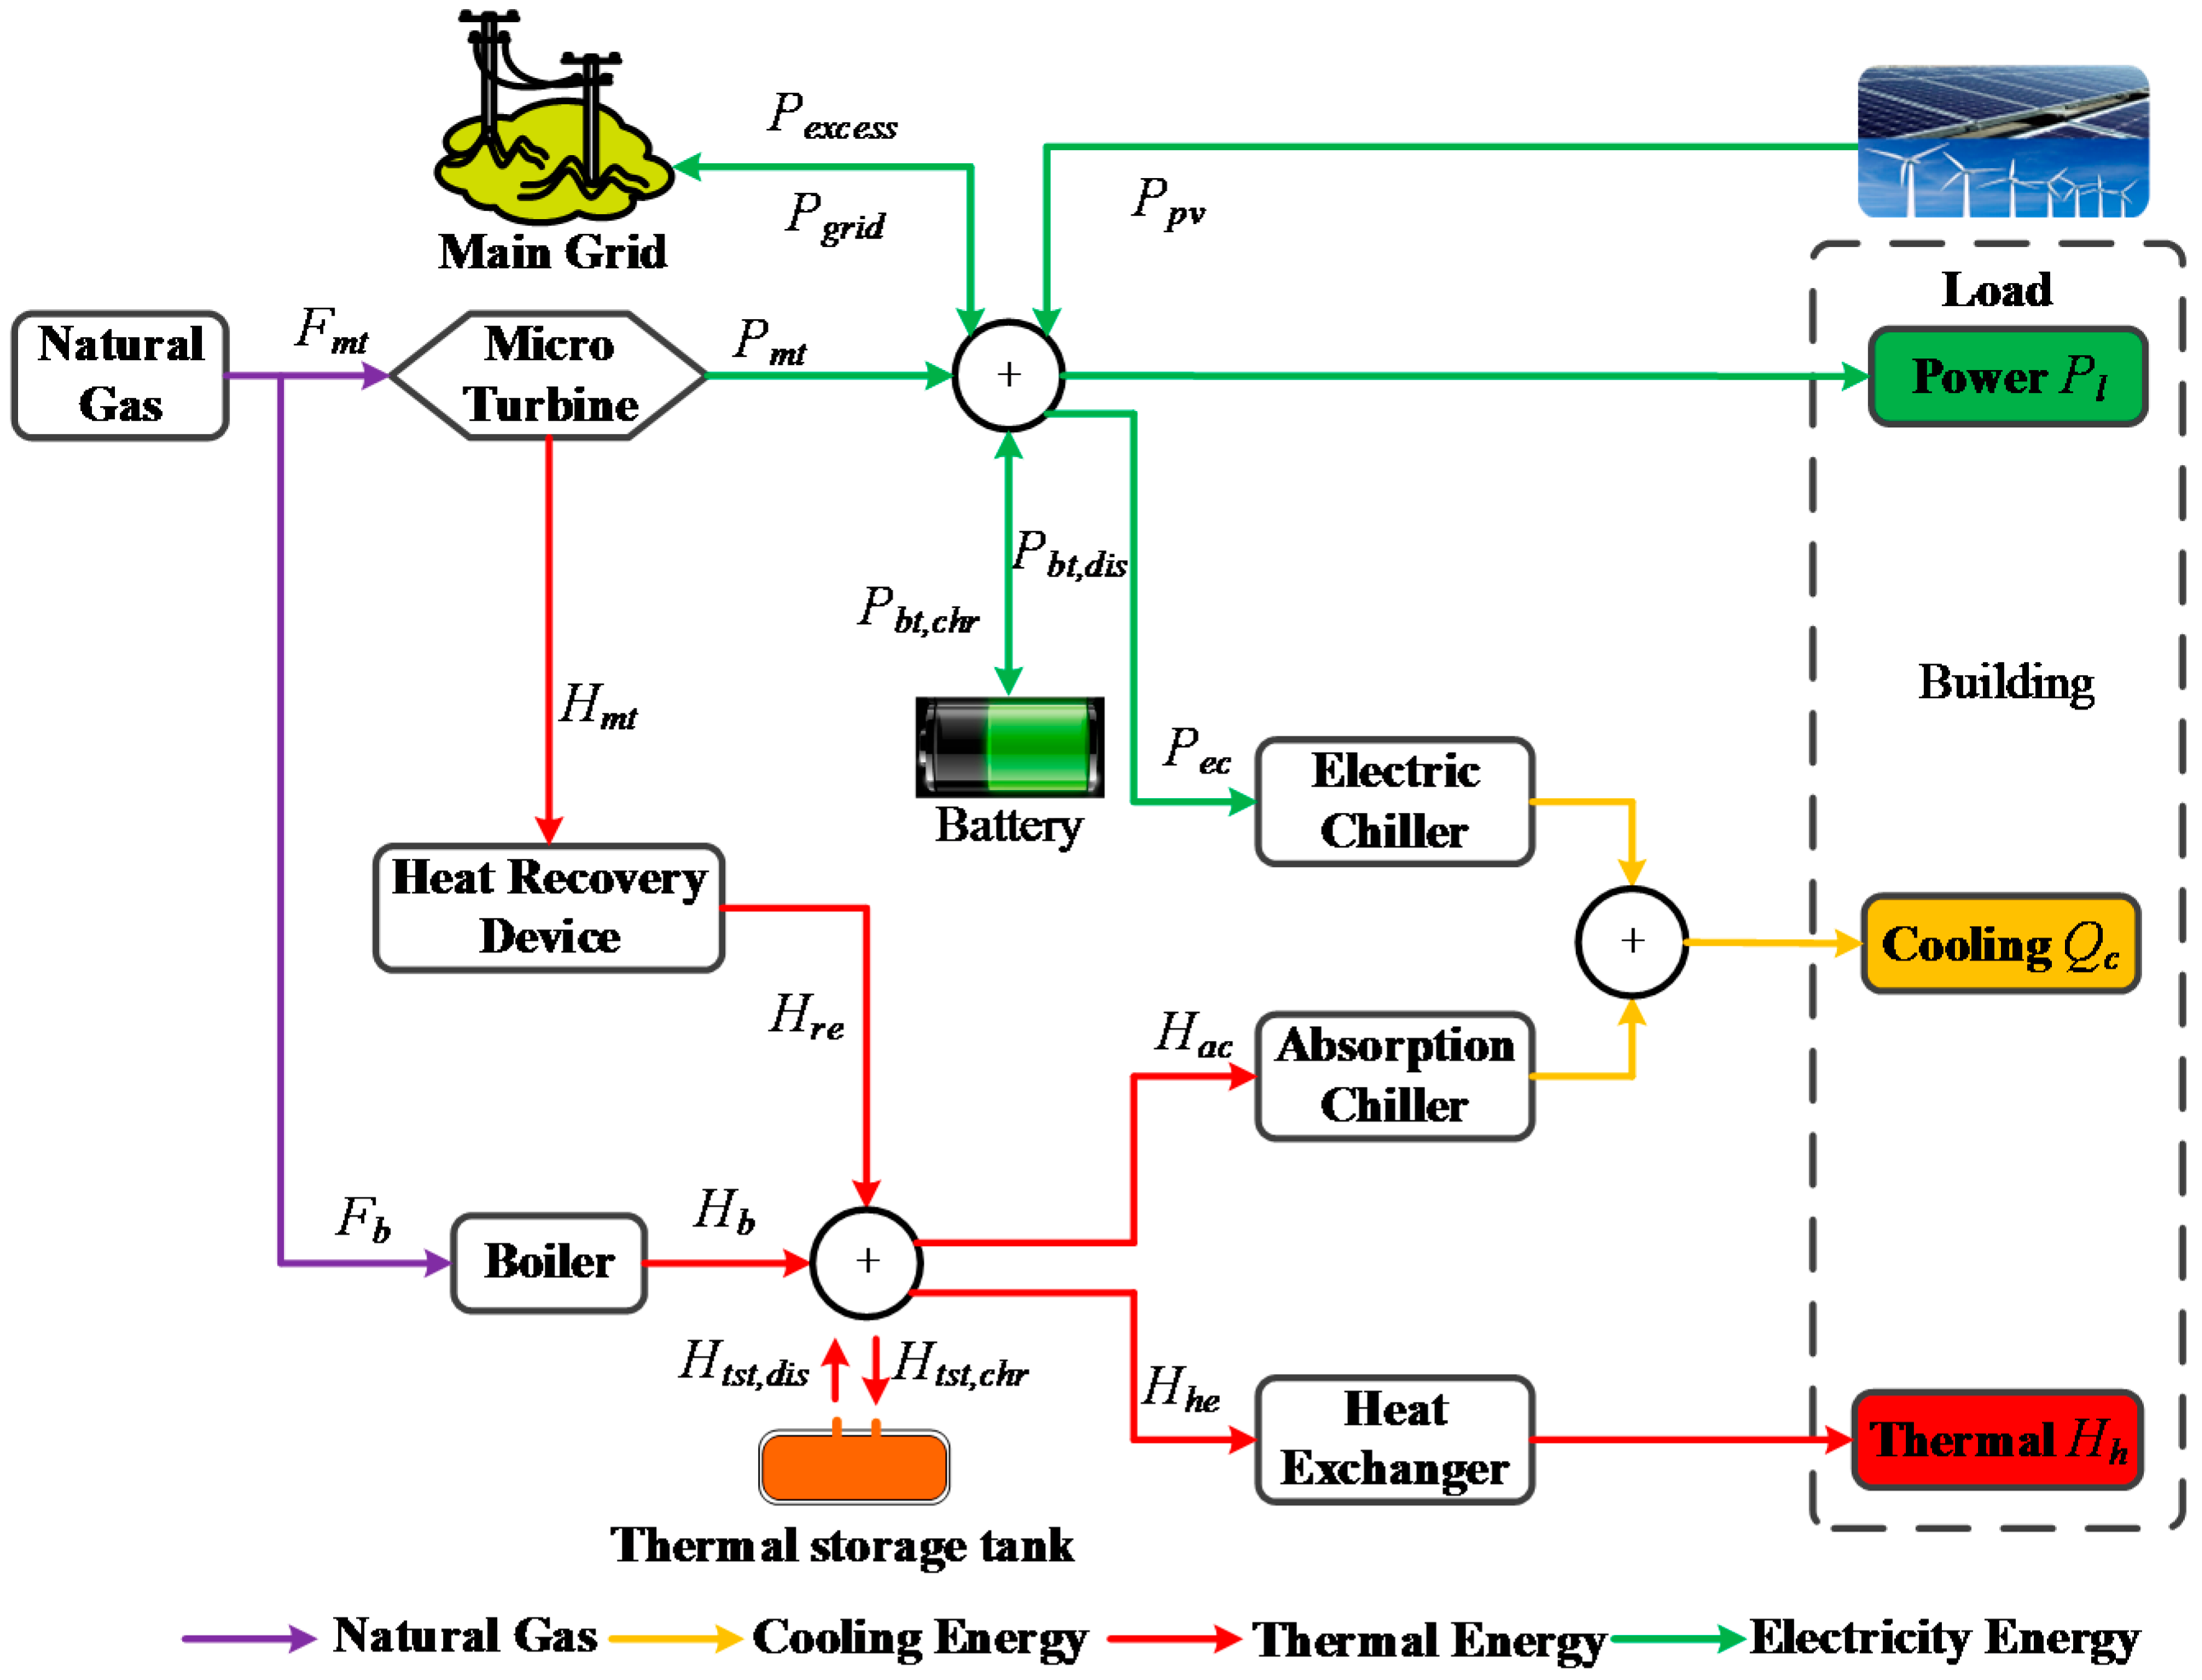
2.2. Modeling of the Components

(a) Micro gas turbine:
The power output ( P m t t ) of MT is relative to the fuel energy ( F m t t ). The relationship between them can be obtained using a straight line [17].
F m t t = α P m t t + β U m t t
where α and β are fuel-to-electric-energy conversion factors. U m t t represent operating status of the MT. The capacity and ramp rate constraints are define by Equations (2) and(3):
U m t t P m t min P m t t U m t t P m t max
U m t t P m t d o w n P m t t P m t t 1 U m t t P m t u p
In this system, the input variables (consumed fuel and electricity) of each facility are in connection with the output variables (generated cooling, heating and electricity) through the nonlinear performance curves. Normally, low load leads to low efficiency. As shown in Figure 3, the thermal and electrical efficiency of the MT is defined in Equations (4)–(7) through piecewise linearization [36]. The nonlinear efficiency curve changes to several line segments, thus the control problem can be modeled as a MILP:
P m t t = U m t t B m t 1 + k = 1 L m t D m t t , k
U m t t = k = 1 L m t v m t t , k
j = k + 1 L m t v m t t , k D m t t , k B m t k + 1 B m t k j = k L m t v m t t , k
H m t t = U m t t A m t 1 + k = 1 L m t g m t k D m t t , k
where H m t t is the heat produced by the MT. A m t k is the coefficient of the thermal and electrical efficiency curve. B m t k is the block limit of the thermal and electrical efficiency curve. g m t k is the slope of block k of the thermal and electrical efficiency curve. v m t t , k is the binary variable encoding the thermal and electrical efficiency curve of the MT. Lmt is the index set of the piecewise linear thermal and electrical efficiency curve.
(b) Gas boiler:
H b min H b t H b max
F b t = H b t / η b
where F b t and H b t represent fuel consumption and the power output of the gas boiler in interval t, respectively. η b is the efficiency of gas boiler.
(c) Exchange power between the main grid and the microgrids:
{ 0 P g r i d t U g r i d t P g r i d max 0 P e x c e s s t U e x c e s s t P g r i d max U g r i d t + U e x c e s s t 1
where, P g r i d t and P e x c e s s t represent power provided by main grid and sold to main grid in interval t (kW), respectively. U g r i d t and U e x c e s s t represent absorbing/sending power state from grid by microgrids in interval t, respectively.
(d) Battery:
{ U b t , c h r t P b t , c h r min P b t , c h r t U b t , c h r t P b t , c h r max U b t , d i s t P b t , d i s min P b t , d i s t U b t , d i s t P b t , d i s max U b t , d i s t + U b t , c h r t 1 W b t t = W b t t 1 ( 1 σ b t ) + ( η b t c h r P b t , c h r t P b t , d i s t / η b t d i s ) Δ t W b t min W b t t W b t max
where W b t min and W b t max represent the minimum and maximum power of the battery (kWh), respectively. P b t , c h r t and P b t , d i s t represent charging and discharging power of the battery in interval t (kW), respectively. U b t , c h r t and U b t , d i s t represent charging and discharging state of the battery in interval t, respectively. σ b t , η b t c h r and η b t d i s represent energy loss rate, charging and discharging efficiency of the battery, respectively.
The status-transfer flag of the charging/discharging battery U t s t , c h r * t and U t s t , d i s * t are define by Equations (12) and (13):
U b t , c h r t U b t , c h r t 1 U b t , c h r * t
U b t , d i s t U b t , d i s t 1 U b t , d i s * t
(e) Thermal storage tank [37]:
{ U t s t , d i s t H t s t , d i s min H t s t , d i s t U t s t , d i s t H t s t , d i s max U t s t , c h r t H t s t , c h r min H t s t , c h r t U t s t , c h r t H t s t , c h r max U t s t , c h r t + U t s t , d i s t 1 H t s t = H t s t 1 ( 1 σ t s t ) + ( η t s t c h r H t s t , c h r t H t s t , d i s t / η t s t d i s ) Δ t H t s t min H t s t t H t s t max
where H t s t min and H t s t max are lower/upper bound on thermal power released by TST (kW). H t s t , c h r t and H t s t , d i s t represent thermal power stored/released by thermal storage tank (TST) in interval t (kW), respectively. U t s t , c h r t and U t s t , d i s t represent charge/discharge state of TST in interval t. σ t s t , η t s t c h r and η t s t d i s represent energy loss rate and charge/discharge efficiency of TST, respectively.

3. Optimal Operation Strategies under Different Energy Polices

Buildings, one of an important measure to reduce energy consumption, is facing new challenges due to the higher cost of the buildings using renewable energy and the low market acceptance at the initial stage, which is led to execute a financial support policy and provide subsidies to those promote programs using renewable energy since 2006. Under the central government’s lead, local governments have improved their support of renewable energy applications. The policy mainly supports those projects applying solar energy, which includes hot water supply systems with solar energy and ground-source heat pumps. Considering the future development of the grid, IBCCHP microgrids have four operating modes under these policies.

3.1. Different Combined Operating Modes of IBCCHP Microgrids

IBCCHP microgrids combined with operating modes are divided into four modes in accordance with the PV subsidy policy and interactions with the main grid and the IBCCHP microgrids in Table 1, in which ‘√’ means that source is in the IBCCHP microgrid.

3.2. System Constraints

Constraints of the model include the cooling, heating, and power balances and the operational constraints of each component.
(1) Power balance
According to the four operational modes of the system, there are four methods of constraint for the power balance.
When the system is operating in Mode 1,
i N = 3 P m t , i t + P g r i d , i t + P e c , i t + P b t , d i s , i t P b t , c h r , i t = P l , i t P p v , i t
When the system is operating in Mode 2,
i N = 3 P m t , i t + P g r i d , i t + P e c , i t + P b t , d i s , i t P b t , c h r , i t = P l , i t
When the system is operating in Mode 3,
i N = 3 P m t , i t + P g r i d , i t + P e c , i t + P b t , d i s , i t P e x c e s s , i t P b t , c h r , i t = P l , i t
When the system is operating in Mode 4,
i N = 3 P m t , i t + P g r i d , i t + P e c , i t + P b t , d i s , i t P e x c e s s , i t P b t , c h r , i t = P l , i t P p v , i t
(2) Thermal balance
i N = 3 H m t , i t η r e , i H b , i t H a c , i t H t s t , d i s , i t + H t s t , c h r , i t = H h , i t / η h e , i
(3) Cold balance
i N = 3 C O P a c , i H a c , i t + C O P e c , i P e c , i t = Q c , i t
(4) Constraints of the power exchange between the BCCHP microgrids and main grid:
When the system is operating in Mode 1 or Mode 2,
0 P g r i d , i t P g r i d . i max
When the system is operating in Mode 3 or Mode 4, this constraint is equivalent to Equation (10).

3.3. Performance Criteria for IBCCHP Microgrids

As a result of the various types of distributed equipment, the evaluation of IBCCHP microgrids is becoming a critical issue, and it requires considerable effort to establish the evaluation methods and indicators that can assess IBCCHP microgrids performance in terms of energy use efficiency, economic and environmental benefits, or the combination of multiple factors. In this paper, both the enterprise efficiency and three criteria including the PEC, the operational cost and the CDE, are adopted to evaluate the performances of the IBCCHP microgrids.
The objective of the running cost criterion is to minimize the total operation cost. These include the cost of electricity purchased from the main grid, the cost of the primary energy consumed and PV subsidy. The cost is offset by the profits from selling electricity to the main grid.
(a) Purchased electricity cost:
C g r i d , i t = R g r i d t P g r i d , i t Δ t
(b) Sold electricity profits:
C e x c e s s , i t = R e x c e s s t P e x c e s s , i t Δ t
(c) Aging cost of the battery [38]:
C b t , i t = R b t ( U b t , d i s * , i t + U b t , c h r * , i t ) Δ t
(d) Natural gas cost:
C n g , i t = [ R n g t ( F m t , i t + F b , i t ) / H n g ] Δ t
(e) PV subsidy:
C p v , i t = R p v g t P p v , i t Δ t
When the system is operating in Mode 1,
C O S T = T 365 t = 1 T i N ( C g r i d , i t + C n g , i t + C b t , i t ) Δ t
When the system is operating in Mode 2,
C O S T = T 365 t = 1 T i N ( C g r i d , i t + C n g , i t + C b t , i t R p v g t P p v , i t ) Δ t
When the system is operating in Mode 3,
C O S T = T 365 t = 1 T i N ( C g r i d , i t C e x c e s s , i t + C n g , i t + C b t , i t R p v g t P p v , i t ) Δ t
When the system is operating in Mode 4,
C O S T = T 365 t = 1 T i N ( C g r i d , i t C e x c e s s , i t + C n g , i t + C b t , i t ) Δ t
where, C n g t , C g r i d t , C e x c e s s t , C b t t , and C p v t represent the natural gas cost, purchased electricity cost, sold electricity profits, aging cost function of battery and PV subsidy in time period t, respectively. R n g t is the tariff for natural gas (Yuan/kWh). R g r i d t is the tariff for purchasing power from the main grid (Yuan/kWh) and R e x c e s s t is the tariff for selling power to the main grid (Yuan/kWh). R b t t is charge/discharge of battery cycles cost (Yuan/per time). R p v is subsidy prices of the PV [39].
The focus on environmental problems is increasing year by year; thus, for the BCCHP system, the CO2 emissions have become an increasing and important factor. The amount of carbon dioxide emission can be expressed as followed.
When the system is operating in Mode 1 or Mode 2,
C D E = T 365 t = 1 T = 24 i N ( F m t , i t + F b , i t ) μ f + P g r i d , i t μ e
When the system is operating in Mode 3 or Mode 4,
C D E = T 365 t = 1 T = 24 i N ( F m t , i t + F b , i t ) μ f + ( P g r i d , i t P p v , i t ) μ e
where μf and μe are the emission factors of natural gas and electricity, respectively.
PEC is defined as the amount of site energy consumption plus losses that occur in the generation, transmission, and distribution of energy, which are the most direct and common indicator to reflect the operational efficiency of IBCCHP microgrids. Thus, this criterion is given firstly.
When the system is operating in Mode 2 or Mode 3,
P E C = T 365 t = 1 T = 24 i N ( F m t , i t + F b , i t ) k f + P g r i d , i t k e
When the system is operating in Mode 1 or Mode 4,
P E C = T 365 t = 1 T = 24 i N ( F m t , i t + F b , i t ) k f + ( P g r i d , i t P p v , i t ) k e
where Equation (33) represents Modes 2 and 3 and Equation (34) represents Modes 1 and 4. In Modes 2 and 3, the power of the PV is not involved in the optimization variables, however, it still produce environmental value from the point of view of the society. kf and ke are the site-to-primary energy conversion factors for electricity and fuel, respectively. Due to the characteristic of the given operation mode, Pgrid will be positive when the surplus electricity will be sold back to the main grid, and it will be negative when not.

4. Case Study

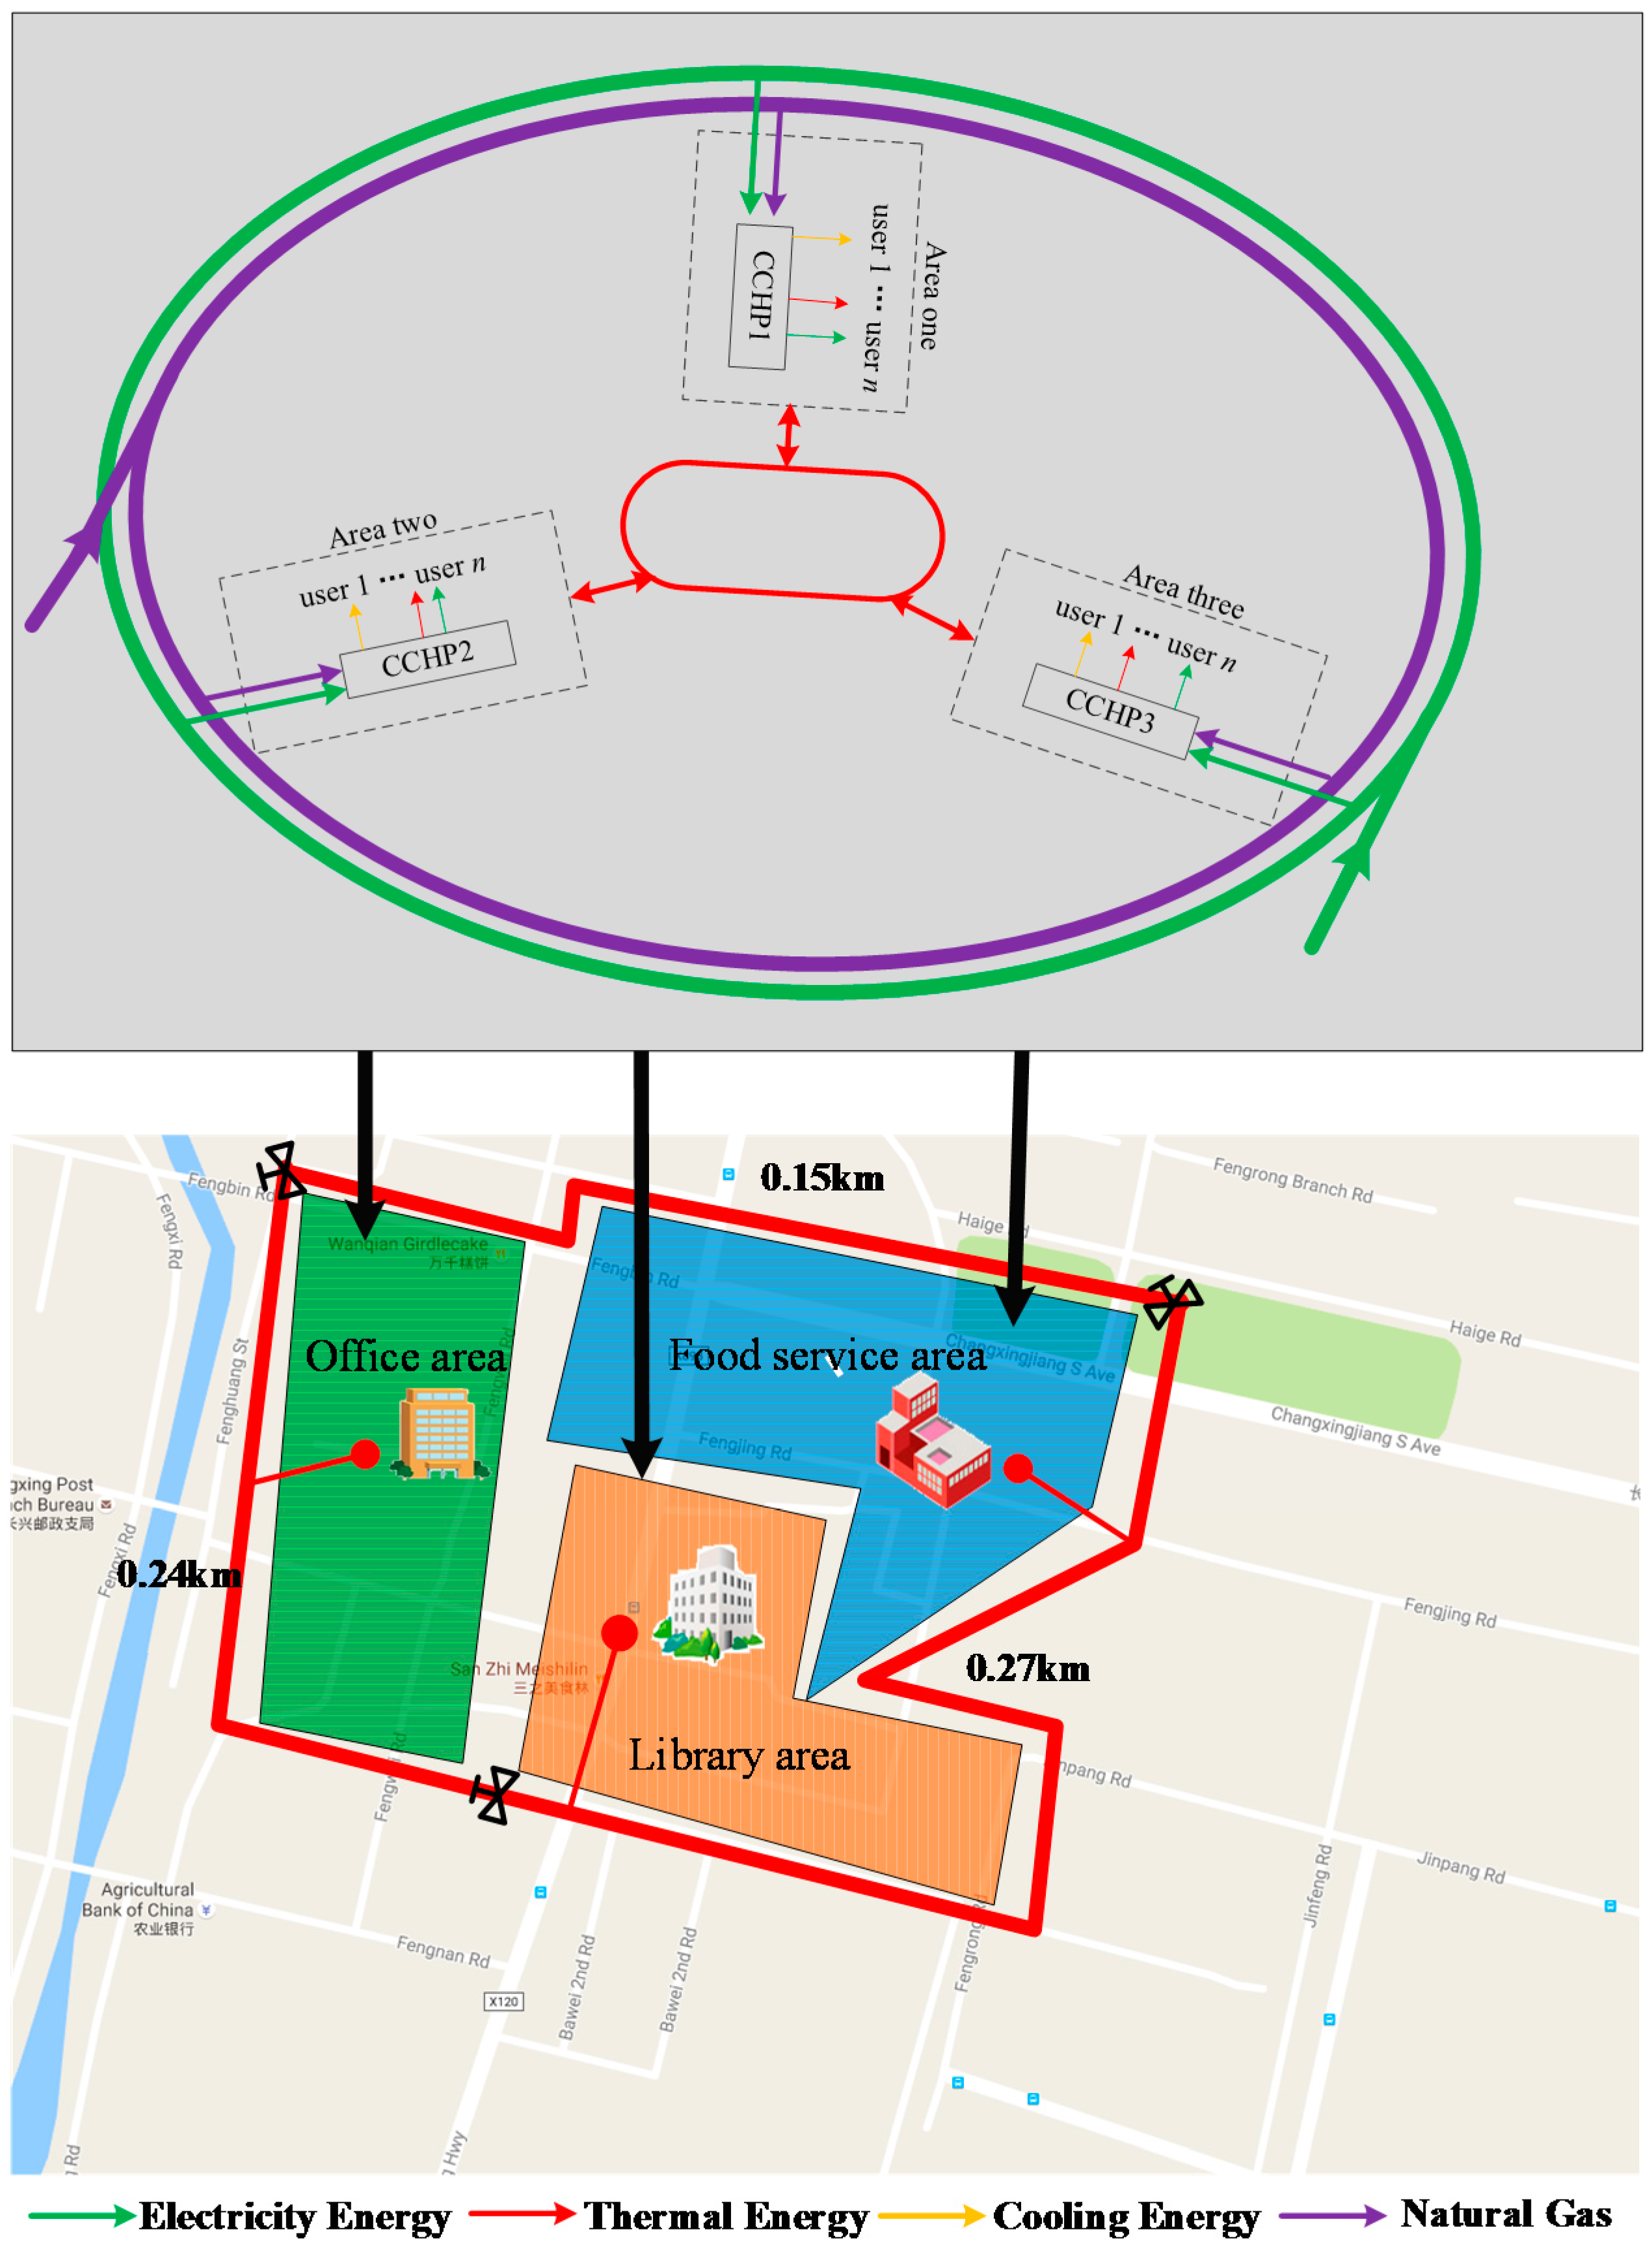
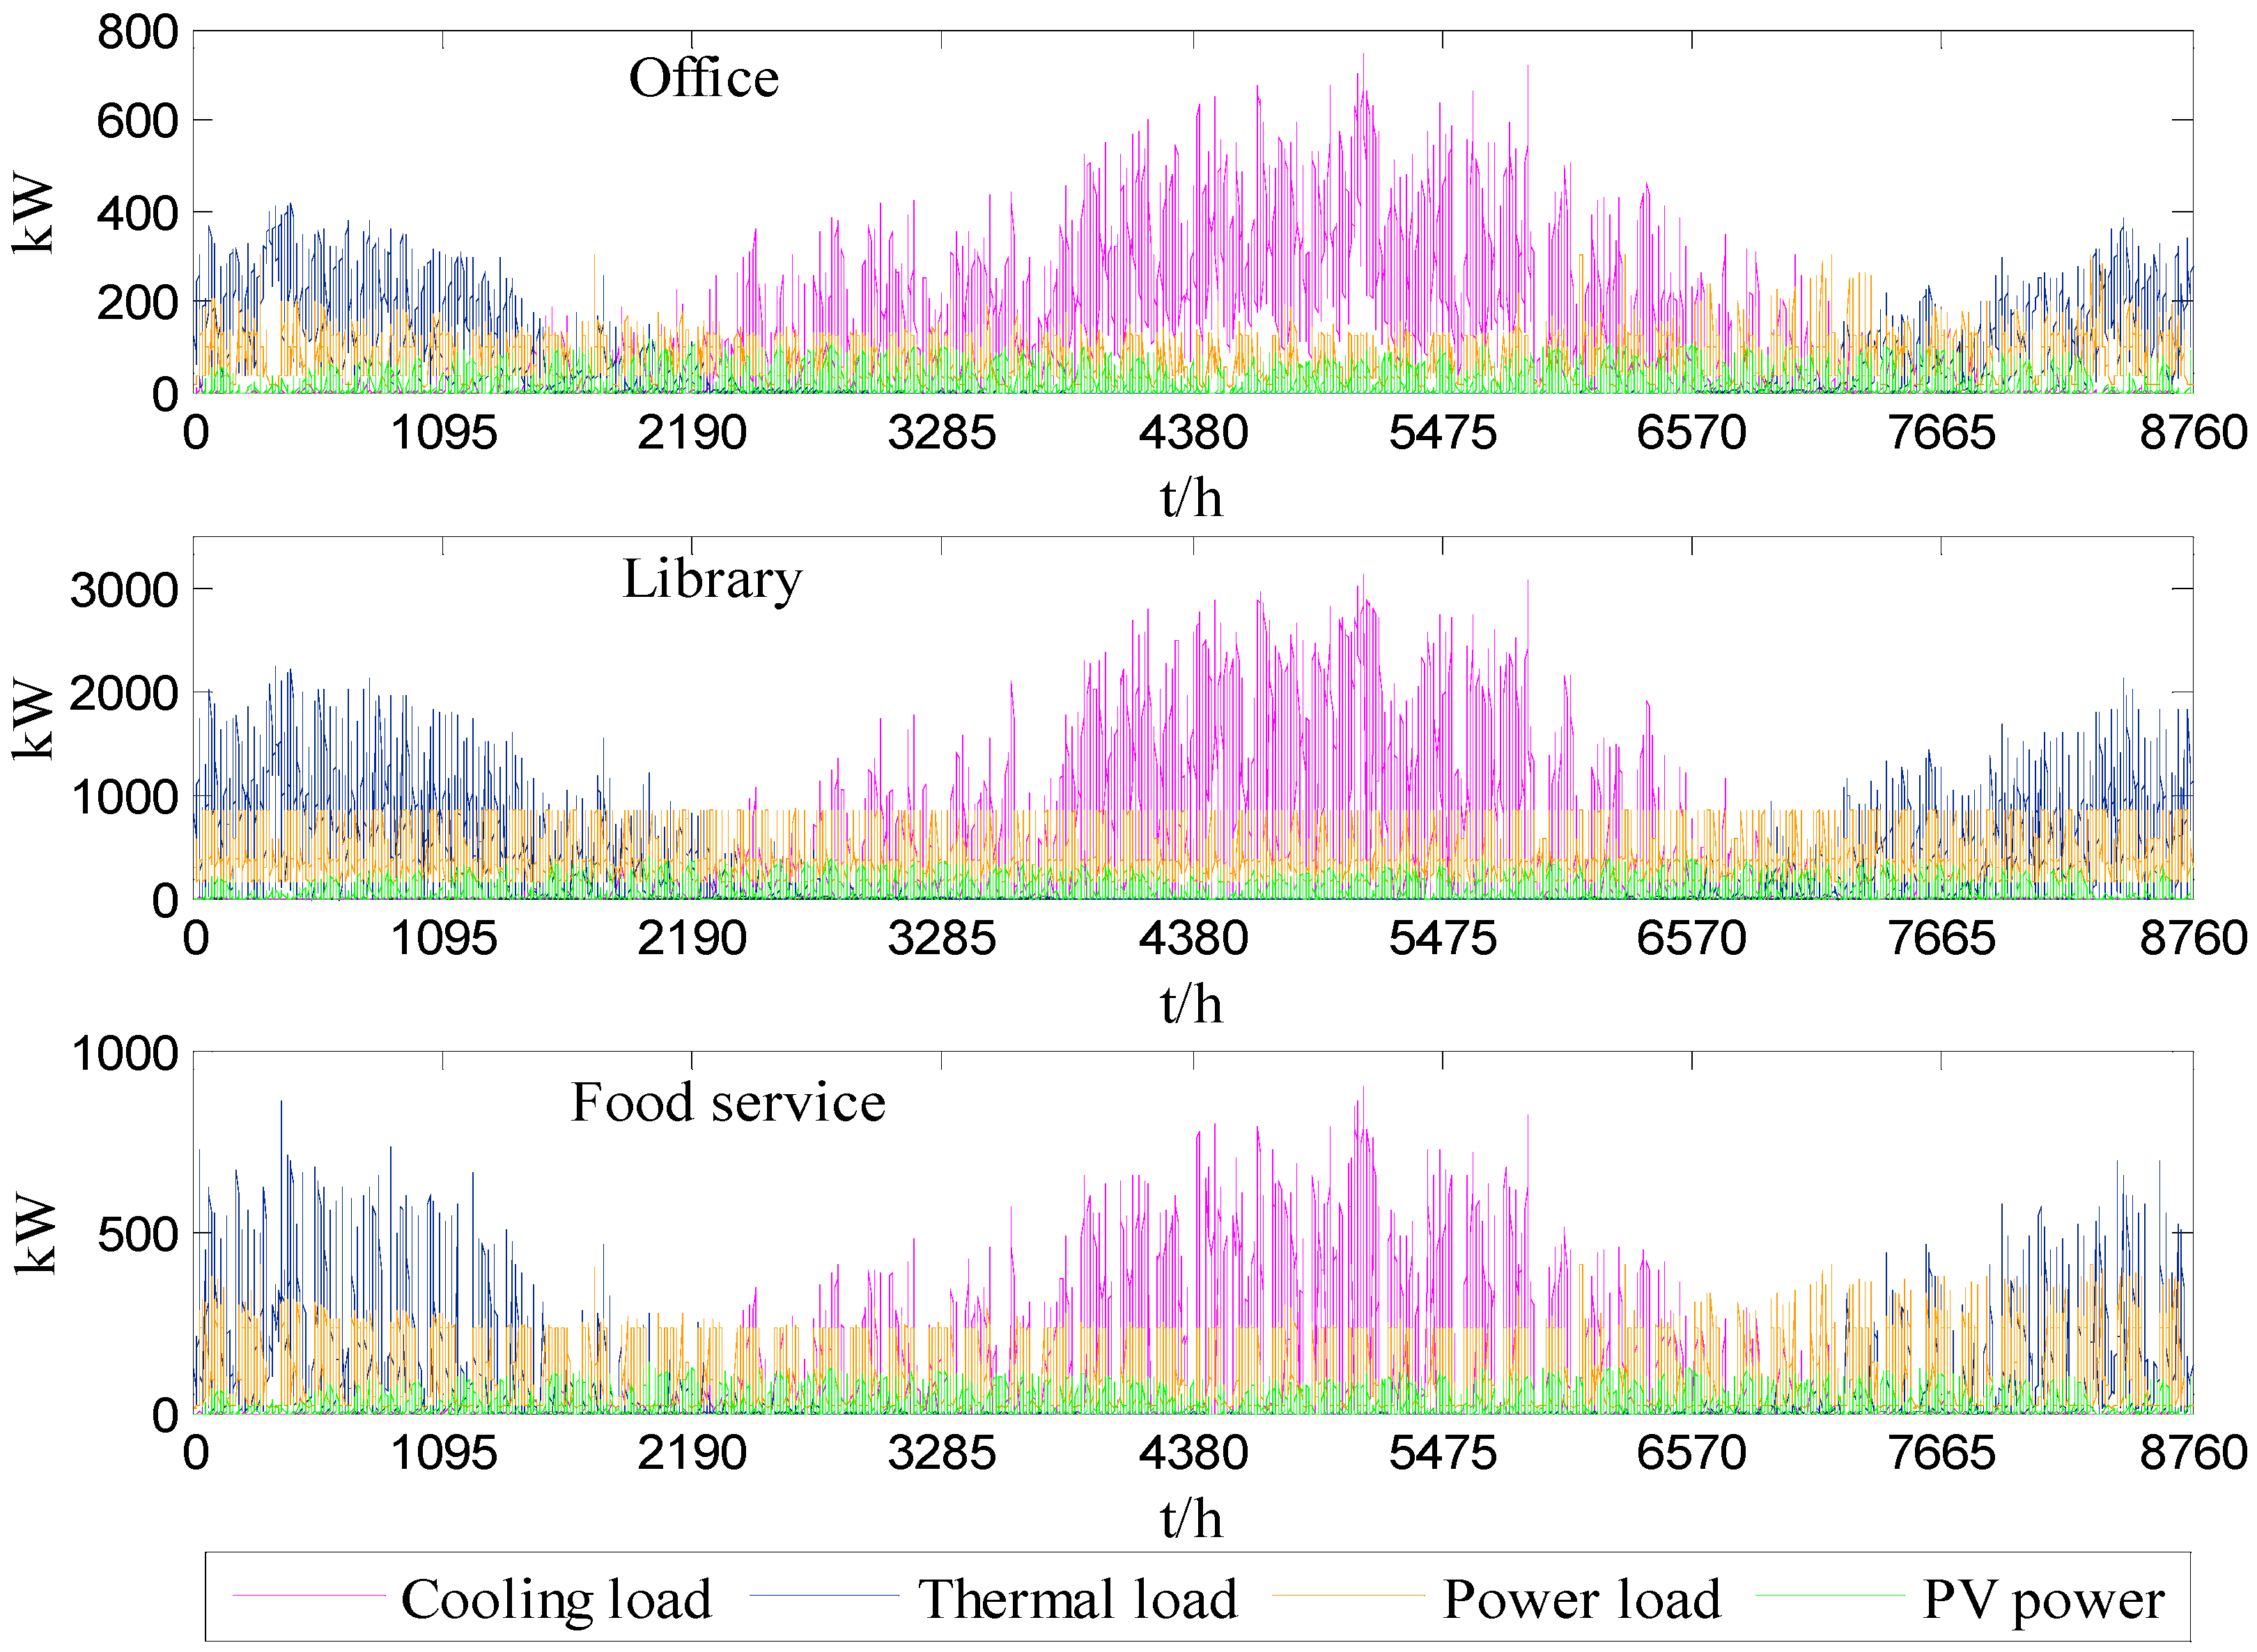
4.1. Overview of the Study on IBCCHP Microgrids

Figure 2 shows the structure of this IBCCHP microgrids, which is a real regional energy supply system in Shanghai, China. There are three areas in this microgrids, namely office area, food service area and library area. These areas are interconnected through thermal/cooling network and a power grid. The heating demands are met by natural gas, and the cooling demands are mainly provided for by heat and electricity. The hourly energy demands of one year are obtained by Energy Plus-simulation software [40] for building energy consumption systems. Figure 4 shows the hourly PV power and the cooling, heating, and power loads of one year for three BCCHP microgrids. Table 2 shows the peak–valley price [41,42]. The price of natural gas is 3.24 Yuan/m3, which is 9.78 kWh/m3 when converted into calorific units [43]. Table 3 and Table 4 lists the rest of parameters used in this study, which are determined according to [17,43,44,45].
The office area consists of a photovoltaic system (1 × 130 kW), a battery (1 × 200 kW), a gas micro turbine (1 × 120 kW), a boiler (1 × 500 kW), an electric chiller (1 × 150 kW), an absorption chiller (1 × 500 kW), and a heat exchanger (1 × 500 kW). The food service area consists of a photovoltaic system (1 × 150 kW), a battery (1 × 200 kW), a gas micro turbine (1 × 135 kW), a boiler (1 × 400 kW), an electric chiller (1 × 100 kW), an absorption chiller (1 × 500 kW), and a heat exchanger (1 × 600 kW). The library area consists of a photovoltaic system (1 × 200 kW), a battery (1 × 200 kW), a gas micro turbine (1 × 200 kW), a boiler (1 × 800 kW), an electric chiller (1 × 200 kW), an absorption chiller (1 × 800 kW), and a heat exchanger (1 × 900 kW). The ILOG’s CPLEX v.12 optimization solver is utilized for solving the MILP and mixed integer quadratic programming (MIQP) model [46]. The case studies were coded using MATLAB 2013a and YALMIP toolbox, which were used to test the calculation performance [47]. The case studies were run on a PC with Intel(R) Xeon(R) E3-1230 v3 3.30 GHz and 8.00 GB memory.

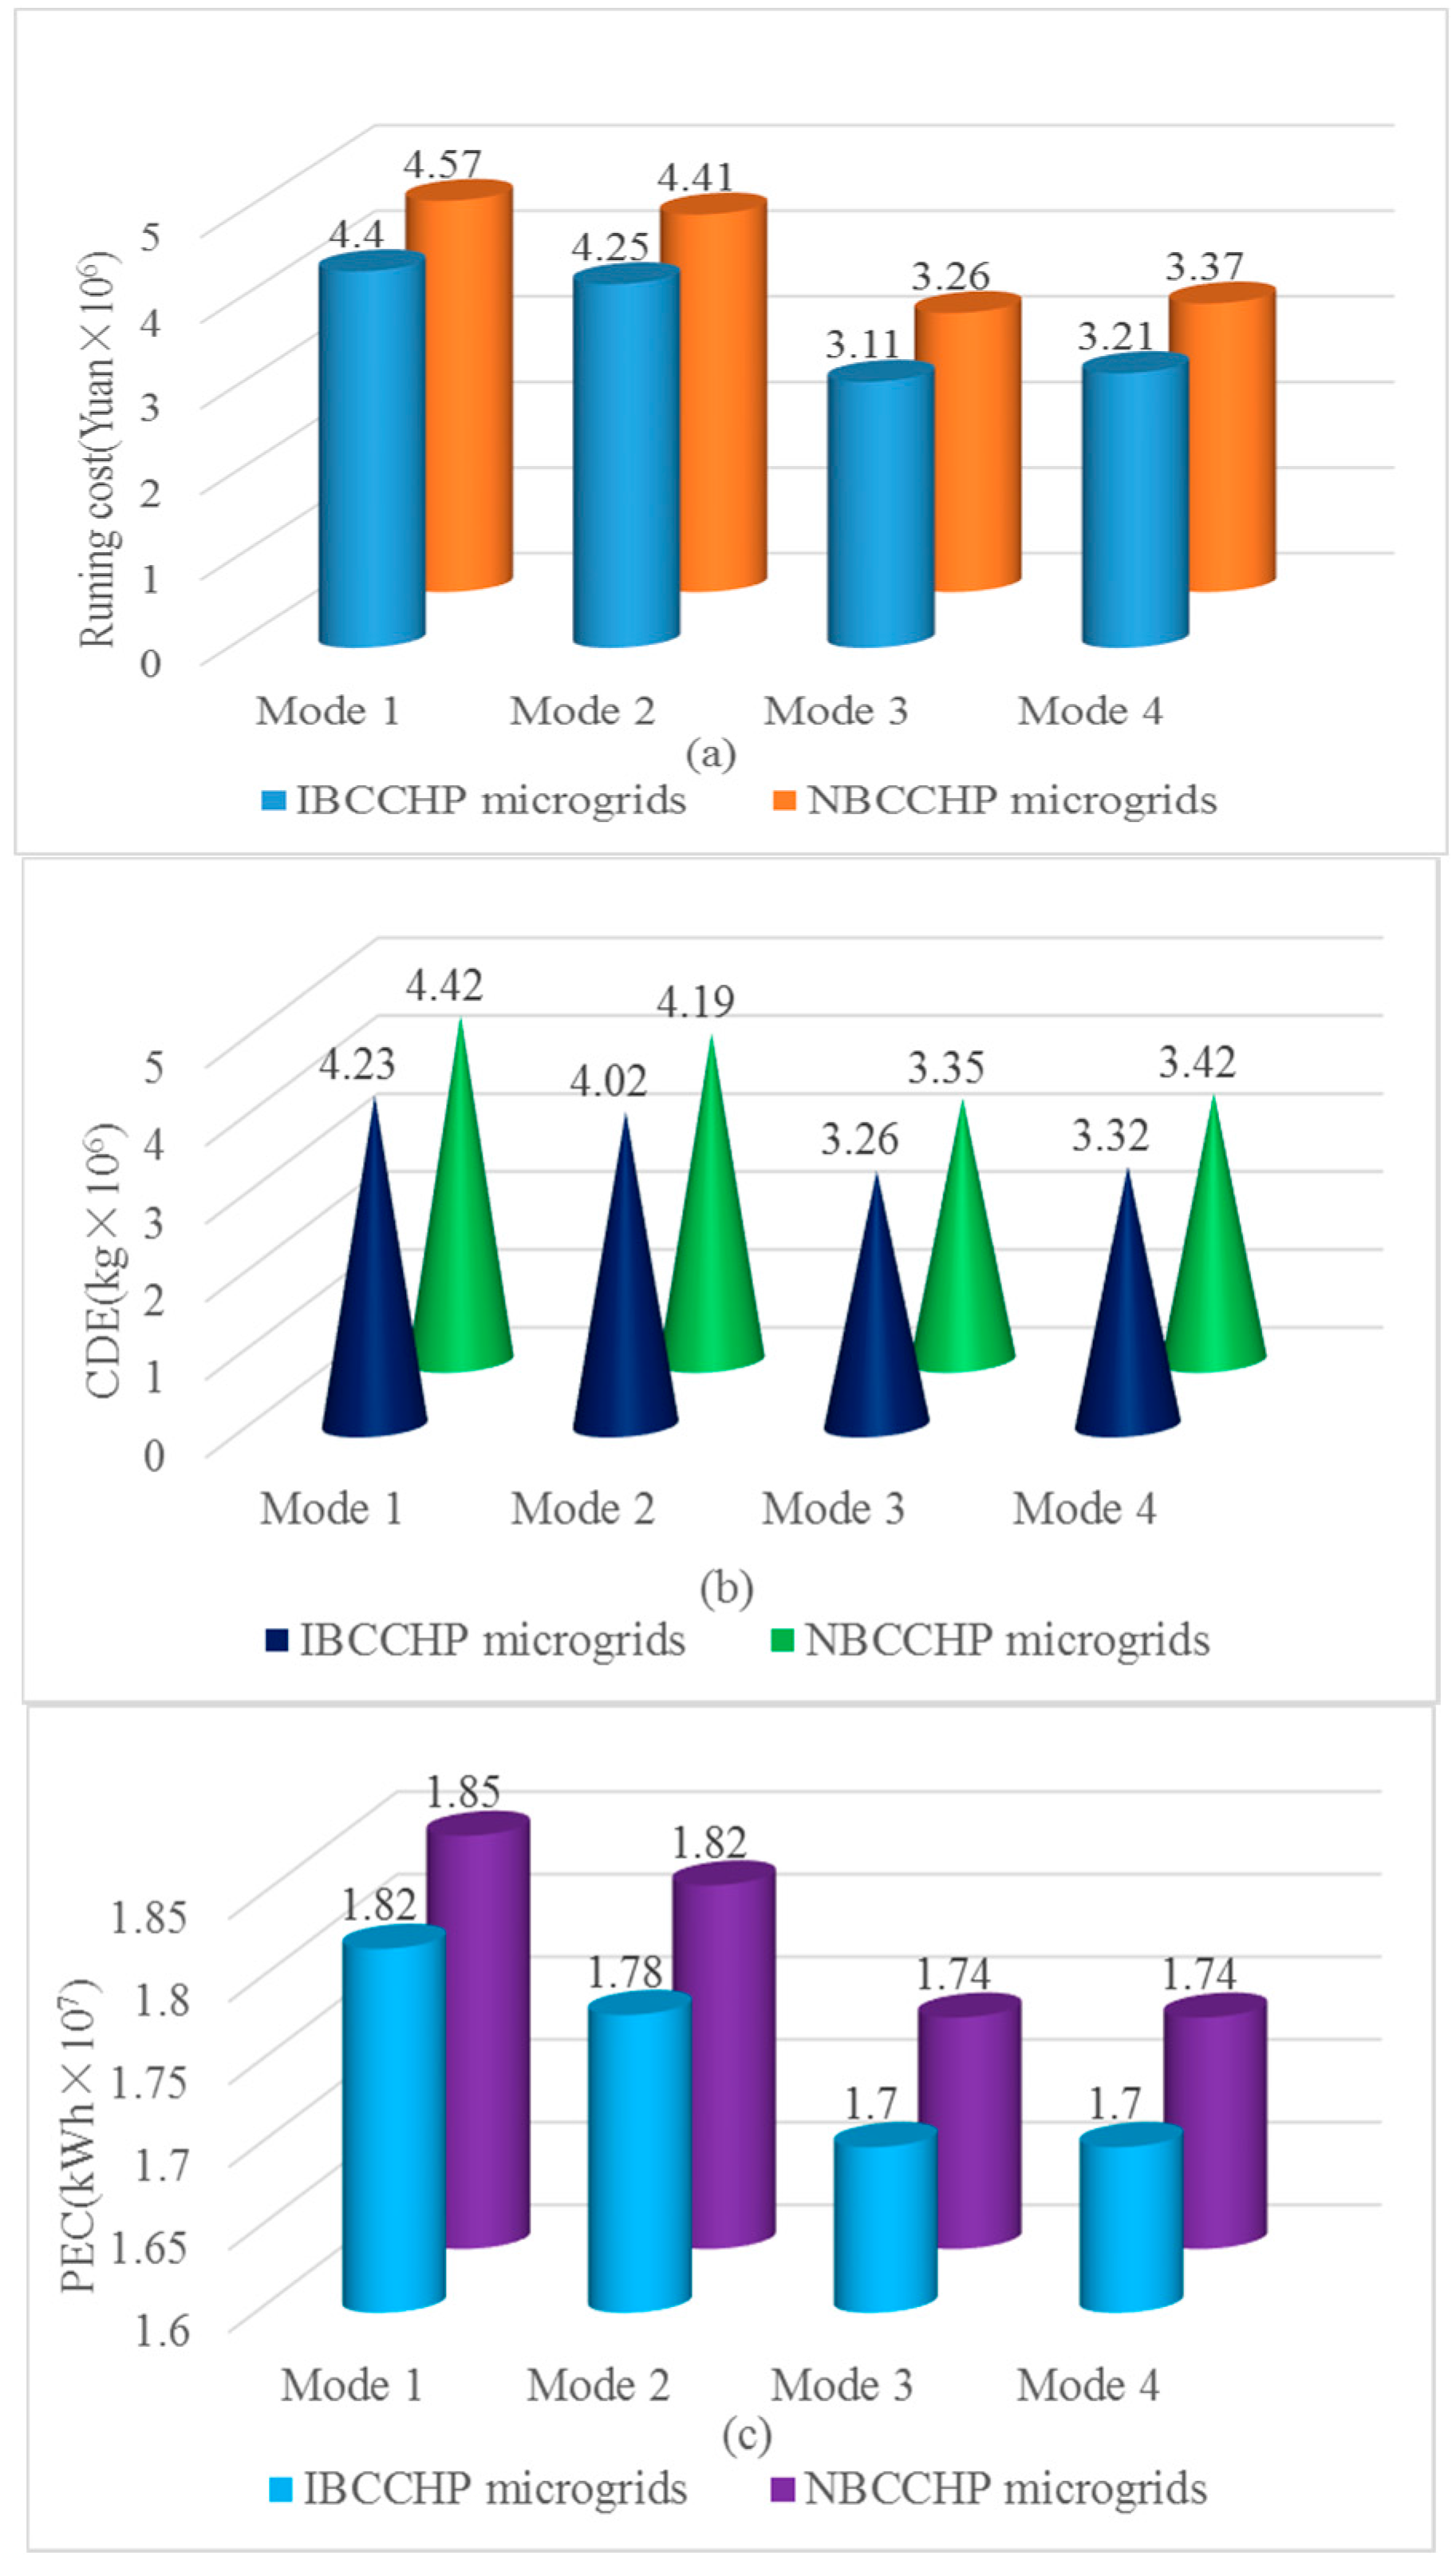
4.2. Result Analysis and Discussions

Figure 5 shows the one-year performance criteria for the IBCCHP microgrids and the NBCCHP microgrids. It can be observed that IBCCHP microgrids are better than NBCCHP microgrids under different operation modes as shown in Figure 5. Mode 3 performs the best of all of the modes, regardless of IBCCHP or NBCCHP microgrids being chosen. Meanwhile, Mode 4 performs better than Mode 2 while Mode 1 performs the worst. Mode 4 represents the development of the smart grid and can reduce subsidies from the government for the new energy policy. The simulation results of Figure 5 can provide a better suggestion for the government to carry out Mode 4 in the future.
Comparing IBCCHP microgrids with NBCCHP microgrids, the annual operation cost is reduced by 1.7 × 10⁵ Yuan, and the CDE and PEC are reduced by 1.9 × 10⁵ kg and 3 × 10⁴ kWh, respectively, in Mode 1. In Mode 2, the annual operation cost is reduced by 1.6 × 10⁵ Yuan, and the CDE and PEC are reduced by 1.7 × 10⁵ kg and 4 × 10⁵ kWh, respectively. In Mode 3, the annual operation cost is reduced by 1.5 × 10⁵ Yuan, and the CDE and PEC reduction are reduced by 9.0 × 10⁴ kg and 4.0 × 10⁵ kWh, respectively. In Mode 4, the annual operation cost is reduced by 1.6 × 10⁵ Yuan, the CDE and PEC reduction are reduced by 1.0 × 10⁵ kg and 4.0 × 10⁵ kWh, respectively.
Additionally, under different operation modes, the annual charge/discharge cycle number of the batteries of the NBCCHP microgrids is larger than IBCCHP microgrids in Figure 6. Through the BCCHP microgrids combined operation, the annual total charge/discharge cycle numbers of the batteries of the IBCCHP microgrids will be decreased, which improve the overall lifetime of the three batteries.
The results presented indicate good potential for IBCCHP microgrids. Comparing IBCCHP microgrids with NBCCHP microgrids, the operational cost and CDE reduction of Mode 2 are almost the same as Mode 1, but the reduction of PEC obviously varies. This is because the power of the PV with the subsidy policy is totally absorbed by the main grid in Mode 2. Excess electricity is not allowed to be sold back to the main grid (Mode 1 and Mode 2), while the operation cost, CDE, and PEC reduction are reduced significantly in Mode 3 or Mode 4, which is because the electricity of IBCCHP microgrids can be sold to sell the main grid, thus gaining considerable benefits, both economically and environmentally. In addition, IBCCHP microgrids can improve the overall lifetime of the three batteries via interconnection among adjacent isolated buildings. Currently, compared with Mode 1 and Mode 2, Mode 3 is widely used in China. However, Mode 3 requires the government to invest substantial subsidies. Mode 3 has an advantage over Mode 4 in term of the reduction of the operation cost, CDE and PEC. From the long term development of PV installation, the policy of subsidy has been gradually cancelled by government. With the development of the Internet of Energy, the power of the PV has been allowed to consume locally. Mode 4 has been accepted by the general public and has been widely applied in China.

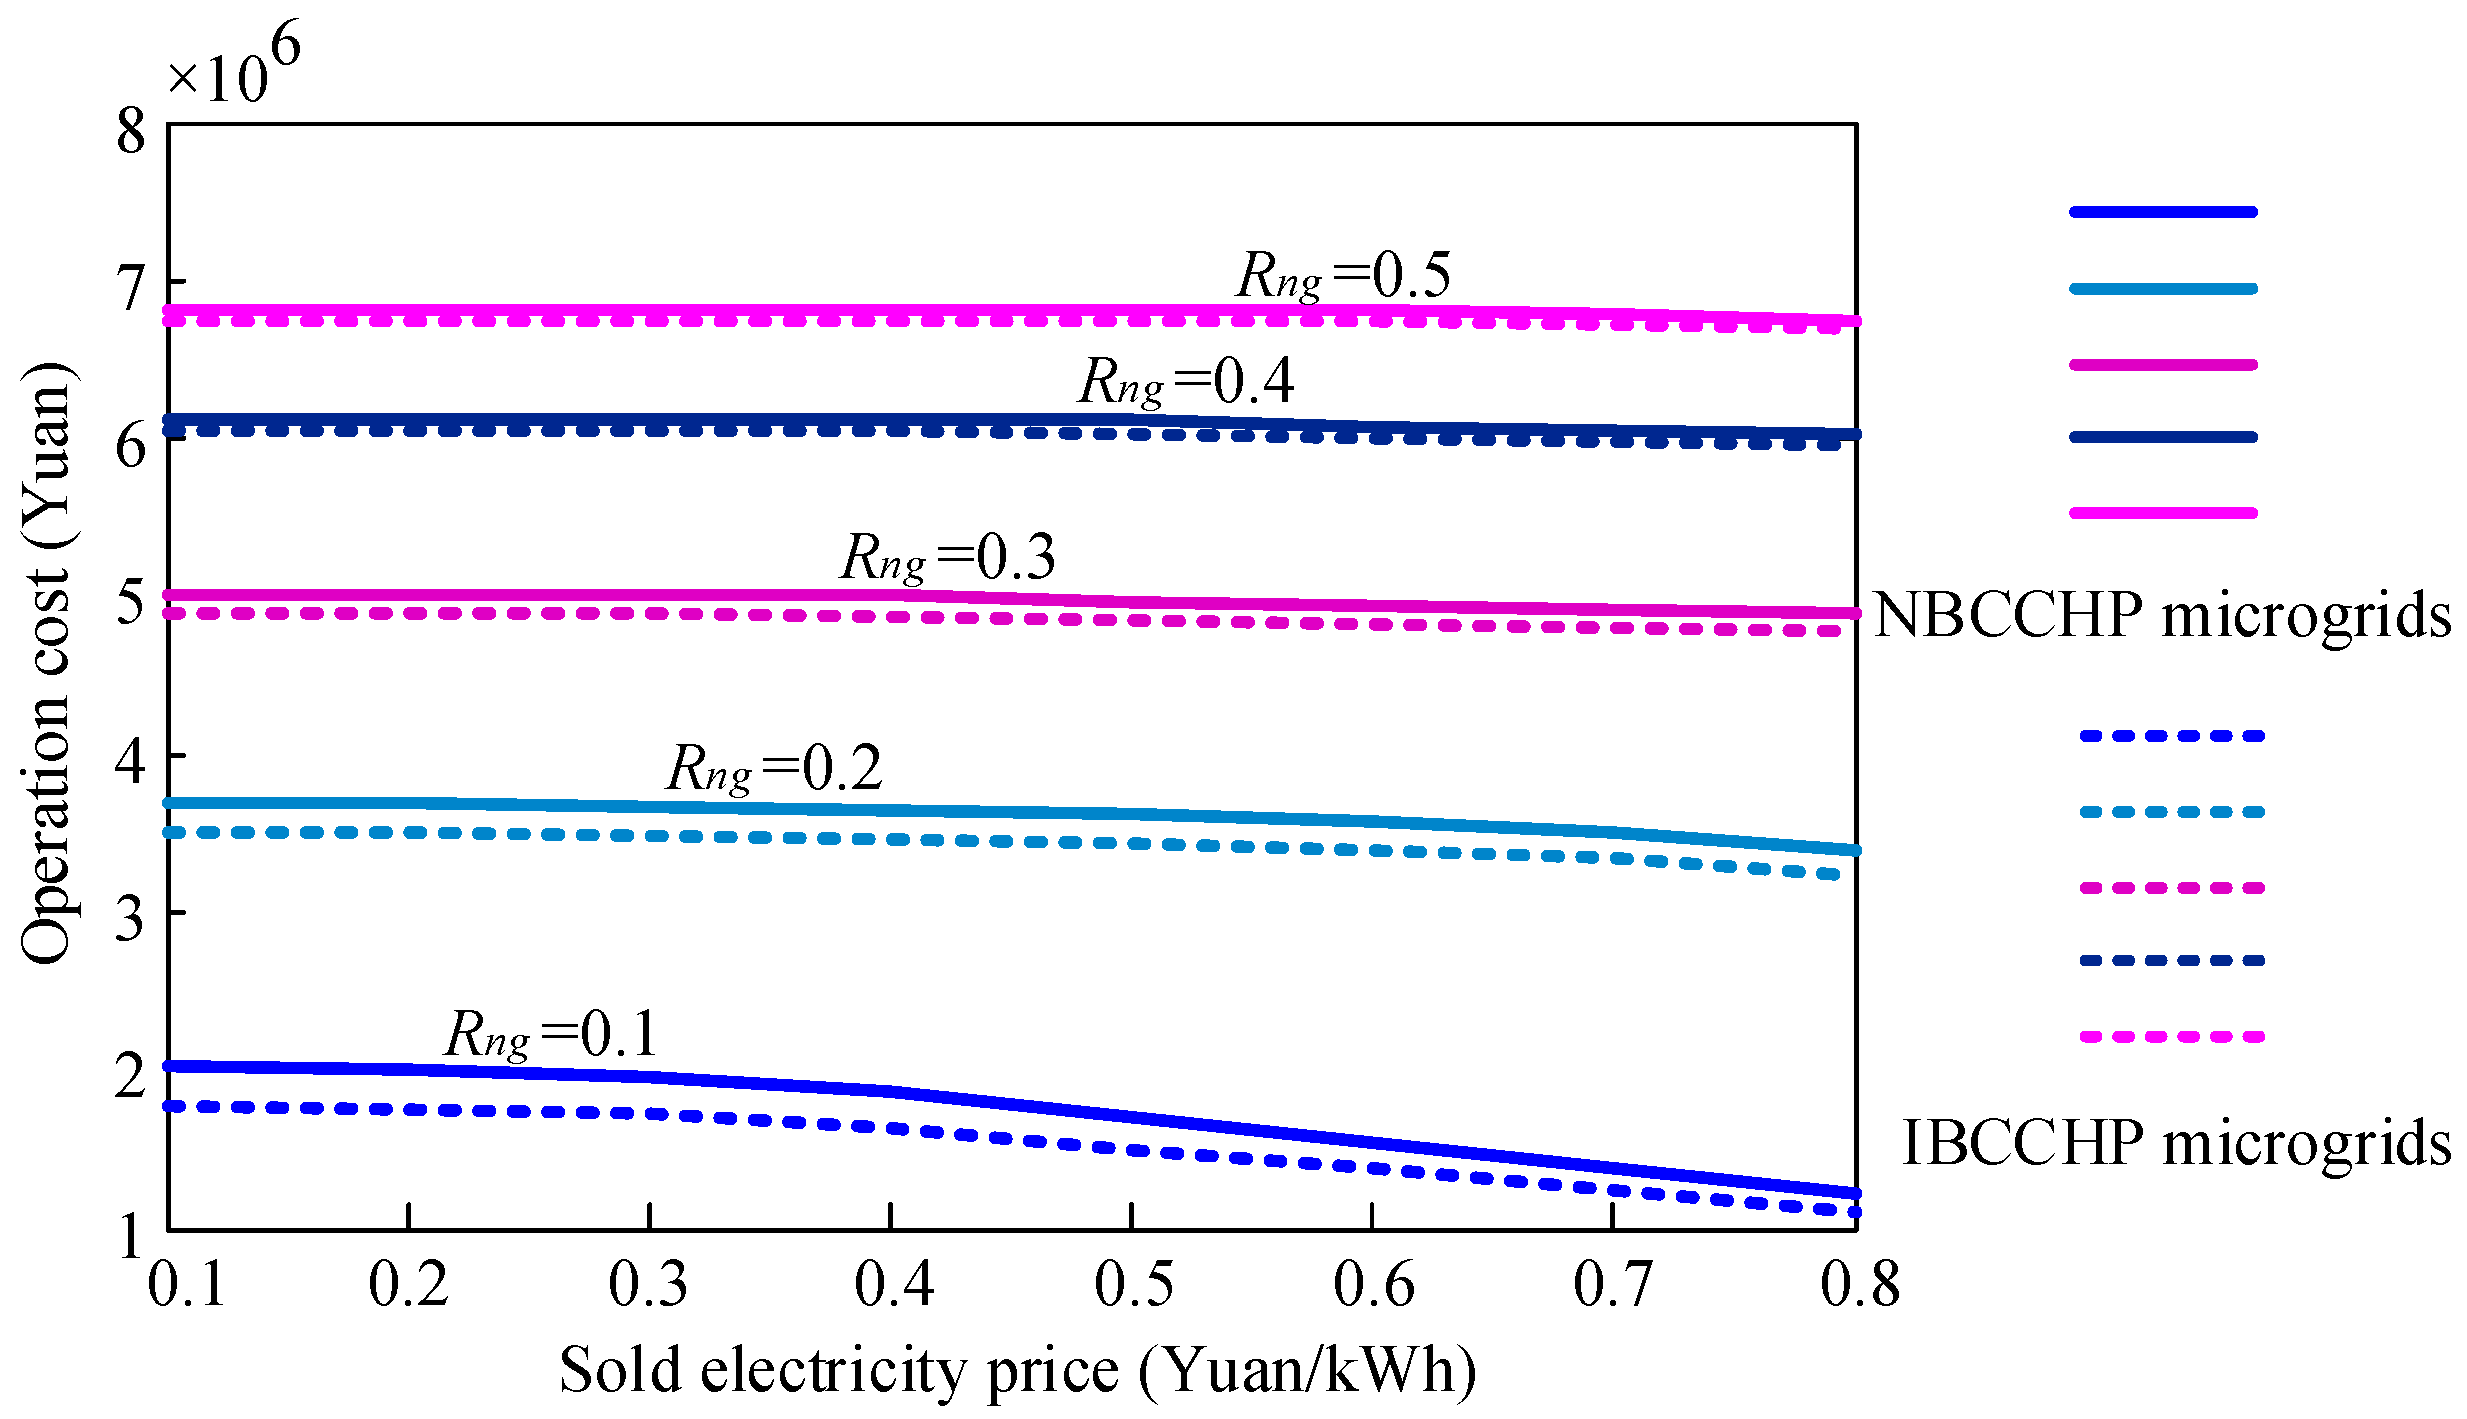
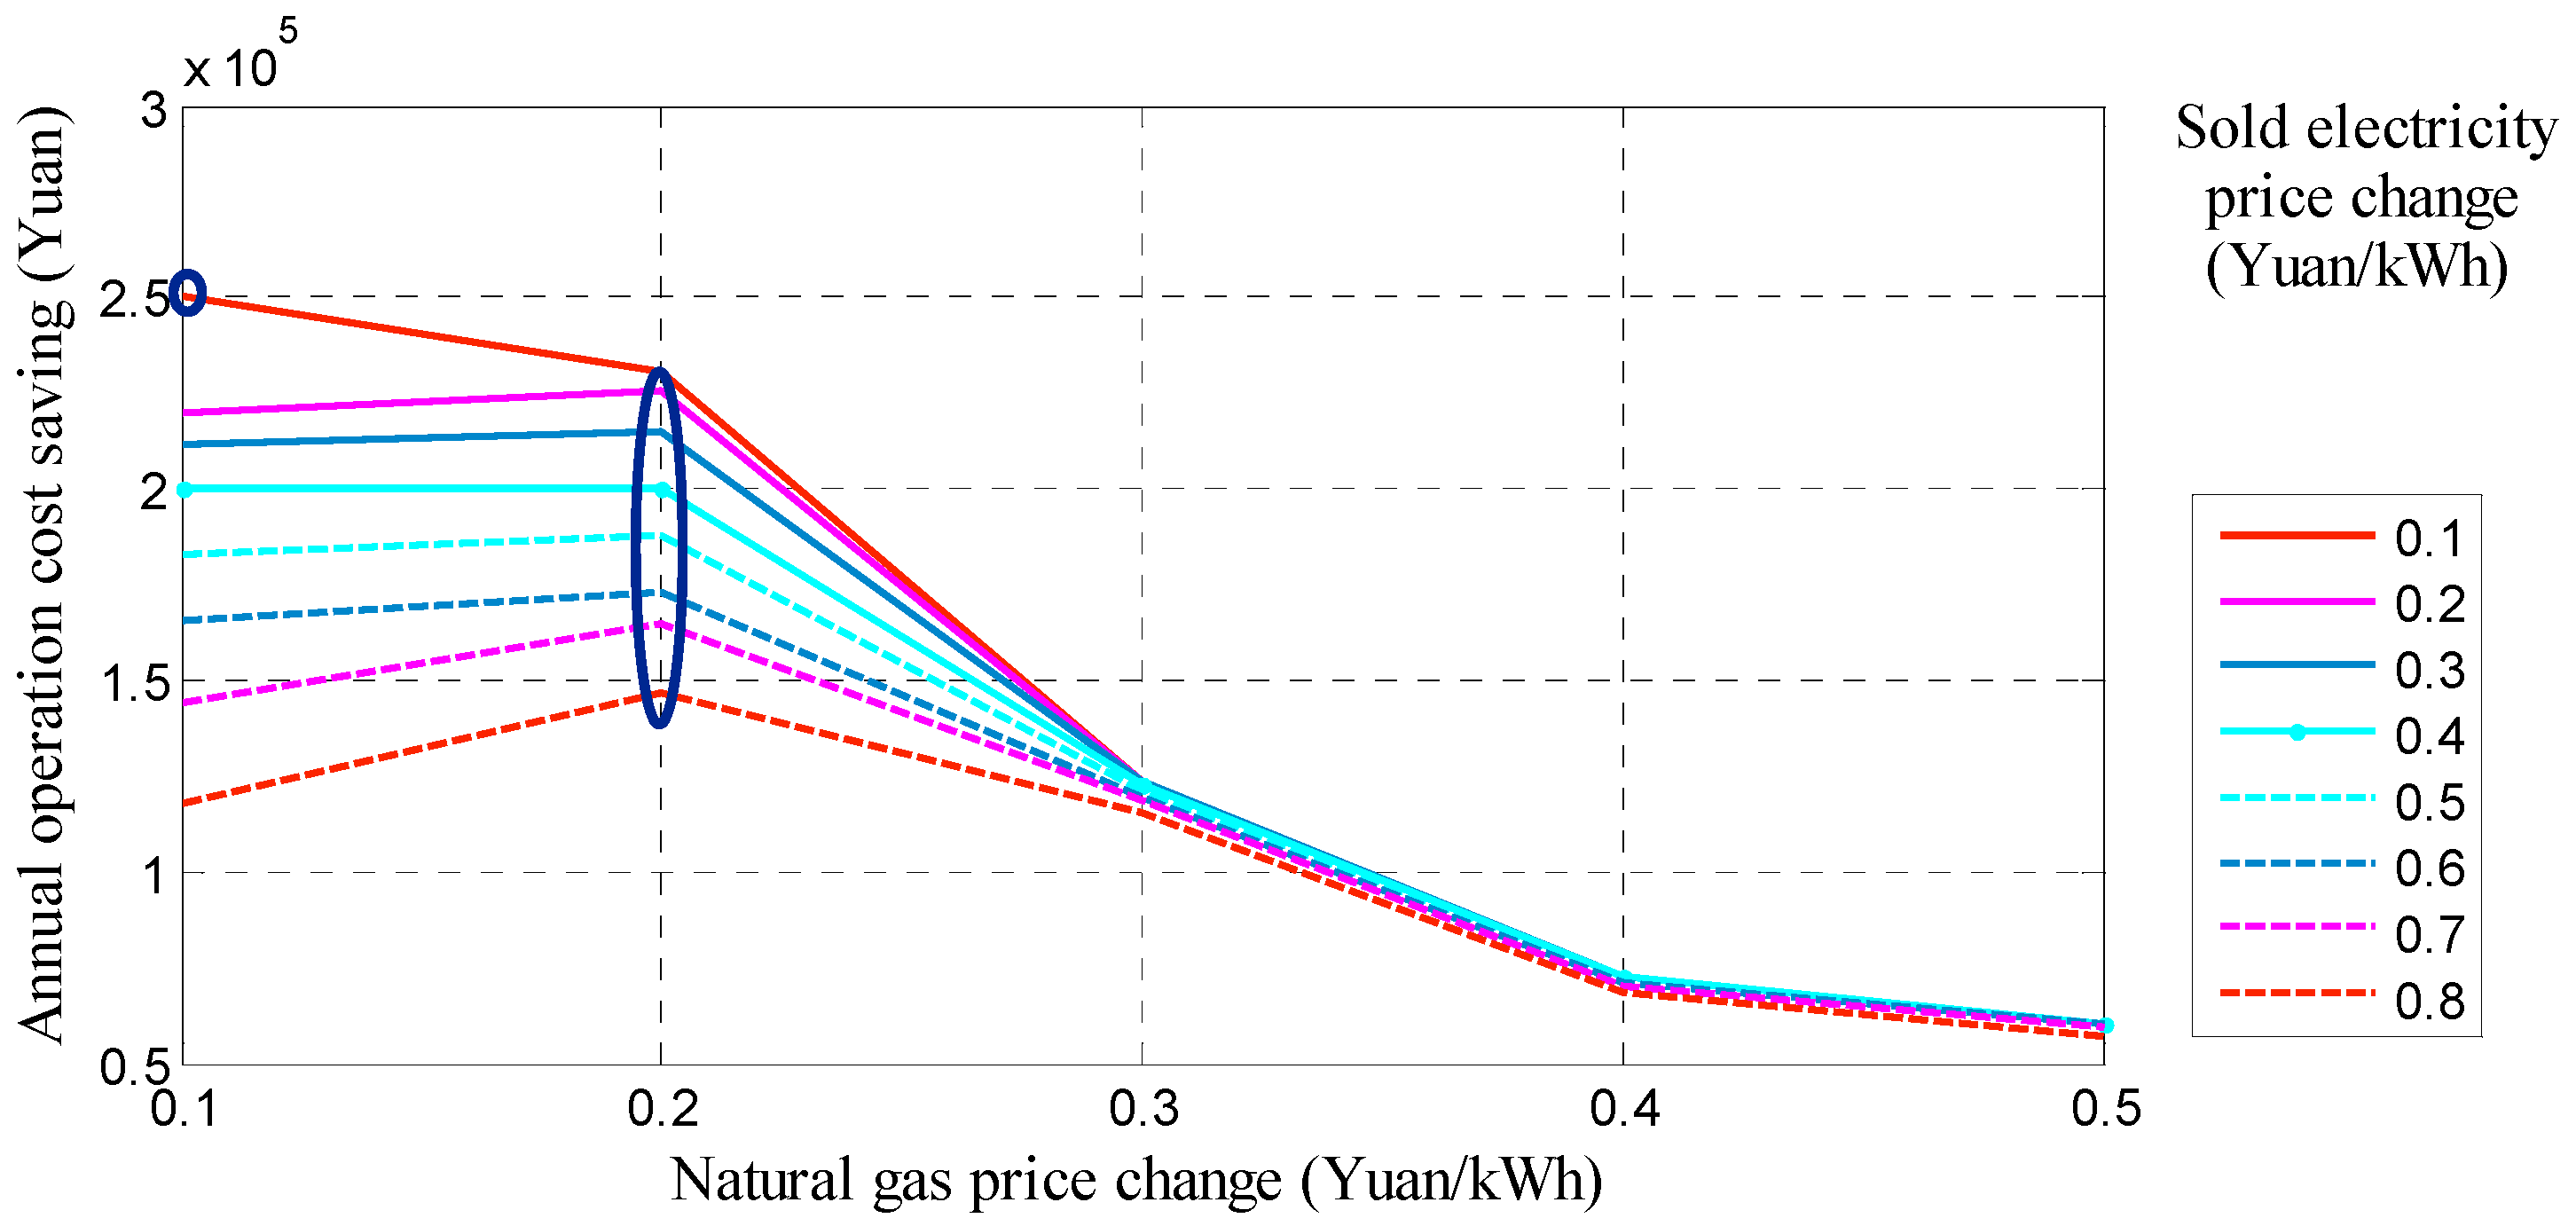
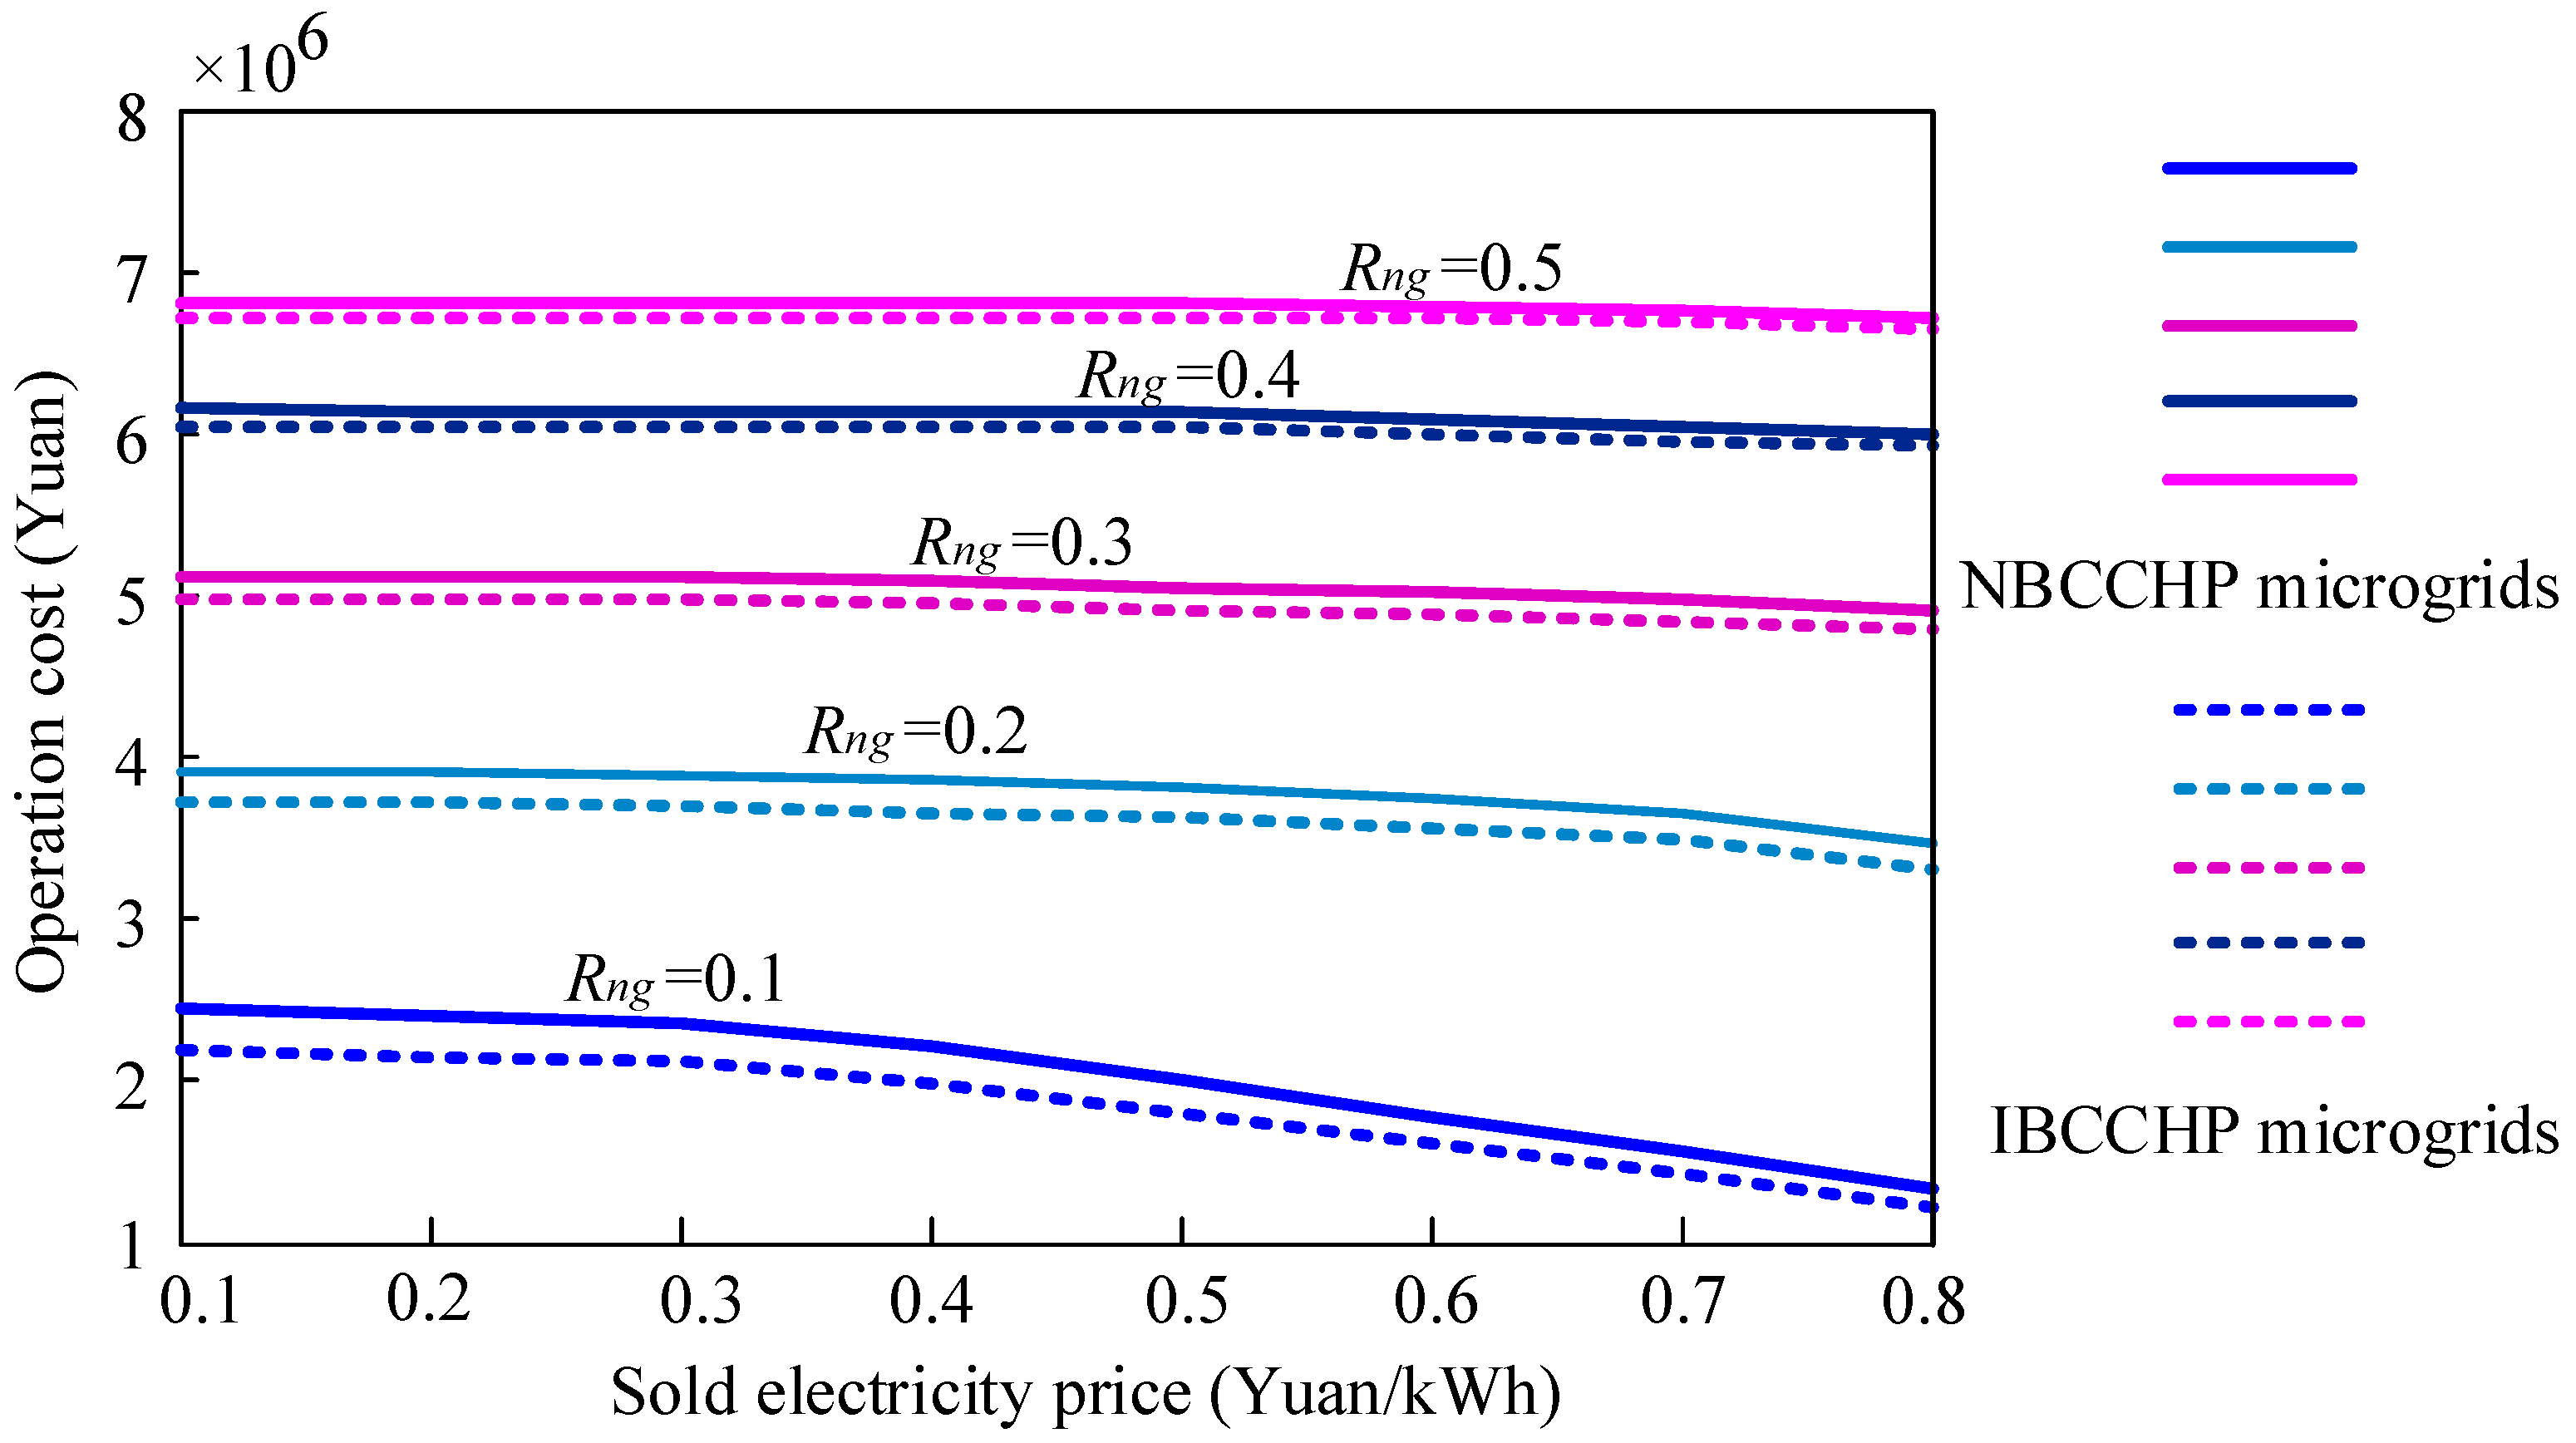
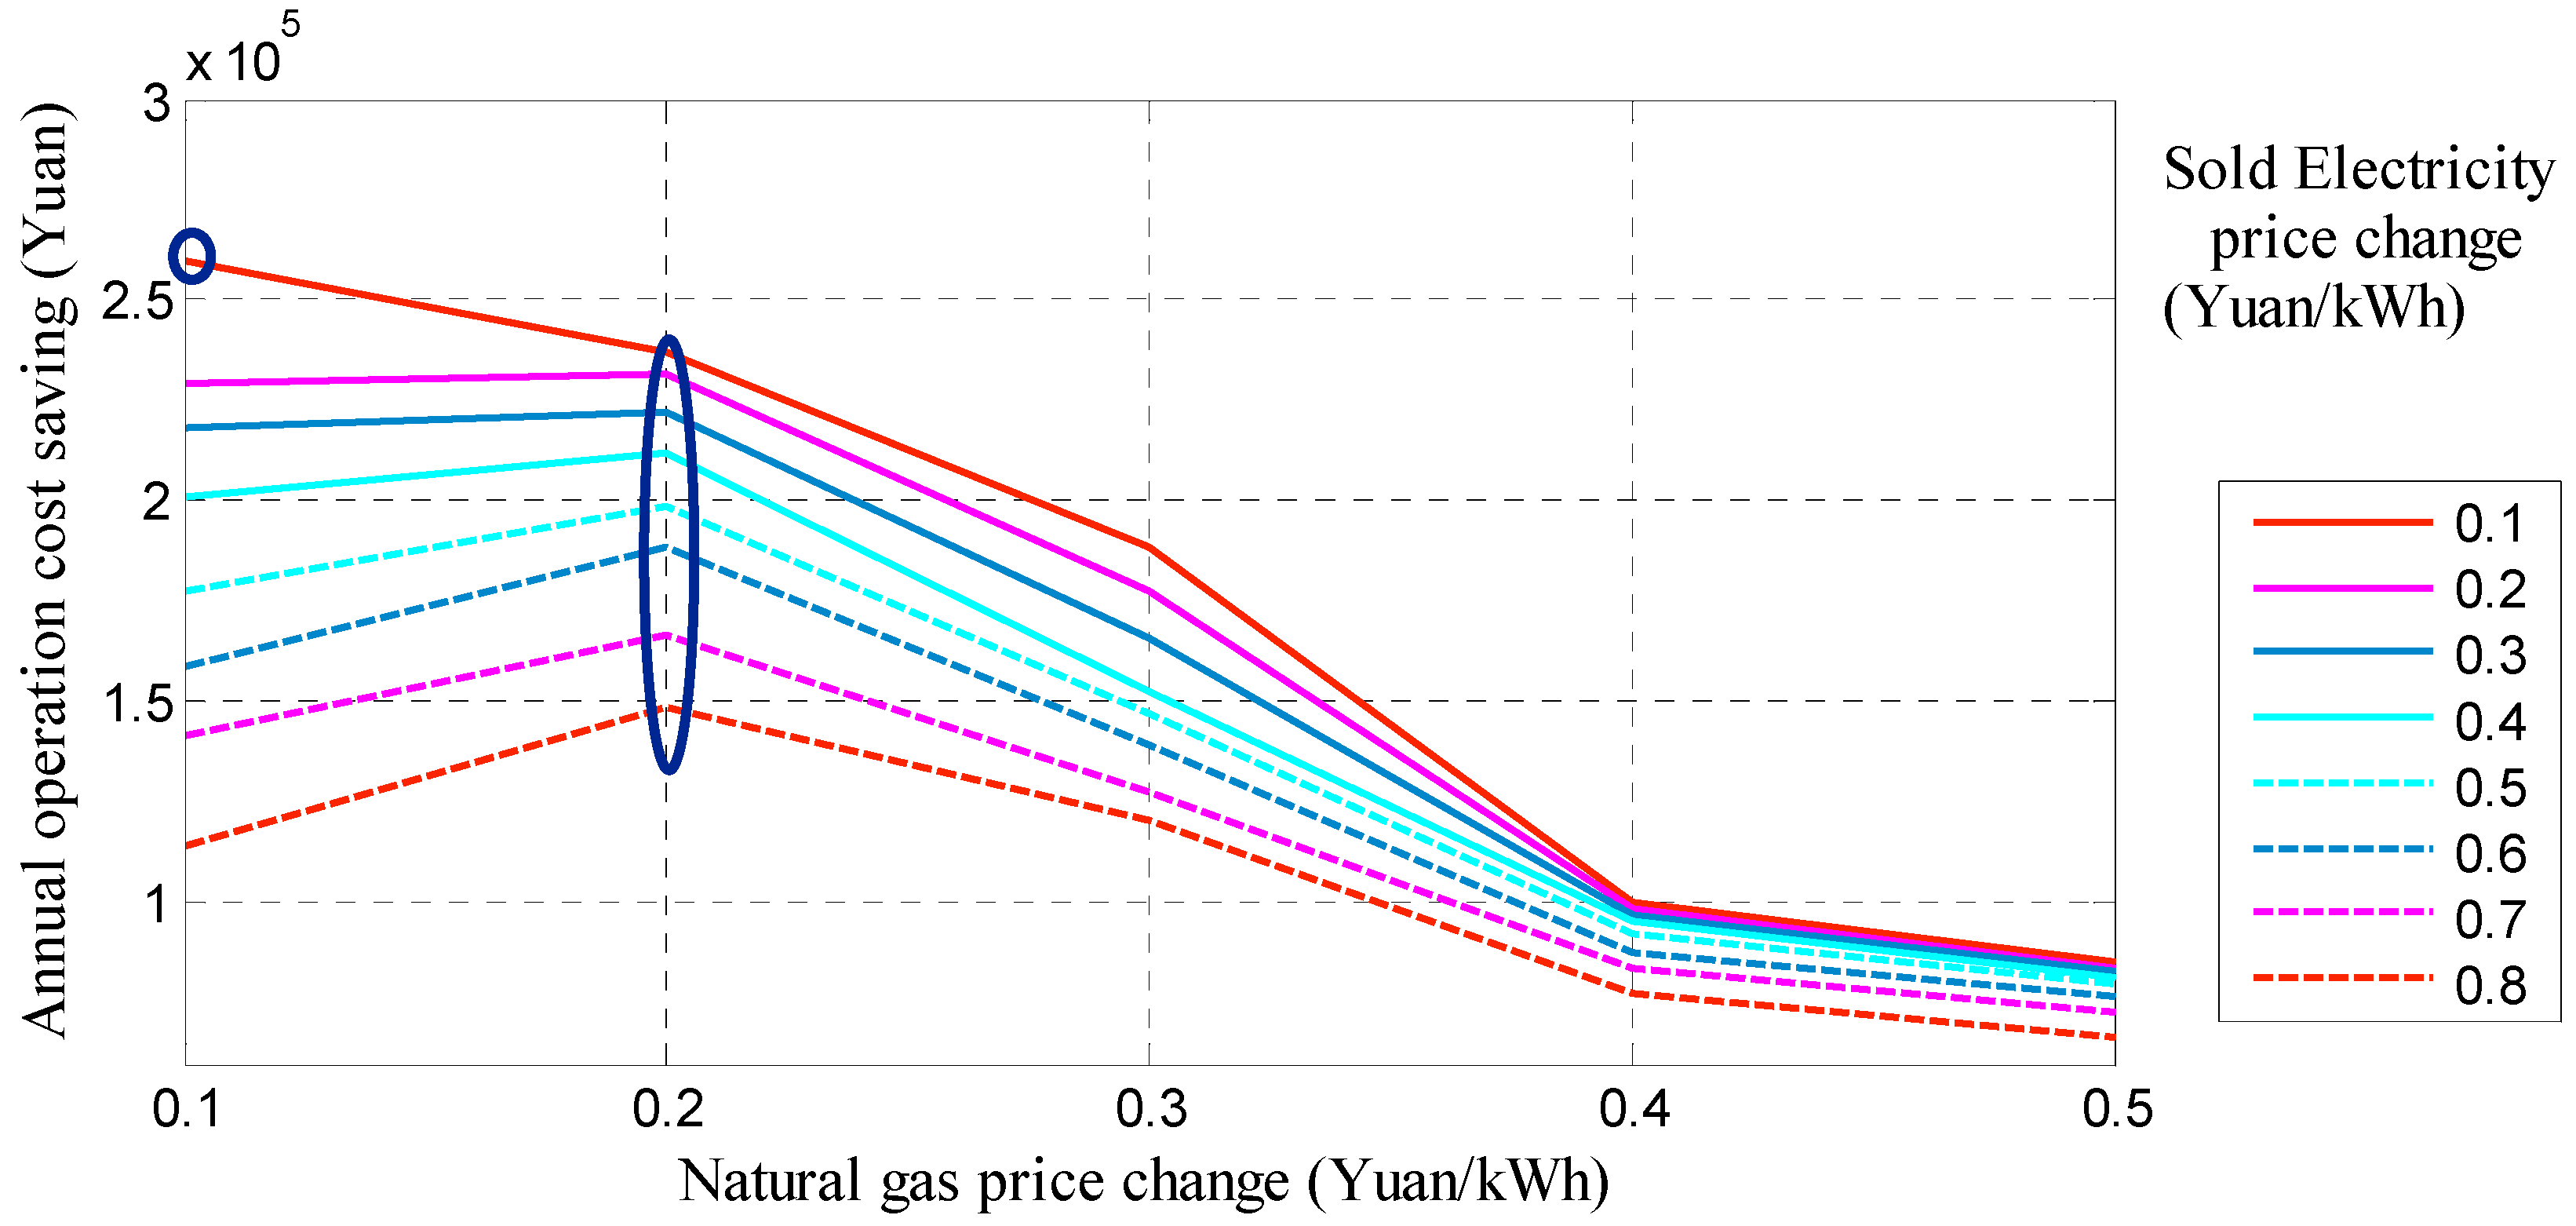
4.3. Sensitivity Analysis

China’s natural gas consumption accounts for approximately 5.1% of the overall energy consumption [48]. Application of IBCCHP microgrids has been widely adopted to optimize China’s energy consumption and to increase the proportion of natural gas used. The prices of electricity sold to the main grid and natural gas may affect the operational cost of IBCCHP microgrids if the equipment selected and their capacities remain unchanged.
This section studies the relationship between operational cost and the prices of electricity sold to the main grid for IBCCHP microgrids and natural gas in Mode 3 or Mode 4. The operational cost of IBCCHP microgrids will be affected by selling electricity to the main grid and the on-site natural gas consumption and by their prices. When the operational strategy of a CCHP microgrids is designed, only the operation cost fluctuates with the change of the price of electricity sold to the grid and the gas price. Similarly, comparison of the annual operational cost saving of IBCCHP microgrids and NBCCHP microgrids is defined to analyze the sensitivity.
In the optimal design, the electricity prices are selected to determine the optimal economic performance, which is regarded as the baseline of the electricity price. Then, the selling electricity price increases from 0.1 to 0.8 Yuan/kWh, and the natural gas price changes from 0.1 to 0.5 Yuan/kWh. In Mode 3, the changes of the annual operational cost of IBCCHP microgrids or NBCCHP microgrids with the selling electricity price and natural gas price are displayed in Figure 7. It can be clearly seen that the annual operational cost saving decreases with the increase of the selling electricity price when at the same natural gas price for IBCCHP microgrids or NBCCHP microgrids. Different simulation results and conclusions are also obtained when the selling price changes at the same rate as the natural gas price.
Through subtracting the value of IBCCHP microgrids from NBCCHP microgrids in Figure 7, Figure 8 is obtained. It can be seen in Figure 8 that the annual operation cost saving increases, then reaches the maximum value and then decreases when the natural gas price is 0.2 Yuan/kWh, except that the natural gas price is 0.1 Yuan /kWh in Mode 3.
It is also shown in Figure 9 that the annual operational cost of IBCCHP microgrids and NBCCHP microgrids has the same trend in Mode 4. It should be noted that, with the increase of the selling price, the annual operational cost saving continues to decrease. Under the same natural gas price of 0.3, 0.4 and 0.5, the selling price has little impact on the annual operational cost saving. It is also obtained that the annual operational cost saving has the same trend in Mode 4. Compared with Mode 3, Mode 4’s annual operational cost saving reaches the maximum value under a different selling electricity price when the natural gas price is 0.2 Yuan/kWh, as shown in Figure 10. However, the selling price has a significant impact on the annual operational cost saving when the natural gas price is 0.3, 0.4 and 0.5 Yuan/kWh.
The third energy revolution is Internet-based energy. China can encourage BCCHP microgrids to interconnect with each other under the current energy policy. The government promotes the application of this technology early in higher electricity sales to better improve the environment. Operational cost savings increase with the decrease of the selling electricity price when the price of China’s natural gas is 0.2 Yuan/kWh. Meanwhile, these results can provide a base policy to reduce future government subsidy.

5. Conclusions

In this paper, the performances of IBCCHP microgrids and NBCCHP microgrids for different operational modes (including the operational cost, PEC, and CDE reduction) were evaluated by using an economic dispatching model incorporating piecewise linear efficiency curves model. The main feature of this system is that the BCCHP microgrids can be interconnected according to the users’ energy requirements. The BCCHP microgrids can provide energy support among buildings and obtain more profits both in economic and environmental aspects. The effectiveness of the proposed method has been demonstrated, through a case study of three buildings with CCHP microgrids in Shanghai, and the optimal analysis in this paper leads to the following conclusions.
In general, there is not a common trend among the three optimization modes presented in this paper. Optimizing all systems may bring about an inconsistent benefit reduction or improvement for each building, which can be attributed to the variation of the building loads, electricity and fuel cost, and carbon dioxide emission factors for the different modes. For these modes, the reduction of PEC reduces the CDE, and the operational cost always decreases when compared to the corresponding independent buildings with CCHP microgrids. The running cost, CDE, and PEC reduction will significantly change when electricity is allowed to be sold back to the main grid, which will bring a gain of considerable economic and environment benefits.
The model presented in this paper can be used for adjacent building with CCHP microgrids. It is believed that if this strategy is applied correctly and combined with other elements, such as benefit assignment, it can become a powerful and effective tool for the fundamental design of BCCHP microgrids.

Acknowledgments

This work was supported by the National Science Foundation of China (grant No. 51277027), the National Science and Technology Support Program of China (grant No. 2015BAA01B01), and the State Grid Corporation of China (grant No. SGTYHT/14-JS-188).

Author Contributions

All authors contributed to this work. In particular, Zhao Luo and Wei Gu had the original idea for the study, and coauthors conceived and designed the experiments. Yong Sun analyzed the data. Xiang Yin drafted the manuscript, which was revised by Zhao Luo, Wei Gu, Yong Sun, Xiang Yin, Yiyuan Tang and Xiaodong Yuan. All authors have read and approved the final manuscript.

Conflicts of Interest

the authors declare no conflict of interest.

Abbreviations

BCCHPBuilding combined cooling; heating and power
IBCCHPInterconnected-Building combined cooling; heating and power
NBCCHPNon-interconnected-Building combined cooling; heating and power
TSTThermal storage tank
COPCoefficient of performance
CDECarbon dioxide emissions reduction
PECPrimary energy consumption
ACabsorption chiller
ECelectric chiller
ii-th BCCHP microgrids
P p v t The output power of the PV in interval t (kW)
P l t The electricity needed by the users in interval t (kW)
H h t The thermal needed by the users in interval t (kW)
Q c t The cooling needed by the users in interval t (kW)
F m t The fuel consumption of the MT
P m t t Power produced by MT in interval t (kW)
H m t t Thermal power supplied by the MT in interval t (kW)
F b The fuel consumption of the boiler
H b t The power output of the gas boiler in interval t (kW)
P g r i d t Power absorbed from grid by microgrid in interval t (kW)
P e x c e s s t Power sent to grid by microgrid in interval t (kW)
W b t t Battery energy in interval t (kWh)
P b t , c h r t Charge power of the battery in interval t (kW)
P b t , d i s t Discharge power of the battery in interval t (kW)
H t s t t TST energy in interval t (kWh)
H t s t , c h r t Thermal power stored by TST in interval t (kW)
H t s t , d i s t Thermal power released by TST in interval t (kW)
P e c t Electricity demand of electric chiller when handling the users’ cooling requirement in interval t (kW)
A m t k The coefficient of the thermal and electrical efficiency curve
B m t k The block limit of the thermal and electrical efficiency curve
g m t k The slope of block k of the thermal and electrical efficiency curve
v m t t , k The binary variable encoding the thermal and electrical efficiency curve of the MT
LmtThe index set of the piecewise linear thermal and electrical efficiency curve
C n g t The natural gas cost (Yuan)
C g r i d t Purchased electricity cost (Yuan)
C e x c e s s t Sold electricity profits(Yuan) (Yuan)
C b t t Aging cost function of battery (Yuan)
C p v t PV subsidy (Yuan)
R n g t The tariff for natural gas (Yuan/kWh)
R g r i d t The tariff for purchasing power from the main grid (Yuan/kWh)
R e x c e s s t The tariff for selling power to the main grid (Yuan/kWh)
R p v t Subsidy prices of the PV (Yuan/kWh)
R b t t The charge/discharge of battery cycles cost (Yuan/per time)
R n g Heating value of natural gas (kWh/m3)
η b The efficiency of gas boiler
η h e Heat exchangers efficiency
η h r Heat recovery system efficiency
σ b t The energy loss rate of the battery
η b t c h r Charge efficiency of the battery
η b t d i s Discharge efficiency of the battery
σ t s t The energy loss rate of the TST
η t s t c h r Charge efficiency of the TST
η t s t d i s Discharge efficiency of the TST
C O P a c Coefficient of the performance of the absorption chiller
C O P e c Coefficient of the performance of the electric chiller
α, βFuel-to-electric-energy conversion parameter
μ f The emission factors of natural gas
μ e The emission factors of electricity
k f The site-to-primary energy conversion factors for fuel
k e The site-to-primary energy conversion factors for electricity
U m t t Binary variable that is equal to 1 if MT is on in period t and 0 otherwise
U b t , c h r t The charge state of the battery
U b t , d i s t The discharge state of the battery
U t s t , c h r * t The status-transfer flag of the charging of the battery
U t s t , d i s * t The status-transfer flag of the discharging of the battery
U t s t , c h r t The charge state of TST
U t s t , d i s t The discharge state of TST

References

  1. Huang, A.Q.; Crow, M.L.; Heydt, G.T.; Zheng, J.P.; Dale, S.J. The Future Renewable Electric Energy Delivery and Management (FREEDM) System: The Energy Internet. Proc. IEEE 2011, 99, 133–148. [Google Scholar] [CrossRef]
  2. Liang, H.; Long, W. Future energy system in low-carbon community-energy internet. In Proceedings of the IEEE International Conference Computer Distributed Control and Intelligent Environmental Monitoring (CDCIEM), Changsha, China, 19–20 February 2011; pp. 227–230.
  3. Bui, N.; Castellani, A.P.; Casari, P.; Zorzi, M. The internet of energy: A web-enabled smart grid system. IEEE Netw. 2012, 26, 9–45. [Google Scholar] [CrossRef]
  4. Zhou, Z.; Yang, S.; Shao, Z. Energy Internet: The business perspective. Appl. Energy 2016, 178, 212–222. [Google Scholar] [CrossRef]
  5. Granel, C.; Havlik, D.; Schade, S.; Sabeur, Z.; Delaney, C. Future Internet technologies for environmental applications. Environ. Model. Softw. 2016, 78, 1–15. [Google Scholar] [CrossRef]
  6. Felix, F.; Varaiya, P.; Hui, S. Smart Grids with Intelligent Periphery: An Architecture for the Energy Internet. Engineering 2015, 1, 436–446. [Google Scholar]
  7. Wang, H.; Abdollahi, E.; Lahdelma, R.; Jiao, W.; Zhou, Z. Modelling and optimization of the smart hybrid renewable energy for communities (SHREC). Renew. Energy 2015, 34, 365–366. [Google Scholar] [CrossRef]
  8. Lund, H.; Werner, S.; Wiltshire, R.; Svendsen, S.; Thorsen, J.E.; Hvelplund, F.; Mathiesen, B.V. 4th Generation District Heating (4GDH): Integrating smart thermal grids into future sustainable energy systems. Energy 2014, 68, 1–11. [Google Scholar] [CrossRef]
  9. Lund, R.; Mohammadi, S. Choice of insulation standard for pipe networks in 4th generation district heating systems. Appl. Therm. Eng. 2015, 98, 156–157. [Google Scholar] [CrossRef]
  10. Xue, Y. Energy internet or comprehensive energy network? J. Mod. Power Syst. Clean Energy 2015, 3, 297–301. [Google Scholar] [CrossRef]
  11. Yang, H.; Xiong, T.; Qiu, J.; Qiu, D.; Dong, Z.Y. Optimal operation of DES/CCHP based regional multi-energy prosumer with demand response. Appl. Energy 2015, 167, 353–365. [Google Scholar] [CrossRef]
  12. Sustainable Buildings. Available online: http://www.iea.org/topics/energyefficiency/subtopics/sustainablebuildings/ (accessed on 7 September 2016).
  13. Chwieduk, D. Towards sustainable-energy buildings. Appl. Energy 2003, 76, 211–217. [Google Scholar] [CrossRef]
  14. Green Building. Available online: http://www.epa.gov/greenbuilding/index.htm (accessed on 7 September 2016).
  15. Cai, W.; Wu, Y.; Zhong, Y.; Ren, H. China building energy consumption: Situation, challenges and corresponding measures. Energy Policy 2009, 37, 2054–2059. [Google Scholar] [CrossRef]
  16. Deng, J.; Wang, R.; Han, G. A review of thermally activated cooling technologies for combined cooling, heating and power systems. Prog. Energy Combust. Sci. 2011, 37, 172–203. [Google Scholar] [CrossRef]
  17. Cho, H.; Mago, P.; Luck, R.; Chamra, L. Evaluation of CCHP systems performance based on operational cost, primary energy consumption, and carbon dioxide emission by utilizing an optimal operation scheme. Appl. Energy 2009, 86, 2540–2549. [Google Scholar] [CrossRef]
  18. Liu, M.; Shi, Y.; Fang, F. A new operation strategy for CCHP systems with hybrid chillers. Appl. Energy 2012, 95, 164–173. [Google Scholar] [CrossRef]
  19. Zhang, X.; Karady, G.G.; Ariaratnam, S.T. Optimal allocation of CHP-Based distributed generation on urban energy distribution networks. IEEE Trans. Sustain. Energy 2014, 5, 246–253. [Google Scholar] [CrossRef]
  20. Arcuri, P.; Florio, G.; Fragiacomo, P. A mixed integer programming model for optimal design of trigeneration in a hospital complex. Energy 2007, 32, 1430–1447. [Google Scholar] [CrossRef]
  21. Gu, W.; Wu, Z.; Bo, R.; Liu, W.; Zhou, G.; Chen, W.; Wu, Z.J. Modeling, planning and optimal energy management of combined cooling, heating and power microgrid: A review. Int. J. Electr. Power Energy Syst. 2014, 54, 26–37. [Google Scholar] [CrossRef]
  22. Mago, P.J.; Smith, A.D. Evaluation of the potential emissions reductions from the use of CHP systems in different commercial buildings. Build. Environ. 2012, 53, 74–82. [Google Scholar] [CrossRef]
  23. Wang, J.J.; Zhai, Z.; Jing, Y.; Zhang, C. Environmental impact analysis of BCHP system in different climate zones in China. Energy 2010, 35, 4208–4216. [Google Scholar] [CrossRef]
  24. Wang, J.J.; Xu, Z.L.; Jin, H.G.; Shi, G.H.; Fu, C. Design optimization and analysis of a biomass gasification based BCHP system: A case study in Harbin, China. Renew. Energy 2014, 71, 572–583. [Google Scholar] [CrossRef]
  25. Mago, P.J.; Fumo, N.; Chamra, L.M. Performance analysis of CCHP and CHP systems operating following the thermal and electric load. Int. J. Energy Res. 2009, 33, 852–864. [Google Scholar] [CrossRef]
  26. Chicco, G.; Mancarella, P. A unified model for energy and environmental performance assessment of natural gas-fueled poly-generation systems. Energy Convers. Manag. 2008, 49, 2069–2077. [Google Scholar] [CrossRef]
  27. Rong, A.; Lahdelma, R. An efficient linear programming model and optimization algorithm for trigeneration. Appl. Energy 2005, 82, 40–63. [Google Scholar] [CrossRef]
  28. Guo, L.; Liu, W.J.; Cai, J.J.; Hong, B.; Wang, C. A two-stage optimal planning and design method for combined cooling, heat and power microgrid system. Energy Convers. Manag. 2013, 74, 433–445. [Google Scholar] [CrossRef]
  29. Savola, T.; Fogelholm, C.J. MINLP optimisation model for increased power production in small-scale CHP plants. Appl. Therm. Eng. 2007, 27, 89–99. [Google Scholar] [CrossRef]
  30. Sashirekha, A.; Pasupuleti, J.; Moin, N.H.; Tan, C.S. Combined heat and power (CHP) economic dispatch solved using Lagrangian relaxation with surrogate subgradient multiplier updates. Int. J. Electr. Power Energy Syst. 2013, 44, 421–430. [Google Scholar] [CrossRef]
  31. Subbaraj, P.; Rengaraj, R.; Salivahanan, S. Enhancement of combined heat and power economic dispatch using self-adaptive real-coded genetic algorithm. Appl. Energy 2009, 86, 915–921. [Google Scholar] [CrossRef]
  32. Wu, Z.; Gu, W.; Wang, R.; Yuan, X.; Liu, W. Economic optimal schedule of CHP microgrid system using chance constrained programming and particle swarm optimization. In Proceedings of the Power and Energy Society General Meeting, Detroit, MI, USA, 24–29 July 2011; Volume 35, pp. 1–11.
  33. Mohammadi-Ivatloo, B.; Moradi-Dalvand, M.; Rabiee, A. Combined heat and power economic dispatch problem solution using particle swarm optimization with time varying acceleration coefficients. Electr. Power Syst. Res. 2013, 95, 9–18. [Google Scholar] [CrossRef]
  34. Bischi, A.; Taccari, L.; Maetelli, E.; Amaldi, E.; Manzolini, G. A detailed MILP optimization model for combined cooling, heat and power system operation planning. Energy 2014, 74, 12–26. [Google Scholar] [CrossRef]
  35. Milan, C.; Stadler, M.; Cardoso, G.; Mashayekh, S. Modeling of non-linear CHP efficiency curves in distributed energy systems. Appl. Energy 2015, 148, 334–347. [Google Scholar] [CrossRef]
  36. Wang, H.; Yin, W.; Abdollahi, E.; Lahdelma, R.; Jiao, W. Modelling and optimization of CHP based district heating system with renewable energy production and energy storage. Appl. Energy 2015, 159, 401–421. [Google Scholar] [CrossRef]
  37. Gu, W.; Tang, Y.Y.; Peng, S.Y.; Wand, D.; Shen, W.; Liu, K. Optimal configuration and analysis of combined cooling, heating, and power microgrid with thermal storage tank under uncertainty. J. Renew. Sustain. Energy 2015, 7, 2125–2141. [Google Scholar] [CrossRef]
  38. Miao, Y.; Jiang, Q.Y.; Cao, Y. Battery switch station modeling and its economic evaluation in microgrid. In Proceedings of the IEEE Power Energy Society General Meeting, San Diego, CA, USA, 22–26 July 2012; Volume 59, pp. 1–7.
  39. Subsidy of PV in Shanghai. Available online: http://jgs.ndrc.gov.cn/zcfg/201512/t20151224_768570.html (accessed on 7 September 2016).
  40. U.S. Department of Energy, Energy Plus. Available online: http://www.energyplus.gov (accessed on 7 September 2016).
  41. The peak–valley price in Shanghai. Available online: http://www.shdrc.gov.cn/gk/xxgkml/zcwj/jgl/20805.htm (accessed on 7 September 2016).
  42. On-Grid Power Tariff of the Natural Gas Generation. Available online: http://www.shdrc.gov.cn/xxgk/cxxxgk/15073.htm (accessed on 7 September 2016).
  43. Gu, W.; Wang, Z.; Wu, Z.; Luo, Z.; Tang, Y.; Wang, J. An online Optimal Dispatch Schedule for CCHP Microgrids Based on Model Predictive Control. IEEE Trans. Smart Grid 2016. [Google Scholar] [CrossRef]
  44. Gu, W.; Wu, Z.; Yuan, X. Microgrid economic optimal operation of the combined heat and power system with renewable energy. In Proceedings of the IEEE Power Energy Society General Meeting, Minneapolis, MN, USA, 25–29 July 2010; pp. 1–6.
  45. Fang, F.; Wei, L.; Liu, J.; Zhang, J.; Hou, G. Complementary configuration and operation of a CCHP-ORC system. Energy 2012, 46, 211–220. [Google Scholar] [CrossRef]
  46. IBM ILOG CPLEX V12.1 User’s Manual for CPLEX. Available online: ftp://public.dhe.ibm.com/software/websphere/ilog/docs/optimization/cplex/ps_usrmancplex.pdf (accessed on 7 September 2016).
  47. Yalmip a Modelling Language for Advanced Modeling and Solution of Convex and Nonconvex Optimization Problems. Available online: http://users.isy.liu.se/johanl /yalmip/ (accessed on 7 September 2016).
  48. Wang, J.; Jiang, H.; Zhou, Q.; Wu, J.; Qin, S. China’s natural gas production and consumption analysis based on the multicycle Hubbert model and rolling Grey model. Renew. Sustain. Energy Rev. 2016, 53, 1149–1167. [Google Scholar] [CrossRef]
Figure 1. Schematic of a combined cooling, heating and power (CCHP) microgrids.
Sustainability 08 00977 g001
Figure 2. Schematic of the interconnected building cooling, heating and power (BCCHP) microgrids.
Sustainability 08 00977 g002
Figure 3. Piecewise linear approximation of thermal and electrical efficiency curve of the micro gas turbine (MT).
Sustainability 08 00977 g003
Figure 4. Power of PV, cooling, heating and power loads of one year for three BCCHP microgrids.
Sustainability 08 00977 g004
Figure 5. Annual values of performance criteria for the NBCCHP microgrids and the IBCCHP microgrids: (a) Running cost; (b) Carbon dioxide emissions (CDE); (c) Primary energy consumption (PEC).
Sustainability 08 00977 g005
Figure 6. Annual charge/discharge cycle number of the battery for the NBCCHP microgrids and the IBCCHP microgrids.
Sustainability 08 00977 g006
Figure 7. Variation of the operational cost for the NBCCHP microgrids and the IBCCHP microgrids in Mode 3.
Sustainability 08 00977 g007
Figure 8. Annual operational cost of BCCHP microgrids compared with IBCCHP microgrids for various sold electricity prices and natural gas prices in Mode 3.
Sustainability 08 00977 g008
Figure 9. Variation of the operational cost for the NBCCHP microgrids and the IBCCHP microgrids in Mode 4.
Sustainability 08 00977 g009
Figure 10. Annual operational cost of BCCHP microgrids compared with IBCCHP microgrids for various sold electricity prices and natural gas prices in Mode 4.
Sustainability 08 00977 g010
Table 1. Four combined operating modes of IBCCHP microgrids.
PVMT
Sell by SubsidySell by Sold Electricity PriceNo SellSell by Sold Electricity PriceNo Sell
Mode 1
Mode 2
Mode 3
Mode 4
Mode 1—the power of the PV is consumed by local users, and the electricity produced by the MT is allowed to meet the end user needs or charge batteries and is not to be sold back to the main grid; Mode 2—the power of the PV with the subsidy policy is absorbed by the main grid, and the surplus electricity of MT will not be sold back to the main grid; Mode 3—the power of the PV with the subsidy policy is absorbed by the main grid, and the surplus electricity of the MT can be sold back to the main grid; and Mode 4—the power of the PV is consumed by local users, and the surplus power of the MT or PV can be sold back to the main grid.
Table 2. Time-of-use price.
TimePurchase Price (Yuan/kWh)Sell Price (Yuan/kWh)
Peak Load Period8:00–10:591.2310.6432
13:00–14:59
18:00–20:59
Flat Load Period6:00–7:590.7770.6432
11:00–12:59
15:00–17:59
21:00–21:59
Off-peak Load Period22:00–5:590.2880.6432
Table 3. Values of the parameters.
ParametersValueParametersValue
α, β2.67, 11.43 H b m i n 0
ηb0.73 H b m a x 500 kW
ηhr0.75 P g r i d m i n 0
ηhe0.9 P g r i d m a x 200 kW
COPec4 P b t , c h r m i n 0
COPac0.7 P b t , c h r m a x 40 kW
η b t c h r 0.95 P b t , d i s m i n 0
η b t d i s c 0.95 P b t , d i s m a x 40 kW
σbt0.02 W b t m i n 40 kW
η t s t c h r 0.9 W b t m a x 180 kW
η t s t d i s c 0.9 H t s t , c h r m i n 0
σtst0.1 H t s t , c h r m a x 100 kWh
Rng3.24 Yuan/m3Rbt18 Yuan/per time
Hng9.78 kWh/m3 P m t u p ,60 kWh
P m t m i n 30 kWh P m t d o w n 60 kWh
ke3.336 μ e 968 g/kWh
kf1.047μf220 g/kWh
Table 4. Capacities and unit prices of the equipment in the CCHP microgrids.
Office Area (kW)Library Area (kW)Food Service Area (kW)
MT120135200
Gas boiler500400800
Electric chiller150100200
Absorption chiller500500800
Heat exchangers500600900
Battery200200200
Heat Recovery System5004501000
Exchange power with the main grid300300300
PV130150200

