1. Introduction
A conditional cash transfer (CCT) is a unique form of social welfare transfer that is made conditional on the recipient showing some type of (one-time or sustained) behaviour. The two parallel goals of CCTs are to induce a behavioural change while alleviating poverty, though unlike welfare payments that aim to increase a recipient’s income, a CCT payment is generally just enough to motivate the change and compensate for lost time or opportunity. CCTs have been used to incentivise a variety of activities, most notably to increase school attendance and participation in nutrition and health programs such as vaccination campaigns [
1,
2,
3,
4]. Consequently, significant outcomes as diverse as reductions in child mortality [
5], increases in subjective wellbeing [
6], and reductions in HIV infection [
7], have been achieved though the mechanisms are not always clear. For example, improvements in achievement are not always a direct outcome of increased attendance [
8]. The actual CCT payment can be in the form of cash, a voucher or a product (for example, food) depending on the target group and intended outcome [
9,
10,
11], though cash is generally the least costly to distribute [
12].
CCTs are not a cure for poverty [
13] and may not be sustainable [
14] but given the massive body of long-term, multi-country data, the benefit of tying (cash) transfers to the spread of goods with large, positive externalities cannot be ignored [
15]. When targeted properly, CCTs could also be used to maximise the impact of interventions that require (near to) universal coverage to be effective. For example, ensuring that a critical mass of children has been de-wormed ensures that the cycle of transmission is broken; at low levels of treatment, deworming is effective only until the untreated re-infect the treated [
16]. Similarly, the health benefits of sanitation, that is the separation and containment of human excreta, are entirely dependent on achieving a high, if not complete, level of coverage and use. Faeces contain a variety of disease-causing pathogens that are easily transmitted by feet, fingers, flies or fluids; even small amounts of faecal material in the environment can infect any number of people who themselves, use, or don’t use a toilet, weakening or removing the effect of sanitation for the few who use it [
17].
In 2007, the “Sanitary Revolution” was voted by readers of the British Medical Journal as the most important medical intervention since 1840 [
18]. The benefits of sanitation are hard to overstate. Preventing the transmission of faecal pathogens is key to reducing the incidence of diarrhoea, which globally, is responsible for more under-5 deaths than malaria, tuberculosis and AIDS combined [
19]. Yet for more than 2.5 billion people who do not use a safe toilet, that sanitation revolution has not arrived [
20].
In order to achieve global sanitation coverage, different financial mechanisms have been employed. Subsidies have been used to help families construct or purchase a toilet [
21] but because subsidies may distort markets or create dependency, the mechanism fell out of favour with many development agencies. Ironically, those who are connected to waterborne sewers in cities (usually the urban rich) pay less both in absolute terms and as a percentage of income than the unconnected poor, because the transport and treatment is subsidized [
22]. Regardless of the inconsistencies, governments are judged based on the number of structures they provide [
20], subsidies persist and are undeniably effective at increasing coverage [
23]. Still, access does not necessarily imply use, and even if use begins high, it often declines rapidly over time, especially once the daily burden of cleaning and maintenance become evident [
24,
25,
26,
27]. After decades of counting toilets, advanced methods to by-pass unreliable stated use measurements or invasive observations are now only in development [
28].
For example, recognizing that open defecation has persisted despite the provision of infrastructure, the Government of India instated the Nirmal Gram Puraskar program to award communities that become and remain open-defecation free [
29]. Though innovative, a combination of corruption and caste issues, along with the fact that payments are directed to the community, not individual households, has produced disappointing results [
30].
Future efforts to increase toilet use will require innovative methods to both measure and stimulate use; in this paper we examine whether household-directed CCTs could be one such mechanism. We conducted a field experiment in which we offered to buy urine using three different pricing schemes. Each intervention compensated toilet users at a different price for the quantity of urine they delivered to a community collection point (a centralised storage tank for all of the urine delivered). We compared the volumes measured before the intervention to those collected during the intervention in order to determine if and at what price, conditional cash transfers could be used to increase the use of urine-diverting dry toilets (UDDT) in rural eThekwini, South Africa.
2. Materials and Methods
2.1. Study Setting
The eThekwini Water and Sanitation (EWS) unit is responsible for providing water, sanitation and garbage collection services for the municipality of eThekwini, which includes the large, coastal city of Durban, in the province of KwaZulu-Natal in South Africa. KwaZulu-Natal lies on the eastern coast of South Africa and is a world-famous tourist destination but it is also characterised by pervasive poverty and has the third highest unemployment rate (33%) just behind the Eastern Cape and Limpopo [
31]. With scarce water resources, limited funds, and difficult, hilly terrain that would make sewer installation nearly impossible, EWS introduced the UDDT in 2003. There are currently about 74,000 in existence [
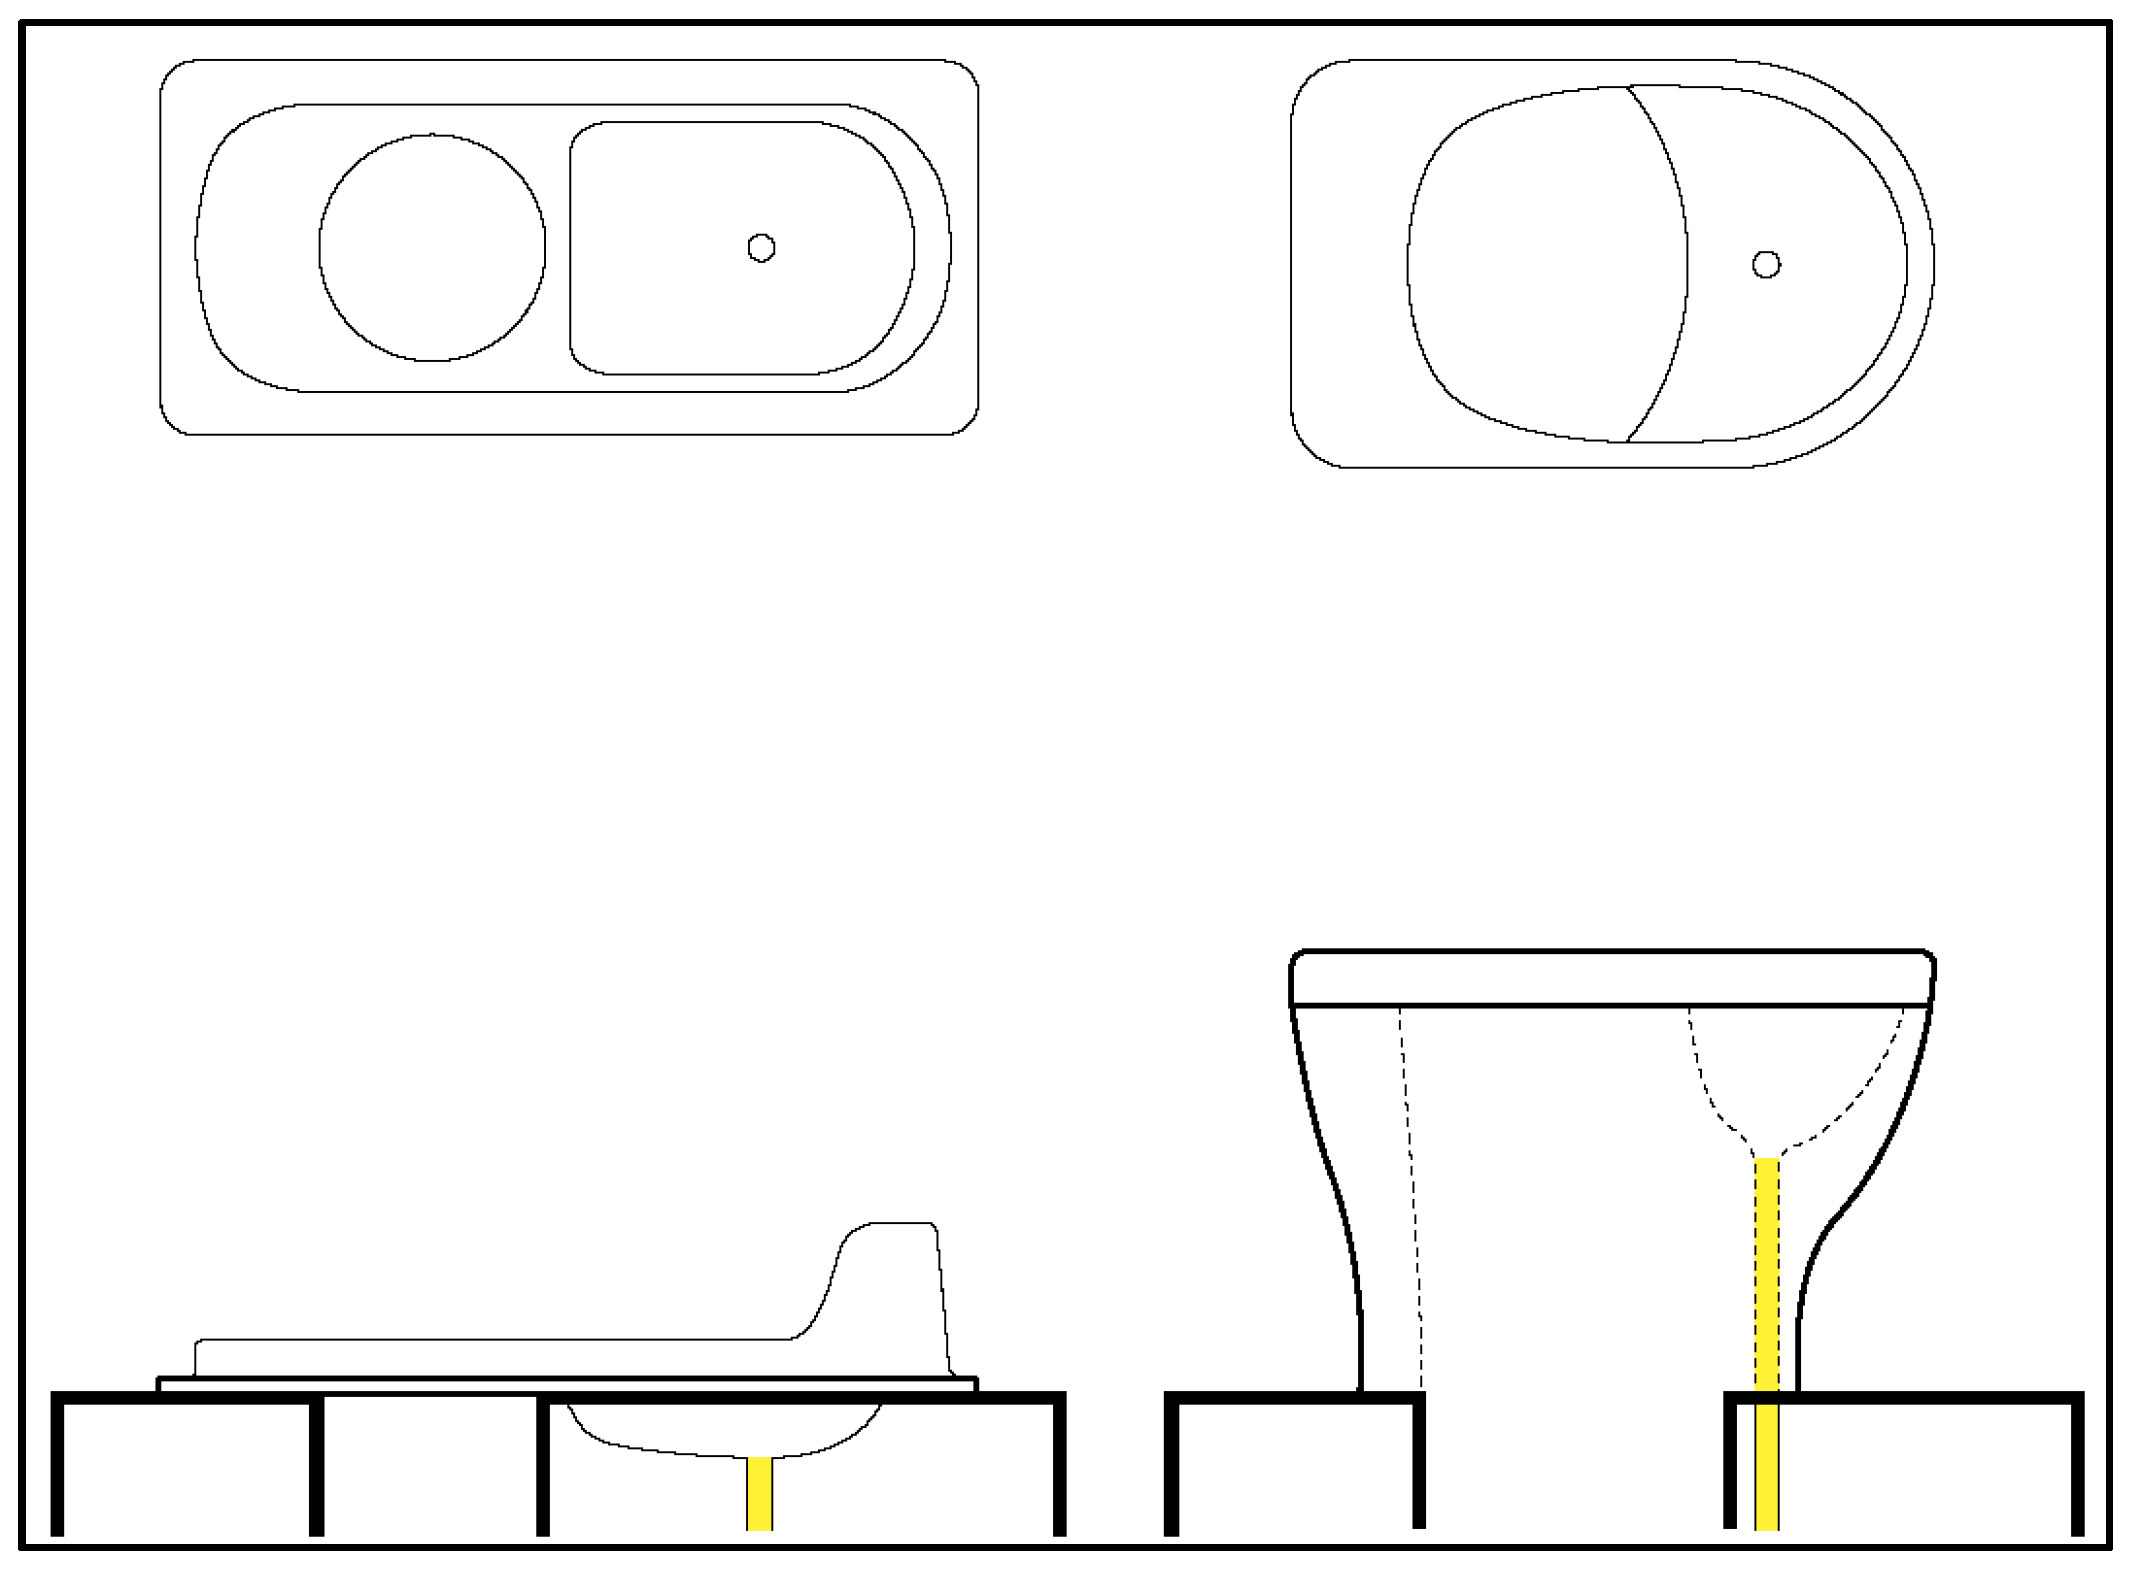
32]. UDDTs are waterless toilets that allow for the separation and collection of urine through a special divider in the toilet pan (
Figure 1).
With the urine separated, the faeces fall into and are collected in one of two dehydration chambers. The separation means that smells are reduced (since bacterial growth is limited in the absence of moisture) and emptying the chambers is much easier compared to a pit latrine. However, the separation at the user interface is not perfect and the user must “aim” in order to get the urine in the front to keep the faeces chambers dry and prevent clogging in the urine pipe; the seat is especially difficult for children to use. Though households did not have to pay for the installation, and do not need to pay for water (to make them work), evidence suggests that acceptance and use rates are low [
33].
2.2. Sample Selection
EWS is a publicly funded unit of the municipal government and is therefore embedded in the local politics of service provision, which, in modern South Africa, remain highly sensitive. Local Councillors usually maintain high approval ratings within their Wards, are influential, and therefore have the power to block or approve any work that affects their voters. Randomly selecting intervention areas could have resulted in unsuccessful interventions, negative attention in the press, or, in the worst case, violence. Specifically, some areas had on-going interventions, residents had survey fatigue, or were generally unsafe due to ongoing political issues. We wanted a set of treatment areas where the CCTs would be offered and a set of control areas where no cash payment for urine would be offered. EWS had already installed urine tanks on 300 UDDTs and was collecting urine in three communities, so these became the control areas. The urine was being collected for related research on nutrient recovery [
34,
35] within an interdisciplinary sanitation project (see
www.vuna.ch). The 300 households in the control sample represented about 10% of the total households who had a UDDT (complete lists of all UDDTs installed in the areas were not available when the experiment started).
For the treatment areas, EWS gave us a list of additional communities that would be safe and that would have the highest potential for successful negotiations with Ward Councillors. From the approved list we selected two treatment areas that did not border either a control area or another treatment area, and had the Municipality install 227 urine tanks; as in the control areas, this number of households represented about 10% of the households with UDDTs. Our treatment and control areas are all non-sewered, rural areas, between 30 and 50 km from Durban, the largest city in the province KwaZulu-Natal. None of the treatment or control areas bordered each other and were always separated by at least one non-intervention community.
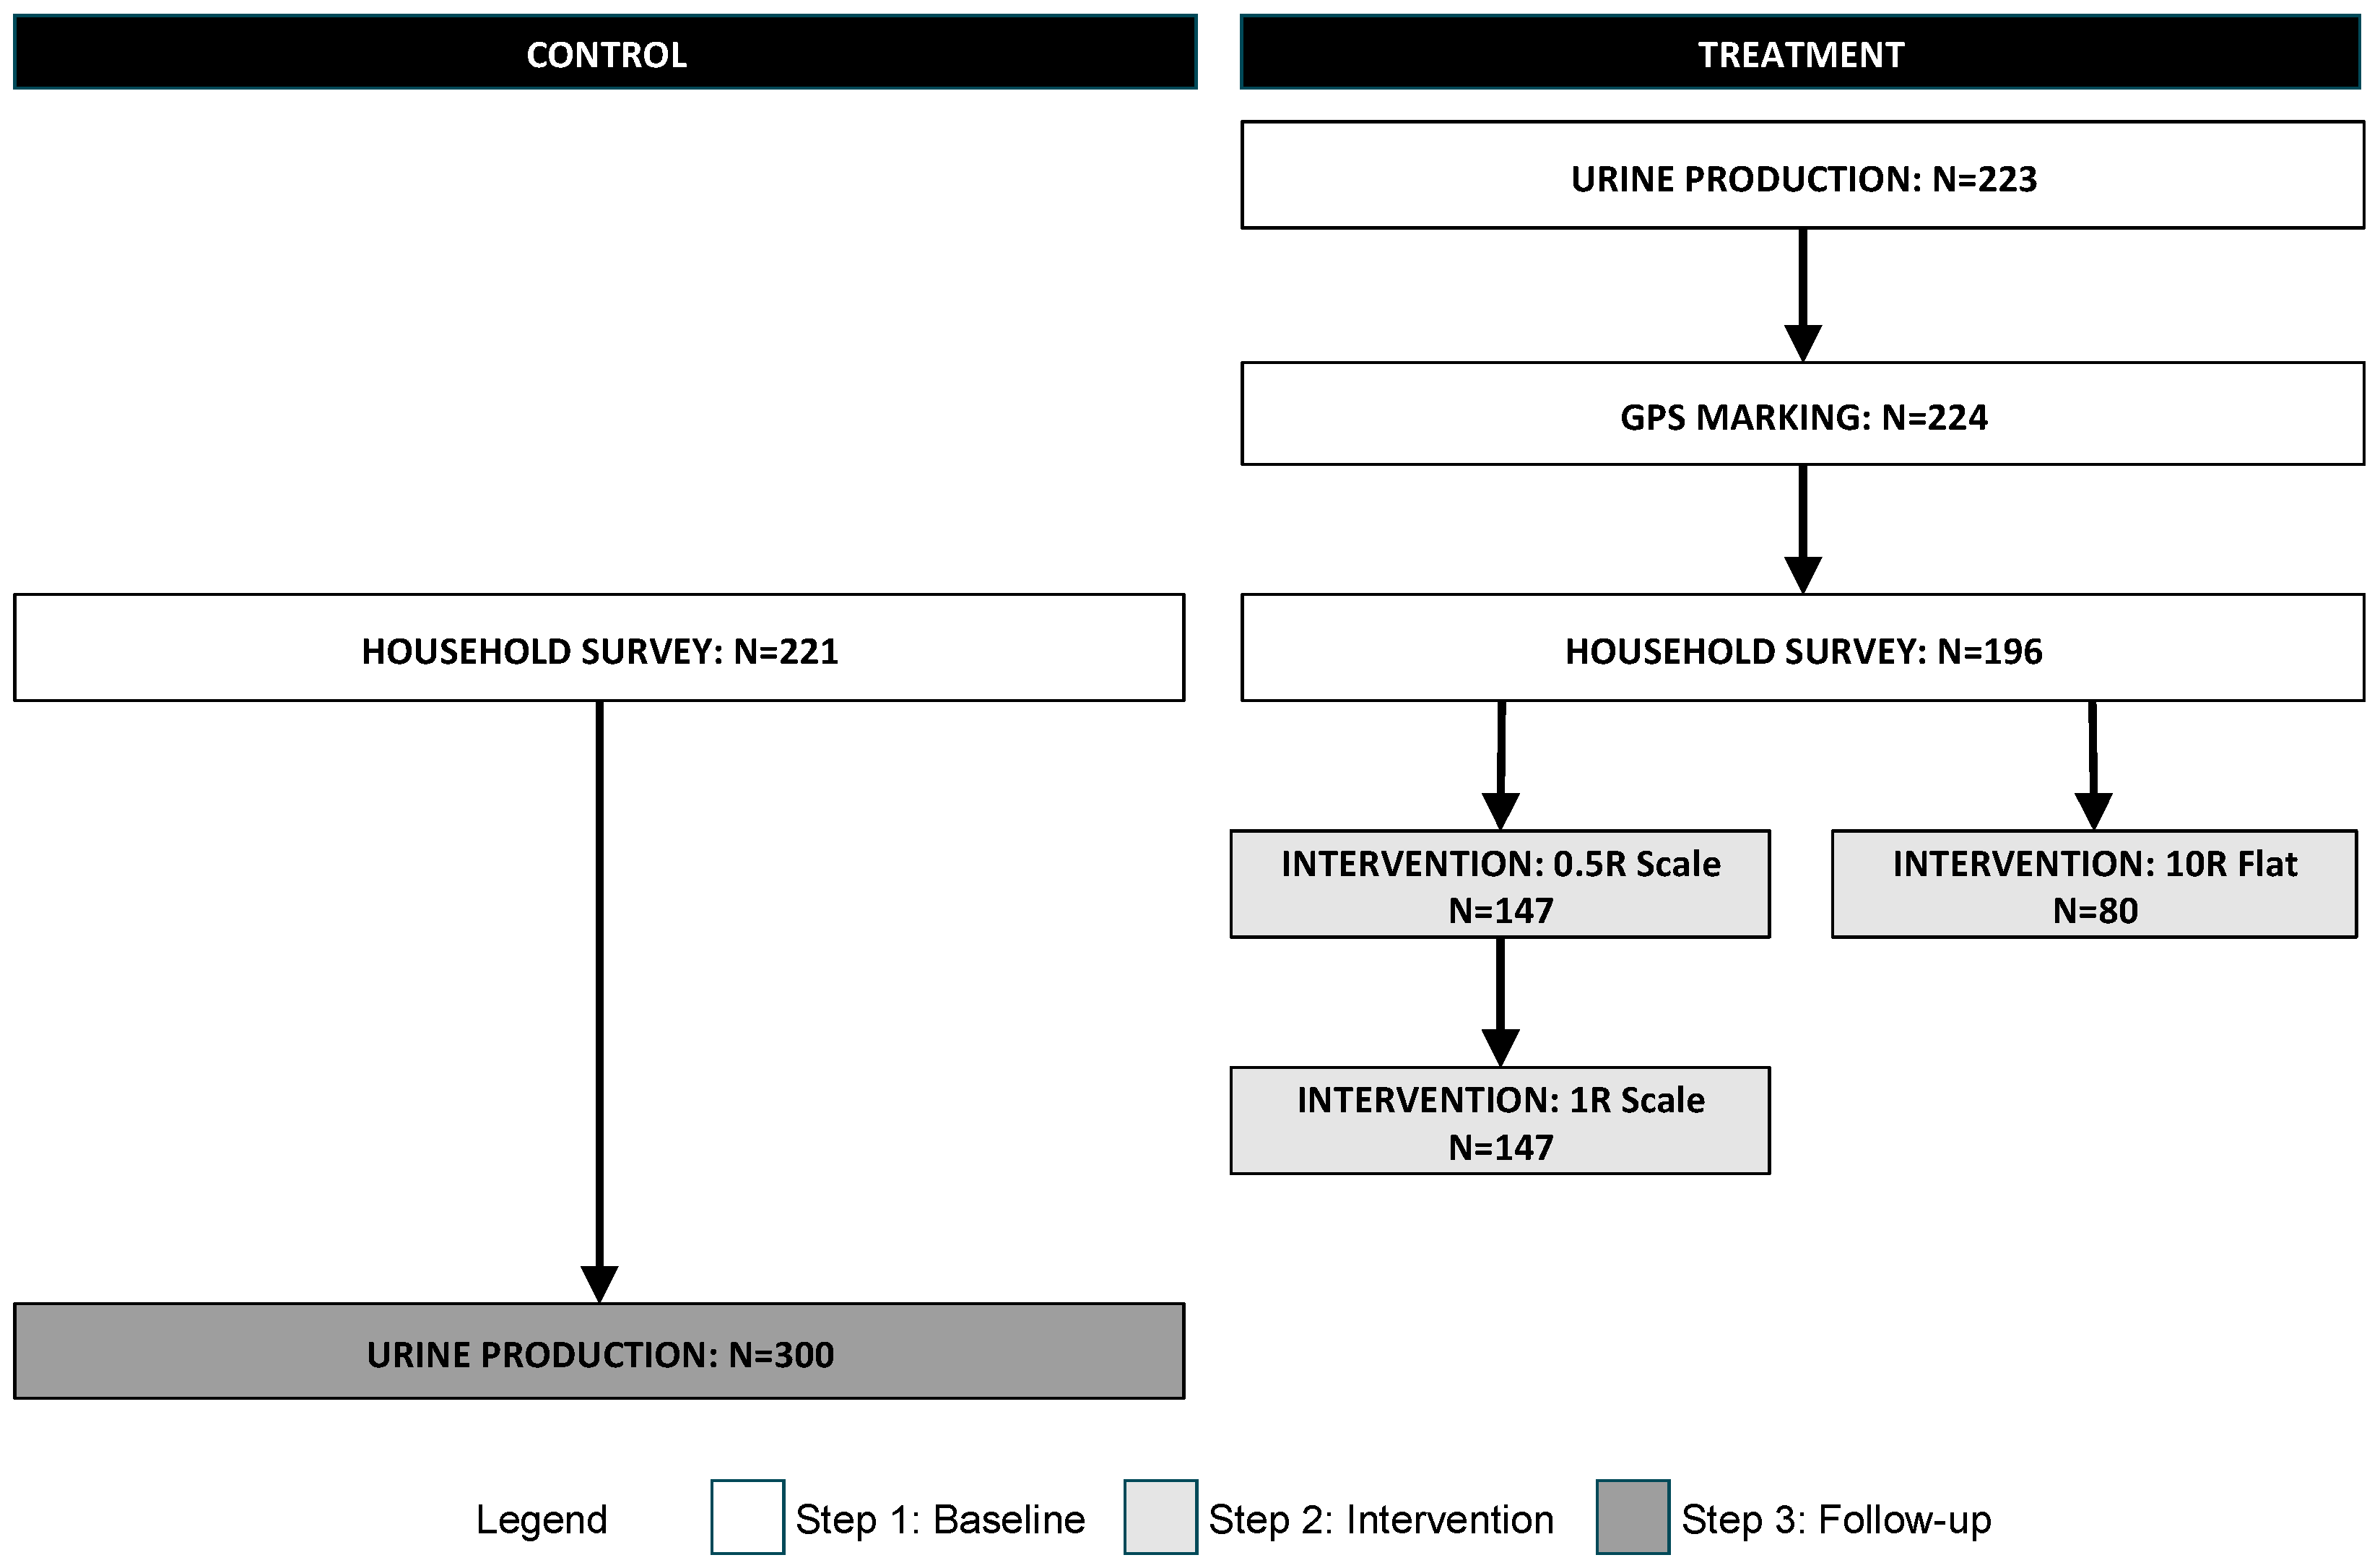
2.3. Data Collection
Data collection occurred in three steps. The first step established the baseline data. It included the measurement of the baseline urine production, GPS marking of the sample households, and a household survey. The second step was the implementation of the different interventions and the measurement of participation and urine volume production. Recall that EWS was already collecting urine from the households in the control areas; because the tank size was smaller (5 L vs. the 20 L tanks in the treatment areas) we collected the urine volume data from the control areas in a final stage, once the tanks had been changed to the standard size. A schematic of the data collection steps is presented in
Figure 2. Each of the steps and sub-steps are discussed in the following sections. Note the sample size, which slightly varies from step to step due to difficulties in re-locating some families.
The overarching goal of this research was to determine the impact of CCTs on toilet use and although toilets are used for both urination and defecation, we only incentivized and measured the quantity of urine. We proceeded in this way for several reasons: First, faeces are difficult and messy to measure, especially compared to the simple toilet retrofit that allowed us to measure urine without any direct impact on the user (see below). Second, urination is about 3–5 times more frequent than defecation meaning that variation would be easier to measure. By incentivizing urine collection, we were hoping to habituate the more repetitive behaviour, which would in turn have a more long-lasting effect. Third, we assumed that some users (primarily men) would have little incentive to use a fixed toilet to urinate (given the vast, rural area), but would be more inclined to defecate in the privacy of the built structure; the CCT would target this behaviour gap directly. So although urine is not a perfect proxy, it was a practical and reasonable estimator of the willingness of participants to use a toilet.
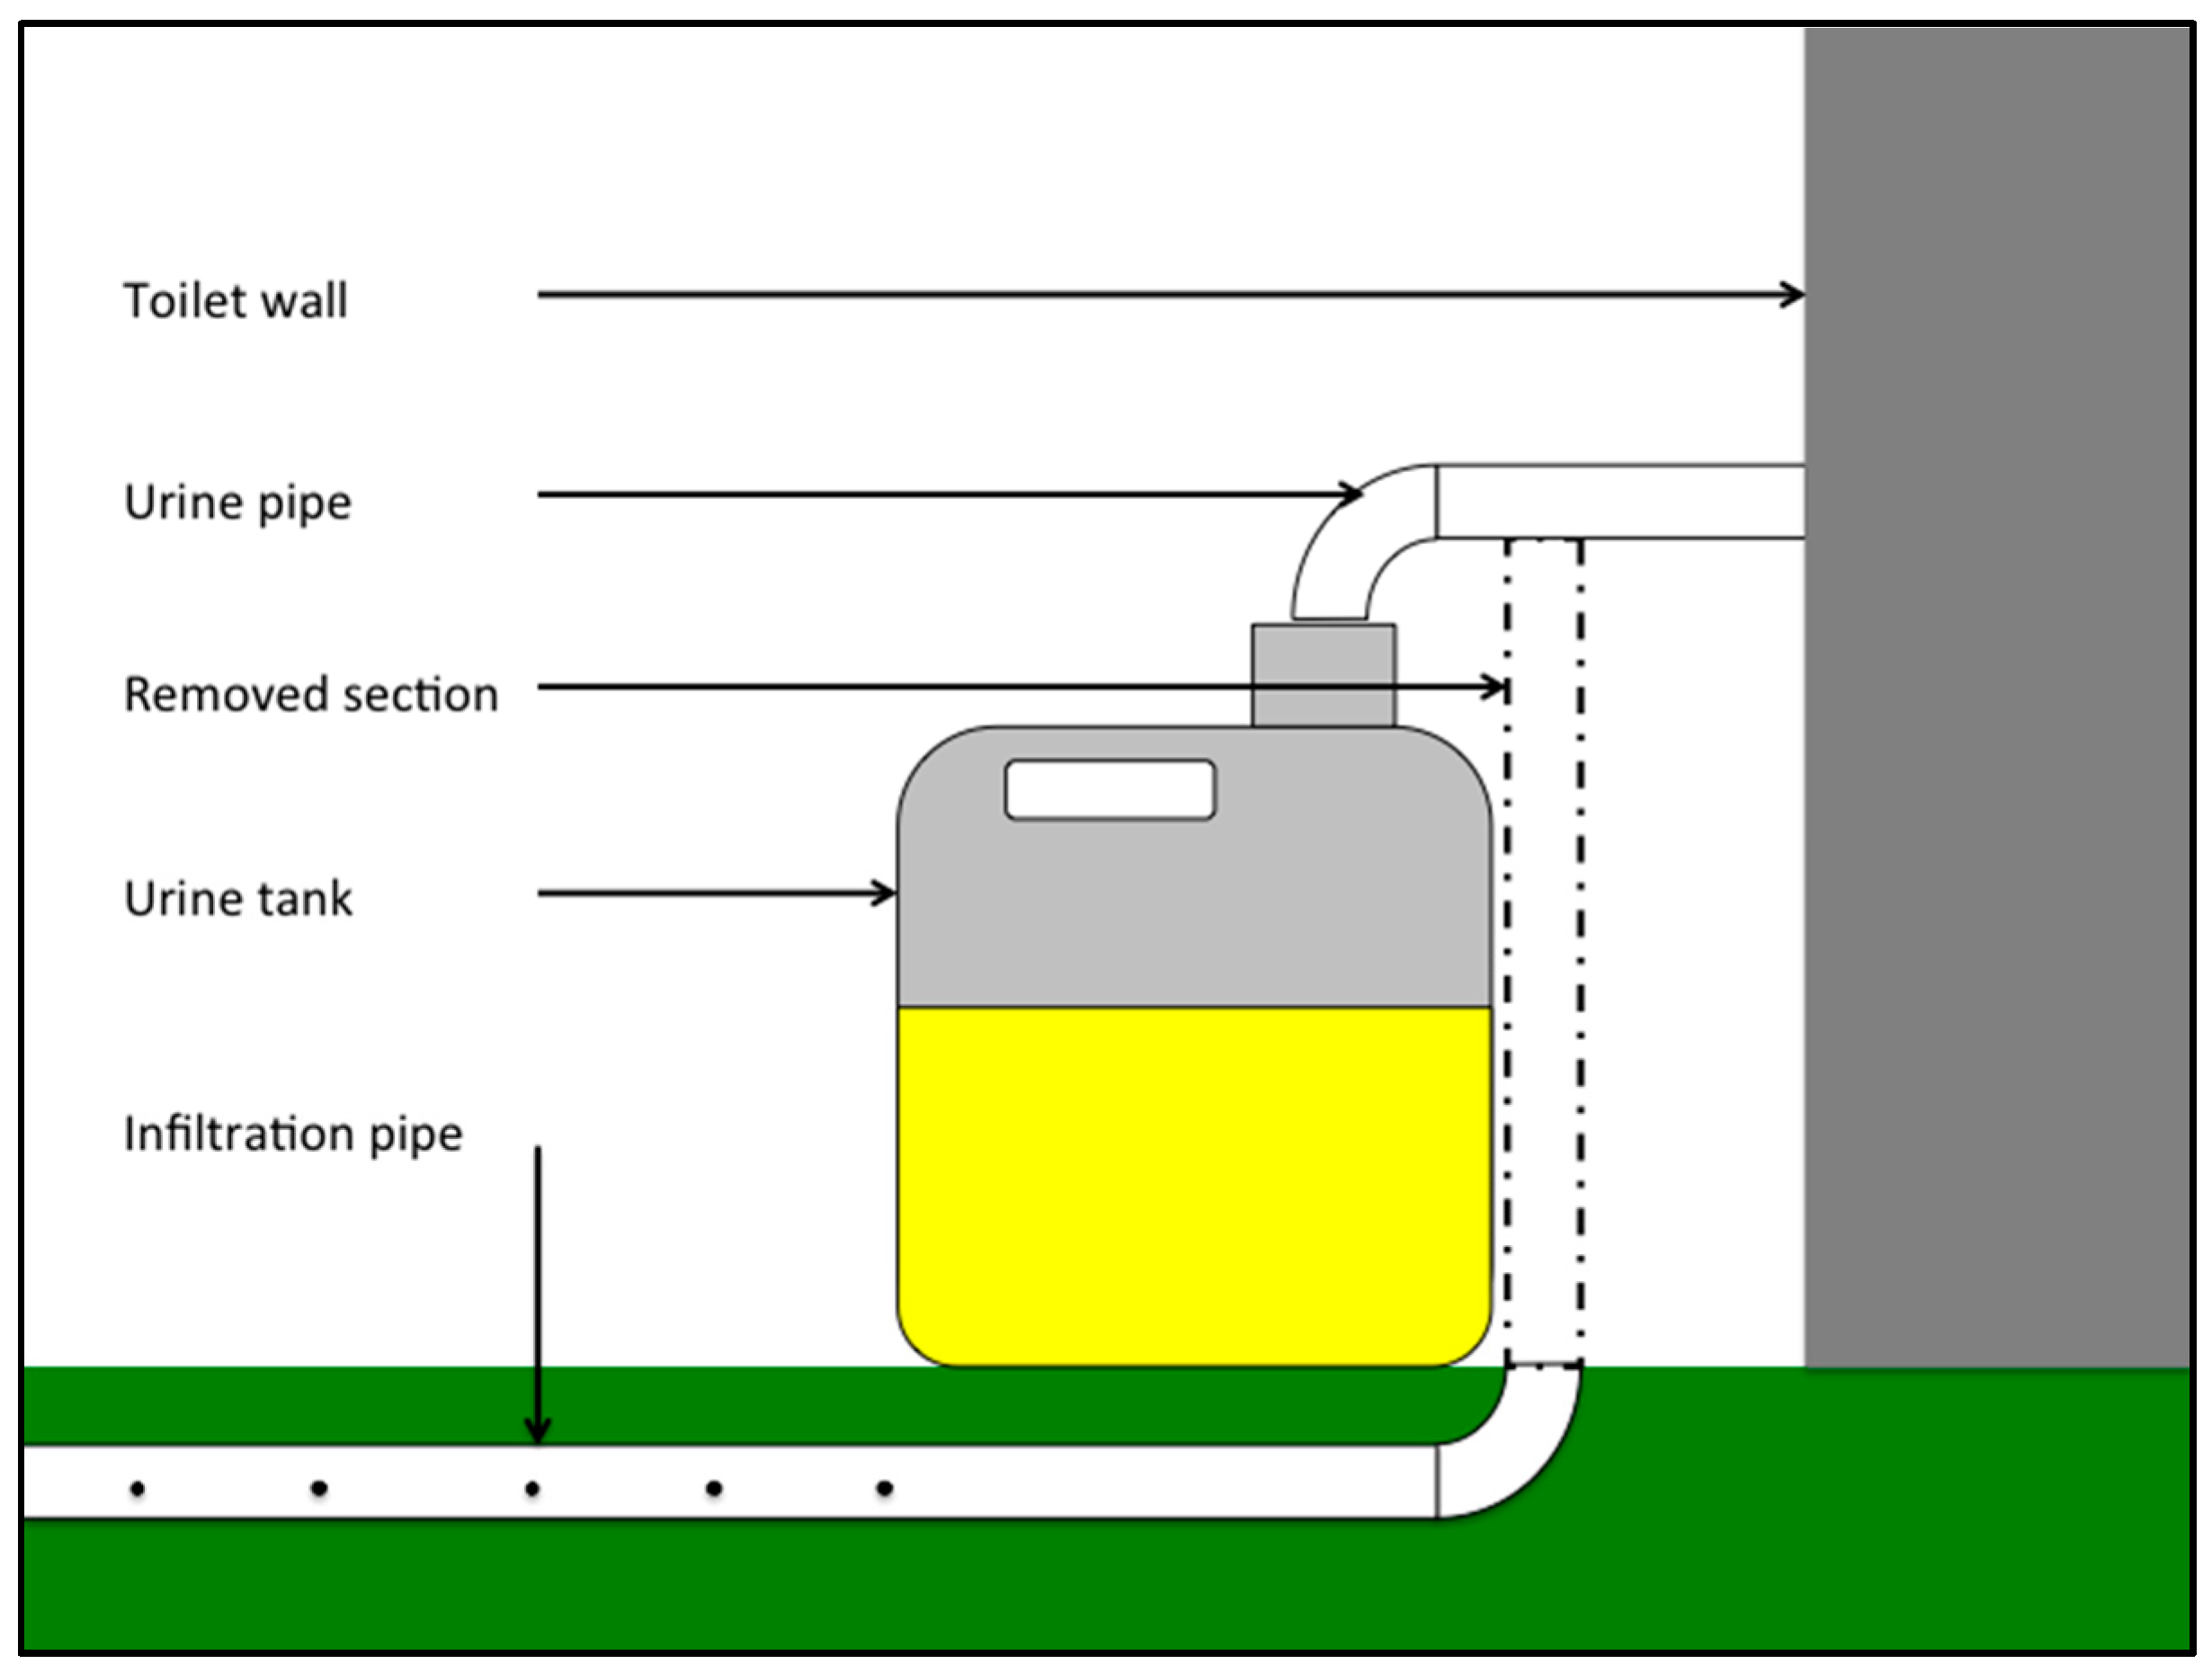
2.3.1. Baseline Urine Collection
To measure the quantity of urine produced, we had each UDDT in the sample retrofitted with a container to collect all of the urine that went into the toilet and urinal. Normally, the urine from the UDDT is piped directly into the ground where it is allowed to infiltrate into the soil. To install the urine tank, the urine pipe was cut about 50 cm above the ground and re-connected to a 20 L plastic “jerry can”. The installation of the urine tanks is shown in
Figure 3.
Three times a week for a month (Monday, Wednesday and Friday), fieldworkers weighed the jerry cans at each of the households in the sample. The container was emptied after each measurement so that the tank could refill from empty before the next measurement. Based on these measurements, the average daily urine production per household was calculated (L/HH·day). Baseline urine production was measured in both the treatment and control areas (though at different times, as indicated in
Figure 2). These average production values were then compared against the results of the interventions.
Each of the household urine tanks (toilets) was also GPS marked so that it could be found again, and so that the distance between a household and a community collection point could be calculated.
2.3.2. Baseline Household Survey
A baseline household survey was conducted in both the treatment and control areas with a willing respondent who was over 18 years old. Questions covered household characteristics, sanitation infrastructure, and the family’s socio-economic situation. The data collected were used to determine if there were differences between the treatment and control areas and to provide control variables in the analysis of the impact of socio-economic characteristics on program participation and toilet use. A comparison of the (aggregated) treatment and control areas is presented in
Table 1;
p-values are calculated based on a
t-test between the control and treatment areas.
The “Baseline Urine Production” is the quantity of urine produced per household per day that was measured during the baseline urine production survey. The variable “Rooms in the house” includes all rooms, regardless of whether or not they are physically under one roof: a household may have separate structures for cooking or for in-laws, and these were included in the count. When the Municipality constructed the UDDTs they were built based on the formula of one UDDT per 8 household members. The UDDTs are constructed of concrete with heavy wooden doors; they are spacious and dry and therefore, make highly desirable storage facilities. The variable “Number of UDDTs” is an indication of family size, but also captures some level of political power, since not every family with more than 8 members got a second UDDT, while some households with fewer than 8 household members, had more than one UDDT. “Have another toilet” is a binary outcome variable that indicates whether or not the family has another toilet that is not a UDDT (for example, pit latrine, flush toilet, and so forth). The “Percent of adults with jobs” indicates the percent of household members over the age of 18 who have full-time employment. The “Asset Index” was constructed using Principle Component Analysis for 26 assets and is continuous between values of 0 and 1 [
36]. “Number of Children” includes only children aged 5–18 (to account for those who are able to use the toilet and/or participate in the program), while “Family size” includes all children and adults. We constructed “Monthly Benefits” by calculating the total value of all the state benefits that the respondent indicated the household received; South Africa has a wide-ranging social welfare system upon which many depend. The calculation of Monthly Benefits was based on the following values (in Rand): Old age pension (1140, 1160 for over 75); Unemployment (1824); Workman’s compensation (2280); Care dependency (1140); Child support grant (270/child); Foster care grant (740); Disability grant (1140). Since the respondent did not state the values of the benefits received, we calculated the family total using household information and the best available government data. “Admit to OD” is a binary outcome variable to indicate whether or not the respondent indicated that they ever practiced open-defecation (OD); this variable is used to indicate the respondents’ adversity to using sanitation infrastructure. “Percent of adults with highschool” is a measure of the percentage of household members, over the age of 18, who have completed high school (in South Africa “matric”), and the “Percent of women in household” is an indication of the family composition. Furthermore, we include some comparable reference values for South Africa, which highlight the relative situation of the areas in comparison to the national averages.
We observe low p-values, which indicate significant differences between the control and treatment group. The families interviewed in the control areas are generally less educated, poorer, and less employed than the families in the treatment area. The high value of Monthly Benefits in the control area indicates that the population, being poorer, is more qualified to receive government support (fewer benefits in the treatment area, indicates a higher standard of living). Depending on liquid intake and climate, humans produce about 1 L of urine per day; given the family size of 4–6 individuals, the average urine production at baseline (at around 1 L per household) is far below what would be expected, especially given the levels of unemployment (most family members stay home).
Although the treatment and control areas are different, we think it is less problematic to have a treatment group that is richer rather than poorer than the control group. We hypothesize that poorer households, with a higher rate of unemployment, would have a greater willingness to participate in an incentive scheme. Therefore, the fact that the treatment area households are generally better off than the control area households could possibly lead to a lower bound estimate of the impact of the interventions. Moreover, we will control for those differences in our estimations. It is also important to consider that in general, both treatment and control areas are poor: though the differences between the areas are significant, within the context of South Africa, both are typical of poor, rural areas that typify this part of the country.
2.4. Intervention
The intervention made in the treatment areas was an invitation (delivered to the household, written in isiZulu) to participate in a CCT program. The letter invited toilet owners whose toilets had been fitted with a urine tank to visit one of three collection points (CP) in the community and exchange their urine for a cash payment. The price per litre of urine, the location, and the opening days and hours were clearly stated on the invitation. Each household in the sample was assigned an identification number that was displayed on the urine tank. The identification number was unique to a single household, but any member of the household was eligible to bring the tank. The distances between each household and each collection point were measured by GPS marking the collection points and household tanks and calculated using ArcGIS. The distance between the household and the collection point was different for each household and varied between 8 m and 1.9 km, with an average of 254 m.
Three different CCT interventions were tested, each for about 3 months (Interventions 1, 2, and 3 lasted for 120, 95, and 87 days respectively). When more than one intervention was tested within a Project Area, the interventions were phased so that the lower-priced incentive was offered first, with no indication that a more attractive incentive would be offered later. The areas were far enough apart that the incentives offered in each treatment area were not known in the other treatment areas.
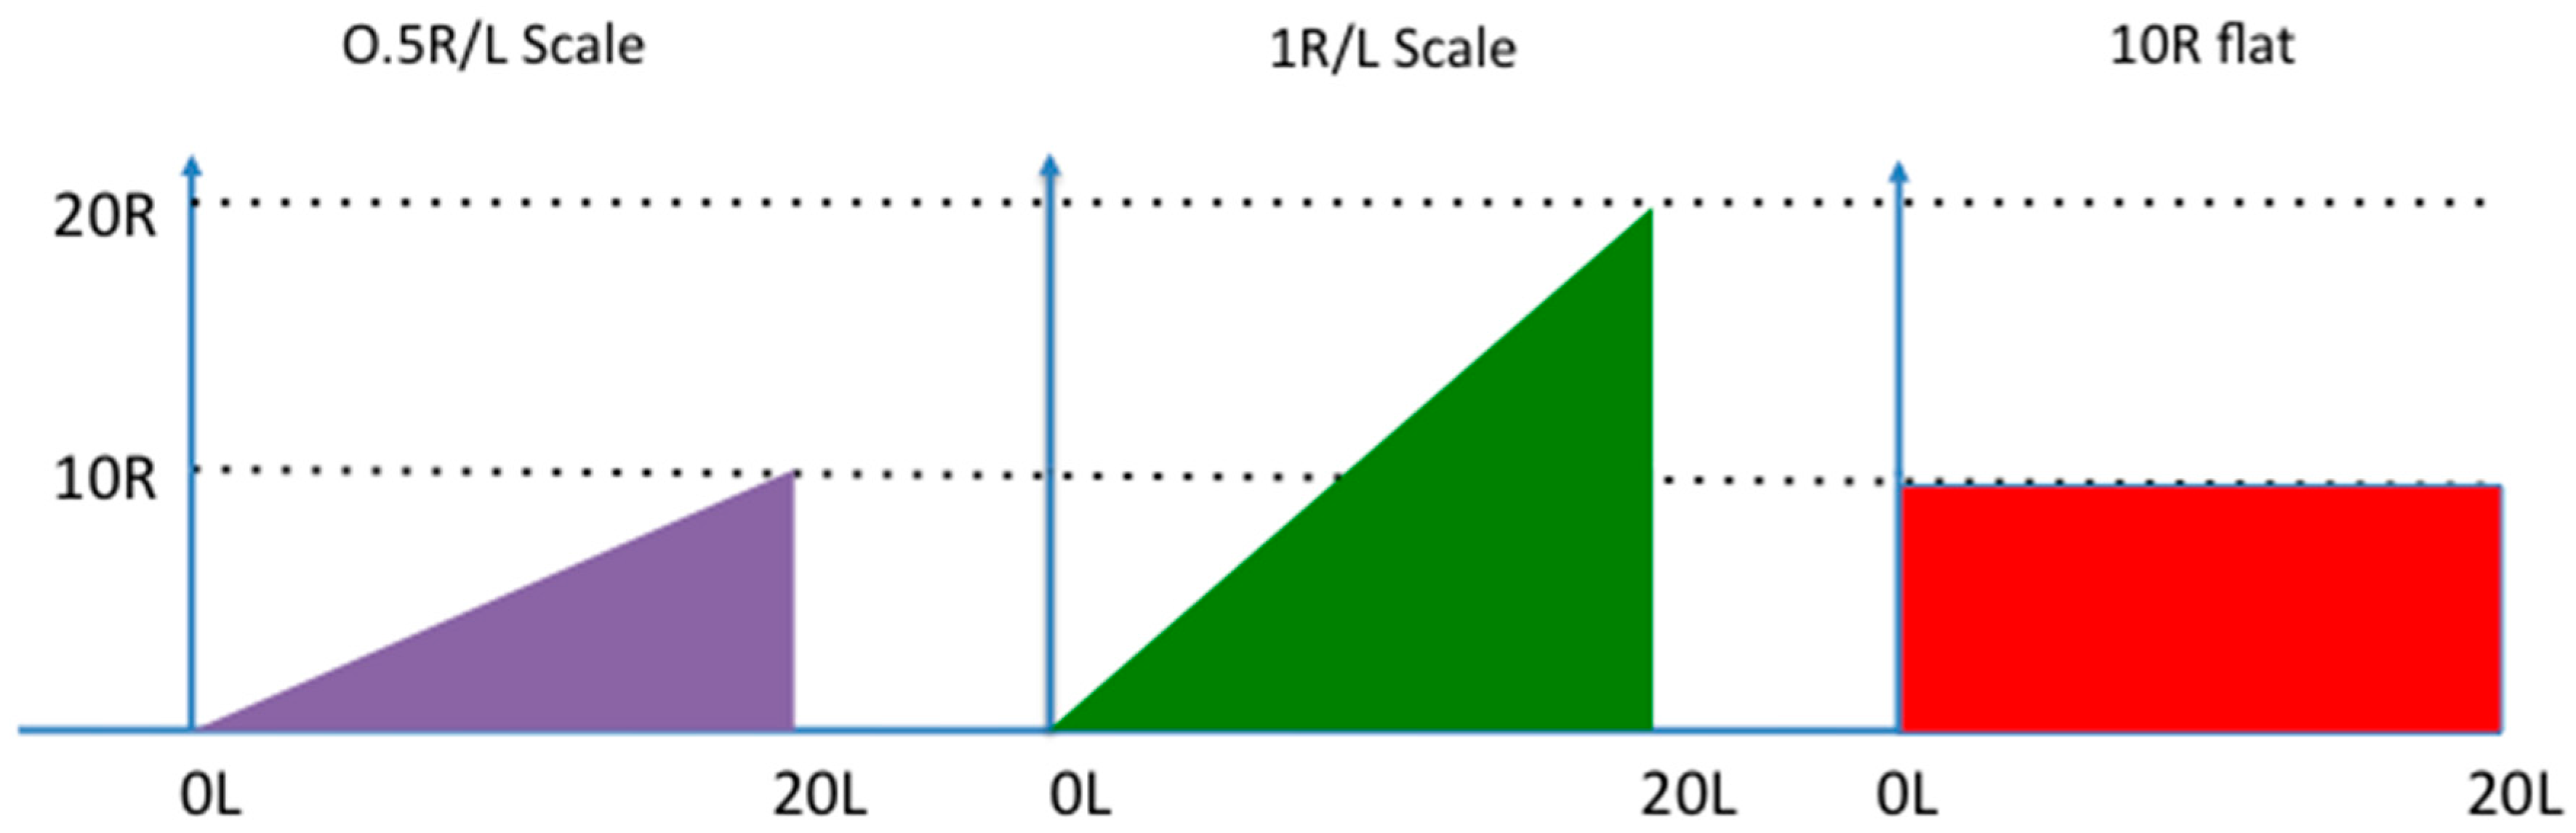
Two aspects of payment structure were varied to test the effect of different intervention features: the payment value was varied between 0.5 Rand per litre of urine (R/L) and 1 R/L, while the payment type was offered as either a volume-based payment or a flat-rate payment. Rand is the currency of South Africa; 1 R at the time of the study was approximately equal to €0.1. The flat rate payment was given simply for walking to the collection point, regardless of the volume delivered. Varying the incentive value allowed us to determine the participants’ price sensitivity, while the response to the different payment type (scaled or flat rate) would allow us to determine whether participants were insensitive to incentives or simply averse to using the UDDT. In other words, the flat rate payment should theoretically attract those who were willing to accept the payment, but not willing to use the UDDT while the scaled price incentive would only attract those who were willing to use the UDDT, but their participation would depend on the price offered. The prices offered were based on the EWS minimum wage, which was at the time, 152 R/day or about 20 R/h. Assuming a return trip from a house to a collection point took, on average, 30 min, the urine price was set to the equivalent of (10 R), or double (20 R), the minimum wage salary that could be earned during 30 min, essentially compensating people for the opportunity cost of participation. A schematic of the different interventions is presented in
Figure 4.
In the first intervention, urine was bought from customers at a rate of 0.5 R/L at the collection point so that a full 20 L tank was worth 10 R (though any volume could be brought by a customer); this intervention is referred to as “0.5 R-scale”. A poster was always visible so that both the customer and the fieldworker who weighed the tank could be sure that the correct payment was given.
The second intervention is similar to the first, but the price per litre was doubled to 1 R/L; it is referred to as “1 R-scale”. A full tank was therefore worth 20 R, or the equivalent salary of one hour of minimum wage work; participants who could perform the task in less than one hour were compensated at a rate much higher than minimum wage.
A flat rate of 10 R per tank was offered in the third, regardless of how much urine was delivered; it is referred to as “10 R-flat”. Participants could bring urine if they wished, but would be given the 10 R payment for any quantity of urine, including an empty tank. This intervention was designed to help determine whether or not people were averse to using the UDDT (in which case those who were not likely to participate in the scale intervention should still participate in the flat-rate one). In order to receive the flat-rate payment the participant had to bring the empty tank with the unique identification number on it. The empty tank, though cumbersome, weighed less than 1 kg. Participants in this intervention were only allowed to visit a collection point once a day, for a maximum total of 3 visits a week.
In order to receive the cash payment, a participant needed to do two things: first, use the UDDT (to collect urine in the 20 L tank that was attached), and second, deliver the urine to the collection point. Once at the collection point, the participant would be given tokens to exchange for cash at a participating shop.
In the interest of safety and accountability, the payments were not given directly as cash. Rather, custom-made plastic tokens were used to pay the participants. Local shops (three per area) were recruited to act as exchange points for the tokens. Fieldworkers who worked at the collection points exchanged urine for tokens; tokens were then exchanged by the customer for cash at the participating shops. We would buy back the tokens from the participating shops at 110% of their face value. Buying the tokens from the shops at a premium encouraged buy-in and compensated the shops for the fact that they were required to have a constant supply of small change (that is 1, 2, and 5 R coins).
There were three collection points designated for each intervention, for a total of nine collection points. Each collection point was opened one day a week, on the same day every week, on a day different than the other two collection points. Physically, a collection point was a large (1000 L) tank into which the urine was collected; a fieldworker was present from 9:00 to 17:00 to meet the participant, handle the urine, record the data, and make the payment. The fieldworker would weigh the urine (that is, determine the volume), check the quality (using a conductivity metre) and pay the participant. Conductivity is a measure of ion concentration, which, can be used to distinguish between salty urine and water. In this way, we could not only obtain extensive data about the urine quality, but prevent creative participants from trying to game the system. The acceptable conductivity limit was set at 12 mS/cm2 (a healthy value for normal urine); of the thousands of urine deliveries, only 2 containers were rejected.
Households in the control areas were not offered the cash payments. Instead, EWS staff visited each house, manually emptied the urine tanks that were attached to the UDDTs and transported the urine to the central facility for processing. Households in the control areas were not aware of the treatment area interventions.
2.5. Outcome Variables
The intervention made in the treatment areas was an invitation (delivered to the household, written in isiZulu) to participate in a CCT program. The letter invited toilet owners whose toilets had been fitted with a urine tank to visit one of three collection points (CP) in the community and exchange their urine for a cash payment.
To determine the impact of these interventions we examine three outcome variables based on the number of visits and the volume delivered by each unique, household urine tank: participation, regular participation and daily urine production.
Participation is coded as a binary variable indicating whether a household tank was registered at least once at a collection point at least once during the course of the intervention. This variable captures those who were attracted to the program and who had a desire to be involved, but who were not sufficiently enticed to continue on a regular basis.
Regular participation is coded as a binary variable indicating whether a household tank was registered 10 or more times at a collection point over the course of 3 months; based on the cut-off point of 10, regular participants were those households who visited a collection point about once a week for the duration of the intervention.
Daily production is a continuous variable measured in units of litres of urine per household produced per day (L/HH·day). However, the volumes that were exchanged at the collection points were not regular in terms of volume or frequency: a participant could bring any quantity (0–20 L) as rarely or as often as the opening hours would allow. Some households would hoard urine and bring large quantities at once; some households would bring several litres every day. The irregular volumes and time intervals meant that a simple running average would not be accurate. As a conservative lower-bound estimate, the following formula to calculate the average daily household production was used:
where
Vtotal is the total quantity of urine delivered over the course of the intervention,
Vinitial is the volume delivered on the first visit and
daysparticip is the total number of days between the first and last visit. The first quantity delivered is subtracted from the total because it is unclear how long it took to accumulate that quantity. This method allows us to calculate the average daily household urine production (L/HH·day) over the duration of participation, not the duration of the intervention. For households that only visited once (1) or twice (2), the calculated production was replaced with the baseline value (because only the final quantity of urine would be averaged over the duration of participation). Similarly, the daily production values for non-participants were assumed to be constant at their baseline values.
In the absence of an incentive for producing more urine, there is no reason that the family should produce more or less than they were when the baseline values were recorded. We were careful to ensure that there were no other interventions (for example, toilet construction, surveys, and so forth) during this time. Furthermore, water is free and usually available at household taps. Therefore, although there could be some small seasonal variations the volume of water available for drinking remained fixed. The same applies for the control areas, where we only measured urine at the end of the intervention. Since the Municipality collected urine continuously in the control areas for the duration of the study, and since the control area households had no knowledge of the interventions taking place in the treatment areas, there is no reason to believe that the urine production would have changed over this time.
The only volume that was measured during the interventions was the urine delivered to the collection points; any other urine produced at the household was not included in the calculation. In the absence of a better method to simultaneously measure the urine produced at home and the quantity delivered, it must be assumed that the volume delivered to the collection point is a conservative estimate of toilet use for the duration of the interventions.
2.6. Data Entry and Analysis
The household survey data were collected using mobile phones and the Mobenzi Researcher (
www.mobenzi.com) application [
37]. During the intervention, data were handwritten by enumerators at the collection points. All data were later compiled and analysed in STATA 13. The dataset for the treatment areas is constructed as a panel (baseline, intervention), while the dataset for the control areas is constructed as a cross-section. We examine the impact of the intervention on three different outcome variables: participation, regular participation, and daily urine production.
Participation (a binary outcome variable, coded as 1 if the household made at least 1 visit), and regular participation (a binary outcome variable coded as 1 if the household made at least 10 visits) are estimated using a Linear Probability Model, which allows us to interpret the coefficients in terms of probabilities of participation. The model is specified as follows:
where
Yi is the outcome of interest for household
i,
is the constant term,
Interij is intervention
j =
1…3,
Vi is the baseline urine production for each of the households and
xi is a vector of household characteristics. The standard errors are adjusted for spatial clustering around the collection points in the treatment area (control areas are clustered according to Project Area). Each household was assigned to the collection point that they visited most often. If no visits were made, the household was assigned to the collection point of the nearest (geographic) neighbour who delivered urine.
The same specification is used when the outcome variable is changed to average daily urine production (L/HH·day), though it is a continuous outcome variable.
3. Results and Discussion
Table 2 shows the impact of the different interventions on participation (columns 1 and 2), regular participation (columns 3 and 4) and urine production (columns 5 and 6). Even-numbered columns (2, 4, 6) include baseline urine production and the distance to the collection point, so that the relative impact of these control variables can be compared to the models presented in the odd-numbered columns. The same models were produced with a full set of control variables and are presented in the
Appendix A. The control variables do little to improve the model fit and do not change our main results; in order to highlight the impacts of the interventions they are omitted in
Table 2.
As expected, participation increased when the incentive price was doubled from 0.5 R/L to 1 R/L, and when a flat rate of 10 R was offered (column 1). Besides the opportunity cost of walking, participants in the scaled intervention were required to use their toilets (more), which was not the case for the 10 R-flat intervention, where households could earn money even without using their toilet. However, the differences are moderate (with no difference between the flat rate intervention and the 1 R/L intervention), indicating that households were not deterred off participating because of not wanting to use their toilet.
The walking distance is a large and significant predictor of participation (column 2): by including it in the model, a participation rate of 60% would be predicted for an incentive price of 0.5 R/L and up to 94% for the flat-rate payment. A doubling of the average walking distance (254 m) furthermore predicts a decrease in total participation by more than 13 percentage points. An average human walking speed is about 5 km/h, but the walking speed in the hot, hilly areas of rural eThekwini is slower—assume about 3 km/h—especially when carrying a full, 20 kg tank. Therefore, an increase in 100 m would add about another 2 min walking time for each direction; 4 min more for a complete trip. This extra 4 min is, despite high rates of unemployment and opportunity, an important and significant deterrent to participation. Finally, it is interesting to see that baseline urine production, that is previous toilet use, was not a significant predictor of participation.
The predicted results for regular participation, that is, those households that visited a collection point at least 10 times during the intervention, are shown in columns 3 and 4. Regular participants were sufficiently and consistently motivated to visit nearly every week, which would be the ideal situation of a full-scale intervention. In absolute terms, the rates of regular participation are lower than those measured for total participation. Though relatively low, regular participation nearly tripled between the 0.5 R-scale and 1 R-scale intervention from 12% to 35%, respectively (column 3, not controlling for differences in distance). Hence, in the long term, the 1 R intervention becomes relatively more attractive (compared to the 0.5 R intervention).
The 10 R-flat intervention resulted in 71% total participation, yet 59% of households were regular participants, indicating that more than 80% of all participating households were visiting the collection point on a regular basis, likely due to the fact that the incentive was given regardless of the quantity delivered (columns 1 and 3). Not only did households who participated in the flat rate intervention not have to carry large volumes (though some households did), they were not limited by household production (that is waiting to have enough urine to deliver) and could come up to three times a week. The flat-rate interventions were therefore the most effective at retaining a high number of repeat visitors. Regular participants are slightly less sensitive to distance than the sporadic participants (column 4) but given the much lower rates of regular participation, even the 4 percentage point decrease predicted by an increased walking distance of 100 m would greatly reduce the number of regular participants.
The results of the empirical models for the quantity of urine delivered during each intervention are presented in columns 5 and 6. These results address the fundamental question of whether or not UDDT use could be increased with conditional cash transfers.
The constant in column 5 (1.34 L/HH·day) is the average daily production in the control area (it is the missing intervention category). Without controlling for baseline production or walking distance, the only intervention that predicts a significant increase over the control area production is the 1 R-scale intervention. A 1 L increase per day is equivalent to a 74% increase over the baseline value in the control area. Considering that each person produces about 1 L of urine per day, the predicted increase of 1 L per household per day over the control area could be approximated by the urine contribution of another full-time UDDT user or several part time users (for example, children to attend school). However, the production for a typical family in our sample should be at least 3 L/HH·day if all members used the UDDT regularly.
When we include the baseline urine production (that is toilet use) in column 6, it is (as expected) significant and the fit of the model improves substantially, indicating the significance of the baseline urine production on the volumes produced and measured during the intervention (recall that the baseline value in the treatment area was 0.84 L/HH·day). Additionally, the payment in the 10 R-flat intervention now also becomes significant, and predicts an increase of 1.47 L/HH·day. Because the full 10 R payment would be given regardless of the volume delivered, there was no reason that urine production should increase as a result of this intervention. Because there was no need to deliver urine to obtain the flat rate payment (i.e., an empty tank would be rewarded with the same 10 R payment), an increase in urine delivered is counter-intuitive; the fact that the payment caused the volume to more than double (from 1.34 to 2.81 L/HH·day) is an important outcome for this payment design. We propose the following explanation for this unexpected result.
Despite the fact that a local fieldworker visited the house and left the family with detailed information, poor communication within the family (for example, between the person who met the field worker and the person who delivered the urine) could have persisted. Moreover, the participants in this intervention were often older women (83% of participants were women, with an average age of 43), that is a group less likely to have been able to read the information for themselves, and who may not have been confident enough to ask for clarification before or during the intervention. To the uninformed, the presence of a large urine collection tank would certainly indicate that it was there for collecting urine, and so despite being foggy on the mechanics of payment, it was to them, perhaps obvious that money would be given when urine was delivered.
We can only hypothesize that community norms then reinforced and perpetuated this cycle of toilet use and delivery, so that, despite what they saw or heard to the contrary, participants increased toilet use and continued to bring the full tanks. Though money was certainly the key driver for participation, the collection point became a small, but important community institution: an opportunity to socialise and gossip. Even among those who likely knew that they would be paid for an empty tank, the risk of challenging the status quo and being socially excluded was too high, and so either said nothing, brought full tanks, or both. Certainly this is a very context-specific outcome, and a larger sample of areas would have allowed us to more accurately determine the true impact of the flat-rate incentive on volume production.
Not surprisingly, distance had a large, significant impact on the volume of urine collected. Every 100 m of travel distance added predicts a decrease in volume of 0.09 L/HH·day, which would translate to a reduction of about 0.63 L/HH per week. For a family who brings a full 20 L container once a week, this reduction is rather marginal. It appears then that the decision to participate is strongly influenced by the walking distance, despite the small change in time investment, while for participants who have already decided to do the work, the walking distance does not strongly affect how much urine they will carry; indeed this is rational payment-maximizing behaviour.
4. Conclusions
By offering different combinations of prices and payment structures for urine, we investigated the impact of conditional cash transfers on program participation and toilet use: the two components required for making a sustainable impact on sanitation at the community scale.
Even though we observed low toilet use at baseline, we found that UD toilet owners in rural eThekwini were, once offered a small cash incentive, willing to use their urine-diverting dry toilet and deliver their urine to a centralised collection point, despite the work being fairly difficult and potentially taboo. Though previous work has indicated low levels of acceptance [
33], we find that cash incentives are sufficient to overcome any issues that may exist with regard to UDDT use and urine transport.
Participation rates ranged from 48% to 74%. Though we consider this to be an impressive turnout, a sustainable, scaled-up version of this pilot should strive for regular participants. Regular participation rates were markedly lower than participation rates and ranged from 12% to 59%. The highest rates of total participation resulted from the 1 R-scale intervention, while the highest rates of regular participation were recorded when a flat-rate payment was offered. The flat-rate payment encouraged people to come frequently because they were paid regardless of the volume delivered, and so had an incentive to visit as often as possible. Neither participation nor regular participation were impacted by the baseline urine production, i.e., previous toilet use did not predict participation in the interventions.
The average household urine production was increased by nearly 1 L per household per day (a 74% increase) when 1 R/L was offered. This represents a large, important increase in UDDT use, especially considering that the urine production are taken not at the household, but at a collection point, that is reported volumes do not include all the volume that was generated at the household, and are therefore conservative estimates of the actual toilet use increase. When controlling for the baseline urine production, we also detected significant volumetric increases as a result of the 10 R-flat intervention, despite the fact that payments were not based on the volume delivered; in fact, the increase of 1.47 L/HH·day is even higher than predicted by the highest scaled-price intervention.
The distance to a collection point and, by extension, the time needed to walk to the collection point had a significant impact on participation but not on volume production. Still, both program outcomes could likely be improved by increasing the density of collection points, without increasing the incentive prices, however additional costs would be associated with installing and operating the additional collection points.
Issues of political allegiance, the influence of the local political leaders (who may have encouraged participation or remained ambivalent), customer service and relationships with the field staff, would have all affected, in some way, the household’s response to the intervention. Social norms and inaccurate information may have also contributed to the unexpected outcomes. Further replication of each intervention with an increased sample size would be required to address the inconsistencies observed in the 10 R-flat intervention. Given the financial and logistical challenges of modifying and monitoring more than 500 toilets spread over a large area of rural South Africa, this was not technically or politically possible.
From a methodological perspective, measuring urine by weighing the contents of a urine tank that was easily detached from the urine pipe of a UDDT proved to be a simple, safe, cost-effective, and non-invasive method of estimating household urine production, and by proxy, toilet use. We used urine-tank measurements to establish baseline urine production values and we were able to indicate that in general, UDDT use was, at least for urination very low. Although this method clearly did not capture defecation habits, which may or may not be correlated with urination, as a tool for understanding the extent of UDDT use, tank measurements were useful. Further refinement of the method should be pursued so that the results are more reflective of household production, and not just delivery. A long-term replication should attempt to measure any health gains from participants and the community as a whole.
Considering the sensitive and potentially taboo nature of the interventions, the measured rates of participation and regular participation were higher than expected and indicate that neither the use of the UDDT nor the physical work of transporting urine was an insurmountable obstacle to obtain the cash transfer. The 1 R-scaled intervention was the most effective at increasing both participation and use of UDDTs in the context of rural eThekwini. However, depending on the distance to the collection point and the participants’ walking speed, these cash payments could exceed, sometimes more than double, the average minimum wage; to be effective, the incentive price had to be competitive with the salary that a participant would expect on the, non-existent in eThekwini job market.
Conditional cash transfers are not a cure for poverty, but this study has shown that they can be a potentially useful tool for increasing toilet use, while putting cash payments in the hands of poor, unemployed populations in rural South Africa; additional economic analysis is presented elsewhere [
38]. South Africa has a successful, well-targeted, and generally sustainable system of both conditional and unconditional transfers that have had measureable impacts on poverty, health, and education [
39]. Though some may criticize yet another social transfer as being an unnecessary subsidy for going to the toilet, we maintain that sanitation-based incentives could feasibly be integrated into existing payment structures, and act as a tool to improve hygiene behaviour and environmental conditions while reducing the amount of infrastructure that falls into disrepair due to misuse, all without adding significant cost.


