Article

Assessment of Drought Impact on Main Cereal Crops Using a Standardized Precipitation Evapotranspiration Index in Liaoning Province, China

1
College of Water Resources, Shenyang Agricultural University, Shenyang 110866, China
2
State Key Laboratory of Hydraulics and Mountain River Engineering, College of Water Resource & Hydropower, Sichuan University, Chengdu 610065, China
3
Water Conservancy and Hydropower Science Research Institute of Liaoning province, Shenyang 110003, China
*
Author to whom correspondence should be addressed.
Sustainability 2016, 8(10), 1069; https://doi.org/10.3390/su8101069
Submission received: 11 August 2016 / Revised: 8 October 2016 / Accepted: 17 October 2016 / Published: 22 October 2016

Abstract

:
Global warming has resulted in increasingly frequent and severe drought and/or precipitation events. Severe drought limits crop water availability and impacts agricultural productivity and socioeconomic development. To quantify drought-induced yield loss during the main crop stages in Liaoning province, China, aspects of drought episodes (magnitude, duration, and frequency) were investigated during the period 1960–2015 using the Standardized Precipitation Index (SPI) and the Standardized Precipitation Evapotranspiration Index (SPEI), respectively. Then the relationship between the SPI/SPEI and the standardized yield residuals series (SYRS), and the drought-induced yield loss were analyzed for maize, rice, sorghum, soybean, and millet. Liaoning underwent a province-wide increase in temperature, reduced precipitation, and reduced reference crop evapotranspiration. As expected, Liaoning experienced province-wide meteorological drying trends during the main crop growth stages, while the drought frequency, duration, and magnitude were not as serious as revealed by using the SPI. As compared to the SPI, the SPEI considering potential evapotranspiration explained 39%–78% yield variability of SYRS and evaluated the drought-induced yield loss more accurately. The increased drought frequency mainly affected the rain-fed crops (maize, sorghum, soybean, and millet), while it did not reduce irrigated rice production. No major impact was exerted on the rain-fed crops caused by mild drought. However, severe drought (SPEI < −1.0) markedly reduced yield performance, in particular at the anthesis-silking stage for maize, the jointing-booting stage for sorghum, the flowering-podding stage for soybean, and the sowing-milking stage for millet. It is concluded that the SPEI is a more useful measure for the identification of drought episodes and the assessment of drought impact on agricultural production in Liaoning province.

1. Introduction

The global climate has undergone significant and unprecedented changes during the past 100 years. There is increasing evidence that global warming has resulted in increasingly frequent and severe drought and/or precipitation events [1]. Drought is one of the most complex and damaging natural disasters that impacts agricultural productivity and socioeconomic development [2,3]. Many areas of the world still suffer from drought-induced crop failure and water shortage problems, particularly in rainfed agriculture regions [4,5].
Liaoning province is located in East Asia’s monsoon region and has one of the largest climate change rates in the world [6]. Drought is a major problem in this area, which has been responsible for great losses of regional agricultural production. The socioeconomic activities of Liaoning province are predominantly rain-dependent. Liaoning has experienced an unprecedented severity in the intensity, extent, and duration of extreme events (e.g., drought) [7,8]. Therefore, it is imperative to quantify the drought risk and its drought impact on main crop yields, which benefit farmers by mitigating or adapting to drought-induced impact on agricultural systems.
Drought indices, such as the Palmer Drought Severity Index (PDSI) [9], the Standardized Precipitation Index (SPI) [10], etc., have great potential for characterizing agricultural impacts associated with droughts [11,12]. Among the various drought indices, the PDSI is one of the most widely used measures. The PDSI’s main advantage lies in its sensitivity to changes in climatic water balance, which makes comprehensive assessments for both precipitation and evapotranspiration anomalies, and soil water-holding capacity [13]. Nevertheless, the PDSI is weaker at demonstrating the effects of the short-term drought, and lacks the multi-scalar character essential for assessing drought [3,14]. Additionally, drought assessment in snowmelt regions or during the winter months (e.g., parts of Liaoning in April) is not available, for all snows are assumed as rain [15]. The SPI is a relatively easy index for assessing the variability of dryness/wetness conditions, and is widely used by meteorologists and climatologists around the world [16], due to its limited input data requirements, multi-scalar characters, and simplicity of calculations. However, in the context of current global warming, the changes of the atmospheric evaporative demand cannot be neglected in drought research, even though precipitation is the main driver of drought severity [15,17]. The main disadvantage is therefore that the SPI uses only precipitation, without taking into account temperature and evapotranspiration [18]. Recently, the Standardized Precipitation- Evapotranspiration Index (SPEI) [13] has been proposed for detecting and monitoring drought. The index combines the sensitivity of the PDSI to changes in evaporation demand under a warming climate and the multi-temporal nature of the SPI with the simplicity of calculation [2,13]. Rising temperature plays an important role in explaining the recent trends in the development of natural vegetation and crops, and agricultural productions [13,19]. Liaoning province is characterized by increased temperature and reduced precipitation, which usually resulted in more frequent and severe drought episodes [15,20,21]. However, Liaoning province experiences a decline in the reference crop evapotranspiration (ET0) with a gradual warming trend [22]. Therefore, it is essential to combine the reduced precipitation with reduced ET0 to better understand the drought characteristics and the spatial–temporal variabilities of Liaoning province under a warming climate using the SPEI.
Previous studies have revealed drought characteristics in Liaoning province using different drought indices [15,20,21,23]. However, most of these studies focus on the spatial–temporal variabilities of drought episodes, and only a limited number of studies have addressed the impact of drought on main cereal crops, in particular using the SPEI index. Therefore, the objectives of this study are (1) to detect and characterize the temporal–spatial distribution of drought variability (drought frequency, magnitude and duration, and significant level) using the SPEI index for Liaoning province during the main crop growth stages; and (2) evaluate the drought-induced decline and yield sensitivity of maize, rice, sorghum, soybean, and millet in Liaoning province, China.

2. Materials and Methods

2.1. Study Region

Liaoning province, with a total area of 148,000 km2, lies between 38°43′ and 43°26′ N latitude and 118°53′ and 125°46′ E longitude in China (Figure 1). Liaoning is also known as “the Golden Triangle” from its shape and strategic location, and consists essentially of a central lowland, flanked by mountains to the east and west. Based on the topographical and hydrographic characteristics, Liaoning is comprised of Northeastern Mountain and Liaodong Peninsula in the east (also collectively referred to as Eastern Mountain), Western Highland, and a Central Plain zone [24]. The Northeastern Mountain sub-region is dominated by the Changbai Mountain and Qianshan ranges, which extends into the sea to form the Liaodong Peninsula. Cultivated land area (4.09 million hectare) accounted for 27.65% of the total land area, of which about 80% are distributed in the Central Plain zone and Western Highland. The annual mean air temperature ranges from 7 to 11 °C and the frost-free period lasts from 130 to 200 days. The prevailing cereal crops include maize, rice, sorghum, soybean, and millet in this agro-climatic region. Precipitation is the highest in the Eastern Mountain, and lowest in the Western Highland, while the Central Plain receives a moderate amount of rainfall. The average annual rainfall is 500–1000 mm, and more than 85% is received during the main crop growth stages (April to October).

2.2. Meteorological Data and Drought Identification

Meteorological data were provided by the Northeast Regional Meteorological Center, China Meteorological Administration (CMA). The datasets covering the selected 56 meteorological stations (Figure 1) in Liaoning province included the daily minimum, mean, and maximum air temperatures, relative humidity, wind velocity (at 10 m height), sunshine duration, pan evaporation, and precipitation during the period 1960–2015. The homogeneity and reliability of the meteorological data were checked and controlled as described by Liu et al. [25]. In order to identify and characterize the evolution of drought episodes, the SPI series was computed based on monthly precipitation series following the methodology of McKee et al. [10]. The monthly accumulative precipitation was estimated by summing the daily precipitation data. The SPI series was fitted to a gamma probability distribution and normalized to a standard normal probability distribution, as described by McKee et al. [10]. The SPEI [13] has been proposed for identifying drought episodes. The calculation procedures for the SPEI were similar to the SPI, but the P-ET0 (precipitation reference crop evapotranspiration) series was fitted to the log-logistic distribution to calculate the SPEI. The SPEI is an extension of the SPI, which attempts to rectify a shortcoming of the SPI—its calculation is only based on precipitation data [17]. For the SPEI, the FAO56 Penman–Monteith method was employed for monthly reference crop evapotranspiration (ET0) estimation, which is recommended by many international organizations such as the FAO [26]. Both the SPI and SPEI for different month lags were implemented using the SPEI package [27] in R software.
The threshold of 0 in both the SPI and SPEI series (representing 50% of the probability distribution of the standardized variable) was used to identify and explore individual drought episodes, which considered that all the negative values were related to dry conditions [28]. The drought duration was the longest period of consecutive months with the values <0 and the sum of the index values was the drought magnitude [29,30]. The drought frequency was the number of months with values <0 during the main crop growth stages. The inverse-distance-weighted (IDW) algorithm was used to generate contours over Liaoning province with a power of 2.0, 12 grid points, and variable radius location from the point measuring stations via the ArcGIS desktop software. (Esri, Redlands, CA, USA)

2.3. Trend Analysis

The rank-based Mann–Kendall trend (MK) test was used to identify the existence of a possible tendency of drought episodes. A trend-free pre-whitening procedure described by Yue et al. [31] was applied to eliminate the effect of autocorrelation of data series before applying the MK test. The Theil–Sen estimator [32,33] was used to quantify the magnitude of trends. Both the calculations of the MK trend test and the Theil–Sen estimator were implemented by the rkt package [34] in R software.

2.4. Yield Data

The main cereal crop yields of maize, rice, sorghum, soybean, and millet from 1985 to 2014 at the province level were collected from the Bureau of Statistics of Liaoning, China. Maize is the largest grain crop in Liaoning, accounting for about 66.7% of the total cereal crop grain production in the province, followed by rice (25.7%), sorghum (1.6%), soybeans (1.3%), and millet (1.0%) with 3.5% for various other cereal crops [35]. Previous studies [17,36] have indicated that the fluctuations in crop yield series are mainly caused by (1) non-climatic factors, such as new varieties, fertilizers, and water management practices, which has tended to create a growing trend in the yield; (2) the agro-meteorological conditions (e.g., dryness and wetness episodes) during the growing season; (3) the yield sensitivity to dryness/wetness conditions; and (4) residual error. Yield fluctuations due to non-climatic factors were removed by the de-trend method and the residuals of the de-trended yield (the variation resulting from climate) were used [36,37]. In this study, the quadratic polynomial trend was applied to de-trend yield series. The standardized yield residuals series (SYRS) is computed as:
S Y R S = y i μ σ ,
where y i is the residuals of the de-trended yield, μ is the mean of the residuals of the de-trended yield, and σ is the standard deviation.
Relative yield loss is computed as:
Y l o s s = y i y i y i × 100 % ,
where y i is the yield series. Y l o s s is used to evaluate the crop sensitivity to drought as quantified by the SPI and SPEI at a one-month lag for each month of the growing season.
The Pearson correlation method was used to explain the linear relationships between SYRS for each the main cereal crop yield (maize, rice, sorghum, soybeans, and millet) and the SPI/SPEI series during the main crop growth stages (April to October). The drought–yield relationship was estimated by a multiple regression analysis, and the SYRS fluctuation for the main cereal crops were modeled as functions of seven SPI/SPEI series (April to October) at a one-month lag.

3. Results

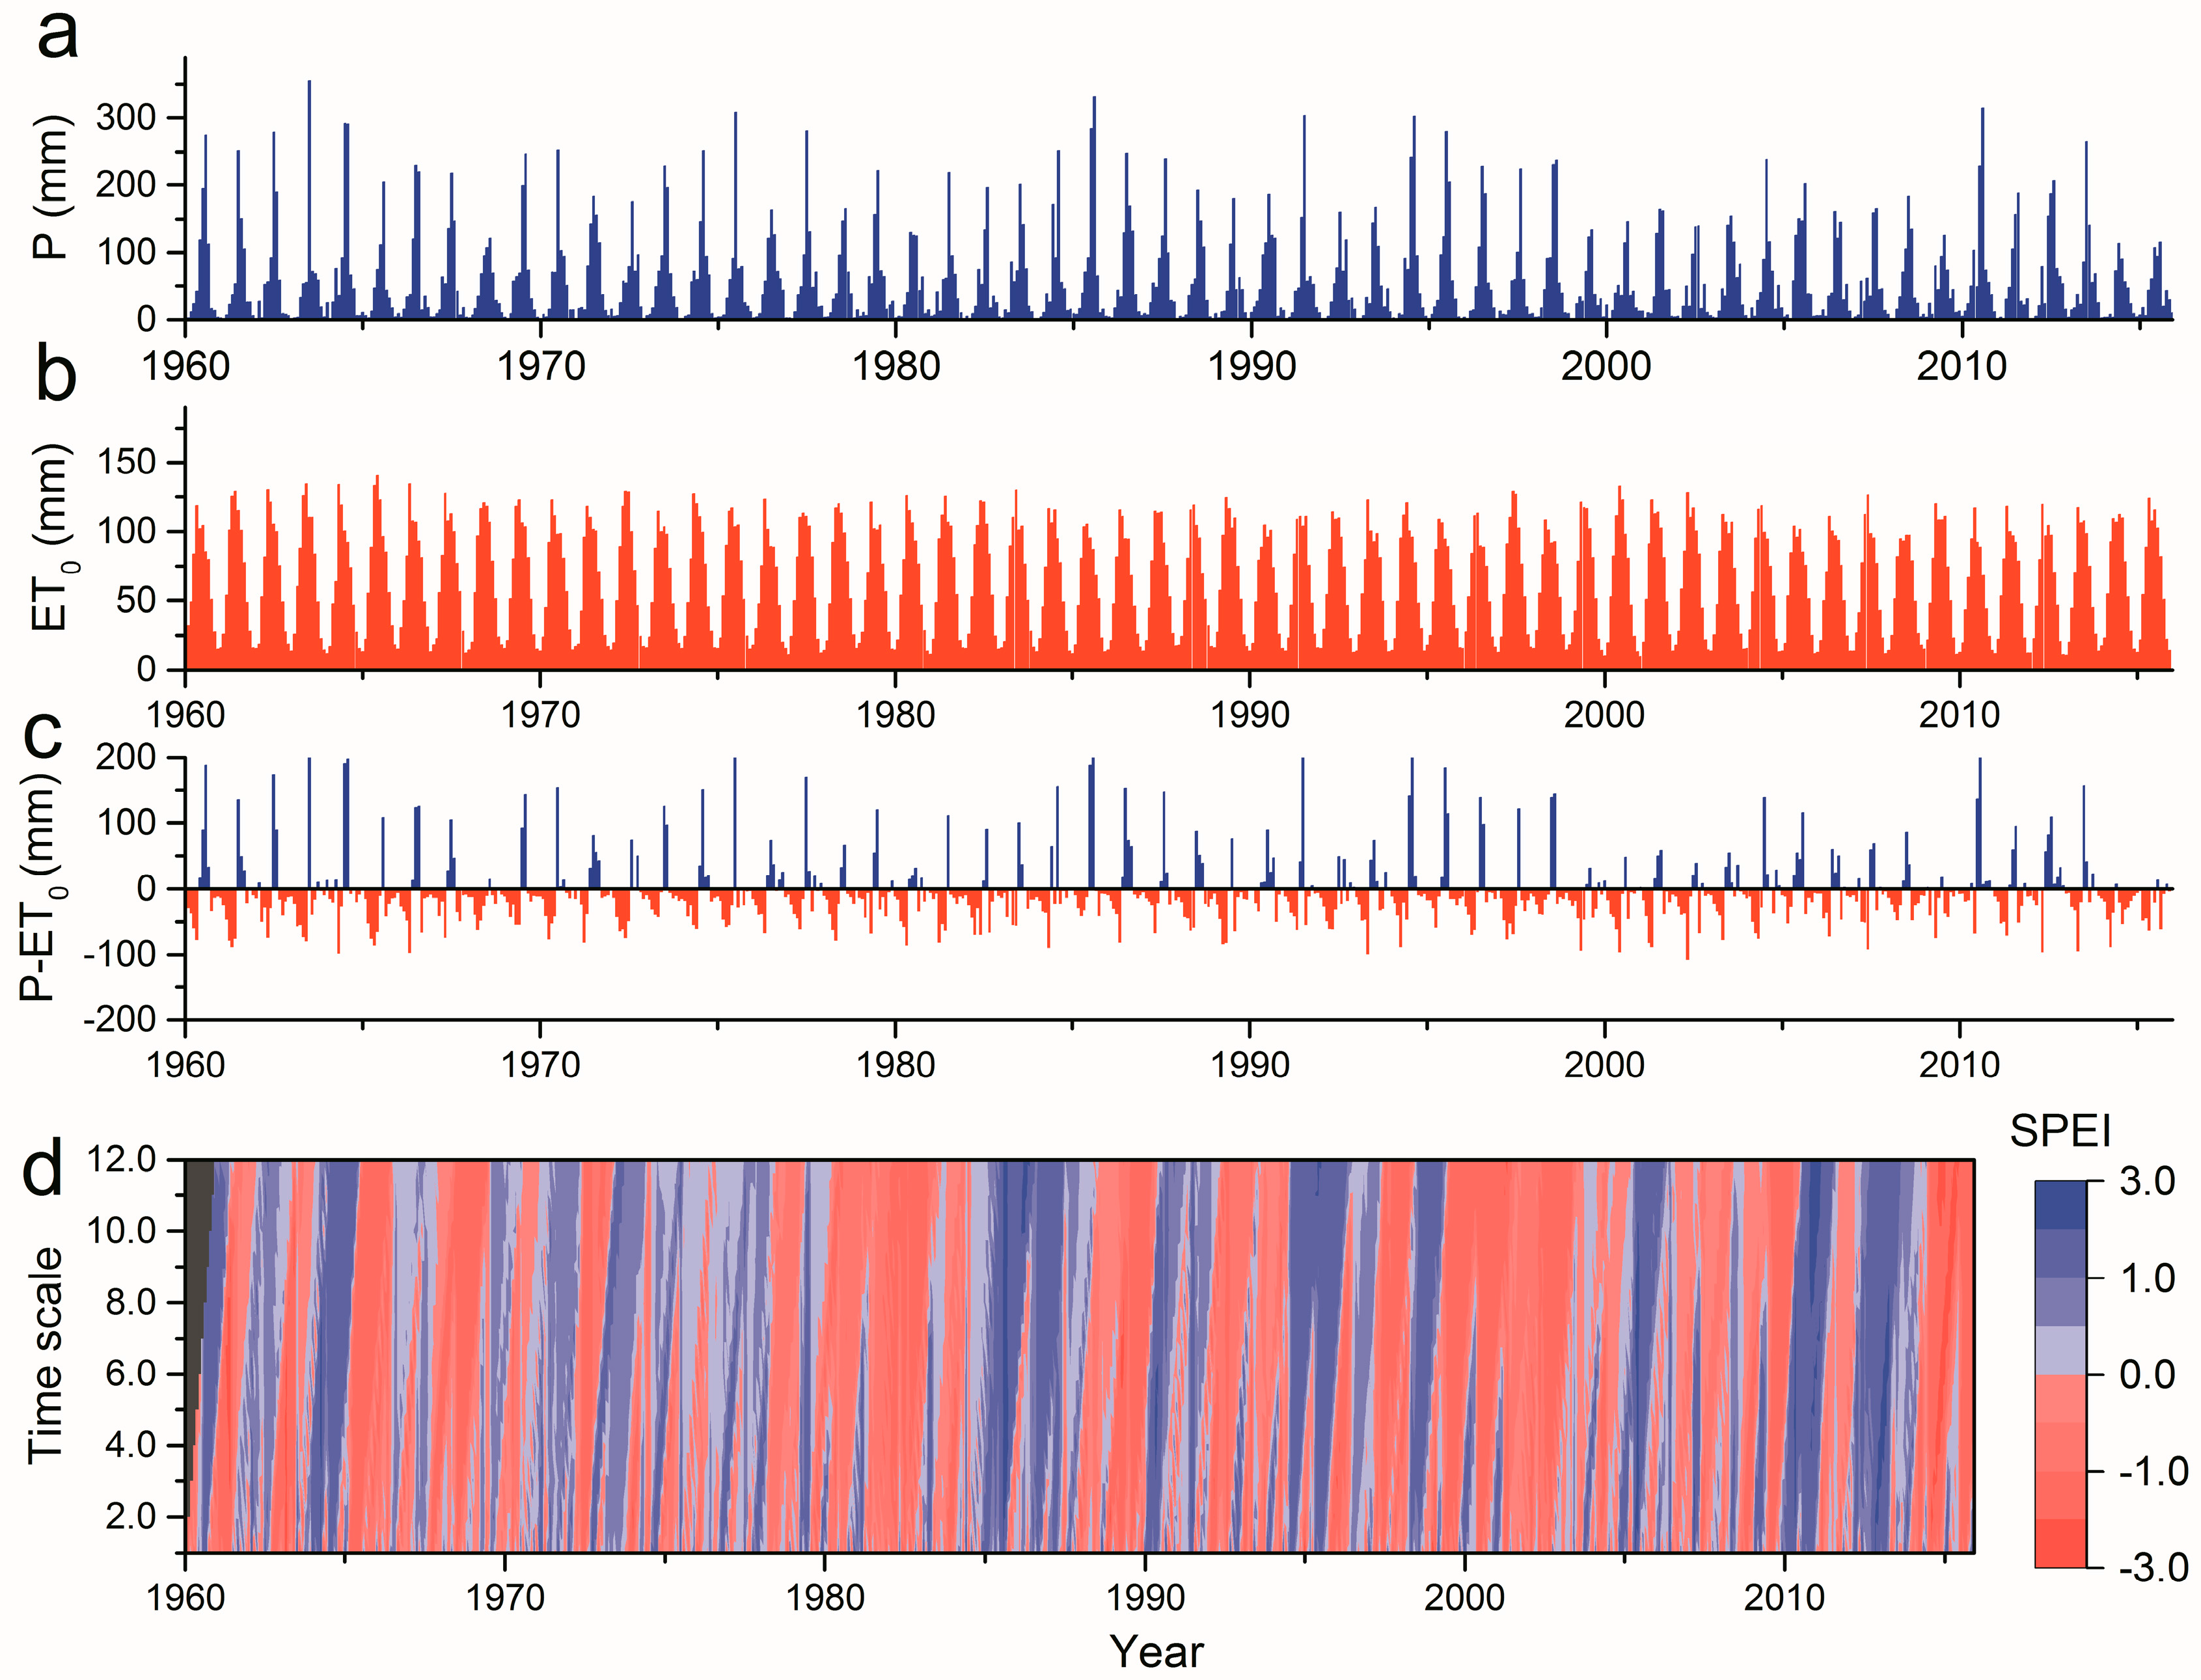
3.1. Temporal and Spatial Variability of Monthly Precipitation, ET0, and SPEI

Figure 2 provides the evolution of the monthly regional precipitation (P), ET0, water deficit (P-ET0), and SPEI series at a one- to 12-month lag from 1960 to 2015 for Liaoning province. The mean monthly precipitation ranged from 5.2 mm (January) to 190.0 mm (July), with the mean annual precipitation being 669.0 mm, and 92.7% of this total received during the main crop growth stages (April to October) (Figure 2a). However, a province-wide trend was observed for precipitation decrease during the main crop growth stages (Figure 3b). The results demonstrated that 98% (55) of the meteorological stations had decreasing precipitation during the main crop growth stages (−2.8 to −47.9 mm·decade−1). Among the 56 selected stations, 10 stations exhibited decreasing trends (p < 0.05), which mainly occurred in the Western Highland (five); the other five stations were located in the northern part of Liaodong Peninsula, and in the Central Plain (Figure 3b).
The spatial distribution of mean temperature during the main crop growth stages indicated increasing temperatures for 100% of meteorological stations (0.21 ± 0.08 °C·decade−1), with 93% stations having significant warming trends (p < 0.05, and 82% stations at p < 0.01 level) (Figure 3a). However, in contrast to the increased temperatures, 91% of stations had ET0 declines during the main crop growth stages, with 61% showing a decreasing trend (p < 0.05), which mainly occurred in the Western Highland and Central Plain. The ET0 trend magnitudes gradually increased from the southeast to the northwest of the province and varied from −2.04 mm·year−1 to 0.62 mm·year−1. Over the last 56 years, the mean monthly ET0 ranged from 14.6 mm (January) to 116.6 mm (May). Moreover, the mean annual ET0 was 775.9 mm, with 83.3% occurring from April to October (Figure 2b). The calculation of P-ET0, averaged over the stations in Liaoning province, identified a higher temporal frequency with negative differences (73%) than that observed with positive differences (27%) (Figure 2c). Positive values of the P-ET0 mainly occurred in July and August, suggesting that the two largest rainfall months, July and August, are relatively moist, while the negative value implied potentially increased risk for meteorological drought for the other months. In order to assess the drought, the SPEI was calculated at one- to 12-month lags for Liaoning province (Figure 2d). The main persistent dry periods were identified during 1979–1984, 1999–2005, and 2007–2011, while the prevailing wet persistent periods were observed during 1973–1977, 1985–1988, 1994–1996, and 2012–2014. Feng and Wu [38] confirmed our findings and indicated that the reduced yields that occurred during 1999–2005 resulted in large economic and societal losses.

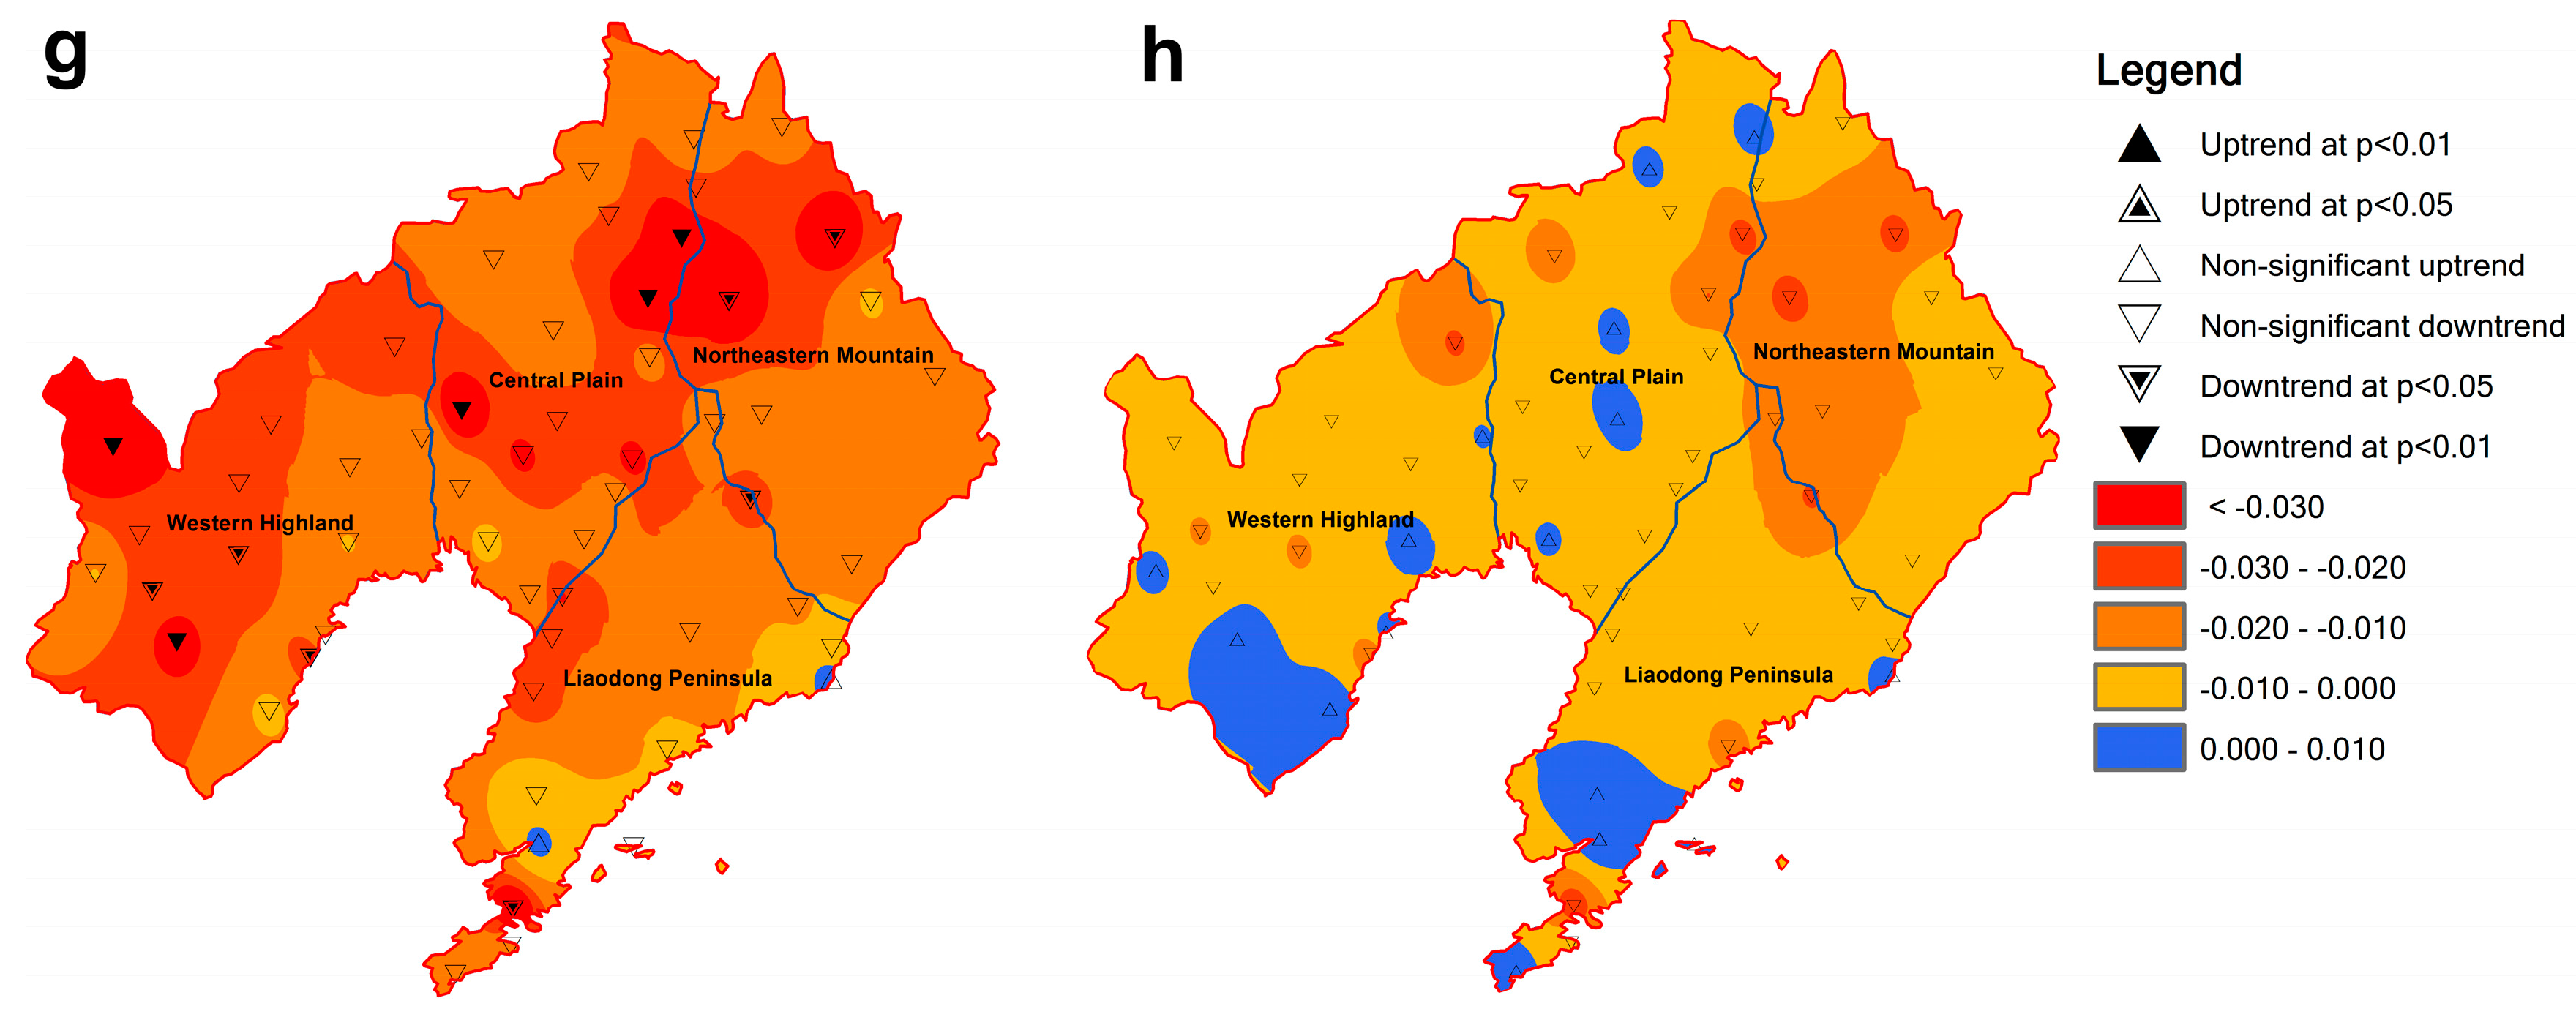
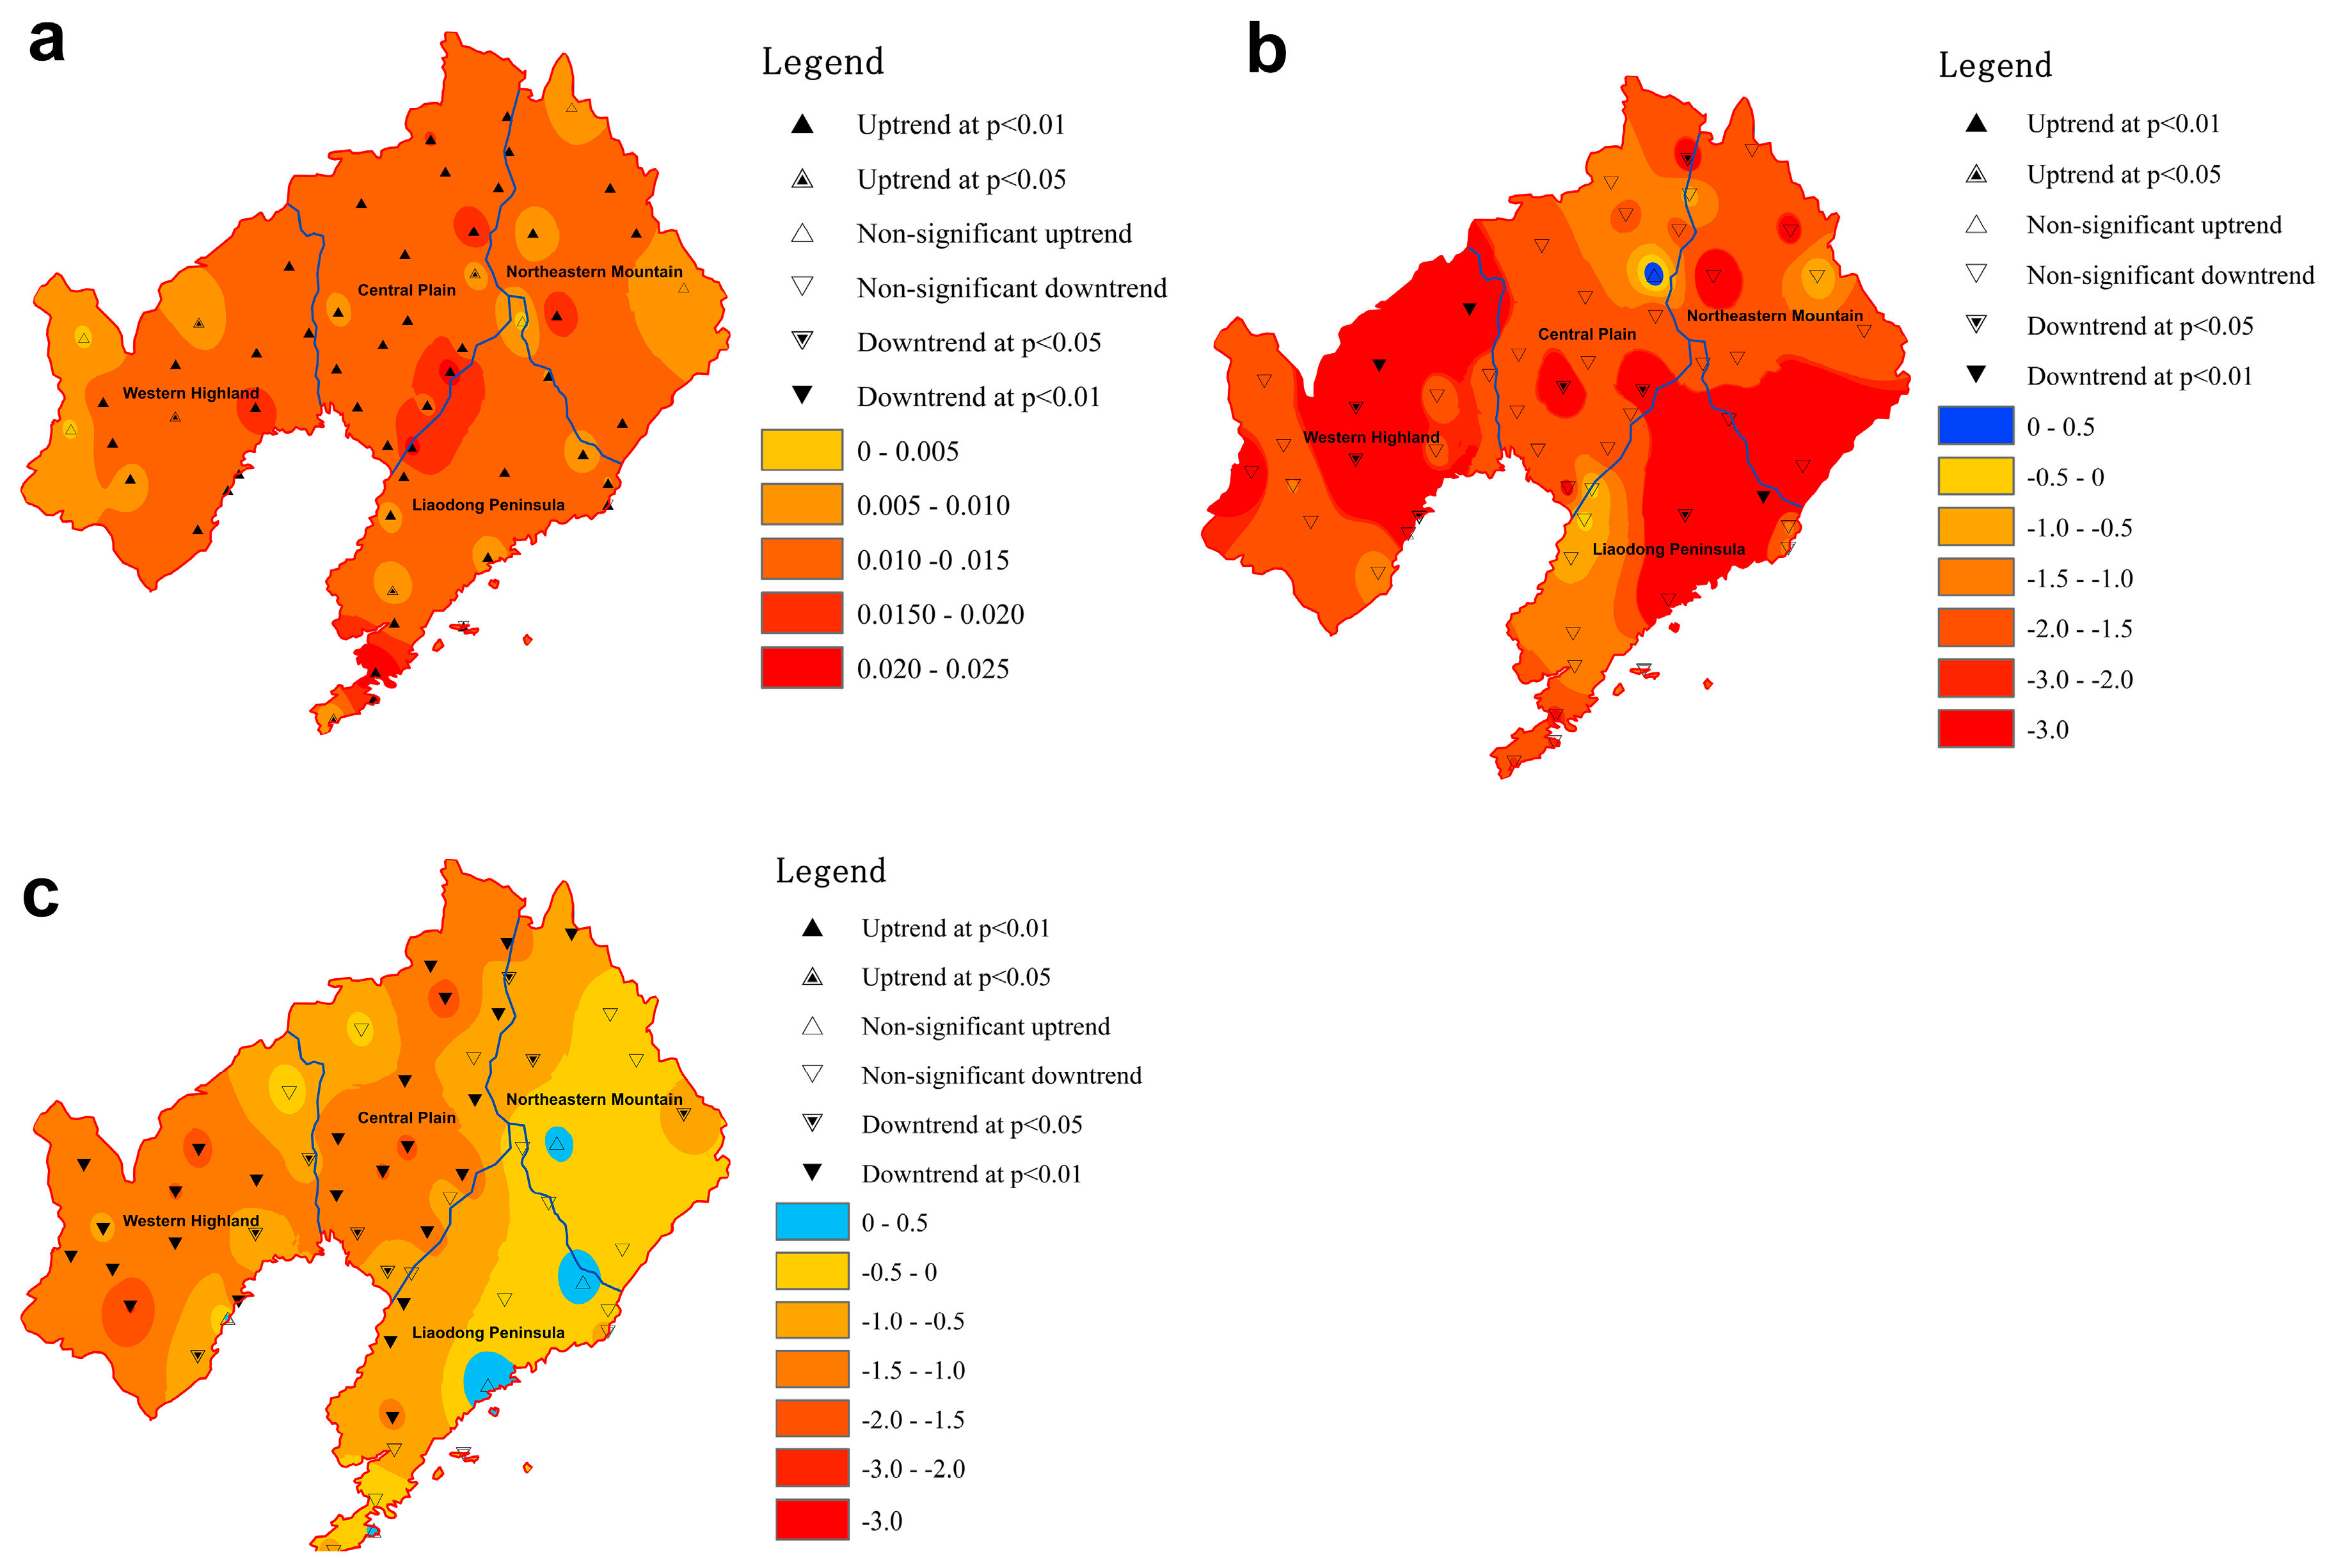
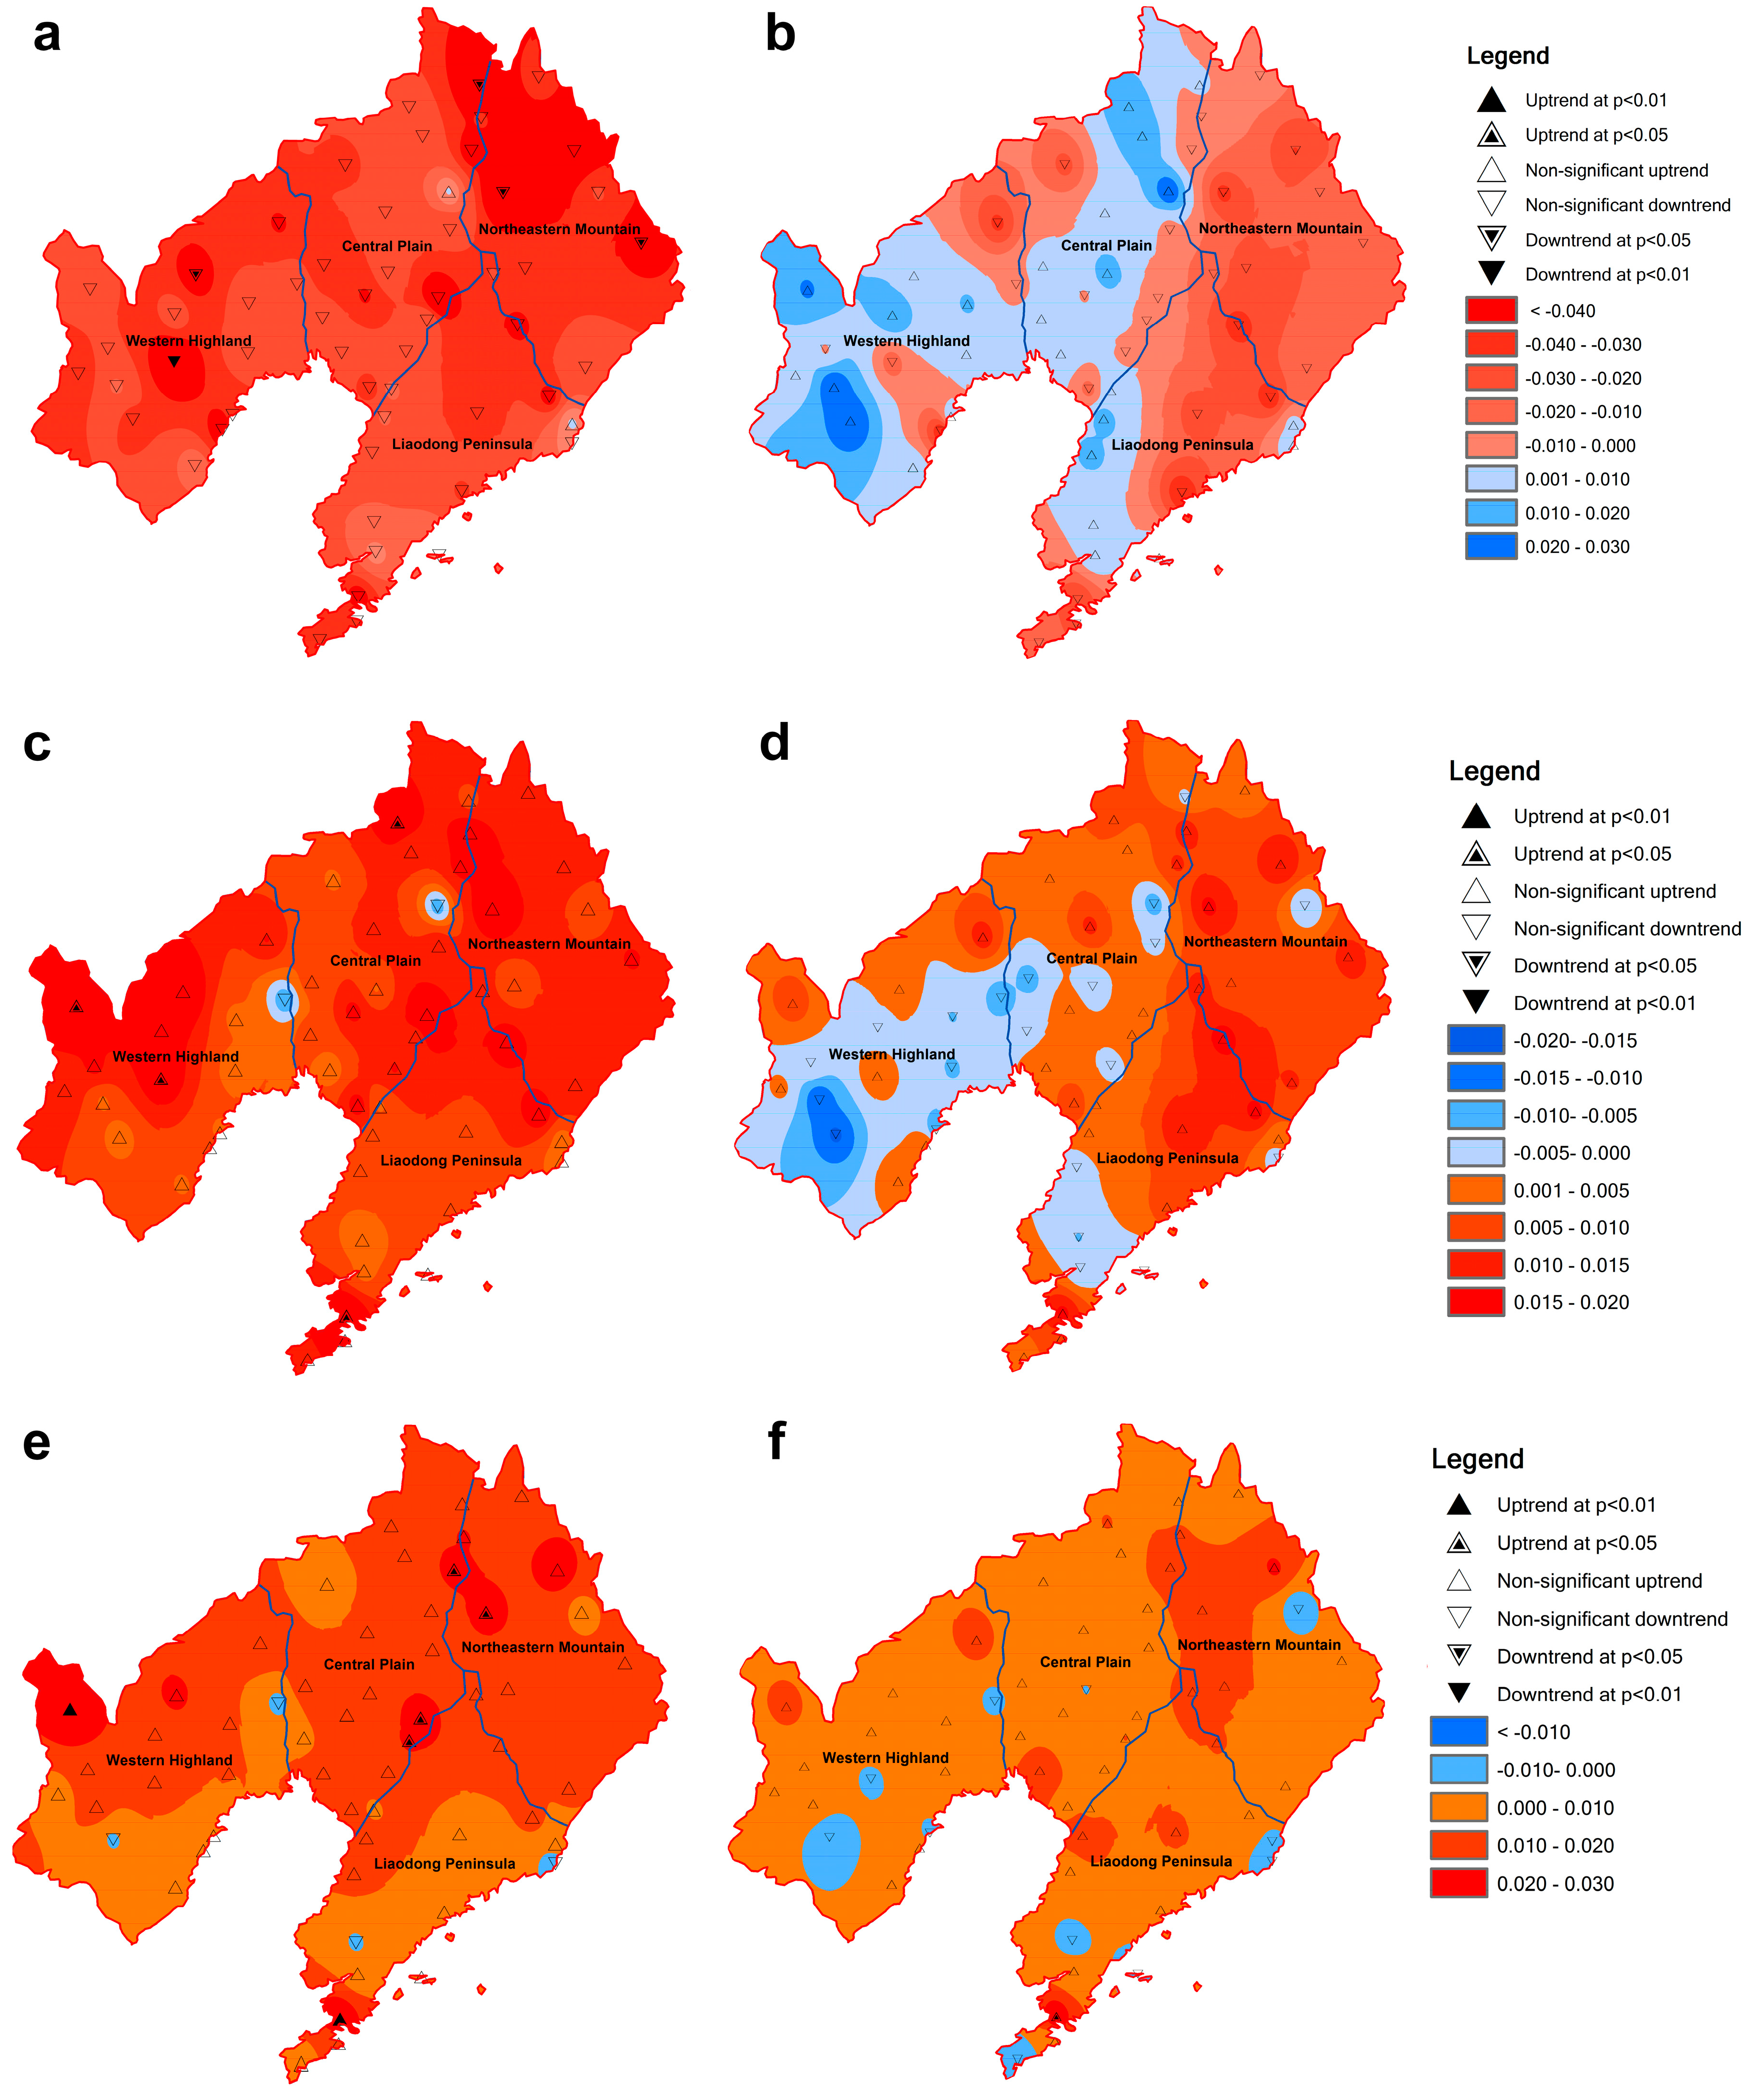
3.2. Spatiotemporal Variability of Drought

Liaoning experienced a province-wide drying trend during the main crop growth stages during the last five decades, while the drought frequency, duration, and magnitude were not as serious as revealed by the SPI. The drought duration is the extent and persistence of the drought, whereas the magnitude of drought is the intensity of the drought [39]. The drought episodes, including the accumulated SPI and SPEI, drought frequency (SPI/SPEI < 0.0), drought duration, and drought magnitude during the main crop growth stages, were all detected by using both SPI and SPEI indices at a one-month lag (Figure 4). Accumulated SPI-1 indicated a province-wide decreasing trend (−0.297 per decade), with five stations having a reduced SPI-1 (p < 0.05 level) (Figure 4a). However, when using the SPEI index, only about half of Liaoning showed a decreasing trend (ranging from −0.088 to 0.266 per decade), and none of the 56 selected stations had a significant decrease (Figure 4b). Similarly, drought frequency detected by SPI during the main crop growth stages had an increasing trend for 96% of meteorological stations, with three being significant (Figure 4c). In comparison, the SPEI results only showed a 61% increasing trend without significant change (Figure 4d). In addition, the magnitude of the SPEI drought frequency trends (ranging from −0.159 to 0.171 per decade) was also lower than those for the SPI (−0.088 to 0.266 per decade).
The drought duration is the longest period of consecutive months with values <0 and the sum of the index values is the drought magnitude [29,30]. The drying trends in both drought duration (Figure 4e) (−0.070 to 0.372 month per decade, 80% nonsignificant and 11% significant increasing trends) and drought magnitude (Figure 4g) (−0.404 to 0.038 per decade, 88% nonsignificant and 9% significant increasing trends) detected by SPI were higher than the SPEI drought duration (Figure 4f) (−0.093 to 0.292 per decade, 80% nonsignificant and 0% significant increasing trends) and drought magnitude (Figure 4h) (−0.026 to 0.011 per decade, 71% nonsignificant and 0% significant increasing trends).

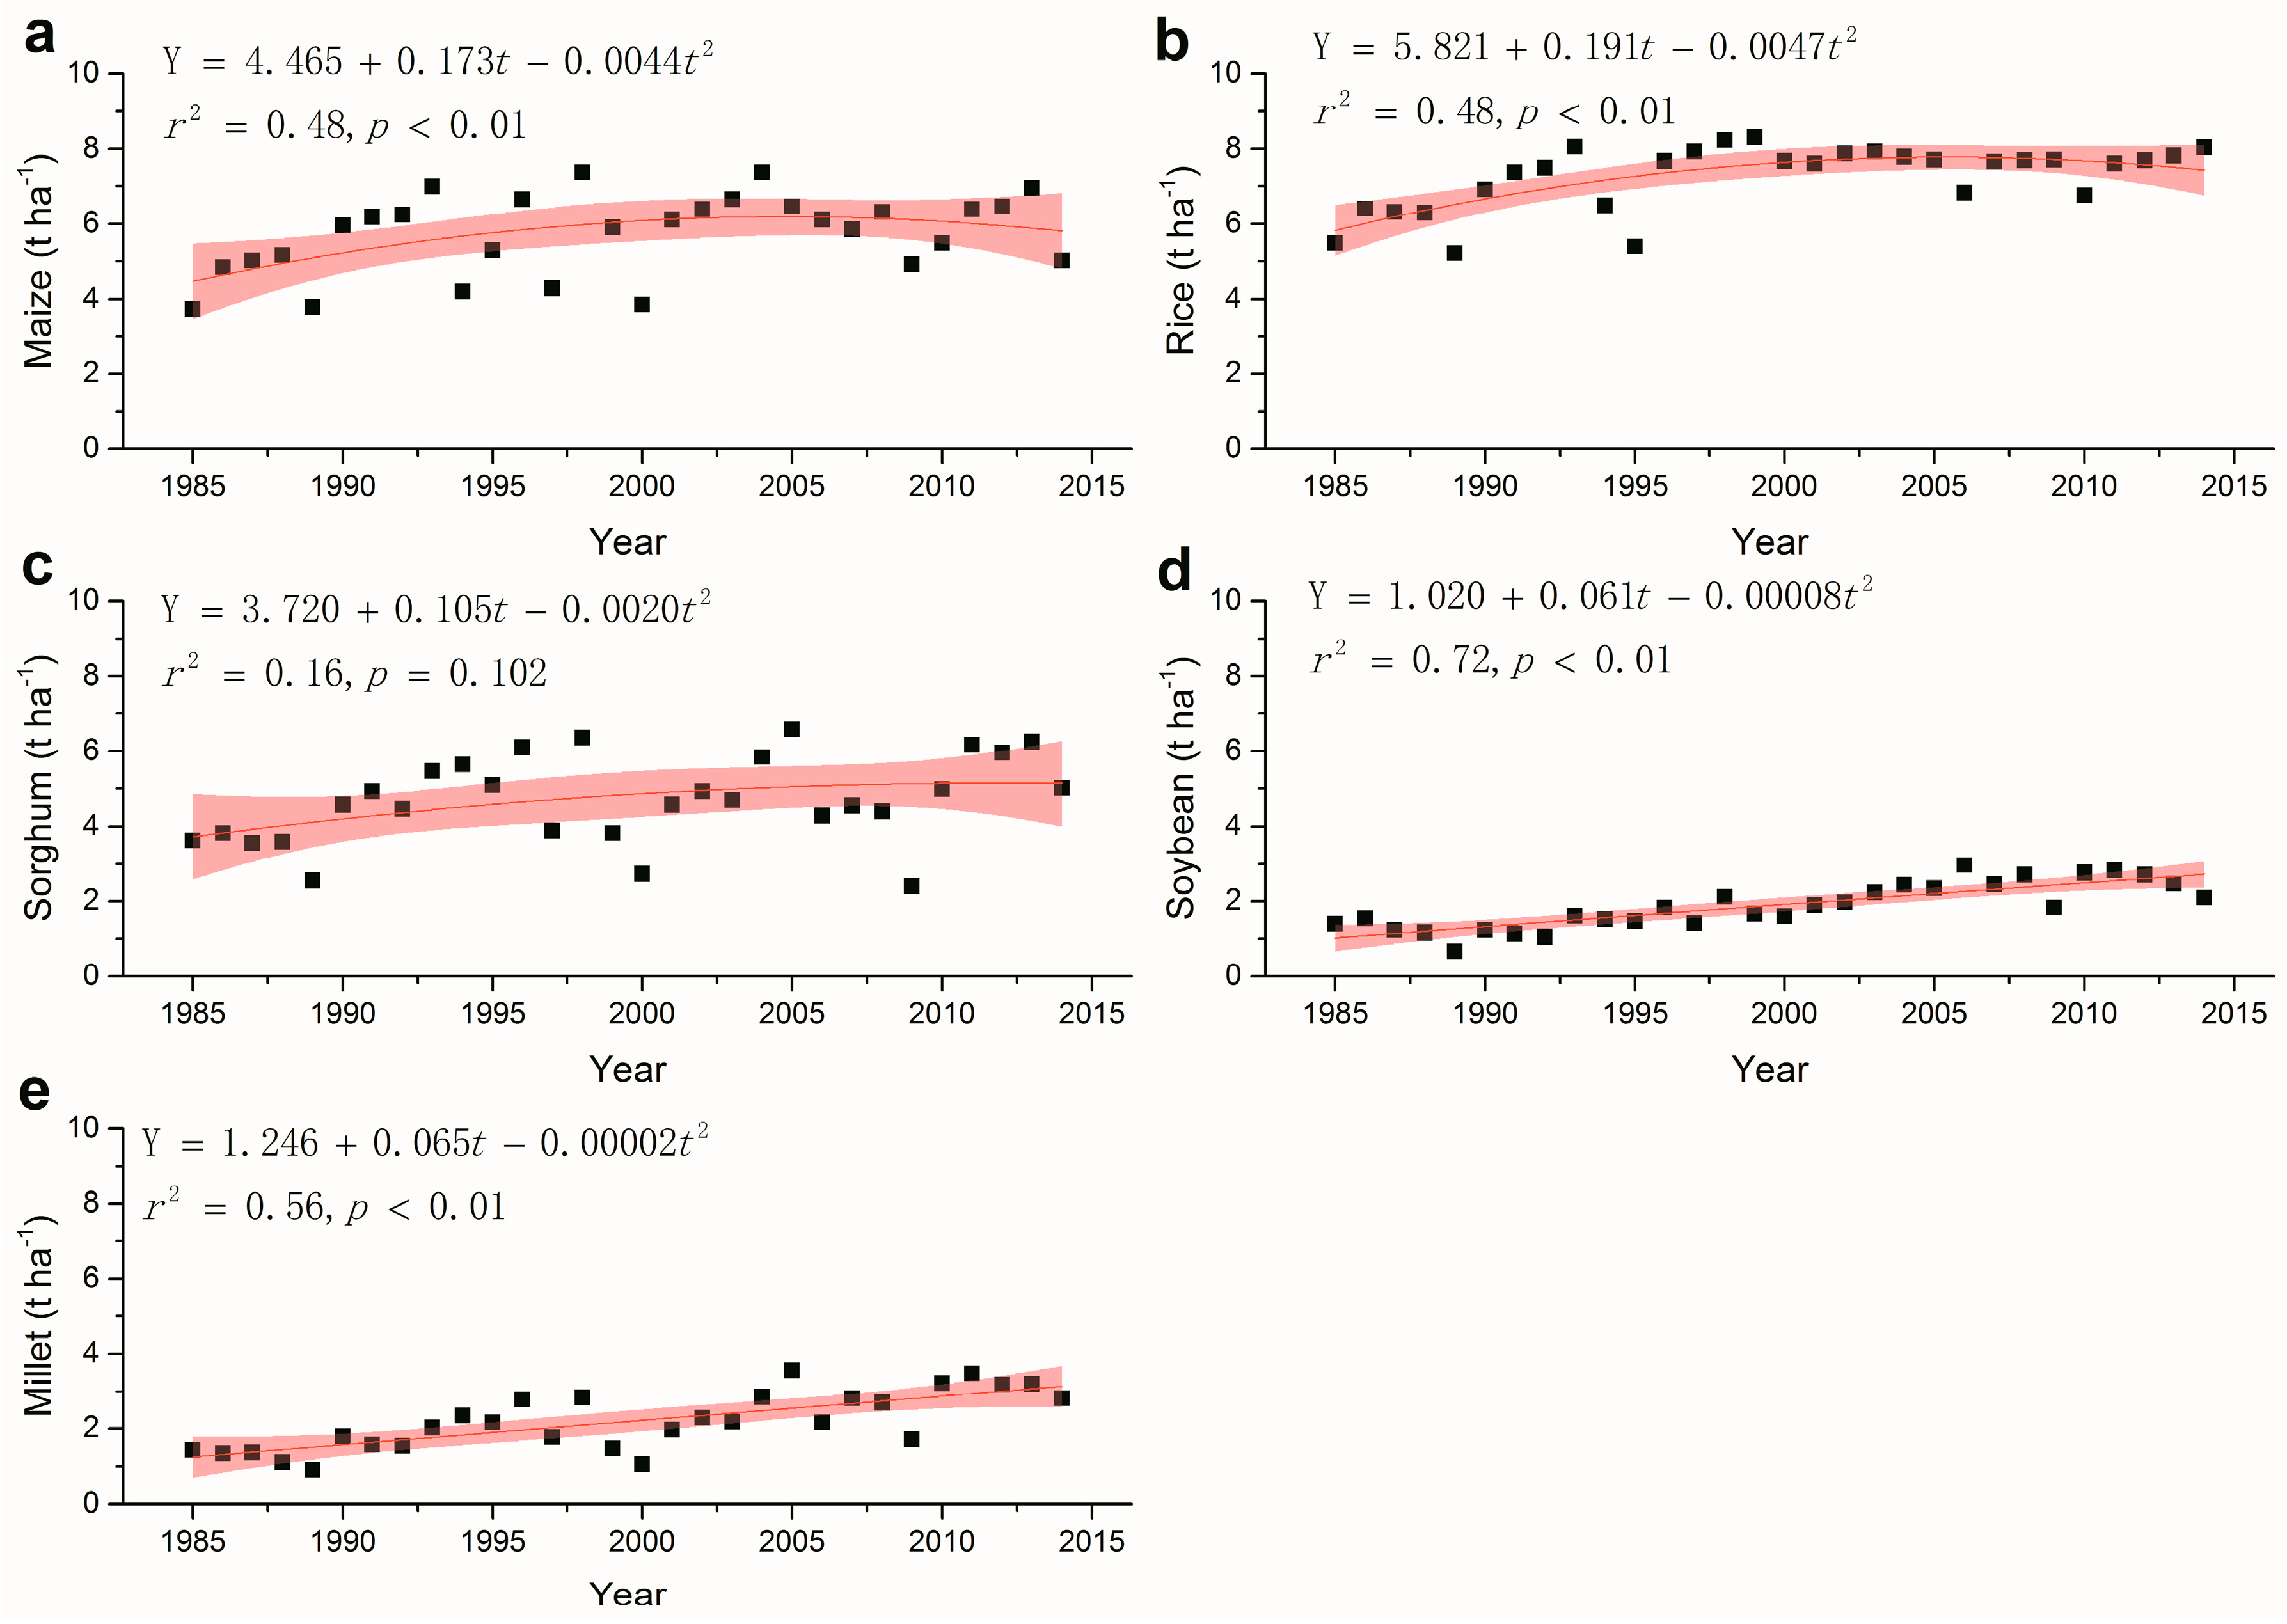
3.3. Long-Term Fluctuation of the Main Cereal Crop Yields

The temporal evolution and quadratic trend of yield at the province level for maize, rice, sorghum, soybeans, and millet during the period 1984–2014 is shown in Figure 5. According to the Liaoning Statistic Yearbook [35], rice is produced more than any other cereal crop (8.0 t·ha−1), followed by maize (5.0 t·ha−1), sorghum (5.0 t·ha−1), soybeans (2.1 t·ha−1), and millet (2.8 t·ha−1). Maize, rice, and sorghum yields all showed quadratic relationships with the year, with an initial increase and a subsequent decline (Figure 5a–c). The contributing factors to the initial increased yield were attributed to be improved cultivars, increased irrigation, and improved farming practices, whereas the subsequent reduced yield were possibly explained by the limitations of meteorological and geographical environment [40], and soil degradation and poor productivity induced by improper fertilizer managements [41]. In contrast, both soybeans and millet showed a sustained improvement in grain yield (Figure 5c,d), due largely to the development of new varieties and improved farming practices, particularly for soybeans.

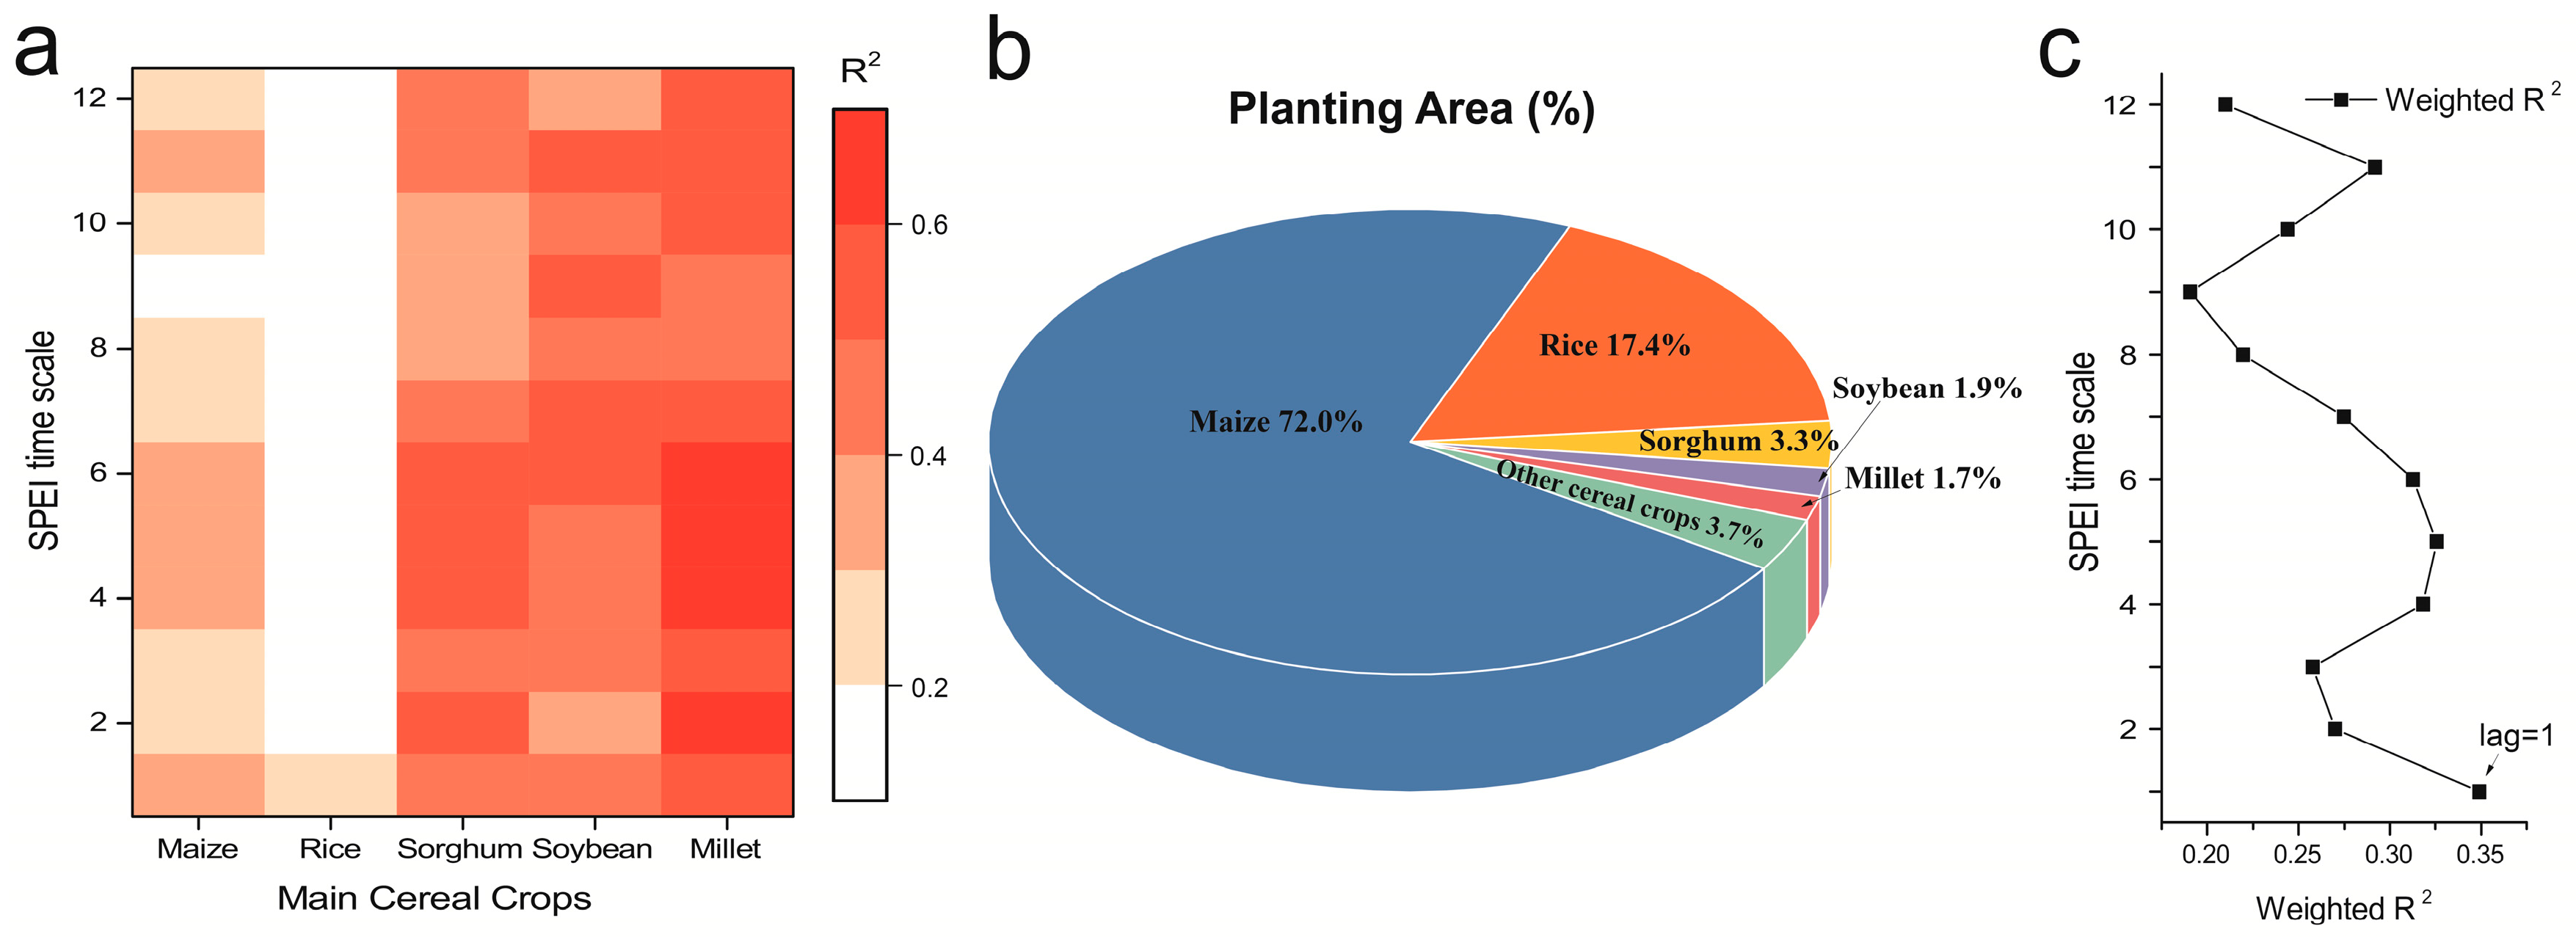
3.4. Drought Impact on the Main Cereal Crop Yields

In order to maximize the probability to explain yield variability, multiple regression analysis was conducted in order to model the relationship between the SYRS and the seven SPEI series (April to October) at different month lags. The coefficients of determination (r2) for each of the main cereal crops at different time scales are shown in Figure 6a. The percentages of the planting area (Figure 6b) were used as weighting coefficients, and the weighted arithmetic mean of the coefficient of determination (r2) was determined at each time scale (Figure 6c). The highest weighted r2 was achieved at the time scale of one-month SPEI lag. Results indicated that the SPEI series of the main cereal crops at one-month lag was the best fit and explained the greatest amount of yield variability for the main cereal crops during the period 1985–2014. Similar results were also reported by Panu and Sharma [42], who indicated that the one-month time scale was best for monitoring the effects of a drought in agriculture. This also explained why the one-month time scale of SPI and SPEI was used to identify the spatiotemporal variability of drought above.
Correlation coefficients (Pearson correlation) between the SPI-1 and SPEI-1 series (April to October), and the SYRS of maize, rice, sorghum, soybeans, and millet are provided in Table 1. The correlation coefficient between the SYRS of maize and the SPEI-1 from sowing to harvest stages ranged from −0.18 to 0.47, with the maximum correlation (r = 0.47, p < 0.05) occurring during the initial reproductive stages (the silking stage in June). This strong correlation between SYRS and SPEI occurs, since maize is particularly susceptible to water shortage at this stage [17]. Severe drought during this stage would cause a considerable yield loss, while the negative correlation during the seedling and milking stages was attributed to the drought not having a significant effect on yield during these two stages. In these stages, water requirements are lower and excess moisture could adversely affect crop production. These results agreed with the SPI-1 data (Table 1) and the multivariate regression analysis (Table 2). However, the SPEI multivariate regression model explained higher maize yield variability (39%), and had higher regression coefficients for June (0.50) and July (0.49) than the 35% yield variability and regression coefficients of 0.35 in June and 0.32 in July for the SPI model, suggesting that SPEI, which takes ET0 into consideration, can evaluate the drought-induced yield impact more accurately for maize.
Rice is an irrigated cereal crop in Liaoning province. The drought impact on rice yield was regulated and reduced by extensive irrigation via a large number of irrigation systems. The considerable agro-irrigation activities are probably the main cause of the relatively lower correlation (Table 1), and lower coefficient of determination for both SPI and SPEI (Table 2). The relative positive response of rice yield to drought conditions may be as explained by Liu et al. [43] and Yin et al. [21], who indicated that climate warming has made the crop growing season longer in Northeast China, which results in some high-yielding varieties with a longer growth duration.
In addition to maize, sorghum, soybeans, and millet are all rain-fed crops. The SPI and SPEI correlation coefficient from the sowing to the harvest of these crops all had positive correlation coefficients (Table 1), suggesting that drought consistently reduced yield each month. The strong correlation between SYRS of sorghum and the SPEI occurred from the jointing to booting stage, with significant positive correlations of 0.37 for June and 0.54 for July. This was observed since water deficit in these stages would adversely affect plant growth and panicle differentiation, resulting in reduced sorghum yield. The highest SPEI correlation coefficient for soybeans was achieved at the flowering and podding stages, as these stages were the most sensitive to water deficits. Millet has one of the lowest water requirements of the grain crops, but, interestingly, our results indicated that millet had the greatest number of significant correlation coefficients. Results indicated that millet yield was more vulnerable to drought in Liaoning province. This observation was supported by the same number of significant correlation coefficients detected by the SPI series. The strong correlation for millet may be caused in part by its shallow root system. The other reason may be that millet, in Liaoning, is usually planted on low-fertility, drought-prone highland without irrigation (drought-sensitive fields), which increases its dependence on natural precipitation, although it is a low water consuming crop.

3.5. Contribution of Drought to Yield Losses for Rainfed Cereal Crops

The effect of drought on agriculture is mainly reflected in the reduction of crop yields [17]. In order to analyze the contribution of drought on yield losses, it is important to calculate the incidence and magnitude of drought during the main crop growth stages and then to quantify the yield losses in response to these rates. The relative yield losses for the main cereal crops in response to the drought are presented in Table 3. The differences in relative yield losses between mild drought (the SPEI-1 from 0.0 to −1.0) [44] and relatively severe drought (SPEI-1 ≤ −1.0) were evident when comparing the two sub-tables in Table 3, except for irrigated rice. The low amounts of yield losses with mild drought conditions suggested that no impact was exerted on the main cereal crops by mild drought. In contrast, severe drought limited crop water availability and markedly reduced yield, despite the lower frequency (10%–16.7%). For example, the highest maize yield losses (19.6%–25.8%) were recorded when severe drought occurred (17.7%) during the crop risk period (June–July). Severe drought in May, June, and July, with a frequency of 13.3%, 10.0%, and 13.3%, caused the highest sorghum yield losses (18.8%, 21.1%, and 19.5%). For both soybean and millet, the drought-induced yield losses consistently occurred from May to August. About 1.9%–27.9% soybean yield losses were recorded when severe drought occurred from the sowing to the seeding stage, with the largest loss being at the flowering-podding stage for soybean (27.9%), whereas 1.8%–25.0% millet yield losses were caused from the sowing to milking stage.

4. Discussion

Liaoning experienced a province-wide warming trend (93% stations, p < 0.05) during the main crop growth stages. These results were consistent with previous studies [1,15,21]. However, in the context of current global warming, 91% of stations had ET0 declines during the main crop growth stages, with 61% showing a decreasing trend (p < 0.05). Our assessment agreed with the finding reported by Gao et al. [22], who indicated a decrease in ET0 over the Liao River basin (part of which was in Liaoning province), despite province-wide temperature increases. This is because the decreases in wind velocity and sunshine duration over Liaoning have a higher negative impact on ET0 than the positive impact of increased temperature [45]. A global review by McVicar et al. [46] also indicated declining ET0 trends under a warming climate in different regions of the world.
Global warming and reduced precipitation are thought to be accelerating the hydrological cycle, which has resulted in increased occurrences of droughts [15,20,21]. Yu et al. [8] found that the regional mean precipitation during the crop-growing season in Northeast China had decreased significantly from 1960 to 2009 and drought occurrence and severity had increased since 1996. Our results confirm the decreased precipitation and the SPI results suggest a province-wide increase in drought frequency, drought duration, and drought magnitude during the main crop growth stages over the past five decades, accounting for 96%, 91%, and 91% of stations, with 5%, 11%, and 9% passing the p < 0.05 significance level, respectively. Despite the relatively small percentage of significant changes, the evidence of a province-wide increase identified by the SPI confirms previous studies. However, for the SPEI, there are only 61%, 80%, and 71% of stations, showing a province-wide increase trend in drought frequency, drought duration, and drought magnitude, respectively, while none of them was statistically significant (p < 0.05). The discrepancies between the SPI and SPEI results are mainly attributed to declines in ET0 considered by SPEI alleviating water deficit [47]. Comparing the two indices, the results of the SPI disregarded the ET0 impact on drought, which considerably overestimated the severity of drought episodes in Liaoning province in the context of a gradual warming trend.
The increased meteorological drought experienced in Liaoning during the main crop growth stages mainly affected rainfed crops (maize, sorghum, soybeans, and millet), including the drought-resistant millet, although its impact on rice yield was regulated and reduced by extensive irrigation systems. Bannayan et al. [48] reported that rainfed crop production is very vulnerable to drought conditions and usually suffers from its occurrence. Our results indicated that the risk periods of drought-induced yield loss were the anthesis-silking stage for maize, the jointing-booting stage for sorghum, the flowering-podding stage for soybean, and the sowing-milking stage for millet. Thus, for a successful cultivation of these crops in Liaoning province, irrigation is critical and necessary during these stages.
Drought is not the only cause of crop yield loss during the main cereal crop growth stage. Increasing evidence suggests that excessive planting area expansion and exploitation of groundwater in Liaoning province, coupled with meteorological drought, has contributed to soil water deficiency and available water decrease, which reduces the yield potential. According to the China Meteorological Administration [49], the maize and rice acreage rapidly expanded during the last five decades in the Northeast Farming Region of China. For example, compared to 1970, the 2011 maize acreage increased 1.4-fold and rice increased 4.5-fold. The explosive growth in the demand for water resources for increased acreages of maize and rice under the warming meteorological environment, in particular rice, would further exacerbate the drought-induced impact on agricultural production [50]. Irrigation is critical during drought risk periods. However, fully adequate irrigation for all the rainfed crops (maize, sorghum, soybeans, and millet) is not a viable solution to drought-induced yield loss, because limited water resources and increasing demand for pumping make irrigation more expensive, which in turn causes agriculture in Liaoning to be more dependent on natural precipitation. Rice consumes high amounts of water, two to three times more than other cereal crops [51]. Reducing the amount of rice planted is one way to alleviate the water deficit. However, large reductions in the rice planting area would become an obstacle to meeting the growing food demand, as rice is the staple food for 65% of people in China and plays a critical role in food security. Therefore, the most economically and sustainably desirable solution would be to develop new breeding varieties of crops with decreased sensitivity to water deficits, and combine them with improvements in irrigation technologies.
The SPI, a precipitation-based drought index, relies on two assumptions: (1) precipitation is the main driver of drought and (2) the other variables, such as temperature and ET0, are stationary [13]. In this study, Liaoning underwent reduced precipitation, but also increased temperature and reduced ET0, which made the assumptions of the SPI invalid, which then affected its assessment for the impact of drought conditions. Although the SPI correlation coefficient was in agreement with the SPEI correlation coefficient, the SPEI multivariate regression model consistently explained higher yield variability, and had higher regression coefficients than those of the SPI model across most rainfed crops at province level (Table 2). These results suggest that the SPEI, with potential evapotranspiration consideration, will estimate the drought-induced yield impact more accurately that the SPI in warming weather conditions. Vicente-Serrano et al. [13] stated that a crucial advantage of the SPEI was its multi-scalar characteristics and comprehensiveness, which enable identification of different drought types and effects in the context of global warming. Our results indicated that, compared to the SPEI, the SPI disregarded the effect of the reduced ET0 and warming weather on drought conditions, which would result in inaccurate estimation of the drought-induced yield loss in Liaoning province. Wang et al. [18] analyzed the performance of five climate-based drought indices in Northern China, including SPI and SPEI, and confirmed that the SPEI is more advantageous for drought monitoring due to its multiscalarity and effective characterization of agricultural droughts. However, Li et al. [15] indicated that the SPEI (using the Thornthwaite equation) overestimated the drought detection in the upper Nen River compared to the SPI. This discrepancy may have been caused by the Thornthwaite equation used in the SPEI calculation rather than the FAO56 Penman–Monteith method. Therefore, our results suggest that the SPEI using the FAO56 Penman–Monteith method is a more useful measure for the identification of drought episodes and the assessment of drought’s impact on agricultural production in Liaoning province.

5. Conclusions

In this study, we provide an overall assessment of drought episodes (drought magnitude, drought duration, drought frequency, and significant level) using the SPI and SPEI during the period from 1960 to 2015 for Liaoning province. Drought impact on the main cereal crops (maize, rice, sorghum, soybeans, and millet) was determined. During the last 56 years, Liaoning underwent a province-wide temperature increase, with reduced precipitation and reference crop evapotranspiration. As expected, both SPI and SPEI indices revealed that Liaoning experienced a province-wide drying trend during the main crop growth stages, while the drought frequency, duration, and magnitude were not as serious as revealed by the SPI, mainly due to the decreased ET0. Increased drought episodes in Liaoning during the main crop growth stages mainly affected rainfed crops (maize, sorghum, soybeans, and millet), while their impact on rice yield was regulated and reduced by extensive irrigation systems. No major impact was exerted on the main cereal crops by mild drought, but severe drought (SPEI < −1.0) reduced the yield of rainfed crops, in particular the anthesis-silking stage for maize, the jointing-booting stage for sorghum, the flowering-podding stage for soybean, and the sowing-milking stage for millet. With the decreased potential evapotranspiration, SPEI explained 39%–78% of the yield variability, and could evaluate the drought-induced yield impact more accurately than the SPI in Liaoning province.

Acknowledgments

This work was supported by the Special Fund for Agro-scientific Research in the Public Interest of China (201303125), the Doctoral Program of Higher Joint Research Fund Funded Project (20112103110007), and the Special Term Professor Fund Projects of Liaoning (Liao Education Bureau, 2013).

Author Contributions

Taotao Chen had the original idea for the study; Daocai Chi and Wei Chen were responsible for data collection; Taotao Chen and Daocai Chi analyzed the data and wrote the paper; Guimin Xia and Tiegang Liu reviewed the paper.

Conflicts of Interest

The authors declare no conflict of interest.

References

  1. Intergovernmental Panel on Climate Change (IPCC). Climate Change 2013. The Physical Science Basis. Working Group I Contribution to the Fifth Assessment Report of the Intergovernmental Panel on Climate Change; Cambridge University Press: Cambridge, UK, 2013. [Google Scholar]
  2. Potop, V.; Možný, M. The Application a New Drought Index-Standardized Precipitation Evapotranspiration Index in the Czech Republic. Available online: http://www.cbks.cz/SbornikSMlyn11/Potop1.pdf (assessed on 8 October 2016).
  3. Yang, M.; Yan, D.; Yu, Y.; Yang, Z. SPEI-based spatiotemporal analysis of drought in haihe river basin from 1961 to 2010. Adv. Meteorol. 2016, 2016, 7658015. [Google Scholar] [CrossRef]
  4. Grayson, M. Agriculture and drought. Nature 2013, 501, S1. [Google Scholar] [CrossRef] [PubMed]
  5. Zhang, Q.; Zhang, J. Drought hazard assessment in typical corn cultivated areas of China at present and potential climate change. Nat. Hazards 2016, 81, 1323–1331. [Google Scholar] [CrossRef]
  6. Chen, Z.; He, X.; Cook, E.R.; He, H.-S.; Chen, W.; Sun, Y.; Cui, M. Detecting dryness and wetness signals from tree-rings in Shenyang, Northeast China. Palaeogeogr. Palaeoclimatol. Palaeoecol. 2011, 302, 301–310. [Google Scholar] [CrossRef]
  7. Wang, A.; Lettenmaier, D.P.; Sheffield, J. Soil moisture drought in China, 1950–2006. J. Clim. 2011, 24, 3257–3271. [Google Scholar] [CrossRef]
  8. Yu, X.; He, X.; Zheng, H.; Guo, R.; Ren, Z.; Zhang, D.; Lin, J. Spatial and temporal analysis of drought risk during the crop-growing season over northeast China. Nat. Hazards 2013, 71, 275–289. [Google Scholar] [CrossRef]
  9. Palmer, W. Meteorological Drought; Research Paper No. 45. Available online: https://www.ncdc.noaa.gov/temp-and-precip/drought/docs/palmer.pdf (assessed on 8 October 2016).
  10. Mckee, T.B.; Doesken, N.J.; Kleist, J. The relationship of drought frequency and duration to time scales. In Proceedings of the 8th Conference on Applied Climatology, Zurich, Switzerland, 13–17 September 2010; Volume 17, pp. 179–183.
  11. Quiring, S.M.; Ganesh, S. Evaluating the utility of the Vegetation Condition Index (VCI) for monitoring meteorological drought in Texas. Agric. For. Meteorol. 2010, 150, 330–339. [Google Scholar] [CrossRef]
  12. Vicente-Serrano, S.M.; Beguería, S. Comment on ‘Candidate distributions for climatological drought indices (SPI and SPEI)’ by James H. Stagge et al. Int. J. Climatol. 2016, 36, 2120–2131. [Google Scholar] [CrossRef]
  13. Vicente-Serrano, S.M.; Beguería, S.; López-Moreno, J.I. A multiscalar drought index sensitive to global warming: The standardized precipitation evapotranspiration index. J. Clim. 2010, 23, 1696–1718. [Google Scholar] [CrossRef]
  14. Park, S.; Im, J.; Jang, E.; Rhee, J. Drought assessment and monitoring through blending of multi-sensor indices using machine learning approaches for different climate regions. Agric. For. Meteorol. 2016, 216, 157–169. [Google Scholar] [CrossRef]
  15. Li, B.; Liang, Z.; Yu, Z.; Acharya, K. Evaluation of drought and wetness episodes in a cold region (Northeast China) since 1898 with different drought indices. Nat. Hazards 2013, 71, 2063–2085. [Google Scholar] [CrossRef]
  16. World Meteorological Organization (WMO). Standardized Precipitation Index User Guide; Svoboda, M., Hayes, M., Wood, D., Eds.; World Meteorological Organization: Geneva, Switzerland, 2012; p. 16. [Google Scholar]
  17. Potopová, V.; Boroneanţ, C.; Boincean, B.; Soukup, J. Impact of agricultural drought on main crop yields in the Republic of Moldova. Int. J. Climatol. 2016, 36, 2063–2082. [Google Scholar] [CrossRef]
  18. Wang, H.; Vicente-serrano, S.M.; Tao, F.; Zhang, X.; Wang, P.; Zhang, C.; Chen, Y.; Zhu, D.; Kenawy, A. Monitoring winter wheat drought threat in Northern China using multiple climate-based drought indices and soil moisture during 2000–2013. Agric. For. Meteorol. 2016, 228, 1–12. [Google Scholar] [CrossRef]
  19. Gerten, D.; Rost, S.; von Bloh, W.; Lucht, W. Causes of change in 20th century global river discharge. Geophys. Res. Lett. 2008, 35. [Google Scholar] [CrossRef]
  20. Kong, Q.; Ge, Q.; Zheng, J.; Xi, J. Prolonged dry episodes over Northeast China during the period 1961–2012. Theor. Appl. Climatol. 2014, 122, 711–719. [Google Scholar] [CrossRef]
  21. Yin, X.; Olesen, J.E.; Wang, M.; Kersebaum, K.-C.; Chen, H.; Baby, S.; Öztürk, I.; Chen, F. Adapting maize production to drought in the Northeast Farming Region of China. Eur. J. Agron. 2016, 77, 47–58. [Google Scholar] [CrossRef]
  22. Gao, Z.; He, J.; Dong, K.; Bian, X.; Li, X. Sensitivity study of reference crop evapotranspiration during growing season in the West Liao River basin, China. Theor. Appl. Climatol. 2016, 124, 865–881. [Google Scholar] [CrossRef]
  23. Li, W.-G.; Yi, X.; Hou, M.-T.; Chen, H.-L.; Chen, Z.-L. Standardized precipitation evapotranspiration index shows drought trends in China. Chin. J. Eco-Agric. 2012, 20, 643–649. [Google Scholar] [CrossRef]
  24. Leeming, F.A. Liaoning. Available online: http://www.britannica.com/EBchecked/topic/338861/Liaoning (accessed on 1 May 2016).
  25. Liu, D.; Guo, S.; Chen, X.; Shao, Q. Analysis of trends of annual and seasonal precipitation from 1956 to 2000 in Guangdong Province, China. Hydrol. Sci. J. 2012, 57, 358–369. [Google Scholar] [CrossRef]
  26. Allen, R.G.; Pereira, L.S.; Raes, D.; Smith, M. Crop Evapotranspiration-Guidelines for Computing Crop Water Requirements—FAO Irrigation and Drainage Paper 56; Food and Agriculture Organization of the United Nations: Rome, Italy, 1998. [Google Scholar]
  27. Beguería, S.; Vicente-Serrano, S.M. SPEI: Calculation of the Standardised Precipitation-Evapotranspiration Index. Available online: https://CRAN.R-project.org/package=SPEI (accessed on 1 May 2016).
  28. Yevjevich, V.M. An Objective Approach to Definitions and Investigations of Continental Hydrologic Droughts; Hydrology Papers No. 23; Colorado State University: Fort Collins, CO, USA, 1967. [Google Scholar]
  29. Rawat, K.S.; Tripathi, V.K. Standardized precipitation index based approach for development of regional drought monitoring system. J. Remote Sens. Technol. 2016, 4, 48–57. [Google Scholar] [CrossRef]
  30. Vicente-Serrano, S.M.; López-Moreno, J.I.; Drumond, A.; Gimeno, L.; Nieto, R.; Morán-Tejeda, E.; Lorenzo-Lacruz, J.; Beguería, S.; Zabalza, J. Effects of warming processes on droughts and water resources in the NW Iberian-Peninsula (1930–2006). Clim. Res. 2011, 48, 203–212. [Google Scholar] [CrossRef]
  31. Yue, S.; Pilon, P.; Phinney, B.; Cavadias, G. The influence of autocorrelation on the ability to detect trend in hydrological series. Hydrol. Process. 2002, 16, 1807–1829. [Google Scholar] [CrossRef]
  32. Sen, P.K. Estimates of the regression coefficient based on Kendall’s Tau. J. Am. Stat. Assoc. 1968, 63, 1379–1389. [Google Scholar] [CrossRef]
  33. Theil, H. A Rank-Invariant Method of Linear and Polynomial Regression Analysis. Available online: http://www.nrc.gov/docs/ML1330/ML13304B779.pdf (assessed on 8 October 2016).
  34. Marchetto, A. rkt: Mann-Kendall Test, Seasonal and Regional Kendall Tests. Available online: https://CRAN.R-project.org/package=rkt (accessed on 6 March 2016).
  35. Liaoning Statistics Bureau. Liaoning Statistical Yearbook 2014; China Statistics Press: Beijing, China, 2015. (In Chinese) [Google Scholar]
  36. Lobell, D.B.; Asner, G.P. Climate and management contributions to recent trends in US agricultural yields. Science 2003, 299, 1–17. [Google Scholar] [CrossRef] [PubMed]
  37. Wu, H.; Hubbard, K.G.; Wilhite, D.A. An agricultural drought risk-assessment model for corn and soybeans. Int. J. Climatol. 2004, 24, 723–741. [Google Scholar] [CrossRef]
  38. Feng, J.; Wu, J. Drought disaster situation in China and the main strategy for reducing drought risk. J. Catastrophol. 2008, 23, 34–36. [Google Scholar]
  39. Das, P.K.; Dutta, D.; Sharma, J.R.; Dadhwal, V.K. Trends and behaviour of meteorological drought (1901–2008) over Indian region using standardized precipitation-evapotranspiration index. Int. J. Climatol. 2016, 36, 909–916. [Google Scholar] [CrossRef]
  40. Li, H.; Yao, F.-M.; Zhang, J.-H.; Hao, C. Analysis on climatic maize yield and its sensitivity to climate change in Northeast China. Chin. J. Agrometeorol. 2014, 35, 423–428. [Google Scholar]
  41. Liu, X.; Zhang, X.; Wang, Y.; Sui, Y.; Zhang, S.; Herbert, S.; Ding, G. Soil degradation: A problem threatening the sustainable development of agriculture in Northeast China. Plant Soil Environ. 2010, 56, 87–97. [Google Scholar]
  42. Panu, U.S.; Sharma, T.C. Challenges in drought research: Some perspectives and future directions. Hydrol. Sci. J. 2002, 47, S19–S30. [Google Scholar] [CrossRef]
  43. Liu, Z.; Zhang, G.; Yang, P. Geographical variation of climate change impact on rice yield in the rice-cropping areas of Northeast China during 1980–2008. Sustainability 2016, 8, 670. [Google Scholar] [CrossRef]
  44. Vicente-Serrano, S.M.; Beguería, S.; Lorenzolacruz, J.; Camarero, J.J.; Lópezmoreno, J.I.; Azorinmolina, C.; Revuelto, J.; Morántejeda, E.; Sanchezlorenzo, A. Performance of drought indices for ecological, agricultural, and hydrological applications. Earth Interact. 2012, 16, 1–27. [Google Scholar] [CrossRef]
  45. Zhang, S.J.; Zhang, Y.S.; Sui, D.; Cai, F.; Jin-Wen, W.U.; Rui-Peng, J.I.; Chen, P.S.; Liu, Q.W. Changes in reference evapotranspiration and its causes in Northeast China. J. Nat. Resour. 2010, 25, 1750–1761. [Google Scholar]
  46. Mcvicar, T.R.; Roderick, M.L.; Donohue, R.J.; Li, L.T.; Niel, T.G.V.; Thomas, A.; Grieser, J.; Jhajharia, D.; Himri, Y.; Mahowald, N.M. Global review and synthesis of trends in observed terrestrial near-surface wind speeds: Implications for evaporation. J. Hydrol. 2012, 416–417, 182–205. [Google Scholar] [CrossRef]
  47. Mishra, A.K.; Singh, V.P. Drought modeling—A review. J. Hydrol. 2011, 403, 157–175. [Google Scholar] [CrossRef]
  48. Bannayan, M.; Sanjani, S.; Alizadeh, A.; Lotfabadi, S.S.; Mohamadian, A. Association between climate indices, aridity index, and rainfed crop yield in northeast of Iran. Field Crops Res. 2010, 118, 105–114. [Google Scholar] [CrossRef]
  49. China Meteorological Administration (CMA). Global Warming as a Driver Significantly Accelerates Northeast Grain Crops Extending to the North. Available online: http://www.weather.com.cn/climate/2013/07/qhbhyw/1927592.shtml (accessed on 4 July 2014).
  50. Xu, X.; Ge, Q.; Zheng, J.; Dai, E.; Zhang, X.; He, S.; Liu, G. Agricultural drought risk analysis based on three main crops in prefecture-level cities in the monsoon region of east China. Nat. Hazards 2013, 66, 1257–1272. [Google Scholar] [CrossRef]
  51. Bouman, B.A.M.; Humphreys, E.; Tuong, T.P.; Barker, R. Rice and water. Adv. Agron. 2007, 92, 187–237. [Google Scholar]
Figure 1. Spatial distribution of the 56 meteorological stations in Liaoning province, China.
Sustainability 08 01069 g001
Figure 2. (a) Monthly precipitation (P, mm); (b) reference crop evapotranspiration (ET0, mm); (c) water deficit (P-ET0, mm) series; and (d) the SPEI series calculated at different time scales.
Sustainability 08 01069 g002
Figure 3. (a) Spatial distribution of temperature (°C·year−1); (b) precipitation (mm·year−1); (c) ET0 (mm·year−1) trends and the significances for the 56 meteorological stations in Liaoning province, China. The Theil–Sen approach was used to estimate the magnitude of time-series trends, while the Mann–Kendall non-parametric test was used to quantify the significance.
Sustainability 08 01069 g003
Figure 4. Spatial distribution of drought trends in accumulated SPI-1 (standardized precipitation index at one-month lag) and SPEI-1 (standardized precipitation-evapotranspiration index at one-month lag) (a,b); drought frequency (number of droughts per year) (c,d); drought duration (number of months per year) (e,f); and drought magnitude (g,h) during main crop growth stages detected by using the SPI (a,c,e,f) and SPEI (b,d,f,h) indices and the significances for the 56 meteorological stations in Liaoning province, China. The Theil–Sen approach was used to estimate the magnitude of time-series trends, while the Mann–Kendall non-parametric test was used to quantify the significance.
Sustainability 08 01069 g004aSustainability 08 01069 g004b
Figure 5. The temporal evolution and the quadratic trend of yield (t·ha−1) at the Liaoning province level for (a) maize; (b) rice; (c) sorghum; (d) soybeans; and (e) millet from 1985 to 2014. The confidence bands around the quadratic polynomial regression curve were generated by the 95% confidence intervals.
Sustainability 08 01069 g005
Figure 6. (a) The coefficients of determination (r2) for each of the main cereal crops (maize, rice, sorghum, soybeans, and millet); (b) the percent planting area for the main cereal crops in Liaoning province; and (c) the weighted arithmetic mean of r2 for the crops at different time scales.
Sustainability 08 01069 g006
Table 1. Correlation coefficients of the SPI-1 and SPEI-1 series (April to October), and the standardized yield residuals series (SYRS) for maize, rice, sorghum, soybeans, and millet in Liaoning province for the period 1985–2014.
MonthMaizeRiceSorghumSoybeansMillet
SPI-1
April0.280.09−0.070.290
May−0.24−0.340.170.050.39 *
June0.45 *0.010.360.20.23
July0.36−0.240.52 **0.310.51 **
August−0.1−0.230.330.57 **0.50 **
September0.150.040.210.020.18
October−0.02−0.16−0.05−0.01−0.11
SPEI-1
April0.070.00−0.140.17−0.08
May−0.15−0.260.190.190.42 *
June0.47 *−0.030.37 *0.290.28
July0.27−0.320.54 **0.300.56 **
August−0.18−0.210.360.51 **0.53 **
September0.02−0.210.150.100.20
October−0.04−0.13−0.03−0.08−0.11
* Denotes significance at p < 0.05; ** denotes significance at p < 0.01. Columns shaded in light gray indicate the specific growth season for each of the main cereal crops.
Table 2. Linear estimates of regression coefficients for the standardized yield residuals series (SYRS) of maize, rice, sorghum, soybeans, and millet in response to the SPI-1 and SPEI-1 series.
MonthMaizeRiceSorghumSoybeanMillet
SPI-1SPEI-1SPI-1SPEI-1SPI-1SPEI-1SPI-1SPEI-1SPI-1SPEI-1
Intercept0.00−0.020.010.030.00−0.050.00−0.03−0.01−0.06
April−0.02−0.01////////
May−0.25−0.25−0.41−0.340.080.01−0.14−0.120.280.22
June0.350.50 *−0.020.040.37 *0.47 *0.300.400.32 *0.39 *
July0.320.49−0.21−0.260.39 *0.56 *0.150.300.330.54 *
August−0.02−0.02−0.08−0.110.300.40 *0.66 **0.77 **0.41 *0.53 *
September0.100.070.160.11//−0.08−0.13−0.03−0.11
October//−0.23−0.35//////
R20.350.390.250.210.450.470.480.780.550.59
p0.060.030.310.44<0.01<0.01<0.01<0.01<0.01<0.01
* Denotes significant regression coefficients at p < 0.05; ** denotes significance at p < 0.01.
Table 3. Quantification of the yield crop losses due to drought impact (0 > SPEI-1 ≥ −1.0 and SEPI-1 ≤ −1.0) during the main crop stages at the country level for the 1985–2014 farming years.
SPEI-1MonthFrequency of Drought (%)Relative Yield Variation (%)
MaizeRiceSorghumSoybeansMillet
−1.0 to 0.0 (Mild drought)April20.06.7
May30.0−0.5−2.5−10.34.2−9.2
June23.34.61.93.4−3.9−2.6
July40.03.21.8−4.00.8−3.8
August36.76.02.8−2.60.2−6.9
September43.30.82.5 0.4−1.9
October30.0 5.1
≤−1.0 (Severe drought)April16.7−18.6
May16.710.76.27.9−1.9−1.8
June13.3−19.6−1.7−18.8−4.8−11.8
July10.0−25.84.9−21.1−19.5−25.0
August13.3−10.8−0.9−19.5−27.9−23.0
September6.74.90.8 4.38.1
October10.0 −0.7

