
Critical Review of the Millennium Project in Nepal


1
Department of Social Sciences, Michigan Technological University, Houghton, MI 49931, USA
2
School of Forest Resources and Environmental Science, Michigan Technological University, Houghton, MI 49931, USA
*
Author to whom correspondence should be addressed.
Sustainability 2016, 8(10), 1043; https://doi.org/10.3390/su8101043
Submission received: 8 August 2016
/
Revised: 8 October 2016
/
Accepted: 13 October 2016
/
Published: 18 October 2016
(This article belongs to the Section Sustainable Education and Approaches)
Abstract
:“Our Common Future” harmonized development policies around a new sustainable development (SD) paradigm, and experts also emphasize the importance of a democratic and equitable approach to define and achieve sustainable development. However, SD targets and indicators are often defined by a suite of experts or a few stakeholder groups, far removed from on-the-ground conditions. The most common expert-led development framework, the United Nations’ Millennium Development Goals (MDGs), promoted one set of targets and indicators for all developing countries. While progress towards these targets was routinely reported at the national scale, these targets may not reflect context-specific sustainable development. We evaluated the relevance and comprehensiveness of MDG 7 (environmental sustainability) for Nepal. Although Nepal has met most of the MDG 7 (e.g., forest cover, protected areas coverage, water and sanitation), on closer inspection these indicators do not provide adequate context for ensuring that these targets provide the intended levels of development. Simple forest cover and protected area indicators belie the dearth of ecological conservation on the ground, and water and sanitation indicators do not reflect the inequality of access based on poverty and regions. While the Millennium Development Goals align with broad sustainability concerns in Nepal, these indicators do not reveal its true development conditions.
1. Introduction
Since the establishment of the United Nations in the late 1940s, international development goals have been a powerful driver of international cooperation as well as policy harmonization or convergence [1,2,3,4,5,6]. Interest in development measures other than economic growth (such as environmental quality or social equity) was low until the late 1980s, when sustainable development (SD) finally emerged as a new development paradigm [1,7,8,9,10,11,12,13,14]. As a result, cross-sectoral development projects and sustainability assessment frameworks began to proliferate after the 1990s [11,15,16].
The term “development” is often used interchangeably with “sustainable development” to indicate a confluence between economic viability, inter and intra-generational justice and equity, and environmental protection [4,17]. The most popular attempt to operationalize SD is the United Nations’ (UN) Millennium Project, initiated in September 2000, using a suite of goals (8), targets (21), and indicators (60) to monitor each country’s progress until 2015. These Millennium Development Goals (MDGs) were a standard bearer for the systematic monitoring and promotion of international development [15,18], and were one of the few that recognized SD as more than economic growth [19,20]. Many viewed the effort as a culmination of past commitments and rhetoric of the UN and Organisation for Economic Cooperation and Development (OECD) members into a single, comprehensive development framework [3,15,18]. However, the project was not an across-the-board success, and the MDG framework has been criticized as contributing to the project’s mixed record of success [20,21,22,23,24].
Like many global assessments, MDGs downplay the lack of comparable data; methods for data measurement can vary by country, and different countries may have different SD priorities. This produces unreliable and suspect rankings among countries [21]. Additionally, inequality and poor governance have long been associated with poverty and slow development, but these were mostly overlooked by the MDGs [15,25,26,27,28,29]. Many argued that using the MDG targets as a common measure of success for all developing countries was unfair, and could encourage the ‘misrepresentation of outcomes’ and the distortion of statistics [20,21,28]. Finally, the participation of developing countries in setting international development goals was limited to soliciting feedback and endorsements from heads of state, as is common for many top-down sustainable development assessments [5,11,15,26,27,30,31]. Many donor agencies and national governments have used MDGs as their “consensus objectives” to define development needs at national and local levels, without paying much heed to local contexts and riorities [15]. Without information on context, crucial issues are often missed, such as data availability, available grassroots support, and practicality/applicability [11,15,26,32]. This can hinder the implementation of development policy and the effectiveness of the development targets and indicators, due to a failure to acknowledge the diversity of needs stemming from the uneven pace of development [15].
There are growing calls to review the impacts of MDGs on developing countries [15,24], particularly as the UN transitions to the new “Sustainable Development Goals” process that continues the work of the Millennium Project. For example, in one study, less than half of the 126 countries showed any marked improvement by 2010, and at least 30% either showed no improvement, or regressed in half of the indicators examined [24]. Fukuda-Parr (2008) examined the impact of MDGs on the Poverty Reduction Strategy Papers (PRSPs) of 22 developing countries. (PRSPs are national development plans that are expected to reflect a government’s priorities, policy reforms and action plans in relation to poverty reduction. PRSPs are required by the International Monetary Fund (IMF) and the World Bank from the developing countries to apply for any kind of funding as a part of their poverty alleviation and development initiatives.) While MDGs received a high degree of acceptance by nations and donor agencies, this did not translate into an influence of resource allocation and planning frameworks [15]. This finding is similar to Happaerts’s (2012) analysis of the influence of international SD policies on operational goals and instruments at the subnational levels [6]. Conversely, Official Development Aid (ODA) from aid agencies can be sensitive to the progress that developing countries were making toward MDG targets [33]. Since the adoption of MDGs, the flow of ODA has concentrated more toward the countries performing poorly in achieving MDG targets (the MDG score index was introduced and used to rank countries in terms of their performance in their progress toward MDG targets [33]).
Given the influence that the MDGs can have on development aid and government policies, we wanted to determine how well the MDG framework reflects the state of development conditions on the ground. We focus on Nepal, as it is a biologically and culturally rich country with a significant sustainable tourism sector. Any lack of development progress should be detected by MDG indicators, as the government has explicitly committed itself to develop Nepal beyond “Least Developed Country” status in a sustainable manner [34]. First, we describe our methods and provide a bird’s eye view of the MDGs as compared to the national development framework for Nepal in Section 2. In Section 3, we evaluate the MDG Goal 7 (Environmental Sustainability) indicators to determine their relevance and effectiveness for Nepal. Lastly, in Section 4, we summarize the limitations of expert-generated SD indicators in national or local contexts, and provide recommendations based on our findings.
2. Materials and Methods
2.1. Case Study Background: Nepal
Sandwiched between two economic giants (i.e., India and China), Nepal is one of the 48 least developed and lowest income countries in the world [35]. Nepal, a country with a population of over 28 million, had a GNI per capita (at purchasing power parity) of US $2500 in 2015, which put it in a low-income category [36]. Nepal is divided into 75 governance districts, 14 zones and five development regions. Occupying a total of 147,181 km2, Nepal is ecologically and culturally diverse, with the Himalayas in the north, hills and fragile land structures in the central region, and fertile lowlands and plains in the south, constituting 35%, 42% and 23% of its total land area respectively [37].
Nepal had a state-controlled political system until 1990, after which it adopted a multi-party democracy system following the historic people’s movement. Development progress has been severely hampered by several periods of political unrest, including a ten year long Maoist insurgency (1996–2006), an appropriation of political power by the Monarchy afterwards, the people’s movement of 2007 and the subsequent abolishment of the Monarchy in 2008, and a political impasse resulting from a delayed Constitution-making process 2008–2015. On the other hand, the political transformation in 1990 had allowed an upsurge of pluralism and promoted a market-oriented, neoliberal economy [38]. The active participation of private sector actors and a rise in the number of non-governmental organizations have made some targeted progress towards development goals. Nevertheless, Nepal’s development has not been satisfactory mainly due to long-standing issues such as a lack of infrastructure, energy sources and stable financial resources, weak governing institutions, slow reforms, and a lack of transparency [39]. These challenges have put Nepal into a “poverty trap” [40]. Despite an abundant flow of foreign aid and existing development programs, the country’s socio-economic and environmental conditions continue to remain unsatisfactory [38,39].
2.2. Before the Adoption of MDG
Since 1990 (the baseline year for the MDGs), Nepal has completed five periodic development plans, of which two (Eighth and Ninth) were formulated before 2000 (Table 1). National priorities have been identified based on three categories: target setting, budget allocation, and commitment shown through specific programs. Nepal realized, at the beginning of the Eighth Plan (1992–1996), that economic growth alone may not be sufficient to rescue the nation from the quagmire of poverty and hunger [41,42]. Specific programs were initiated during the Eighth Plan to improve the livelihoods of the poor at community and village levels. The main focus of the development plans in the early 1990s were: the devolution of power to local bodies; mitigation of social and economic disparities between regions (hills/mountains versus plains/valleys); optimization of means and resources to enhance national production; economic liberalization; development and modernization of the agriculture sector; infrastructure development to improve social services (such as communication, transport, energy, health care, education, drinking water and sanitation); and the efficiency and effectiveness of foreign assistance.
2.3. Post MDG Adoption
The development focus for Nepal changed around 2000, particularly because of the Maoist insurgency and the socio-economic and infrastructural damages that it caused [43,44,45]. Peace, rebuilding/reconstruction, and reintegration were prioritized in the 2000s. In the late 2000s, the country remained preoccupied in building a structural and legal base for its transformation to a Federal Democracy. However, poverty alleviation, mitigating regional and social disparity in access to basic facilities, decentralization and participatory planning, private sector development, market liberalization, and the revival of the economy still remained priorities of the Tenth, Eleventh and the Twelfth Plans (Table 1). Since the 1990s, the devolution of power to local governments and mobilization of private sector and Non-Governmental Organizations (NGO) actors in development activities have become major development strategies. The most recent Plans have increased the number of targeted programs to improve socio-economic conditions of poor, vulnerable and marginalized populations through skill-based/entrepreneurship training and capacity building programs, microfinance and rural loan programs, and by improving their access to education and health care. The success of these programs is debatable, given the regional and caste or ethnic disparity that still exists in multiple dimensions of development across the country [39,46,47,48].
The Tenth Development Plan (2002–2007), has been frequently cited as a strategic document for poverty alleviation or the country’s PRSP [43]. Consistent with what Fukuda-Parr (2008) found in the PRSPs of 22 other developing countries, the key focus of the Nepalese PRSP was poverty alleviation, health, education, and gender equality (Table 1). While the Tenth Plan was vague on how to expedite Nepal’s progress toward MDG targets, it explicitly underlined the Government of Nepal’s (GoN) commitment to “provide necessary information in the specified time about the indicators” [43]. The Eleventh and Twelfth Plans on the other hand were clear about the government’s interest in prioritizing national development goals that aligned with the MDGs, and to fast-track Nepal’s progress toward MDG targets.
While socio-economic development has been the crux of Nepal’s development agenda since the beginning of democratic governance in Nepal, environment-related concerns have mainly stemmed from issues such as the illegal trade of wildlife and forest resources [42,49]. The Ninth Plan (1997–2001) remained focused on raising awareness about the significance of biodiversity (especially rare and endangered species) and the importance of local-indigenous knowledge. Similar to forest resources, an emphasis on water resources has remained consistent throughout development plans, primarily for their importance to energy (hydropower) generation, residential water supply, flood-control, irrigation, and industry [41,50].
In the 1990s, Nepal signed a number of international and regional accords (Rio Convention, UN Convention on Biological Diversity, Ramsar Convention on Wetlands, Kyoto Protocol, South Asian Cooperation Environmental Program, etc.), which centralized ecological integrity and sustainable development in Nepal’s development agenda. As a result, a number of environmental acts were signed into law and conservation strategies were developed. In 1994, the GoN facilitated the Biodiversity Profiles Project with financial support from the Government of the Netherlands, and released the first Biodiversity Profiles of Nepal, a comprehensive and scientific documentation of biological diversity in Nepal [51]. However, due to a lack of institutional capacity, financial resources, public awareness, and technical expertise, conservation strategies developed during this period were not as effective as desired [43]. Furthermore, although the Plans highlighted environmental problems from excessive deforestation and rapid urbanization, development plans in the 1990s did not prescribe actions to mitigate them [41,42].
The 1990s sustainability-related global initiatives introduced environmental consciousness and SD concepts into Nepal’s development framework [43]. Environmental education was integrated into the school curriculum from the primary to the University level, and environmental sustainability received greater nation-wide attention, which led to the institutionalization and accelerated growth of environment-related NGOs (from 386 in 1997 to 1196 in 2007) [37,43,44]. The Eleventh Plan (2008–2010) played a key role in institutionalizing environmental monitoring and auditing frameworks, and in mainstreaming climate change and environmental concerns into political and development agendas. International commitments made during early Plan periods (such as Kyoto Protocol, Clean Development Mechanism, Biodiversity Conservation Strategy) were acted upon at various scales in collaboration with INGOs, NGOs, and community-based organizations (CBOs) [44,45]. By the Twelfth Plan (2011–2013), Nepal had developed and implemented a number of conservation projects, regulatory policies and standards, and a National Adaptation Plan of Action for climate change [45]. (Drinking water and sanitation are listed as social sector or health sector issues due to their strong correlation with water-borne diseases and are not in the list of environmental issues in the Periodic Plans of Nepal [43,44].)
2.4. Content Analysis
We used content analysis to evaluate all development plans completed since the 1990s by the Government of Nepal (GoN) to examine their alignment with the MDGs. We identified the major development goals of the country over the past 25 years (from 1990 to 2015) based on the targeted programs and sectoral budget allocations as stated in the development plans. Additionally, we used data obtained from the GoN and UN affiliates’ websites, peer-reviewed journal articles, and grey literature from national and international governments for our analysis of MDG 7. We used online database systems such as Google Scholar, Web of Science and ProQuest to search for journal articles related to each MDG 7 indicator. We then used directed content analysis to conceptually extend our hypothesis that top-down indicators do not adequately capture Nepal’s progress toward sustainable development. Directed content analysis relies on existing theory or research to identify coding categories [52]. For each environmental indicator used by the Millennium Project, first we reviewed the background (in UN MDG reports) that justifies its selection as an indicator of the given environmental goal. We then reviewed Nepal’s progress towards the target set for each indicator as reported in Nepal MDG Progress Reports and national survey reports. Finally, we examined two aspects of each indicator: (i) how the general background that supports the selection of the indicator applies to Nepal; (ii) how the reported target reflects or does not reflect Nepal’s actual progress on the ground. We accomplished the last two tasks through a review of government reports, survey reports, peer-reviewed journals and grey literature produced by various government and non-governmental organizations.
2.5. Goals and Indicators Analysis
“Development” is a multidimensional concept that embodies “values, goals and standards which make it possible to compare a present state against a preferred one” [1]. Time-bound targets are often used to quantify development goals [31], and indicators are a set of variables that indicate a system’s progress toward those targets. Development indicators may be used to: (i) diagnose a particular development situation; (ii) make development-related predictions, and (iii) evaluate progress of a system toward predefined development targets [2,11]. Development indicators can also be used to encourage development activities, decisions, or policy reforms [11,14,32]. One development goal may have several indicators, tailored to the stage of development and the context in which the development is taking place [2].
We examined each of the indicators for MDG 7 against commonly supported characteristics of appropriate and effective indicators for assessment. Some of the frequently cited guidelines for the selection of indicators are:
- (i)
- Indicators must be practical: Availability of data or sound methodology to collect new data for any given indicator is what makes it practical [1,11,32,53,54,55] (e.g., female literacy rate is a practical indicator of women empowerment in Nepal, because pertinent data are collected on a regular basis for Annual Household Survey).
- (ii)
- (iii)
- Indicators must be relevant: Relevance of the indicators is essential to ensure their utility as a decision-making tool [11,32,53,55,56] (e.g., total number of marine protected areas may be a relevant indicator of biodiversity conservation in India and Sri Lanka, but it is irrelevant in the case of Nepal because Nepal is a land-locked country).
- (iv)
We used these four characteristics to evaluate MDG 7 indicators in the context of Nepal.
3. Results and Discussion
In this section, we evaluate the environmental indicators in the MDG assessment framework for Goal 7. As stated above, we first provide a background of the indicator or indicator set. We then outline the national trends or status of the indicator/s. Finally, we evaluate each indicator primarily based on its relevance and comprehensiveness in the Nepalese context. We omitted the indicators that are obviously irrelevant to Nepal (e.g., marine protected areas, since Nepal is a land-locked country) or are omitted from global and national MDG reports (even if they were in the original MDG list).
3.1. Target 7A. Integrate the Principles of Sustainable Development into Country Policies and Programmes and Reverse the Loss of Environment Resources
3.1.1. CO2 Emissions and Energy Consumption
Background: The implementers of the Millennium Project in Nepal did not set targets for climate change indicators: CO2 emissions, energy consumption, or energy use per unit of GDP [38]. Reduced or steady CO2 emissions per capita was assumed to meet the energy efficiency goal (energy use per unit of GDP), implying sustainable economic growth [38].
Increasing CO2 emissions puts the global community at risk from climate change, including more extreme and more variable weather events [57,58]. In Nepal, climate change impacts have been observed in agriculture (e.g., erratic rainfall patterns, increased incidence of pest and diseases, food insecurity), biodiversity loss, glacier melting (increasing the probability for glacial lake outbursts and downstream flooding), and reduced energy generation (hydroelectricity—hydropower is the primary source of electricity in Nepal [46]) and water supplies [59,60,61]. Political commitments to combat climate change and promote SD have focused primarily on greenhouse gas (GHG) emissions reduction [62,63,64,65]; the mitigation-focused “CO2 emissions” as an MDG indicator is indicative of this lack of attention on other mitigation (e.g., land use change, albedo) and adaptation strategies.
Current state: Nepal’s CO2 emissions increased by almost 600% between 1990 and 2011, mainly from transport fuel and firewood combustion [36]. However, Nepal’s per capita emissions were very low at 0.16 metric tons in 2011, when compared to average emissions of 10 (for developed regions) and 3 (for developing regions) metric tons per capita [36,66].
Evaluation based on Nepalese context: The relevance of per capita CO2 emissions as an indicator for energy efficiency and SD is debatable for Nepal, where industrial production is minimal (contributing 15% to GDP, and responsible for about 8% of the national energy consumption [67].) and the majority of total energy consumption goes toward meeting basic needs such as cooking and heating (Figure 1). Low CO2 emissions per capita in Nepal therefore do not translate into improved energy intensity or sustainable economic development, as almost 85% of Nepal’s GDP is generated by traditional agriculture and service sectors, which, combined, consume less than 10% of total energy consumption [39,67]. Moreover, the majority of Nepal’s CO2 emissions result from the combustion of transportation and household fuels [38].
The relationship between CO2 emissions and the nation’s economy is complicated. Major energy sources (i.e., firewood, agricultural waste, animal dung) can be carbon neutral, are generally obtained by the people free of cost, and may not directly involve any economic transactions [68]. Nepal can reduce its CO2 emissions per capita and energy use per GDP as a result of growth in the service sector and increased flow of remittances [39,69], with no improvement in SD.
Thus the focus on CO2 emissions and energy use per GDP overlooks many of the environmental problems associated with energy use and production in Nepal, some of which are more relevant than CO2 emissions. These two indicators also obscure many environmental problems related to the kinds of energy sources used in Nepal. The majority of households use traditional technologies and fuel types (Figure 1), which are characterized by low energy efficiency and high emissions of indoor air pollutants [70,71]. Burning of unprocessed biomass fuels (such as firewood, agricultural wastes and animal dung) releases particulate matter (PM10 and PM2.5) that can contribute to regional climate change [72,73,74,75,76,77]. Black carbon (a form of PM2.5) can change regional radiative budgets, cause aseasonal glacier melting, and impact the hydrological cycles in the region [74,76]. Black carbon and other indoor air pollutants are generated in excess amount in traditional stove types, but also in some improved (unprocessed) firewood-burning cook stoves [70].
A number of studies in Nepal have shown a strong correlation between particulate matter from traditional cook stoves and diseases like acute lower respiratory infection, chronic bronchitis, and chronic obstructive pulmonary disorder [78,79]. Respiratory disease is one of the leading causes of death in Nepal, causing more deaths annually than the diseases used as SD indicators in MDG 6 (tuberculosis, malaria and HIV/AIDS) [79,80]. Women and children generally spend more time than men near cook stoves, and the pollution disproportionately impacts women and young children [71,79]. Furthermore, firewood (and water) collection in many areas takes up a considerable amount of time, leaving limited time for women and girls for education and income-generating activities [81,82]. Additionally, more than 95% of the bottom two consumption quintiles in Nepal rely primarily on either firewood or animal/agricultural wastes as a primary cooking fuel, while almost 75% of the richest quintile use Liquefied Petroleum Gas (LPG) as their primary cooking fuel (see Figure 2) [47]. Improved household energy technologies and fuel types with higher efficiency and low emissions are imperative to meet health, gender equality, education, poverty reduction and environmental sustainability goals for Nepal and many other developing countries [71]. However, indicators for such a purpose cannot be generated without a holistic understanding of local energy systems (including energy production, distribution, use, and the socio-economic and environmental factors that govern them).
3.1.2. Forest Cover
Background: According to the UN, ‘forest’ is defined as an area larger than 0.05–1 ha of land, 10%–30% of which is covered by trees that stand more than 2–5 m tall at maturity [83]. The Millennium Project introduced “forest cover” as a MDG 7 indicator of deforestation and depletion of carbon stocks [66]. In Nepal, at least 65% of the population is directly dependent on forests for firewood, agriculture, cattle grazing, and income [68]. Deforestation and forest degradation in Nepal lead to soil erosion and landslides, biodiversity loss, longer walks for women and children to collect firewood, habitat loss, and increased encroachment of wild animals into villages [49,84].
Nepal’s MDG target was to increase forest cover to 40% of the total land area in 2015, from 29% in 1995 [38]. However, the adequacy of ‘forest cover’ as a sole indicator of forest quality, carbon sequestration, or ecosystem health is contestable [85,86,87,88]. Decline in forest cover does not necessarily mean deforestation or forest degradation; it can be a result of sustainable forest management (e.g., prescribed clearcutting) or natural succession [85,89]. Similarly, an increase in forest cover may not contribute to SD as it may include an increase in plantations (which can easily meet the definition of “forest cover” stipulated by the UN) or farmland abandonment that may not necessarily benefit the environment or local communities [86].
Current status: The Forest Resource Assessment reported an increase in forest cover (>10% canopy cover) to 40% of the total area in 2014 from 29% in 1994 [90]. Officially, Nepal met the MDG target for forest cover. This expansion of forest area has been attributed to the growth of the community forestry system [82,84,88,90,91], and to the migration of populations from forested to urban areas, releasing forests from harvesting pressure and increasing land abandonment and subsequent invasion by tree and shrub species [92,93].
Evaluation based on Nepalese context: Nepalese forests have largely remained protected from large-scale, industrial deforestation primarily due to a lack of resource exploitation policies or industrial infrastructure that are common in other developing countries rich in forest resources (such as Cambodia and Liberia) [94]. However, forest degradation from grazing, firewood collection and other small-scale disturbances may result in long-term adverse impacts on forest health, biodiversity and biophysical properties, none of which are well-represented by forest cover estimates [86]. For instance, although forest cover has grown significantly over the past 20 years, almost 68% of the total forest area is impacted by grazing, with another 30% affected by other disturbances such as residue collection, logging, bark removal and coppicing [90].
To protect forest ecosystems and arrest forest degradation, it is crucial first to agree on the definition of forest degradation, which at the moment is vague and often understated [85,86]. While the definition of forest health and degradation should embody socio-ecological values, indicators to monitor forest health should reflect the nature of disturbances and the intrinsic ecological properties of the forests. Only then can indicators influence management strategies and policy reforms. Participatory ecosystem services valuation has been proposed by a number of local experts to improve these ground-level forest quality assessments, through which forest managers and local communities can be made aware of the broader implications of forest degradation [84,85,88].
Forest and land conservation has been a crucial element in Nepal’s development plans since the 1960s [50,95,96]. In 1973, the GoN legislated the National Park and Wildlife Conservation Act to curb deforestation and depletion of natural resources. Since this approach paid little attention to local communities’ needs and concerns (such as their reliance on these areas for food, fodder, timber and fuel), forest and land degradation continued [49]. The GoN soon realized that a participatory approach was indispensable to sustainably manage the forest, which led to the introduction of the community forestry system. The 1993 amendment of the Forest Act of Nepal supports the devolution of management and use rights of some state-owned forests to Community Forest User Groups (CFUGs). These groups hold the rights to use and manage the state-owned forestland as per legal frameworks agreed to by CFUGs and the District Forest Office [94,96]. The GoN also introduced buffer zones to improve national forest protection [41,42].
There are currently over 18,000 CFUGs (an increase from 12,000 in 2001), and community forests encompass over 28.5% (It occupied just about 5% of the total forest area in 2002.) of the total forest area in Nepal [37,43]. About 17% of forest area is managed under the protected area system, and the rest of the forest is managed by the government [90]. While community forest management has been effective in protecting forests and ensuring socio-economic development of rural communities, their benefits, specifically to poor and disadvantaged groups within rural communities, remain elusive [38,84,97,98,99]. Similarly, their contribution to resilient forest ecosystems and biodiversity is uncertain [99,100]. However, some studies suggest that local forest users have positive attitudes towards the protection of biodiversity and forest ecosystems [101].
3.2. Target 7B. Achieve Significant Reduction in the Rate of Biodiversity Loss by 2010
Background: Although Nepal constitutes only 0.03% of the world’s total surface area, it has considerable topographic variability (ranging from 67 m above sea level to Mt. Everest, the highest peak in the world) and diverse ecological zones (ranging from tropical to nival), supporting high floral and faunal diversity [51]. Nepal’s ecosystems support 4% of all mammal species, 3% of plant species, and 9% of bird species found in the world [102,103]. However, biodiversity protection is challenged by Nepal’s growing population and increasing reliance on forests and natural resources, far-reaching road networks, and human migration [49,51]. The Millennium Project expects protected areas (PAs; e.g., national parks, strict reserves, etc.) to contribute not only to environmental protection, but also to poverty reduction and inter-generational equity [66,104]. However, the target setting for PAs is determined simply as a proportion of total land area.
Current status: In Nepal, PAs encompass more than 23% (Includes buffer zone area; about 4% in the total proportion of the protected area is buffer zone area.) of the total land area, higher than the MDG target for Nepal of 17% [37,38]. Nepal has altogether 20 PAs (ten national parks, three wildlife reserves, one hunting reserve and six conservation areas), and protected areas represent 80 out of 118 ecosystems (Table 2) [37]. However, Nepal lacks a complete dataset on species threatened with extinction [38]. For instance, of the 208 mammal species recorded in the national database, 38% of mammal species are data-deficient, 23% have been listed as nationally threatened with extinction and 4% of species are critically endangered [105]. Most of the conservation efforts in Nepal are focused on large mammals (such as the snow leopard, Bengal tigers, gharial, snakes etc.) and birds [51].
Evaluation based on Nepalese context: The first wildlife conservation project in Nepal was initiated in the late 1960s with the technical and financial assistance from the United Nations Food and Agriculture Organization (FAO) and the United Nations Development Programme (UNDP) [95]. The 1972 UN Conference on the Human Environment played a pivotal role in injecting environmental consciousness into development planning in Nepal [106]. However, interest in local biodiversity remained limited to a few local and international scientists until the 1990s. Since 1994, Nepal has made significant progress [51]. While 15 PAs were constituted prior to the Millennium Project, five of them (two national parks and three wildlife reserves, constituting about 17% of total protected land area) were added after 2000 [37]. Thirty-six percent of total PA is forested, while the rest supports meadows and snow-capped mountains [37,90,94]. However, the rich biodiversity that characterizes Nepal is not always adequately represented and conserved by PAs, which has raised questions about the contribution of PAs to conservation goals [49,94].
Nepal’s mountains contain the highest number of ecosystems (52 out of 118 present), occupy the largest land area, have the greatest temperature and altitudinal gradients, and are the most biologically diverse physiographic zone [37,51,100]. Agenda 21 in the Rio Declaration also recognizes mountains as “the areas most sensitive to all climatic changes in the atmosphere” and “highly vulnerable to human and natural ecological imbalance” [107] (Chapter 13, Agenda 21). Yet, they occupy only 13% of the total PA coverage in Nepal (Table 2). Although mountains have the greatest coverage of community forests (i.e., almost 70% of the total), the protection of threatened species has mostly remained limited within the community forestry system [100,108]. Furthermore, a study of community-managed forests in the mid-hill region showed that communities’ preferences for certain species and silviculture practices are gradually changing forests into plantations [85,100]. Biodiversity conservation has yet to be mainstreamed into community forest management in Nepal [100,108].
In the past 25 years, Nepal formulated a number of laws and policies relevant to PAs. However, due to weak monitoring and enforcement capabilities [94], Nepalese PAs suffer a high rate of encroachment, illegal hunting, poaching and trafficking of rare and threatened species [51,109,110]. Many field offices in PAs are understaffed, and lack logistical support and financial resources to pursue management and conservation goals [94,109,110]. A lack of coordination among different agencies (e.g., Department of National Parks and Conservation Areas, District Development Committee, Village Development Committee, and District Forest Office) is often cited as one of the greatest challenges in meeting the conservation goals of PAs [94,105]. The 2011 National Red List Series suggested that the primary threat to threatened species in Nepal however, is “habitat loss, degradation and alteration” [105].
The 1992 World Park Congress agreed on the definition of PAs, as parks and reserves intended to benefit the environment and human society across multiple scales [104,111]. While it is difficult to state with certainty if PAs in Nepal meet this definition, available evidence suggests that PAs have failed to ensure biodiversity conservation or meet the needs of local communities [112,113]. In some places, PA objectives and regulations may conflict with basic rights (such as traditional livelihoods, collection of food, fodder, firewood, thatch, water) and the security of indigenous and local inhabitants [109,112,113,114]. Conflict between parks and people is a common issue for many national parks in Nepal [109,112,115]. Local people around the PAs often have negative attitudes toward park management, and some view conservation projects as only benefitting the government [112,113]. PAs are viewed more favorably if they contribute to local income through employment opportunities [109,112].
Tourism is one of the most important sources of foreign exchange in Nepal, and provides employment to many locals in and around PAs. PAs receive almost half of all tourists to any tourist destinations in Nepal [116]. This has been one of the key drivers for the government to convert national forests into National Parks and Reserves [114]. However, the increased volume of tourists in PAs has been associated with increased cost of products for local inhabitants, increased demand for firewood and other natural resources, and disruption to natural habitat around the PA [117]. Employment opportunities in the tourism industry have only benefitted a few, mostly well-off, people (such as lodge owners, landholders) in rural communities, while making supplies expensive and limited for poor populations [109,117]. These stresses are particularly acute for mountain communities with limited supplies of food and forest resources. Tourism has also generated an accumulation of non-biodegradable wastes around the PAs [117]. The concept of carrying capacity has been discussed occasionally in the development plans of Nepal [42], and several regulations focus on excess tourism in PAs. However, their implementation has remained ineffective [94,117], and thus the contribution of PAs to biodiversity conservation remains uncertain.
3.3. Target 7C. Halve the Proportion of People without Sustainable Access to Safe Drinking Water and Basic Sanitation by 2015
Background: Water scarcity and water-borne diseases are common problems in many developing countries [118]. Access to clean drinking water and sanitation facilities are critical to fighting diarrheal diseases, which kill about 842,000 people every year [119]. These diseases are the second largest communicable cause of premature and preventable death in Nepal [80]. Generally, “improved access to water” suggests access to water from protected or covered sources [120], and “improved sanitation” refers to “connection to a public sewer or septic system or use of ventilated pit latrines and some simple pit latrines” [120].
Current Status: More than 88% of the Nepalese population had access to improved drinking water in 2014 (i.e., piped water and/or water from covered wells; excluding rivers, streams, and open wells) as compared to 70% in 1995; it surpassed the MDG drinking water target of 73% [38,47,121]. However, these numbers tell very little about the drinking water situation on the ground, which is far from satisfactory. Only 52% of the population has access to piped water (Figure 3), which is considered the safest source of drinking water [47,69]. This figure is even lower for populations in low-income groups (29% for the lowest consumption quintile), and for the population on the Terai plain (19%) where more than 50% of Nepalese reside [47,68]. In other words, almost half of the Nepalese population still lacks access to improved (piped) drinking water, and the inequality in drinking water access across income groups and regions is very wide [38,47,68,122].
Almost 67% of the Nepalese population had toilet facilities at home in 2014, as opposed to only 22% in 1995 [47,121]. Over a quarter of the population still practices open defecation, which is detrimental to human health and the environment [47]. As for sewage infrastructure, only about 20% of the population has a proper sewer (sanitary) system (Figure 4) [47] and 48% of families with children practice safe disposal of children’s feces [123]. This improvement rate is remarkably slow considering the increased number of NGOs and funds dedicated to this cause [37,103].
Evaluation based on Nepalese context: A proper sanitary system is as crucial as having a toilet facility because, in the absence of a proper sewage system, there is a possibility for wastewater to leach into and pollute groundwater systems or nearby water sources. A recent household survey in 2014 determined that more than 70% of household drinking water sources in Nepal were contaminated with Escherichia coli (E. coli), indicating fecal contamination of drinking water sources [123,124]. A number of past studies in the Terai and mountain regions found similar results, raising doubts about the drinking water quality of Nepal [125,126]. This may explain why waterborne diseases are so prevalent in Nepal; children under 5 are the most affected by diarrheal outbreaks [123,127,128]. Conditions in urban areas are worse because, in the absence of proper sewer systems, urban sewage is often dumped in nearby river systems without any treatment [38], allowing pollutants to disperse and travel long distances.
Despite the long history of the GoN’s interest in improving people’s access to improved sanitation and drinking water sources, progress has been extremely slow and uneven, with Terai populations benefiting the least [68]. The use of poor quality drinking water (usually collected from rivers, streams, or open wells), and unhygienic practices such as open defecation, are not only related to income but are also embedded as social norms in some areas. A lack of awareness about health and hygiene is prevalent and consistent across different income quintiles, but higher among poorer populations [129]. A case study of the Far Western region (Nepal) in 2009 suggested that one in five people in the highest income quintile still practiced open defecation ([128]. Nevertheless, these issues have historically been treated as poverty-driven issues [130], with little regard to socio-cultural contexts and embeddedness. Such a top-down and unilateral perception of problems have resulted in simplistic and short-term solutions such as subsidies and incentives-based solutions, which are frequently described by local activists as inefficient and unsustainable [128]. A study conducted in 2011 by the National Planning Commission (with support from several donor agencies) concluded that a lack of institutional capacity, low coordination among various actors on the ground, and unreliable technical and financial support are responsible for the poor implementation of water and sanitation policies [38].
3.4. Target 7D. By 2020, Achieve a Significant Improvement in the Lives of at Least 100 Million Slum Dwellers
Background: Urbanization was often associated with better access to basic amenities, a cleaner environment, and better employment opportunities. These associations however, have declined in recent decades due to rapid and haphazard expansion of urban areas in many parts of the world [131]. Slums (or increasingly referred to as “informal settlements”) are low-income settlements characterized by a lack of basic amenities, substandard housing structure, hazardous locations, and insecure land tenure [132]. A total of 43% of slum dwellers live in developing countries, even though the bulk of developing regions are mostly rural [131]. The Millennium Project recognized growth in slum populations as a key challenge to sustainable development in developing countries. As a result, the MDG 7 Indicator 32 focuses on improving the living conditions of slum populations through secure land tenure, which is assumed to improve management of the environment and human health.
Current Status: Nepal’s urban population increased from 14% in 2001 to 17% in 2011 [68]. The National Population Census of Nepal does not differentiate urban populations between slum dwellers and non-slum dwellers [68], as the government-managed cadastral system does not provide information about land rights/management in informal settlements [44,133]. The sanitation indicator that the UN-Habitat uses to assess the living conditions of the urban poor [132], is typically not reported separately for slum dwellers [68]. In other words, Nepal lacks a complete dataset on the size of informal settlements and the living conditions in these neighbourhoods [38]. Census attempts by NGOs and researchers have concentrated on the major cities, and largely overlooked slum populations in smaller cities [133,134,135,136,137].
Evaluation based on Nepalese context: Most of the informal settlement populations in Nepal are migrants from rural areas or other districts, although not all of them are landless [133,136,137,138]. Over 40,000 families lived in informal settlements, of which about 10,000 had landholdings elsewhere [138]. The number of people living in informal settlements (with and without landholdings) may have risen in the past decade as a result of the Maoist insurgency that disproportionately affected rural areas 1996–2005, and also because of the abolishment of bonded labor in the Terai region [114,139]. The state provided some land plots to the most vulnerable populations, however these plots are often too small for anything other than shelter [114]. While landless populations typically suffer worse conditions in terms of security and income, even those with land are generally very poor [133]. Therefore, even if the country had an updated cadastral system with information about landlessness and land tenure, it would still not capture the total slum population in the country. The state recognizes this growing population as an important development challenge and has initiated several policies and programs to facilitate resettlement and provide socio-economic security [38,44]. However, a lack of data to assess existing conditions inhibits the identification of more appropriate indicators and targets [114,133].
4. Conclusions
Many of the MDG environmental indicators have failed to meet all the criteria for appropriate indicators in the Nepalese context (Table 3). In particular, climate change and energy efficiency indicators will need major modifications to measure progress in Nepal, where the energy use and economic growth is governed by subsistence farming and tourism-based and remittance-based service sectors. Context-based research on energy sources, including pollution-reducing technologies, environmental impacts, and sociocultural contexts, is vital to generate better indicators for Nepal that are relevant, practical, adequate, and sensitive (Table 3).
However, the broader relevance of the Millennium Project to Nepal is undisputable, as many of the development priorities identified by the Government of Nepal prior to the Millennium Project overlap with one or more of the Millennium Development Goals and targets (Table 1). Targets related to MDGs, such as access to improved drinking water and sanitation, and the conservation of forest resources, have been major development goals of Nepal since the 1970s [140]. Much of the recommendations made by INGOs (such as UNDP, FAO, WHO) to the Nepalese government in the 1970s, with regard to natural resource conservation and management, stemmed from their research of the local context and needs [95].
Clearly the assessment of sustainable development progress is a social process that requires grassroots initiatives to reveal local context [141]. In Nepal, some have argued that a Community Forestry (CF) System could be utilized more fully to advance context-specific sustainable development targets [97,142,143,144,145,146], but we highlight some important caveats. While decision-making in CF is largely community-driven, there are some cases in which women, poor and other marginalized groups have been systematically excluded from benefit sharing and the decision-making processes [97,99,143]. In addition, most CFUGs have a minimal concern for resilient forest ecosystems and biodiversity [99,143]. These situations can be mitigated through education campaigns and equitable representation in decision-making groups [146,147,148].
The use of ineffective or inappropriate SD indicators generates two major implications: (i) over/underestimation of accomplishments, and over/underrepresentation of the actual situation on the ground; and (ii) poor feedback to decision-makers (policy makers, donor agencies, development workers), risking the misallocation of resources and inappropriate policy actions. These shortcomings may have larger repercussions for developing countries, which are heavily reliant upon foreign aid for development expenditures. The UNs’ decisions (based on tools such as those of the MDGs) with regard to global priorities have historically had a huge influence on the operational frameworks of UN affiliates, INGOs and NGOs [23,27]. This, in turn, has a tremendous influence on resource allocation for national and local level programs.
More broadly, international declarations and commitments (such as MDGs) are a significant driver of policy convergence and harmonization [6,141,149,150]. Growing environmental consciousness and governance in Nepal can be credited to numerous international commitments on biodiversity conservation and forest protection. As in many other least developed countries, SD in Nepal has been hindered by political, social, and geographical limitations. In comparison to many other developing nations, Nepal has fared well in a number of MDG indicators [38]. However, our review suggests that this progress must be examined more closely, as it may not reflect a more fine-scale inequality in development conditions. The participation of local experts and stakeholders can clarify the influence of context on this progress, and identify more relevant, practical and cost-effective indicators where necessary.
Acknowledgments
The authors thank Carol Maclennan, Mark Rouleau and David Flaspohler for comments that significantly improved earlier drafts of this manuscript. Two anonymous reviewers also provided insightful suggestions.
Author Contributions
Ashma Vaidya and Audrey L. Mayer conceived and designed the data collection and analysis; Ashma Vaidya performed the data analysis; Ashma Vaidya and Audrey L. Mayer wrote the paper.
Conflicts of Interest
The authors declare no conflict of interest.
References
- Baster, N. Development indicators: An introduction. J. Dev. Stud. 1972, 8, 1–20. [Google Scholar] [CrossRef]
- McGranahan, D. Development indicators and development models. J. Dev. Stud. 1972, 8, 91–102. [Google Scholar] [CrossRef]
- Jolly, R. Global Goals—the UN Experience; Background Paper for the Human Development Report; Human Development Report Office (HDRO), United Nations Development Programme: New York, NY, USA, 2003; pp. 85–110. [Google Scholar]
- Kates, R.W.; Parris, T.M.; Leiserowitz, A.A. What is sustainable development? Environment 2005, 47, 8–21. [Google Scholar]
- Hulme, D. The Millennium Development Goals (MDGs): A Short History of the World’s Biggest Promise; BWPI Working Paper No. 100; Brooks World Poverty Institute, University of Manchester: Manchester, UK, 2009. [Google Scholar]
- Happaerts, S. Are you talking to us? How subnational governments respond to global sustainable development governance. Environ. Policy Gov. 2012, 22, 127–142. [Google Scholar] [CrossRef]
- Myrdal, G. Twenty years of the United Nations economic commission for Europe. Int. Organ. 1968, 22, 617–628. [Google Scholar] [CrossRef]
- Seers, D. What are we trying to measure? J Dev. Stud. 1972, 8, 21–36. [Google Scholar] [CrossRef]
- Adelman, I.; Morris, C.T. Economic Growth and Social Equity in Developing Countries; Stanford University Press: Redwood City, CA, USA, 1973. [Google Scholar]
- Hicks, N.; Streeten, P. Indicators of development: The search for a basic needs yardstick. World Dev. 1979, 7, 567–580. [Google Scholar] [CrossRef]
- Mitchell, G. Problems and fundamentals of sustainable development indicators. Sustain. Dev. 1996, 4, 1–11. [Google Scholar] [CrossRef]
- Morse, S. Indices and Indicators in Development: An Unhealthy Obsession with Numbers; Routledge: Abington, UK, 2013. [Google Scholar]
- Costanza, R.; Kubiszewski, I.; Giovannini, E.; Lovins, H.; McGlade, J.; Pickett, K.E.; Ragnarsdottir, K.V.; Roberts, D.; Vogli, R.D.; Wilkinson, R. Development: Time to leave GDP behind. Nature 2014, 505, 283–285. [Google Scholar] [CrossRef] [PubMed] [Green Version]
- Morse, S. Developing sustainability indicators and indices. Sustain. Dev. 2015, 23, 84–95. [Google Scholar] [CrossRef]
- Fukuda-Parr, S. Are the MDGs Priority in Development Strategies and Aid Programmes? Only Few Are! Working Paper No. 48; International Policy Centre for Inclusive Growth, United Nations Development Programme: Brasilia, Brazil, 2008. [Google Scholar]
- Bandura, R. A Survey of Composite Indices Measuring Country Performance: 2008 Update; UNDP/ODS Working Paper; Office of Development Studies, United Nations Development Programme: New York, NY, USA, 2008. [Google Scholar]
- World Commission on Environment and Development. Report of World Commission on Environment and Development: Our Common Future; Oxford University Press: Oxford, UK, 1987. [Google Scholar]
- Sachs, J.D. Health in the developing world: achieving the Millennium Development Goals. Bull. World Health Organ. 2004, 82, 947–949. [Google Scholar] [PubMed]
- Manning, R. The impact and design of the MDGs: Some reflections. IDS Bull. 2010, 41, 7–14. [Google Scholar] [CrossRef] [Green Version]
- Vandemoortele, J. The MDG story: intention denied. Dev. Chang. 2011, 42, 1–21. [Google Scholar] [CrossRef]
- Easterly, W. How the millennium development goals are unfair to Africa. World Dev. 2009, 37, 26–35. [Google Scholar] [CrossRef]
- Leo, B. Who are the MDG Trailblazers? A New MDG Progress Index; Working Paper No. 222; Center for Global Development: Washington DC, USA, 2010. [Google Scholar]
- Waage, J.; Banerji, R.; Campbell, O.; Chirwa, E.; Collender, G.; Dieltiens, V.; Dorward, A.; Godfrey-Faussett, P.; Hanvoravongchai, P.; Kingdon, G.; et al. The Millennium Development Goals: A cross-sectoral analysis and principles for goal setting after 2015. Lancet 2010, 376, 991–1023. [Google Scholar] [CrossRef]
- Fukuda-Parr, S.; Greenstein, J.; Stewart, D. How should MDG success and failure be judged: Faster progress or achieving the targets? World Dev. 2013, 41, 19–30. [Google Scholar] [CrossRef]
- Gupta, M.S.; Abed, M.G.T. Governance, Corruption, and Economic Performance; International Monetary Fund: Washington DC, USA, 2002. [Google Scholar]
- King, K.; Rose, P. Transparency or tyranny? Achieving international development targets in education and training. Int. J. Educ. Dev. 2005, 25, 362–367. [Google Scholar] [CrossRef]
- Bond, P. Global governance campaigning and MDGs: From top-down to bottom-up anti-poverty work. Third World Quart. 2006, 27, 339–354. [Google Scholar] [CrossRef]
- Saith, A. From universal values to Millennium Development Goals: Lost in translation. Dev. Chang. 2006, 37, 1167–1199. [Google Scholar] [CrossRef]
- Greig, A.; Hulme, D.; Turner, M. Challenging Global Inequality: Development Theory and Practice in the 21st Century; Palgrave Macmillan: Basingstoke, UK, 2007. [Google Scholar]
- Fehling, M.; Nelson, B.D.; Venkatapuram, S. Limitations of the Millennium Development Goals: A literature review. Glob. Public Health 2013, 8, 1109–1122. [Google Scholar] [CrossRef] [PubMed]
- Manning, R. Using Indicators to Encourgae Development: Lessons from the Millennium Development Goals; DIIS Reports No. 2009:01; Danish Institute for International Studies: Copenhagen, Denmark, 2009. [Google Scholar]
- Hák, T.; Janoušková, S.; Moldan, B. Sustainable Development Goals: A need for relevant indicators. Ecol. Indic. 2016, 60, 565–573. [Google Scholar] [CrossRef]
- Hailu, D.; Tsukada, R. Is the Distribution of Foreign Aid MDG-sensitive? DESA Working Paper No. 111; Economic and Social Affairs, United Nations Development Programme: Brasilia, Brazil, 2012. [Google Scholar]
- An Approach to the Graduation from the Least Development Country by 2022. Available online: http://www.npc.gov.np/images/download/LDC_Final_draft.pdf (accessed on 25 September 2016).
- United Nations. List of Least Developed Countries (as of 16 February 2016); Department of Economic and Social Affairs, Development Policy and Analysis Division, Committee for Development Policy, United Nations (UN): New York, NY, USA, 2016. [Google Scholar]
- World Data Bank: World Development Indicators. Available online: http://databank.worldbank.org/data/reports.aspx?source=2&country=NPL&series=&period (accessed on 23 February 2016).
- Central Bureau of Statistics (CBS). Environment Statistics of Nepal 2013; National Planning Commission Secretariat, Central Bureau of Statistics (CBS), Government of Nepal: Kathmandu, Nepal, 2014.
- Government of Nepal/United Nations (GoN/UN). Millennium Development Goals Progress Report 2013; Government of Nepal/United Nations Country Team Nepal: Kathmandu, Nepal, 2013. [Google Scholar]
- The World Bank. Nepal: The Public Expenditure Review; Report No. 55388-NP; The World Bank: Washington, DC, USA, 2010. [Google Scholar]
- Bista, R. Foreign aid policy and its growth effect in Nepal. EcoQuantum Revista de Economia y Negocios 2006, 3, 109–141. [Google Scholar]
- Eighth Plan: Unofficial Translation. Available online: http://www.npc.gov.np/images/download/eighth_eng.pdf (accessed on 17 January 2016).
- Ninth Plan: Unofficial Translation. Available online: http://www.npc.gov.np/images/download/ninth_eng_2.pdf (accessed on 17 January 2016).
- Tenth Plan: Unofficial Translation. Available online: http://www.npc.gov.np/images/download/10th_eng.pdf (accessed on 17 January 2016).
- Eleventh Plan: Unofficial Translation. Available online: http://www.npc.gov.np/images/download/11tyip_eng.pdf (accessed on 17 January 2016).
- Twelfth Plan. Available online: http://www.npc.gov.np/images/download/TYP_2012.pdf (accessed on 17 January 2016).
- Thirteenth Plan. Available online: http://www.npc.gov.np/images/download/13th-Plan.pdf (accessed on 17 January 2016).
- Central Bureau of Statistics (CBS). Annual Household Survey 2013/2014; National Planning Commission Secretariat, Central Bureau of Statistics (CBS), Government of Nepal: Kathmandu, Nepal, 2015.
- Mitra, S. Synergies among monetary, multidimensional and subjective poverty: Evidence from Nepal. Soc. Indic. Res. 2016, 125, 103–125. [Google Scholar] [CrossRef]
- Chaudhary, R.P. Forest conservation and environmental management in Nepal: A review. Biodivers. Conserv. 2000, 9, 1235–1260. [Google Scholar] [CrossRef]
- Kandel, P. Forest Resource Assessment in Nepal: An assessment of data needs. In Forest Resource Assessment (FRA) Nepal Project; Department of Forest Research and Survey, Ministry of Forests and Soil Conservation: Kathmandu, Nepal, 2010. [Google Scholar]
- Bhuju, U.R.; Sya, P.R.; Basnet, T.B.; Shrestha, S. Nepal Biodiversity Resource Book: Protected areas, Ramsar Sites, and World Heritage Sites; International Centre for Integrated Mountain Development (ICIMOD): Kathmandu, Nepal, 2007. [Google Scholar]
- Hsieh, H.F.; Shannon, S.E. Three approaches to qualitative content analysis. Qual. Health Res. 2005, 15, 1277–1288. [Google Scholar] [CrossRef] [PubMed]
- Liverman, D.M.; Hanson, M.E.; Brown, B.J.; Merideth, R.W., Jr. Global sustainability: Toward measurement. Environ. Manag. 1988, 12, 133–143. [Google Scholar] [CrossRef]
- Mayer, A.L. Strengths and weaknesses of common sustainability indices for multidimensional systems. Environ. Int. 2008, 34, 277–291. [Google Scholar] [CrossRef] [PubMed]
- Hák, T.; Moldan, B.; Dahl, A.L. (Eds.) Sustainability Indicators: A Scientific Assessment; Island Press: Washington DC, USA, 2007.
- Parris, T.M.; Kates, R.W. Characterizing and measuring sustainable development. Annu. Rev. Environ. Resour. 2003, 28, 559–586. [Google Scholar] [CrossRef]
- Intergovernmental Panel on Climate Change (IPCC). Summary for policymakers. In Climate Change 2014: Impacts, Adaptation, and Vulnerability. Part A: Global and Sectoral Aspects. Contribution of Working Group II to the Fifth Assessment Report of the Intergovernmental Panel on Climate Change; Field, C.B., Barros, V.R., Dokken, D.J., Mach, K.J., Mastrandrea, M.D., Bilir, T.E., Chatterjee, M., Ebi, K.L., Estrada, Y.O., Genova, R.C., et al., Eds.; Cambridge University Press: Cambridge, UK; New York, NY, USA, 2014. [Google Scholar]
- Wheeler, T.; von Braun, J. Climate change impacts on global food security. Science 2013, 341, 508–513. [Google Scholar] [CrossRef] [PubMed]
- Bajracharya, S.R.; Mool, P.K.; Shrestha, B.R. Impact of Climate Change on Himalayan Glaciers and Glacial Lakes: Case Studies on GLOF and Associated Hazards in Nepal and Bhutan; International Centre for Integrated Mountain Development: Kathmandu, Nepal, 2007. [Google Scholar]
- Malla, G. Climate change and its impact on Nepalese agriculture. J. Agri. Environ. 2009, 9, 62–71. [Google Scholar] [CrossRef]
- Bartlett, R.; Bharati, L.; Pant, D.; Hosterman, H.; McCornick, P.G. Climate Change Impacts and Adaptation in Nepal; IWMI Working Paper 139; International Water Management Institute: Colombo, Sri Lanka, 2010. [Google Scholar]
- Füssel, H.M. Adaptation planning for climate change: Concepts, assessment approaches, and key lessons. Sustain. Sci. 2007, 2, 265–275. [Google Scholar] [CrossRef]
- Pielke, R.; Prins, G.; Rayner, S.; Sarewitz, D. Climate change 2007: Lifting the taboo on adaptation. Nature 2007, 445, 597–598. [Google Scholar] [CrossRef] [PubMed]
- Lobell, D.B.; Burke, M.B.; Tebaldi, C.; Mastrandrea, M.D.; Falcon, W.P.; Naylor, R.L. Prioritizing climate change adaptation needs for food security in 2030. Science 2008, 319, 607–610. [Google Scholar] [CrossRef] [PubMed]
- Measham, T.G.; Preston, B.L.; Smith, T.F.; Brooke, C.; Gorddard, R.; Withycombe, G.; Morrison, C. Adapting to climate change through local municipal planning: barriers and challenges. Mitig. Adapt. Strat. Glob. Chang. 2011, 16, 889–909. [Google Scholar] [CrossRef]
- United Nations (UN). The Millennium Development Goals Report 2015; United Nations (UN): New York, NY, USA, 2015. [Google Scholar]
- Water and Energy Commission Secretariat (WECS). Energy Data Sheet; Ministry of Energy, Water and Energy Commission Secretariat (WECS): Kathmandu, Nepal, 2014.
- Central Bureau of Statistics (CBS). Nepal Population and Housing Census 2011: National Report; Central Bureau of Statistics (CBS), Government of Nepal: Kathmandu, Nepal, 2012.
- National Planning Commission (NPC). Nepal Human Development Report 2014: Beyond Geography, Unlocking Human Potential; National Planning Commission (NPC): Kathmandu, Nepal, 2014.
- Smith, K.R.; Samet, J.M.; Romieu, I.; Bruce, N. Indoor air pollution in developing countries and acute lower respiratory infections in children. Thorax 2000, 55, 518–532. [Google Scholar] [CrossRef] [PubMed]
- Rehfuess, E.; Mehta, S.; Prüss-Üstün, A. Assessing household solid fuel use: Multiple implications for the Millennium Development Goals. Environ. Health Persp. 2006, 114, 373–378. [Google Scholar] [CrossRef]
- Haywood, J.M.; Ramaswamy, V. Global sensitivity studies of the direct radiative forcing due to anthropogenic sulfate and black carbon aerosols. J Geophysl. Res. Atmos. 1998, 103, 6043–6058. [Google Scholar] [CrossRef]
- Jacobson, M.Z. Strong radiative heating due to the mixing state of black carbon in atmospheric aerosols. Nature 2001, 409, 695–697. [Google Scholar] [CrossRef] [PubMed]
- Bond, T.C.; Streets, D.G.; Yarber, K.F.; Nelson, S.M.; Woo, J.H.; Klimont, Z. A technology-based global inventory of black and organic carbon emissions from combustion. J Geophys. Res. Atmos. 2004, 109, 6043–6058. [Google Scholar] [CrossRef]
- Bond, T.C.; Sun, H. Can reducing black carbon emissions counteract global warming? Environ. Sci. Technol. 2005, 39, 5921–5926. [Google Scholar] [CrossRef] [PubMed]
- Ramanathan, V.; Carmichael, G. Global and regional climate changes due to black carbon. Nat. Geosci. 2008, 1, 221–227. [Google Scholar] [CrossRef]
- Kaspari, S.; Painter, T.H.; Gysel, M.; Skiles, S.M.; Schwikowski, M. Seasonal and elevational variations of black carbon and dust in snow and ice in the Solu-Khumbu, Nepal and estimated radiative forcings. Atmos. Chem. Phys. 2014, 14, 8089–8103. [Google Scholar] [CrossRef]
- Kurmi, O.P.; Semple, S.; Simkhada, P.; Smith, W.C.S.; Ayres, J.G. COPD and chronic bronchitis risk of indoor air pollution from solid fuel: A systematic review and meta-analysis. Thorax 2010, 65, 221–228. [Google Scholar] [CrossRef] [PubMed]
- Ranabhat, C.L.; Kim, C.B.; Kim, C.S.; Jha, N.; Deepak, K.C.; Connel, F.A. Consequence of indoor air pollution in rural area of Nepal: A simplified measurement approach. Indoor Air 2015, 16, 426–444. [Google Scholar] [CrossRef] [PubMed]
- Global Burden of Disease Study. Global Burden of Diseases, Injuries, and Risk Factors Study 2010; Global Burden of Disease Study, Institute for Health Metrics and Evaluation: Seattle, WA, USA, 2010. [Google Scholar]
- Von Schirnding, Y. Addressing the Impact of Household Energy and Indoor Air Pollution on the Health of Poor: Implications for Policy Action and Intervention Measures; World Health Organization: Geneva, Switzerland, 2002. [Google Scholar]
- Baland, J.M.; Libois, F.; Mookherjee, D. Firewood Collections and Economic Growth in Rural Nepal 1995-2010: Evidence from Household Panel; Working Paper 1215; Department of Economics, University of Namur: Namur, Belgium, 2010. [Google Scholar]
- United Nations (UN). Report of the Conference of the Parties on Its Seventh Session, Held at Marrakesh from 29 October to 10 November 2001, United Nations Framework Convention on Climate Change; FCCC/CP/2001/13/Add.1; United Nations Office: Geneva, Switzerland, 2002. [Google Scholar]
- Khatri, T.B. Conservation governance in Nepal: protecting forest biodiversity and people’s livelihoods. Unasylva 2010, 236, 34–40. [Google Scholar]
- Acharya, K.P.; Dangi, R.B. Forest Degradation in Nepal: Review of Data and Methods; Forest Resources Assessment Working Paper; Forestry Department, Food and Agriculture Organization of the UN: Rome, Italy, 2009. [Google Scholar]
- Sasaki, N.; Putz, F.E. Critical need for new definitions of “forest” and “forest degradation” in global climate change agreements. Conserv. Lett. 2009, 2, 226–232. [Google Scholar] [CrossRef]
- Stephenson, N.L.; Das, A.J.; Condit, R.; Russo, S.E.; Baker, P.J.; Beckman, N.G.; Coomes, D.A.; Lines, E.R.; Morris, W.K.; Rüger, N.; et al. Rate of tree carbon accumulation increases continuously with tree size. Nature 2014, 507, 90–93. [Google Scholar] [CrossRef] [PubMed]
- Paudyal, K.; Baral, H.; Burkhard, B.; Bhandari, S.P.; Keenan, R.J. Participatory assessment and mapping of ecosystem services in a data-poor region: Case study of community-managed forests in central Nepal. Econ. Serv. 2015, 13, 81–92. [Google Scholar] [CrossRef]
- Hansen, M.C.; Potapov, P.V.; Moore, R.; Hancher, M.; Turubanova, S.A.; Tyukavina, A.; Thau, D.; Stehman, S.J.; Goetz, S.J.; Loveland, T.R.; et al. High-Resolution Global Maps of 21st Century Forest Cover Change. Science 2013, 342, 850–853. [Google Scholar] [CrossRef] [PubMed]
- Department of Forest Research and Survey (DFRS). State of Nepal’s forest; Forest Resource Assessment Nepal, Department of Forest Research and Survey (DFRS), Ministry of Forests and Forest Conservation, Government of Nepal: Kathmandu, Nepal, 2015.
- Niraula, R.R.; Gilani, H.; Pokharel, B.K.; Qamer, FM. Measuring impacts of community forestry program through repeat photography and satellite remote sensing in the Dolakha district of Nepal. J. Environ. Manag. 2013, 126, 20–29. [Google Scholar] [CrossRef] [PubMed]
- Paudel, K.P.; Tamang, S.; Shrestha, K.K. Transforming Land and Livelihood: Analysis of Agricultural Land Abandonment in the Mid Hills of Nepal. J. For. Livelihood 2014, 12, 11–19. [Google Scholar]
- Jaquet, S.; Schwilch, G.; Hartung-Hofmann, F.; Adhikari, A.; Sudmeier-Rieux, K.; Shrestha, G.; Liniger, H.P.; Kohler, T. Does outmigration lead to land degradation? Labour shortage and land management in a western Nepal watershed. Appl. Geogr. 2015, 62, 157–170. [Google Scholar] [CrossRef]
- Magrath, W.B.; Shrestha, A.; Subedi, B.; Dulal, H.B.; Baumback, R. Nepal Forest Sector Survey: Policy Priorities and Recommendations; Program on Forests (PROFOR): Washington DC, USA, 2013. [Google Scholar]
- Heinen, J.T.; Kattel, B. A review of conservation legislation in Nepal: past progress and future needs. Environ. Manag. 1992, 16, 723–733. [Google Scholar] [CrossRef]
- Acharya, K.P. Twenty-four years of community forestry in Nepal. Int. For. Rev. 2002, 4, 149–156. [Google Scholar] [CrossRef]
- Thoms, C.A. Community control of resources and the challenge of improving local livelihoods: A critical examination of community forestry in Nepal. Geoforum 2008, 39, 1452–1465. [Google Scholar] [CrossRef]
- Dahal, S.; Nepal, S.K.; Schuett, M.A. Examining Marginalized Communities and Local Conservation Institutions: The Case of Nepal’s Annapurna Conservation Area. Environ. Manag. 2014, 53, 219–230. [Google Scholar] [CrossRef] [PubMed]
- Yadav, B.D.; Bigsby, H.; MacDonald, I. The relative distribution: An alternative approach to evaluate the impact of community level forestry organizations on households. Land Use Policy 2015, 42, 443–449. [Google Scholar] [CrossRef]
- Acharya, K.P. Conserving biodiversity and improving livelihoods: The case of community forestry in Nepal. In Proceedings of the International Conference on Rural Livelihoods, Forests and Biodiversity, Bonn, Germany, 19–23 May 2003.
- Mehta, J.N.; Heinen, J.T. Does community-based conservation shape favorable attitudes among locals? An empirical study from Nepal. Environ. Manag. 2001, 28, 165–177. [Google Scholar] [CrossRef] [PubMed]
- Ministry of Forests and Soil Conservation (MoFSC). Role of Forest on Climate Change Adaptation; REDD—Forestry and Climate Change Cell, Nepal Ministry of Forests and Soil Conservation: Kathmandu, Nepal, 2011.
- Central Bureau of Statistics (CBS). Statistical Year Book of Nepal 2013; National Planning Commission Secretariat, Central Bureau of Statistics (CBS), Government of Nepal: Kathmandu, Nepal, 2014.
- Naughton-Treves, L.; Holland, M.B.; Brandon, K. The role of protected areas in conserving biodiversity and sustaining local livelihoods. Annu Rev. Environ. Resour. 2005, 30, 219–252. [Google Scholar] [CrossRef]
- Jnawali, S.R.; Baral, H.S.; Lee, S.; Acharya, K.P.; Upadhyay, G.P.; Pandey, M.; Shrestha, R.; Joshi, D.; Laminchhane, B.R.; Griffiths, J.; et al. The Status of Nepal Mammals: The National Red List Series; Department of National Parks and Wildlife Conservation, Government of Nepal: Kathmandu, Nepal, 2011.
- Khadka, R.B.; Dalal-Clayton, B.; Mathema, A.; Shrestha, P. Safeguarding the Future, Securing Shangri-La–Integrating Environment and Development in Nepal: Achievements, Challenges and Next Steps; International Institute for Environment and Development: London, UK, 2012. [Google Scholar]
- Earth Summit Agenda 21. Available online: http://www.un.org/esa/dsd/agenda21/index.shtml (accessed on 5 March 2016).
- Khadka, S.R.; Schmidt-Vogt, D. Integrating biodiversity conservation and addressing economic needs: An experience with Nepal's community forestry. Local Environ. 2008, 13, 1–13. [Google Scholar] [CrossRef]
- Heinen, J.T.; Kattel, B. Parks, people, and conservation: a review of management issues in Nepal's protected areas. Popul. Environ. 1992, 14, 49–84. [Google Scholar] [CrossRef]
- Oli, K.P.; Chaudhary, S.; Sharma, U.R. Are governance and management effective within protected areas of the Kanchenjunga landscape (Bhutan, India and Nepal)? Parks 2013, 19, 1–12. [Google Scholar] [CrossRef]
- Barzetti, V. Parks and Progress; International Union for Conservation of Nature (IUCN): Washington, DC, USA, 1993. [Google Scholar]
- Allendorf, T.D. Residents’ attitudes toward three protected areas in southwestern Nepal. Biodivers. Conserv. 2007, 16, 2087–2102. [Google Scholar] [CrossRef]
- Karanth, K.K.; Nepal, S.K. Local residents’ perception of benefits and losses from protected areas in India and Nepal. Environ. Manag. 2012, 49, 372–386. [Google Scholar] [CrossRef] [PubMed]
- Leitner Center (LC). “Land Is Life, Land Is Power”: Landlessness, Exclusion and Deprivation in Nepal; Leitner Center for International Law and Justice, Fordham Law School: New York, NY, USA, 2011. [Google Scholar]
- Pravat, P.S.; Humphreys, D. Using a multilevel approach to analyse the case of forest conflicts in the Terai, Nepal. For. Policy Econ. 2013, 33, 47–55. [Google Scholar] [CrossRef]
- Ministry of Cultural, Tourism & Civil Aviation (MCTCA). Nepal Tourism Statistics 2012; Planning and Evaluation Division, Statistical Section, Nepal Ministry of Cultural, Tourism & Civil Aviation (MCTCA): Kathmandu, Nepal, 2013.
- Nepal, S.K. Tourism in protected areas: the Nepalese Himalaya. Ann. Tourism Res. 2000, 27, 661–681. [Google Scholar] [CrossRef]
- Montgomery, M.A.; Elimelech, M. Water and sanitation in developing countries: Including health in the equation. Environ. Sci. Technol. 2007, 41, 17–24. [Google Scholar] [CrossRef] [PubMed]
- World Health Organization. World Health Statistics 2014; World Health Organization: Geneva, Switzerland, 2014. [Google Scholar]
- World Health Organization; The United Nations Children’s Emergency Fund. Water for Life: Making It Happen; World Health Organization/The United Nations Children’s Emergency Fund: Geneva, Switzerland, 2005. [Google Scholar]
- Central Bureau of Statistics (CBS). Nepal Living Standard Survey Report 1995-96: Statistical Report; Central Bureau of Statistics (CBS), Government of Nepal: Kathmandu, Nepal, 1996.
- Central Bureau of Statistics (CBS). Annual Household Survey 2012/2013; National Planning Commission Secretariat, Central Bureau of Statistics (CBS), Government of Nepal: Kathmandu, Nepal, 2014.
- Central Bureau of Statistics (CBS). Nepal Multiple Indicator Cluster Survey 2014; National Planning Commission Secretariat, Central Bureau of Statistics (CBS), Government of Nepal: Kathmandu, Nepal, 2015.
- Bain, R.; Cronk, R.; Hossain, R.; Bonjour, S.; Onda, K.; Wright, J.; Yang, H.; Slaymaker, T.; Hunter, P.; Prüss-Ustün, A.; et al. Global assessment of exposure to faecal contamination through drinking water based on a systematic review. Trop. Med. Int. Health 2014, 19, 917–927. [Google Scholar] [CrossRef] [PubMed]
- Atreya, K.; Panthee, S.; Sharma, P. Bacterial contamination of drinking water and the economic burden of illnesses for the Nepalese households. Int. J. Environ. Health Res. 2006, 16, 385–390. [Google Scholar] [CrossRef] [PubMed]
- Rai, S.K.; Ono, K.; Yanagida, J.I.; Kurokawa, M.; Rai, C.K. Status of drinking water contamination in Mountain Region in Nepal. Nepal Med. Coll. J. 2009, 11, 281–283. [Google Scholar] [PubMed]
- Fink, G.; Günther, I.; Hill, K. The effect of water and sanitation on child health: Evidence from the demographic and health surveys 1986–2007. Int. J. Epidemiol. 2011, 40, 1196–1204. [Google Scholar] [CrossRef] [PubMed]
- Alley, K. Lessons from Nepal’s Sanitation Social Movement: Sanitation for All, All for Sanitation; United Nations Children’s Fund, UN Nepal Country Office: Kathmandu, Nepal, 2014. [Google Scholar]
- Karn, R.R.; Bhandari, B.; Jha, N. A study on personal hygiene and sanitary practices in a rural village of Morang district of Nepal. J. Med. Coll. 2012, 1, 39–44. [Google Scholar]
- United Nations Development Programme (UNDP). Human Development Report 2006—Beyond Scarcity: Power, Poverty and the Global Water Crisis; United Nations Development Programme: New York, NY, USA, 2006. [Google Scholar]
- United Nations (UN). World Urbanization Prospects: The 2014 Revision; United Nations (UN): New York, NY, USA, 2014. [Google Scholar]
- UN-Habitat. The Challenge of Slums: Global Report on Human Settlements 2003; United Nations Human Settlements Programme (UN-Habitat): Nairobi, Kenya, 2003. [Google Scholar]
- Paudyal, D.R.; McDougall, K. Spatial data infrastructure for pro-poor land management. In Proceedings of the 24th International Federation of Surveyors International Congress, Sydney, Australia, 11–16 April 2010; International Federation of Surveyors (FIG): Copenhagen, Denmark, 2010. [Google Scholar]
- Lumanti Support Group for Shelter (LSGS). A Situational Analysis of Urban Poor Communities in Kathmandu and Lalitpur; Lumanti Support Group for Shelter (LSGS): Kathmandu, Nepal, 2003. [Google Scholar]
- Lumanti Support Group for Shelter (LSGS). Status of Squatter Communities along the Bagmati River and Its Tributaries in the Kathmandu Valley; Kathmandu: High-Powered Bagmati Area Sewerage Implementation and Monitoring Committee, Lumanti Support Group for Shelter (LSGS): Kathmandu, Nepal, 2008. [Google Scholar]
- Toffin, G. Urban fringes: Squatter and slum settlements in the Kathmandu Valley (Nepal). Contrib. Nepalese Stud. 2010, 37, 151–168. [Google Scholar]
- Shrestha, B.K. Squatter settlements in the Kathmandu valley: Looking through the prism of land rights and tenure security. Urban Forum. 2013, 24, 119–135. [Google Scholar] [CrossRef]
- Landlessness Solution High Level Commission (LSHLC). Progress Report; Landlessness Solution High Level Commission (LSHLC): Kathmandu, Nepal, 2000. [Google Scholar]
- Land Commitments in Nepal’s Peace Process: An Update on Implementation. Available online: http://cartercenter.org/resources/pdfs/news/pr/nepal-pr-land-rpt_062210-EN.pdf (accessed on 20 March 2016).
- Fourth Plan: Unofficial Translation. Available online: http://www.npc.gov.np/images/download/fourth_eng.pdf (accessed on 17 January 2016).
- Vandemoortele, J. The MDG conundrum: meeting the targets without missing the point. Dev. Policy Rev. 2009, 27, 355–371. [Google Scholar] [CrossRef]
- Gautam, A.P.; Shivakoti, G.P.; Webb, E.L. A review of forest policies, institutions, and changes in the resource condition in Nepal. Int. For. Rev. 2004, 6, 136–148. [Google Scholar] [CrossRef]
- Dahal, G.R.; Chapagain, A. Community forestry in Nepal: Decentralized forest governance. In Lessons from Forest Decentralization: Money, Justice and the Quest for Good Governance in Asia-Pacific; Earthscan: London, UK, 2008; pp. 67–81. [Google Scholar]
- Dev, O.P.; Yadav, N.P.; Springate-Baginski, O.; Soussan, J. Impacts of community forestry on livelihoods in the middle hills of Nepal. J. For. Livelihood 2003, 3, 64–77. [Google Scholar]
- Yadav, N.P.; Dev, O.P.; Springate-Baginski, O.; Soussan, J. Forest management and utilization under community forestry. J. For. Livelihood 2003, 3, 37–50. [Google Scholar]
- Khadka, C.; Vacik, H. Comparing a top-down and bottom-up approach in the identification of criteria and indicators for sustainable community forest management in Nepal. Forestry 2012, 85, 145–158. [Google Scholar] [CrossRef]
- Timsina, N.P.; Luintel, H.; Bhandari, K.; Thapaliya, A. Action and learning: an approach for facilitating a change in knowledge and power relationship in community forestry. J. For. Livelihood 2004, 4, 5–12. [Google Scholar]
- Banjade, M.R.; Timsina, N.P.; Neupane, H.R.; Bhandari, K.; Bhattarai, T.; Rana, S.K. Transforming agency and structure for facilitating pro-poor governance in community forestry. J. For. Livelihood 2009, 5, 22–33. [Google Scholar] [CrossRef]
- Busch, P.O.; Jörgens, H. The international sources of policy convergence: Explaining the spread of environmental policy innovations. J. Eur. Public Policy 2005, 12, 860–884. [Google Scholar] [CrossRef]
- Sachs, J.D.; McArthur, J.W. The millennium project: A plan for meeting the millennium development goals. Lancet 2005, 365, 347–353. [Google Scholar] [CrossRef]
Figure 1.
Distribution of energy consumption by sector, residential use, fuel type and technology (Data sources: [67,68]). The first branching in the flowchart indicates the distribution of residential energy consumption by uses. The second branching slows the distribution of energy consumption for household cooking and heating by energy sources. The bottom row shows the distribution of energy used for cooking and heating by the technologies used. Darker lines indicate a dominance of that energy type. LPG = Liquefied Petroleum Gas.

Figure 2.
Primary cooking fuels by consumption quintiles for 2014 (Data source: [47]).
Figure 2.
Primary cooking fuels by consumption quintiles for 2014 (Data source: [47]).

Figure 3.
Distribution of population (in percentage) with access to piped water (Data sources: [37,47,68,121].
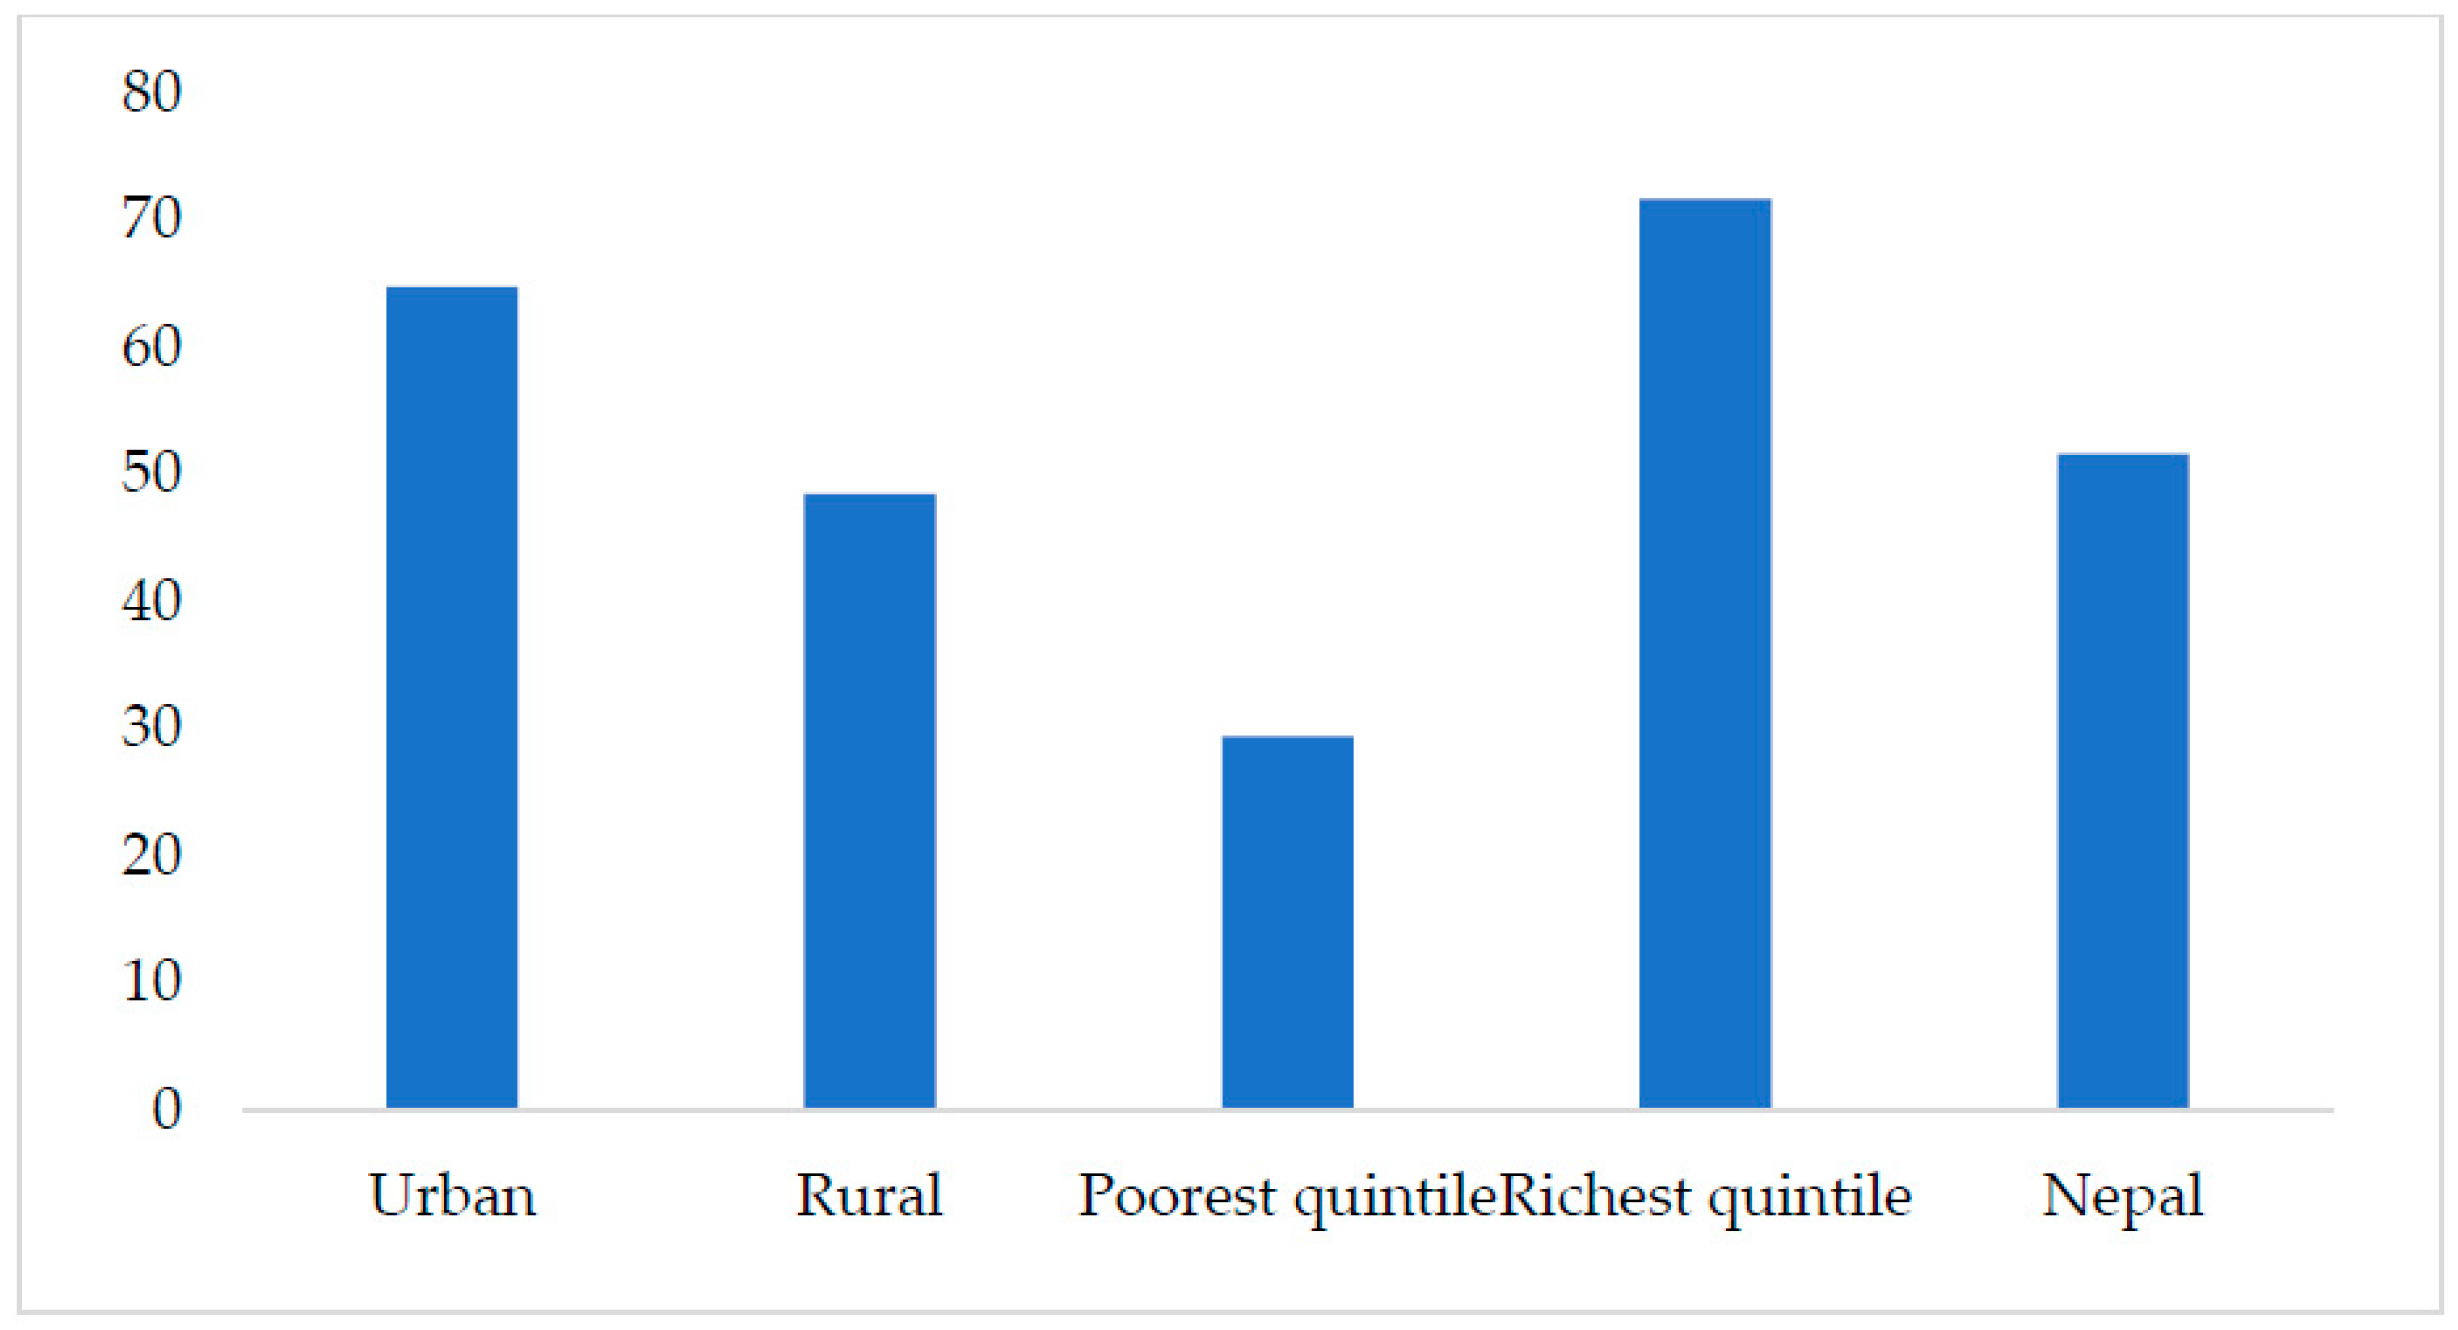
Figure 4.
Distribution of population (in percentage) with access to sanitation facilities in 2014 (Data sources: [37,47]).
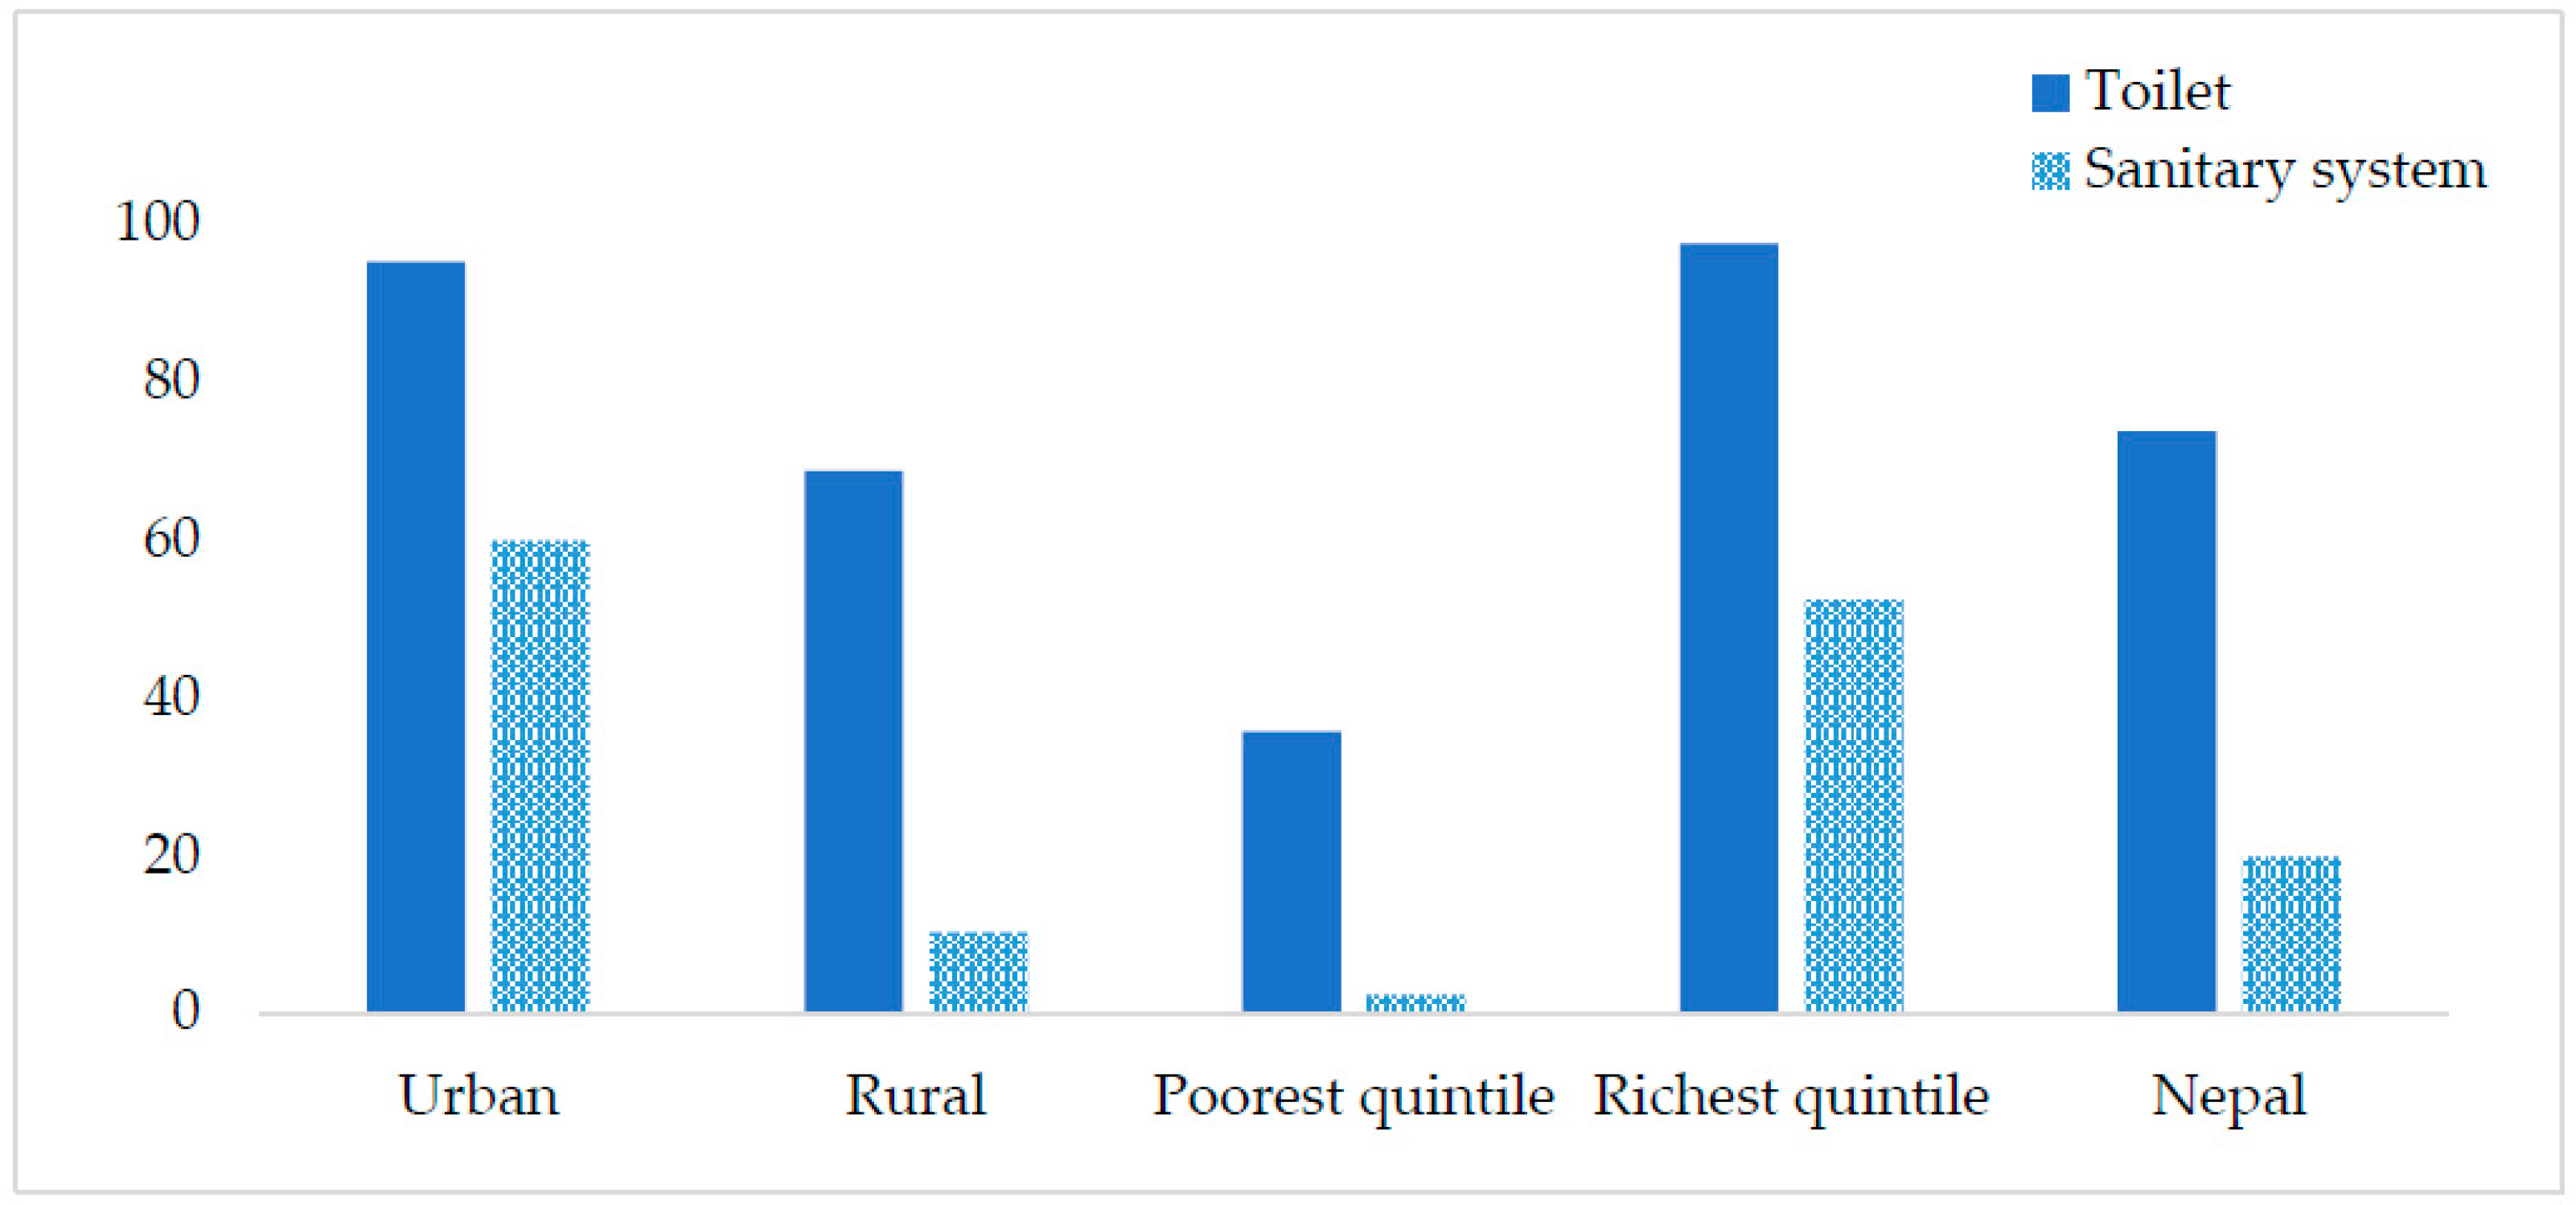

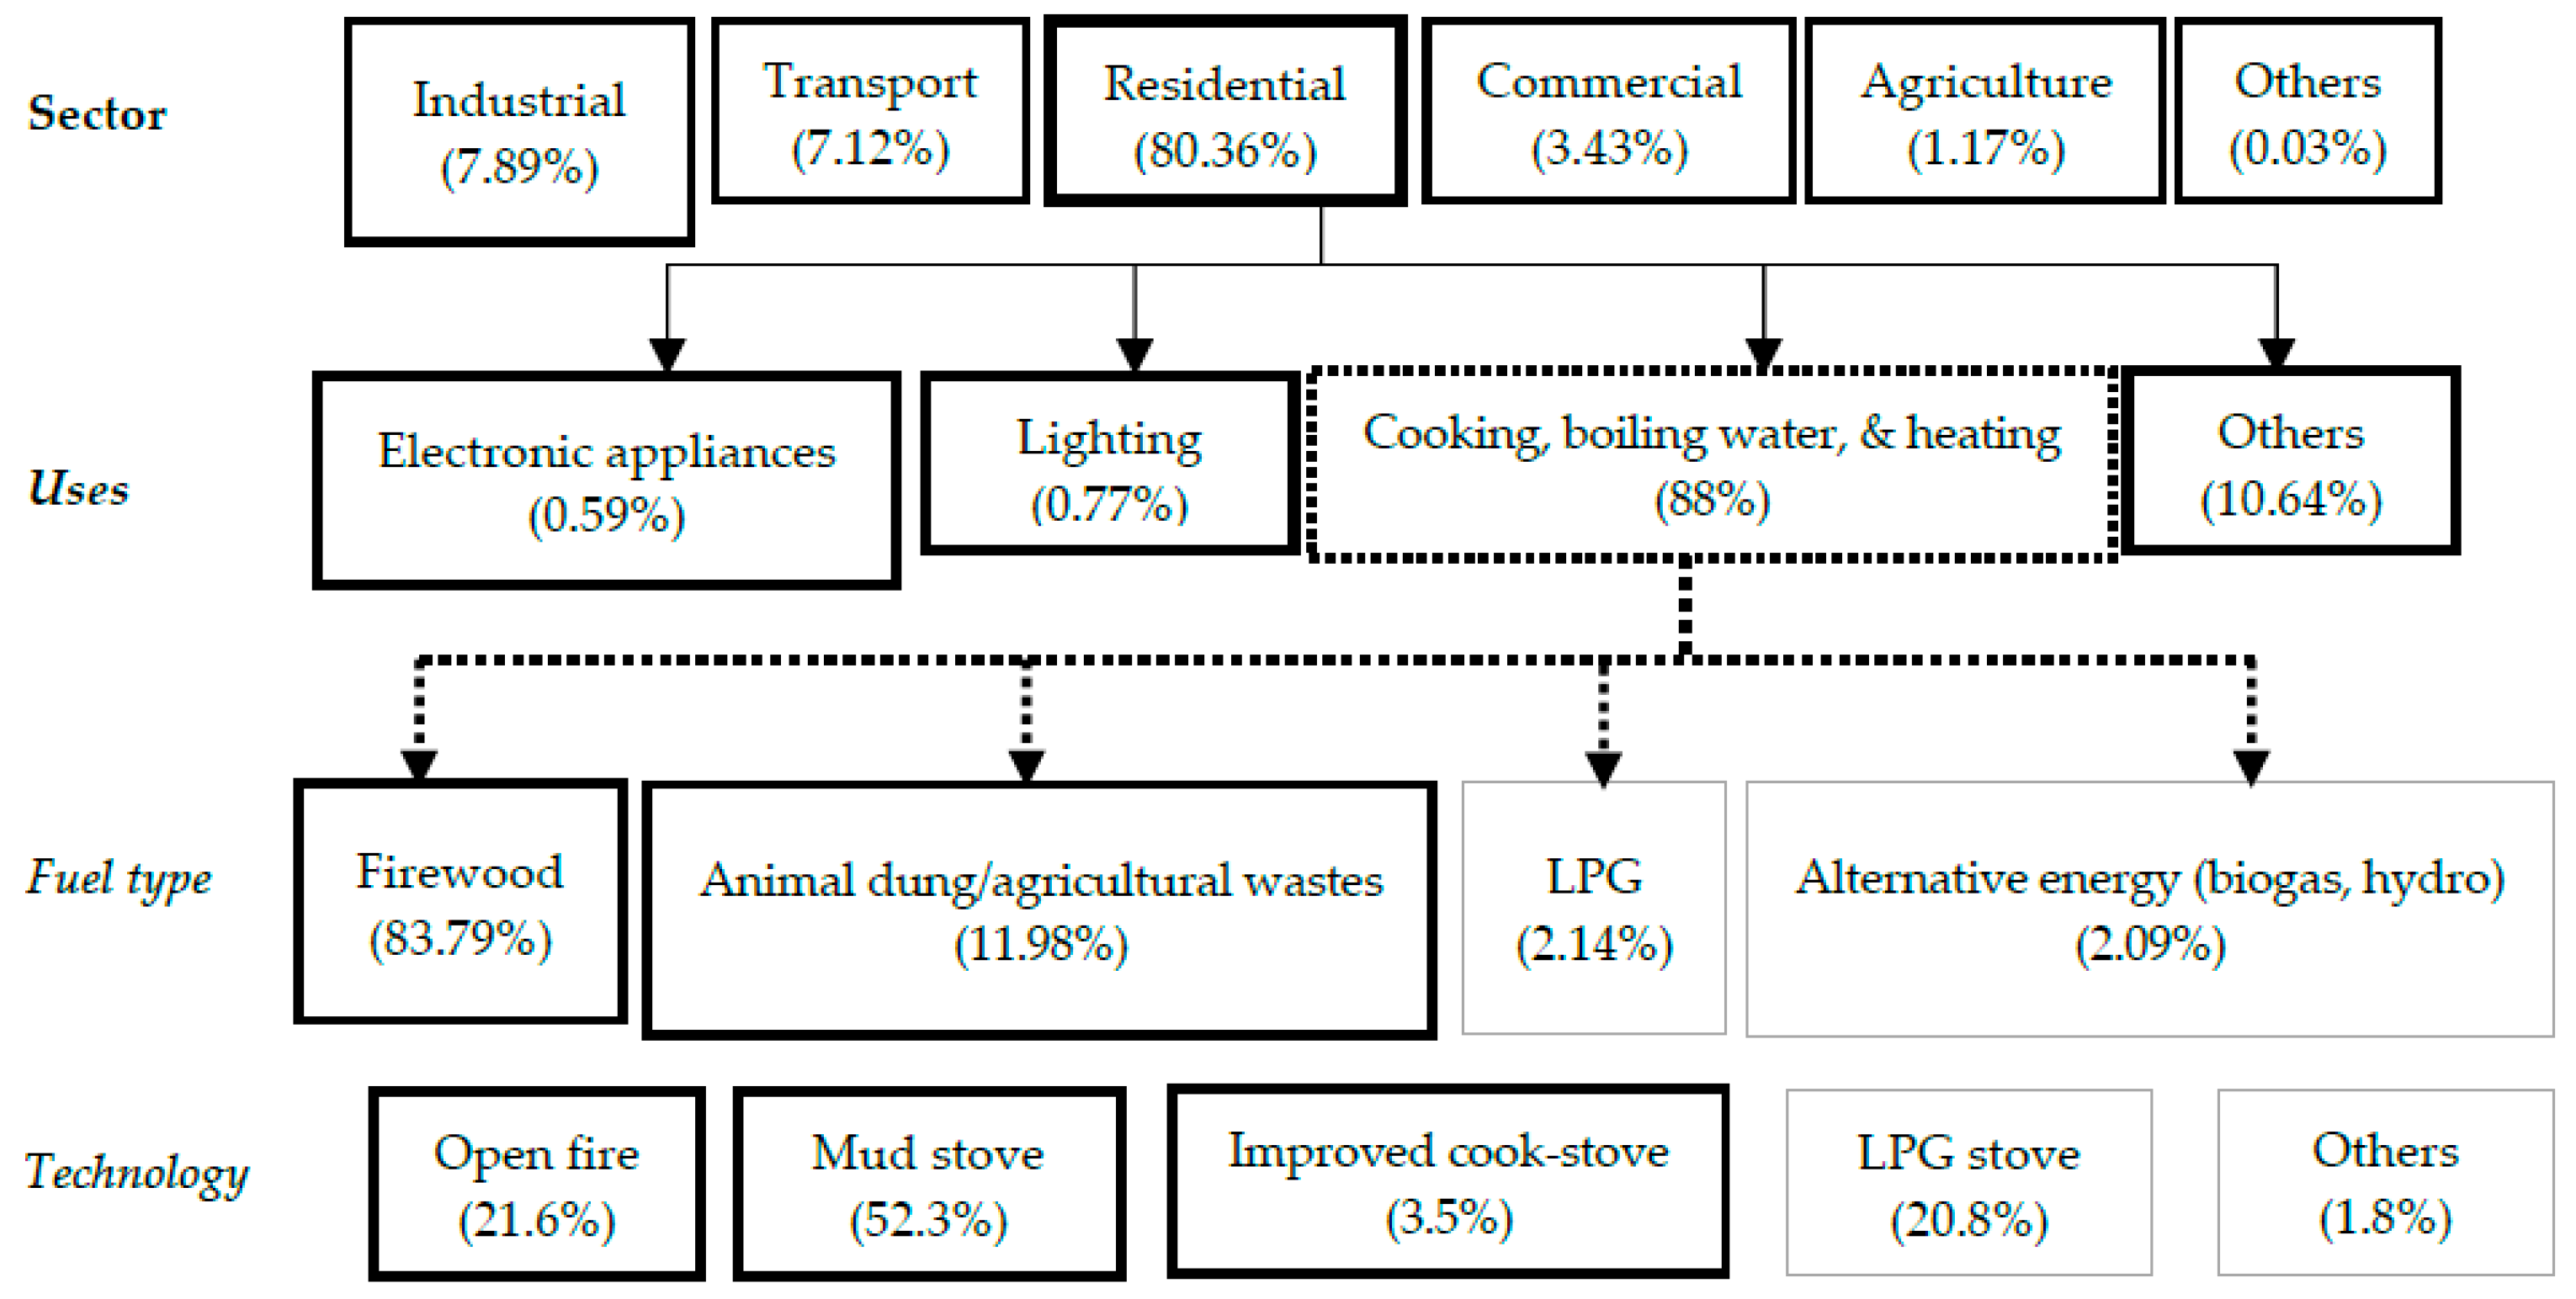
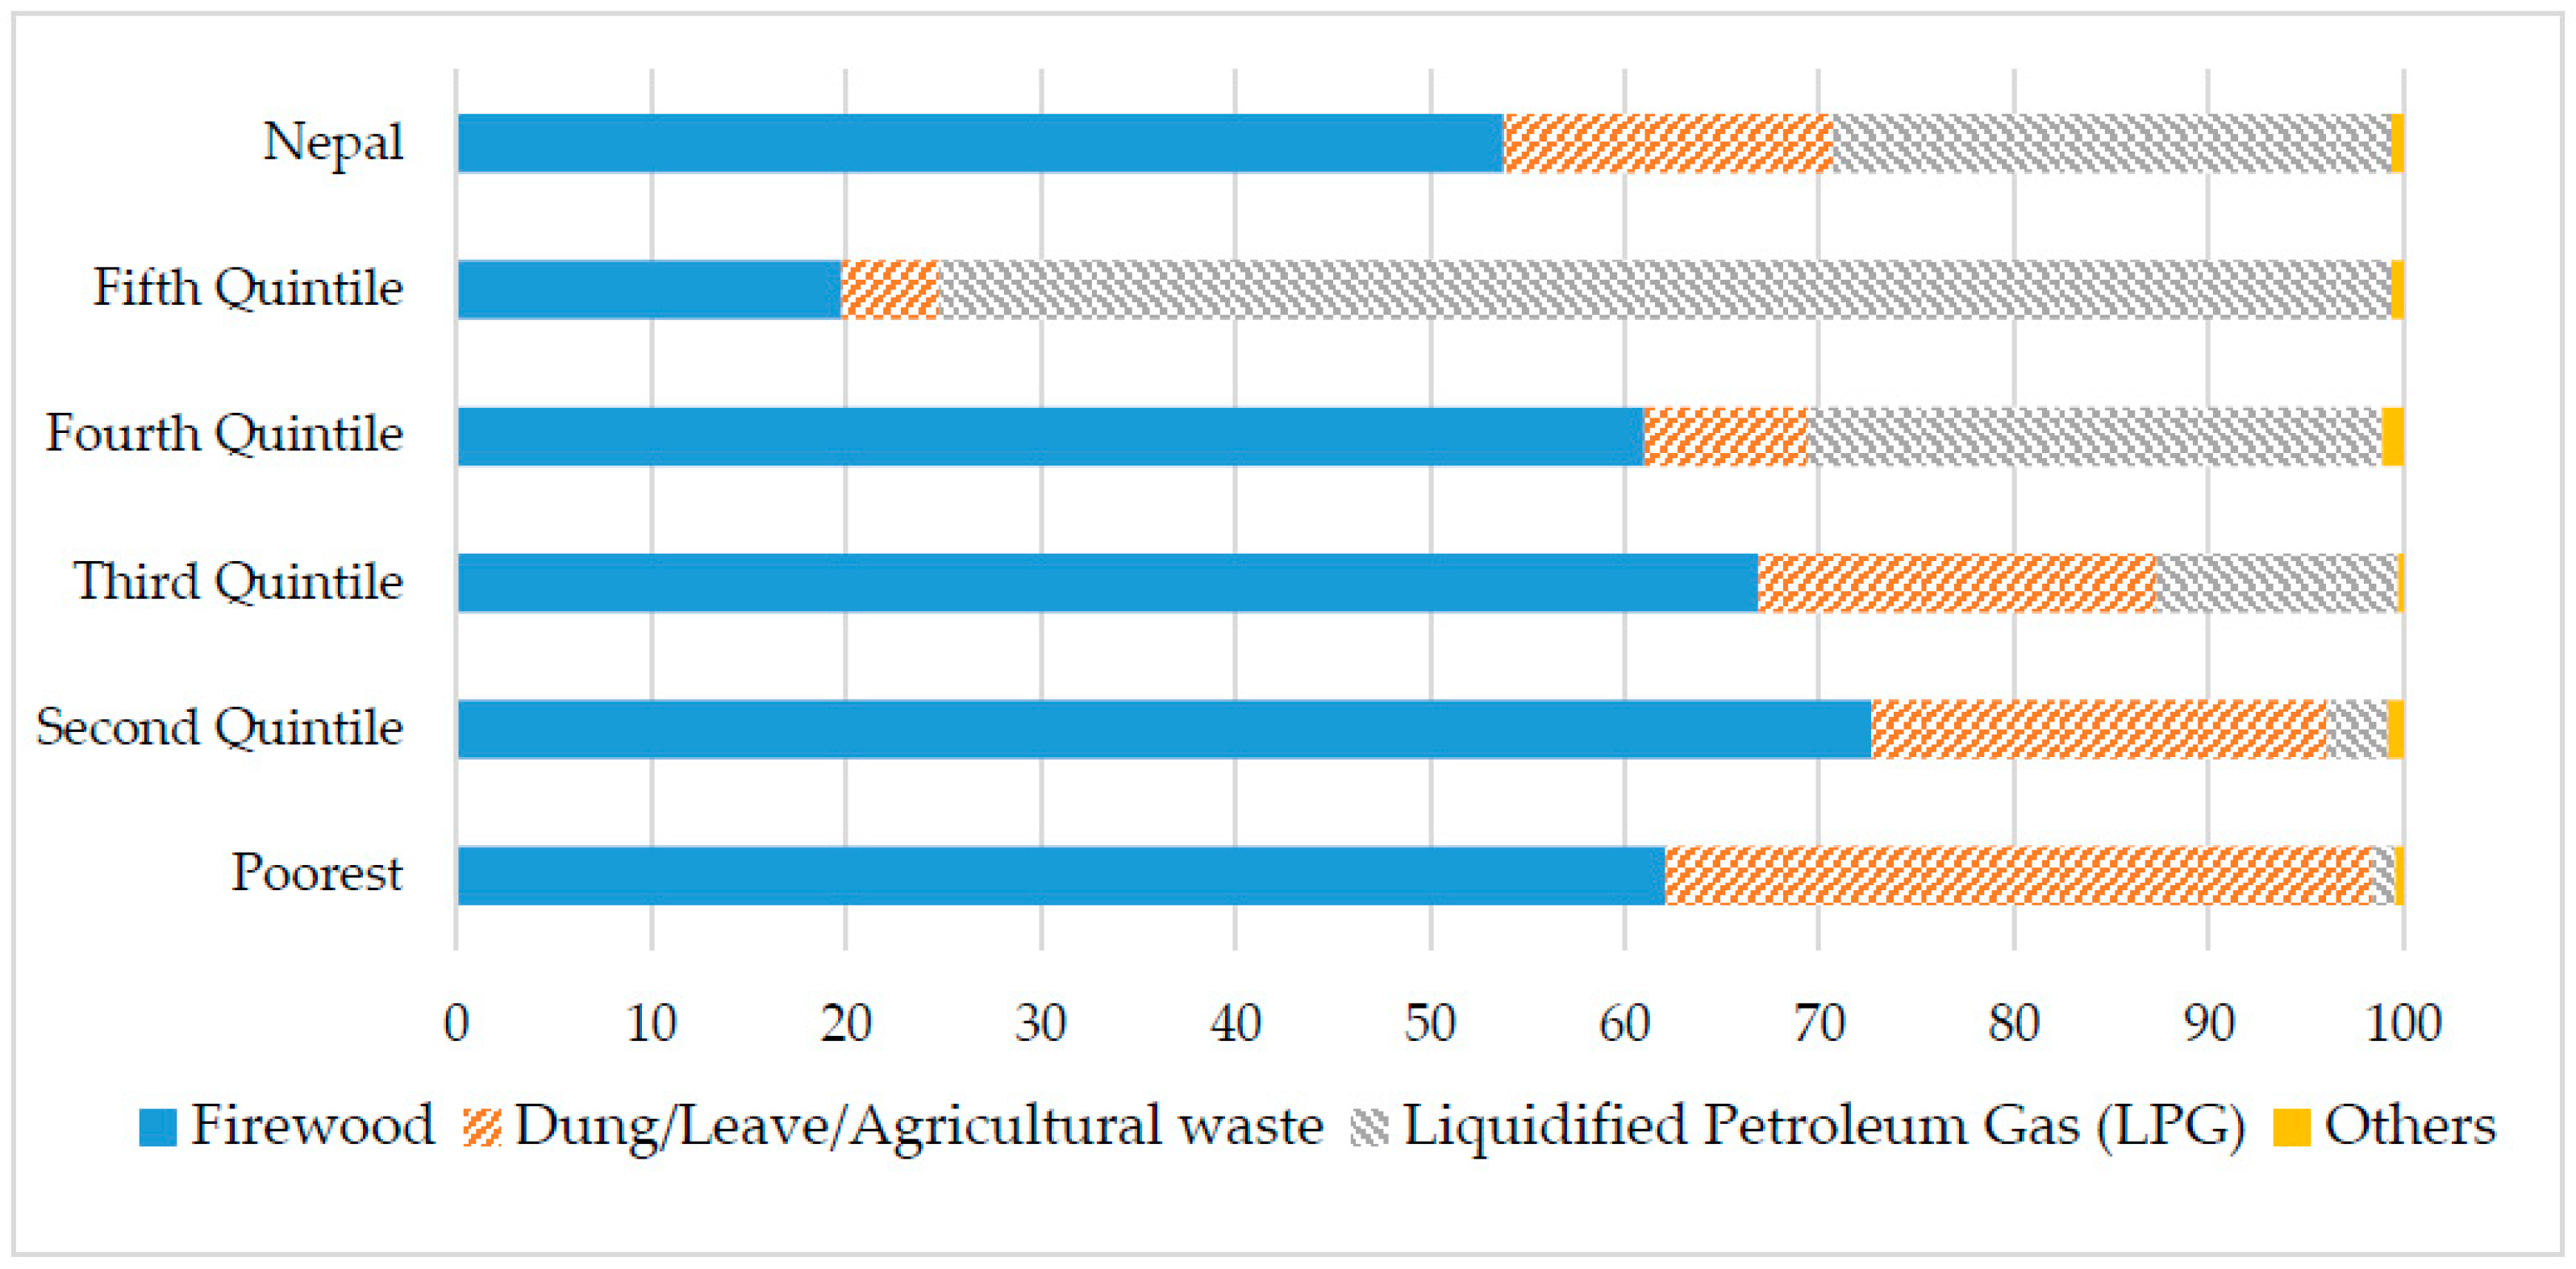
Table 1.
Summary of Nepal’s Development Strategies (1990–2015) relevant to Millennium Development Goals (MDGs).
| 2000–2015 | 1992–1996 | 1997–2001 | 2002–2007 | 2008–2010 | 2011–2013 |
|---|---|---|---|---|---|
| MDG-Related Priorities | Eighth Plan | Ninth Plan | Tenth Plan | Eleventh Plan | Twelfth Plan |
| Income Poverty | Training programs, employment generation (agriculture and forest industry, tourism and trade) | Training programs (agriculture and non-agriculture sectors), loans and microfinance (to promote self-employment, entrepreneurship) | Support agriculture, forest, trade and tourism sectors, reduce underemployment and unemployment | Vocational and skill-based training programs (agriculture and non-agriculture sectors), loans, cooperatives and microfinance | Vocational and skill-based training programs (agriculture and non-agriculture sectors), loans, cooperatives and microfinance, improve youth employment rate |
| Hunger | Food security, nutrition program | Nutrition program (production, supply, awareness) | Food security (supply, production and awareness) | Food security: sustainable production, supply and awareness | Nutrition Program, Food security (supply, production and awareness) |
| Education | Infrastructure, enrolment, scholarships for girls, physically challenged, poor, and marginalized populations. | Increased literacy, vocational education and training, scholarships for girls, physically challenged, poor, and marginalized populations | Increased literacy, education (formal, informal, special, technical/vocational), scholarships for girls, physically challenged, poor, and marginalized populations | Education for all including underprivileged children, improve quality of education | Scholarships for girls, physically challenged, poor, and marginalized populations, informal education programs for adults |
| Gender Equality | Women’s empowerment (through vocational and skill training, education) | Female literacy, women’s development (through institutional arrangement for equal opportunity and rights) | Women’s education (scholarships/stipends), gender mainstreaming, empowerment and equity in all sectors | Improve women’s access to education, economic resources, and participation in state mechanism and local development | Improve women’s access to education, economic resources, and participation in governance and local development |
| Health | Child survival and health, reproductive health and family planning, communicable and non-communicable diseases | Child survival and health, reproductive health and family planning, communicable and non-communicable diseases | Child survival and health, reproductive health and family planning, basic health services, communicable and non-communicable diseases | Child health and survival, Family planning and reproductive health, communicable and non-communicable diseases; basic health services | Child health and survival, Family planning and reproductive health, communicable and non-communicable diseases (through awareness programs, trainings, health camps); basic health services |
| Environmental Protection | Conservation areas for forest and watershed protection | Community-based forest management, biodiversity conservation, environment awareness and management, water and sanitation | Community-based forest management, water and sanitation, environmental awareness/education/management/monitoring programs, institutionalization and implementation of Initial Environmental Examinations (IEE) and Environment Impact Assessments (EIA) policies | Water and sanitation, Implementation of IEE and EIA policies, expansion of conservation areas, management and monitoring programs | Water and sanitation; sustainable forest management, wetland and watershed conservation; climate change adaptation and mitigation: Implementation of National Adaptation Plan of Action (NAPA); energy development |
| Global Partnerships | Efficient and effective utilization of foreign assistance (loans, aid, investment) | Foreign assistance (loans, aid, investment) | Efficient and effective use of foreign assistance, promote foreign trade; promote regional, multilateral and bilateral trade relations | Attract foreign investment to support industry base; promote regional, multilateral and bilateral trade relations | Attract foreign investment to support industry base; promote regional, multilateral and bilateral trade relations |
| Science and Technology | Communication (telecom), energy technologies | Agriculture/forestry research, appropriate technologies, communication | Communication (telecom), alternate energy, rural/appropriate technology | Alternative energy, international relation and cooperation for research and development | Alternative energy, international relation and cooperation for research and development |
| Physiographic Zone | Bioclimatic Zone | Elevation (m) | Proportion of Total Land Area | PA | Ecosystems | |
|---|---|---|---|---|---|---|
| % of Total PA Land Coverage | Total No. | Covered by PA | ||||
| High Himalayas | Nival, Alpine | above 5000 | 23 | 71 | 43 | 32 |
| Mountains | Alpine, Sub-alpine, Temperate Monsoon, Subtropical | 2000–5000 | 50 | 13 | 52 | 33 |
| Terai Siwalik | Tropical | <500–1000 | 27 | 16 | 23 | 15 |
Table 3.
Summary of the evaluation of MDG environmental indicators (X indicates that the indicator meets the criterion in each column).
| Indicators | Measuring | Relevance | Practicality (Data Availability) | Adequacy/Comprehensiveness | Sensitivity |
|---|---|---|---|---|---|
| CO2 per capita | Energy efficiency | X | |||
| Energy used per GDP | Sustainable economic development | X | |||
| Forest cover | Deforestation and forest degradation | X | X | X | |
| Proportion of protected area coverage | Biodiversity conservation | X | X | X | |
| Improved water | Safe drinking water supply, disease | X | X | X | |
| Improved sanitation | Safe drinking water supply, disease | X | X | X | |
| Slum population | Improved living conditions of the urban poor | X |
© 2016 by the authors; licensee MDPI, Basel, Switzerland. This article is an open access article distributed under the terms and conditions of the Creative Commons Attribution (CC-BY) license (http://creativecommons.org/licenses/by/4.0/).
Share and Cite
MDPI and ACS Style
Vaidya, A.; Mayer, A.L. Critical Review of the Millennium Project in Nepal. Sustainability 2016, 8, 1043. https://doi.org/10.3390/su8101043
AMA Style
Vaidya A, Mayer AL. Critical Review of the Millennium Project in Nepal. Sustainability. 2016; 8(10):1043. https://doi.org/10.3390/su8101043
Chicago/Turabian StyleVaidya, Ashma, and Audrey L. Mayer. 2016. "Critical Review of the Millennium Project in Nepal" Sustainability 8, no. 10: 1043. https://doi.org/10.3390/su8101043
Note that from the first issue of 2016, this journal uses article numbers instead of page numbers. See further details here.