Article

A Sustainable Performance Assessment Framework for Plastic Film Supply Chain Management from a Chinese Perspective

Uncertainty Decision-Making Laboratory, Business School, Sichuan University, Chengdu 610065, China
*
Author to whom correspondence should be addressed.
Sustainability 2016, 8(10), 1042; https://doi.org/10.3390/su8101042
Submission received: 25 July 2016 / Revised: 28 August 2016 / Accepted: 12 October 2016 / Published: 18 October 2016
(This article belongs to the Section Economic and Business Aspects of Sustainability)

Abstract

:
Academics’ and practitioners’ interest in sustainable supply chain management has received great concern in recent years. The application of biaxially-oriented polypropylene (BOPP) plastic film has had a significant influence on the economic, environmental and social performance of supply chain management. However, research on the integration of these three sustainable dimensions is still rare in this field. In this paper, we identify sustainability criteria based on a triple bottom line approach (economic benefit, environmental protection and social responsibility) from the supply chain perspective, develop a hybrid multi-criteria decision making framework to evaluate the criteria and select alternatives and apply the proposed approach to a real case study at a focal BOPP plastic film company in China. In the framework, a fuzzy analytical hierarchy process (FAHP) is used to determine the performance criteria weights and a fuzzy technique for order performance by similarity to ideal solution (FTOPSIS) is applied to rank the alternatives. The case study finds that the economic dimension was the most important aspect with environmental second and social third. The results also verify the effectiveness of the proposed framework. This paper develops an effective and systematic approach for decision makers to conduct evaluations and select optimal alternatives for focal plastic film companies.

1. Introduction

The choice of packaging systems influences the economic, environmental and social performance of a supply chain. Eighty percent of customer purchasing decisions for foodstuffs are made based on the packaging [1]. It is estimated that up to 50% of food is wasted in developing countries before it reaches retailers compared with 3% in developed countries, and packaging is thought to play a large part in this waste [1,2]. Packaging reduces damage in the supply chain and increases the shelf-life of products. The packaging industry market is huge. Since the reform and opening up, China’s packaging industry has developed rapidly, with the total output value increasing from 280.6 billion yuan in 2003 to 1465.8 billion yuan in 2013, an annual compound growth rate of about 17.98%. In 2014, total output value reached 1.48 trillion yuan, with China having become the world’s second largest packaging country after the United States.
In 2011, world plastic production rose to approximately 280 million tonnes [3], of which 54.74 million tonnes were produced in China. By 2015, Chinese plastic production had risen to 75.61 million tonnes, an average annual growth rate of about 9.53%. The market share of end-use applications shows that the largest segment in this growth area was the packaging sector, representing 39.4% of the overall demand [4]. In 2015, plastic film production was 13.14 million tonnes, a significant rise from the 8.44 million tonnes in 2011 and an average annual growth rate of about 13.92%. Of these plastic films, biaxially-oriented polypropylene (BOPP) film accounted for the largest proportion.
BOPP film is extensively used in the packaging industry and is known as the “Packaging Queen” [5]. The use of biopolymers represents one of the most promising strategies toward an optimized use of conventional non-biodegradable petroleum-based plastic packaging materials due to both the lower environmental impact and the improved technical performance [1,6,7]. BOPP film is the most commonly-used capacitor dielectric for pulsed power applications because of its self-healing capability, high breakdown strength, low dielectric loss and low dielectric absorption [7,8,9]. There are many types of BOPP film products, including adhesive tapes, tobacco film, photo albums, food stuff packages, book covers and other packaging [10]. During the past few decades, the world has experienced a rapid increase in both the production and consumption of BOPP, with the global BOPP film demand maintaining an average annual growth rate of about 7% since 2004. In 2014, BOPP global demand reached 7.97 million tonnes and in 2015 rose to 11 million tonnes. China’s BOPP industry started late, but has had rapid development, and China is now the world’s leading producer of BOPP film. Production was 3.72 million tonnes in 2014 and 4.08 million tonnes in 2015, accounting for about 45% of global production. In recent years, the continued expansion of BOPP production capacity has resulted in serious market saturation in China. According to statistics, actual capacity utilization is around 75%, after which the domestic market is in the state of excess capacity, and there is a serious surplus. Supply and demand imbalance and unreasonable product structures have become the most important reasons for a lack of BOPP industry development. Under this serious surplus situation, as well as the fierce competition, increasingly more BOPP companies value a sustainable supply chain management performance assessment for survival and development.
Sustainable development is commonly defined as “development that meets the needs of the present without compromising the ability of future generations to meet their own needs” [11], which has become a challenging and important task in the 21st Century world [12,13]. The best recognized principle to operationalize sustainability in business has been the triple bottom line (TBL) approach, which encompasses economic, environmental and social dimensions [14,15]. Sustainable supply chain management has been of great interest to academics and corporations in the last two decades due to the rising awareness of environmental protection and social well-being while supporting economic organizational goals [16,17,18,19,20]. With economic globalization, negative events, such as the capital ruptures in Wenzhou, the Chinese melamine milk contamination events and the Foxconn working condition strikes, have had a significant impact on company survival and development. These events reflect problems, such as unemployment, environmental contamination and inhumane working conditions [16,21]. Due to these influences, following the introduction of the sustainability concept, firms are increasingly endeavoring to integrate the economic, environmental and social sustainability dimensions to achieve the triple bottom line [14,17,22,23].
Plastic film evaluation assessments have mainly focused on the environmental dimension [1,3,24,25,26], with some assessments including two dimensions; for example, Pålsson et al. emphasized both environmental and economical functions [27,28], while Pires et al. [29] considered environmental and social dimensions. To date, only Zailani et al. [30] have evaluated social, environmental and economic performances for the sustainable development of the country; however, no specific criteria were defined for each dimension. The most popular evaluation method for plastic films has been the life cycle assessment (LCA) methodology [3,25,26,28]. Unfortunately, as many assessments have only focused on the product and few have considered supply chain management, it can be concluded that there is a paucity of practical and all- encompassing plastic film assessment methods.
  • A majority of sustainable assessment research papers has primarily dealt with one or two dimensions, and very few have concurrently addressed all three aspects [12,16,31]. In plastic film assessment, some research has considered the environmental dimension [1,3,24,25,26], some has examined the environmental and economic dimensions [27,28] and some has included the environmental and social dimensions [29], but there has been limited research that has integrated all three. The work in [30] considered economic, environmental and social dimensions, but failed to identify any concrete criteria. Generally, a majority of past research has focused on economic and environmental performance, completely ignoring the social dimension [12]. This may be because the social dimension is the most difficult to assess as social indicators are difficult to quantify and are often prone to subjectivity [32].
  • Plastic film assessment methods usually involve a single evaluation, the most common of which has been the LCA method [1,25,29]. While the life cycle assessment approach is a popular technique for addressing the environmental aspects of supply chains, implementation is not always possible because of the complex and time-consuming process [31,33]. Integrated hybrid fuzzy multi-criteria decision making (MCDM) methods and fuzzy individual AHP have also been popular methods [34]; however, fuzzy MCDM methods have seldom been used in plastic film assessment, as this method has been considered more suitable to sustainable evaluation systems [12,32,34].
  • Few sustainability criteria systems that concurrently consider the economic, environmental and social dimensions have been developed for the plastic film supply chain [12,16,30]. In the plastic film industry, the conventional indicators are insufficient for an accurate assessment of the performance of sustainable supply chains, as they predominantly focus on environmental issues [32].
  • Most industry evaluations have usually focused on the product and few have examined the overall supply chain management [1,3,29]. However, to fully examine the sustainable development of plastic films, an assessment from the supply chain perspective has become increasingly important [16,32]. Therefore, it has become imperative to establish an assessment system for sustainable supply chain management in the plastic film industry [12,22,23].
Therefore, considering the present Chinese BOPP industry situation, it is evident that there is an urgent need to develop an appropriate framework to evaluate the sustainable performance of BOPP plastic film supply chain management [16,22,23,35]. From a contemporary understanding of sustainable SCM, performance measurement indicators, tools and management systems are an essential and integral part of sustainable SCM [32]. With this in mind, the novelty of this paper is as follows.
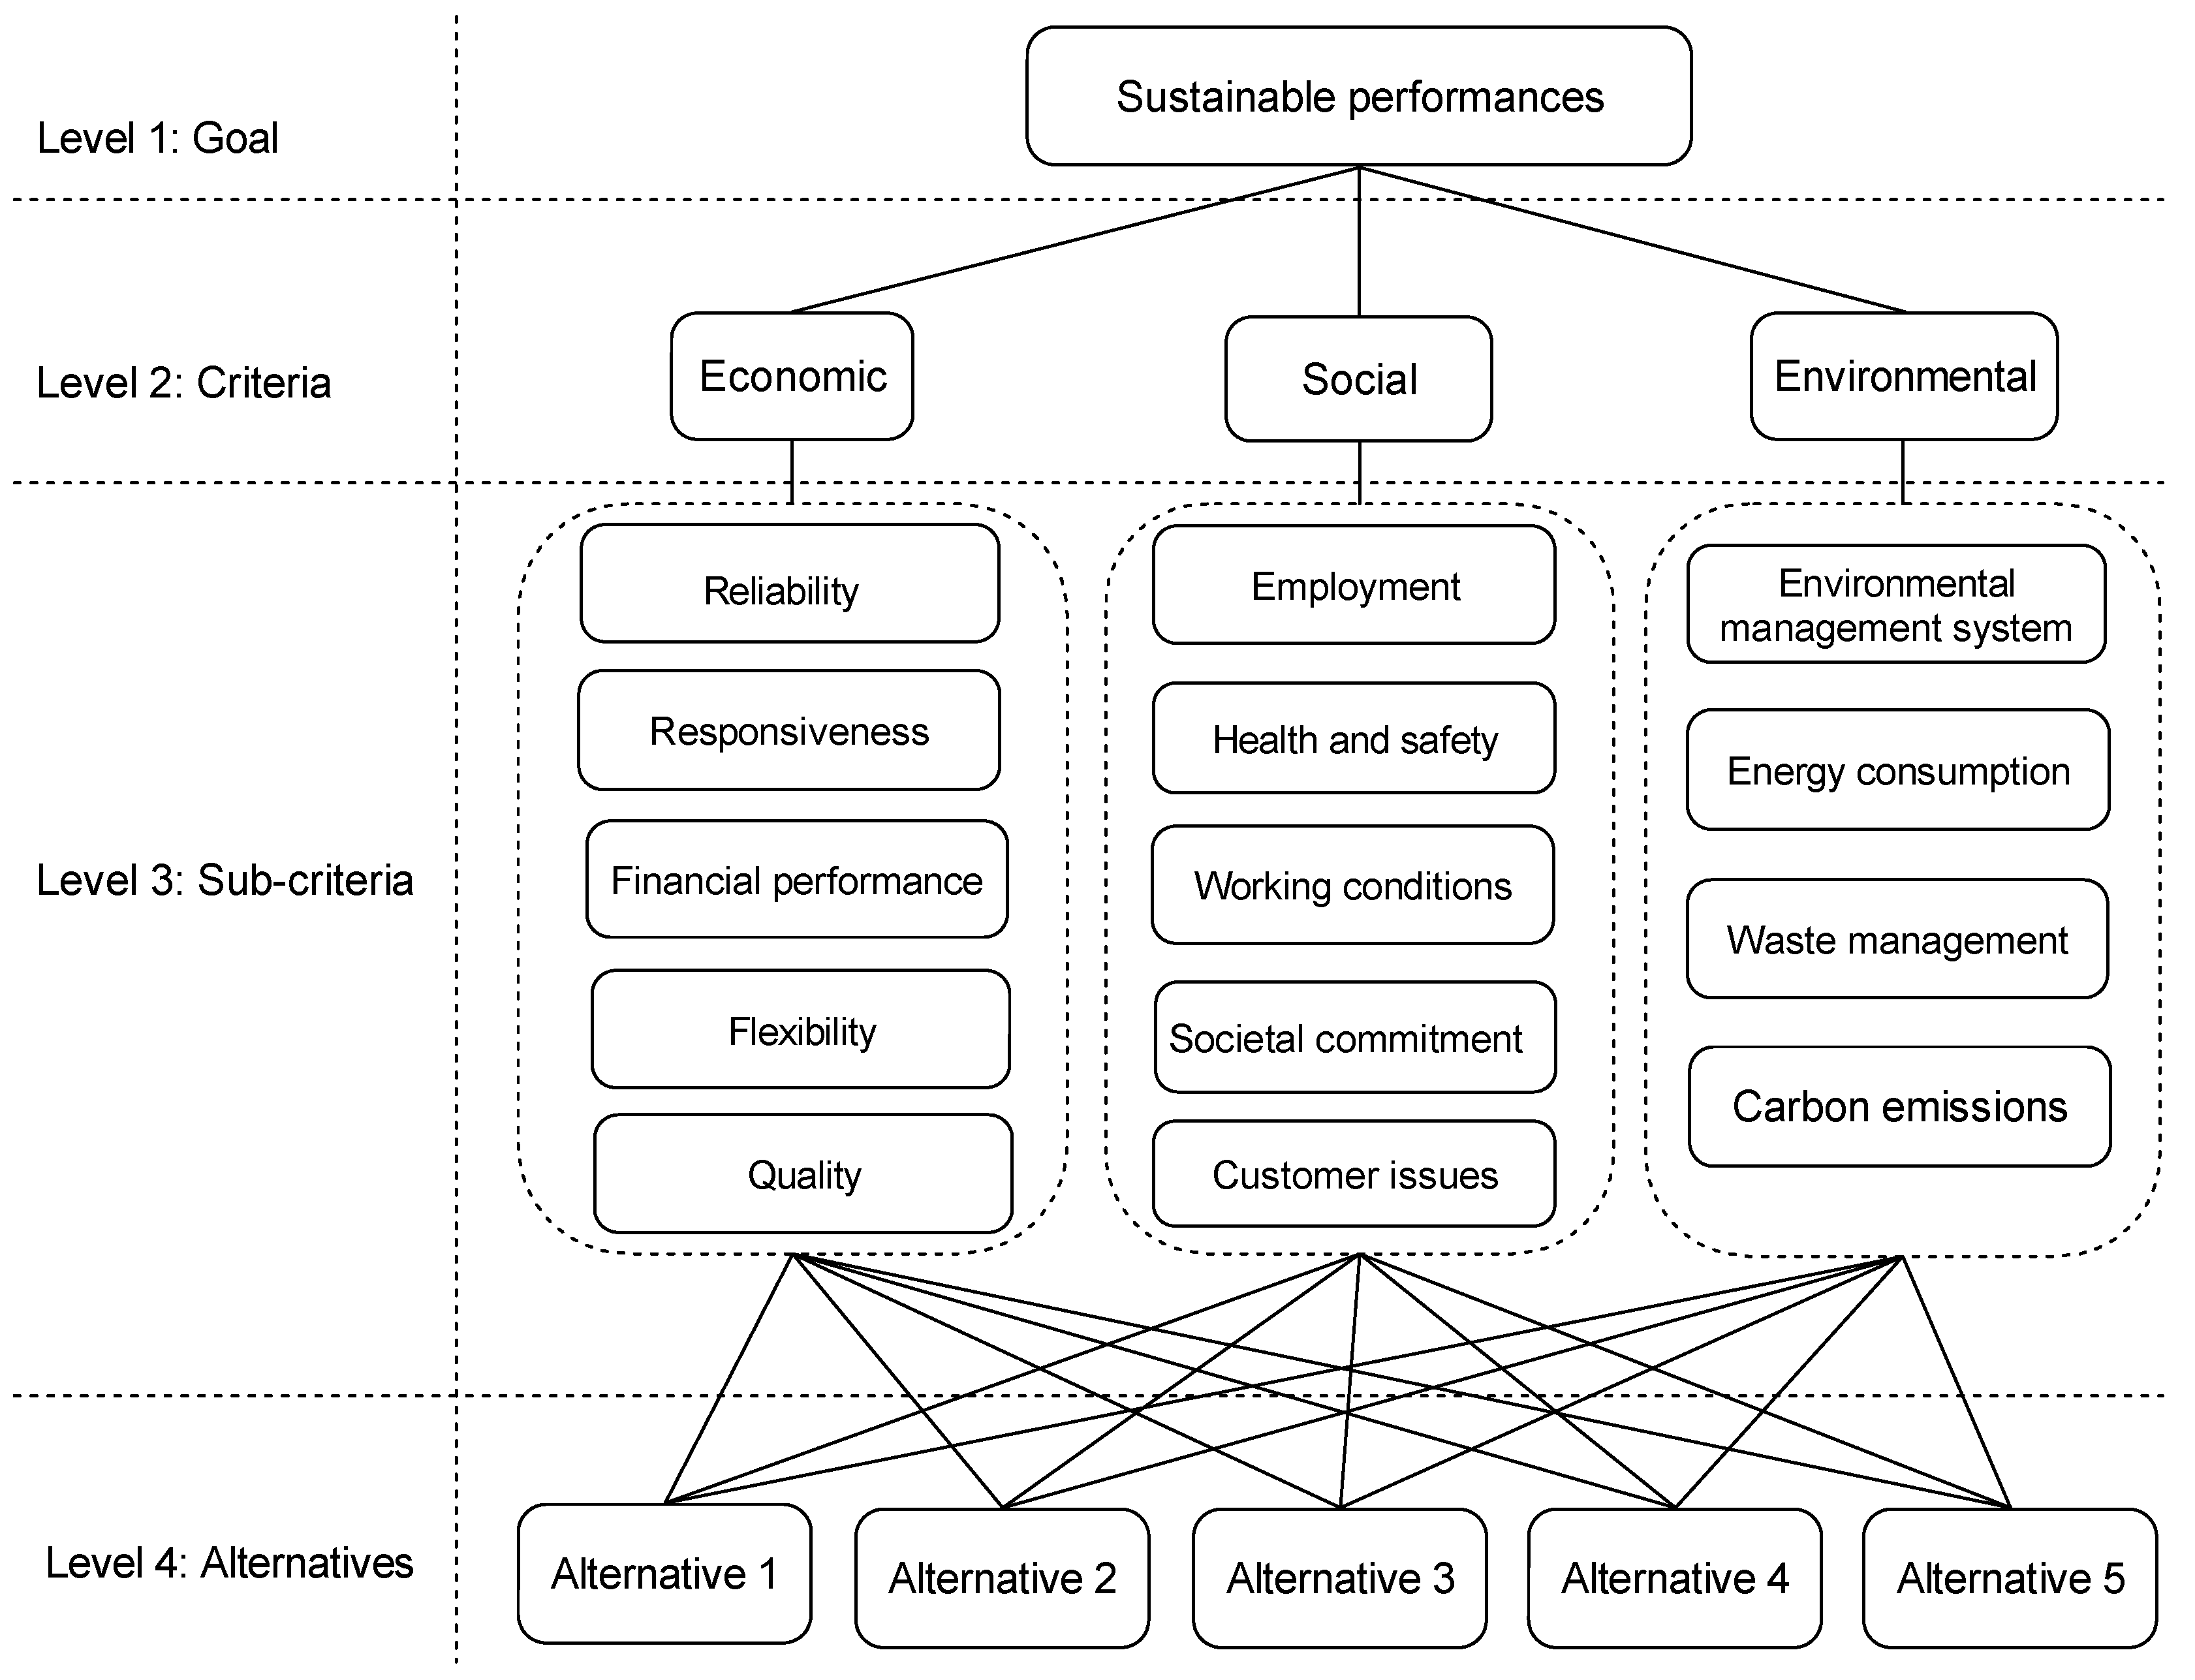
  • A sustainability indicator system applicable to the plastic film supply chain is developed that considers the economic, environmental and social dimensions from the supply chain management perspective.
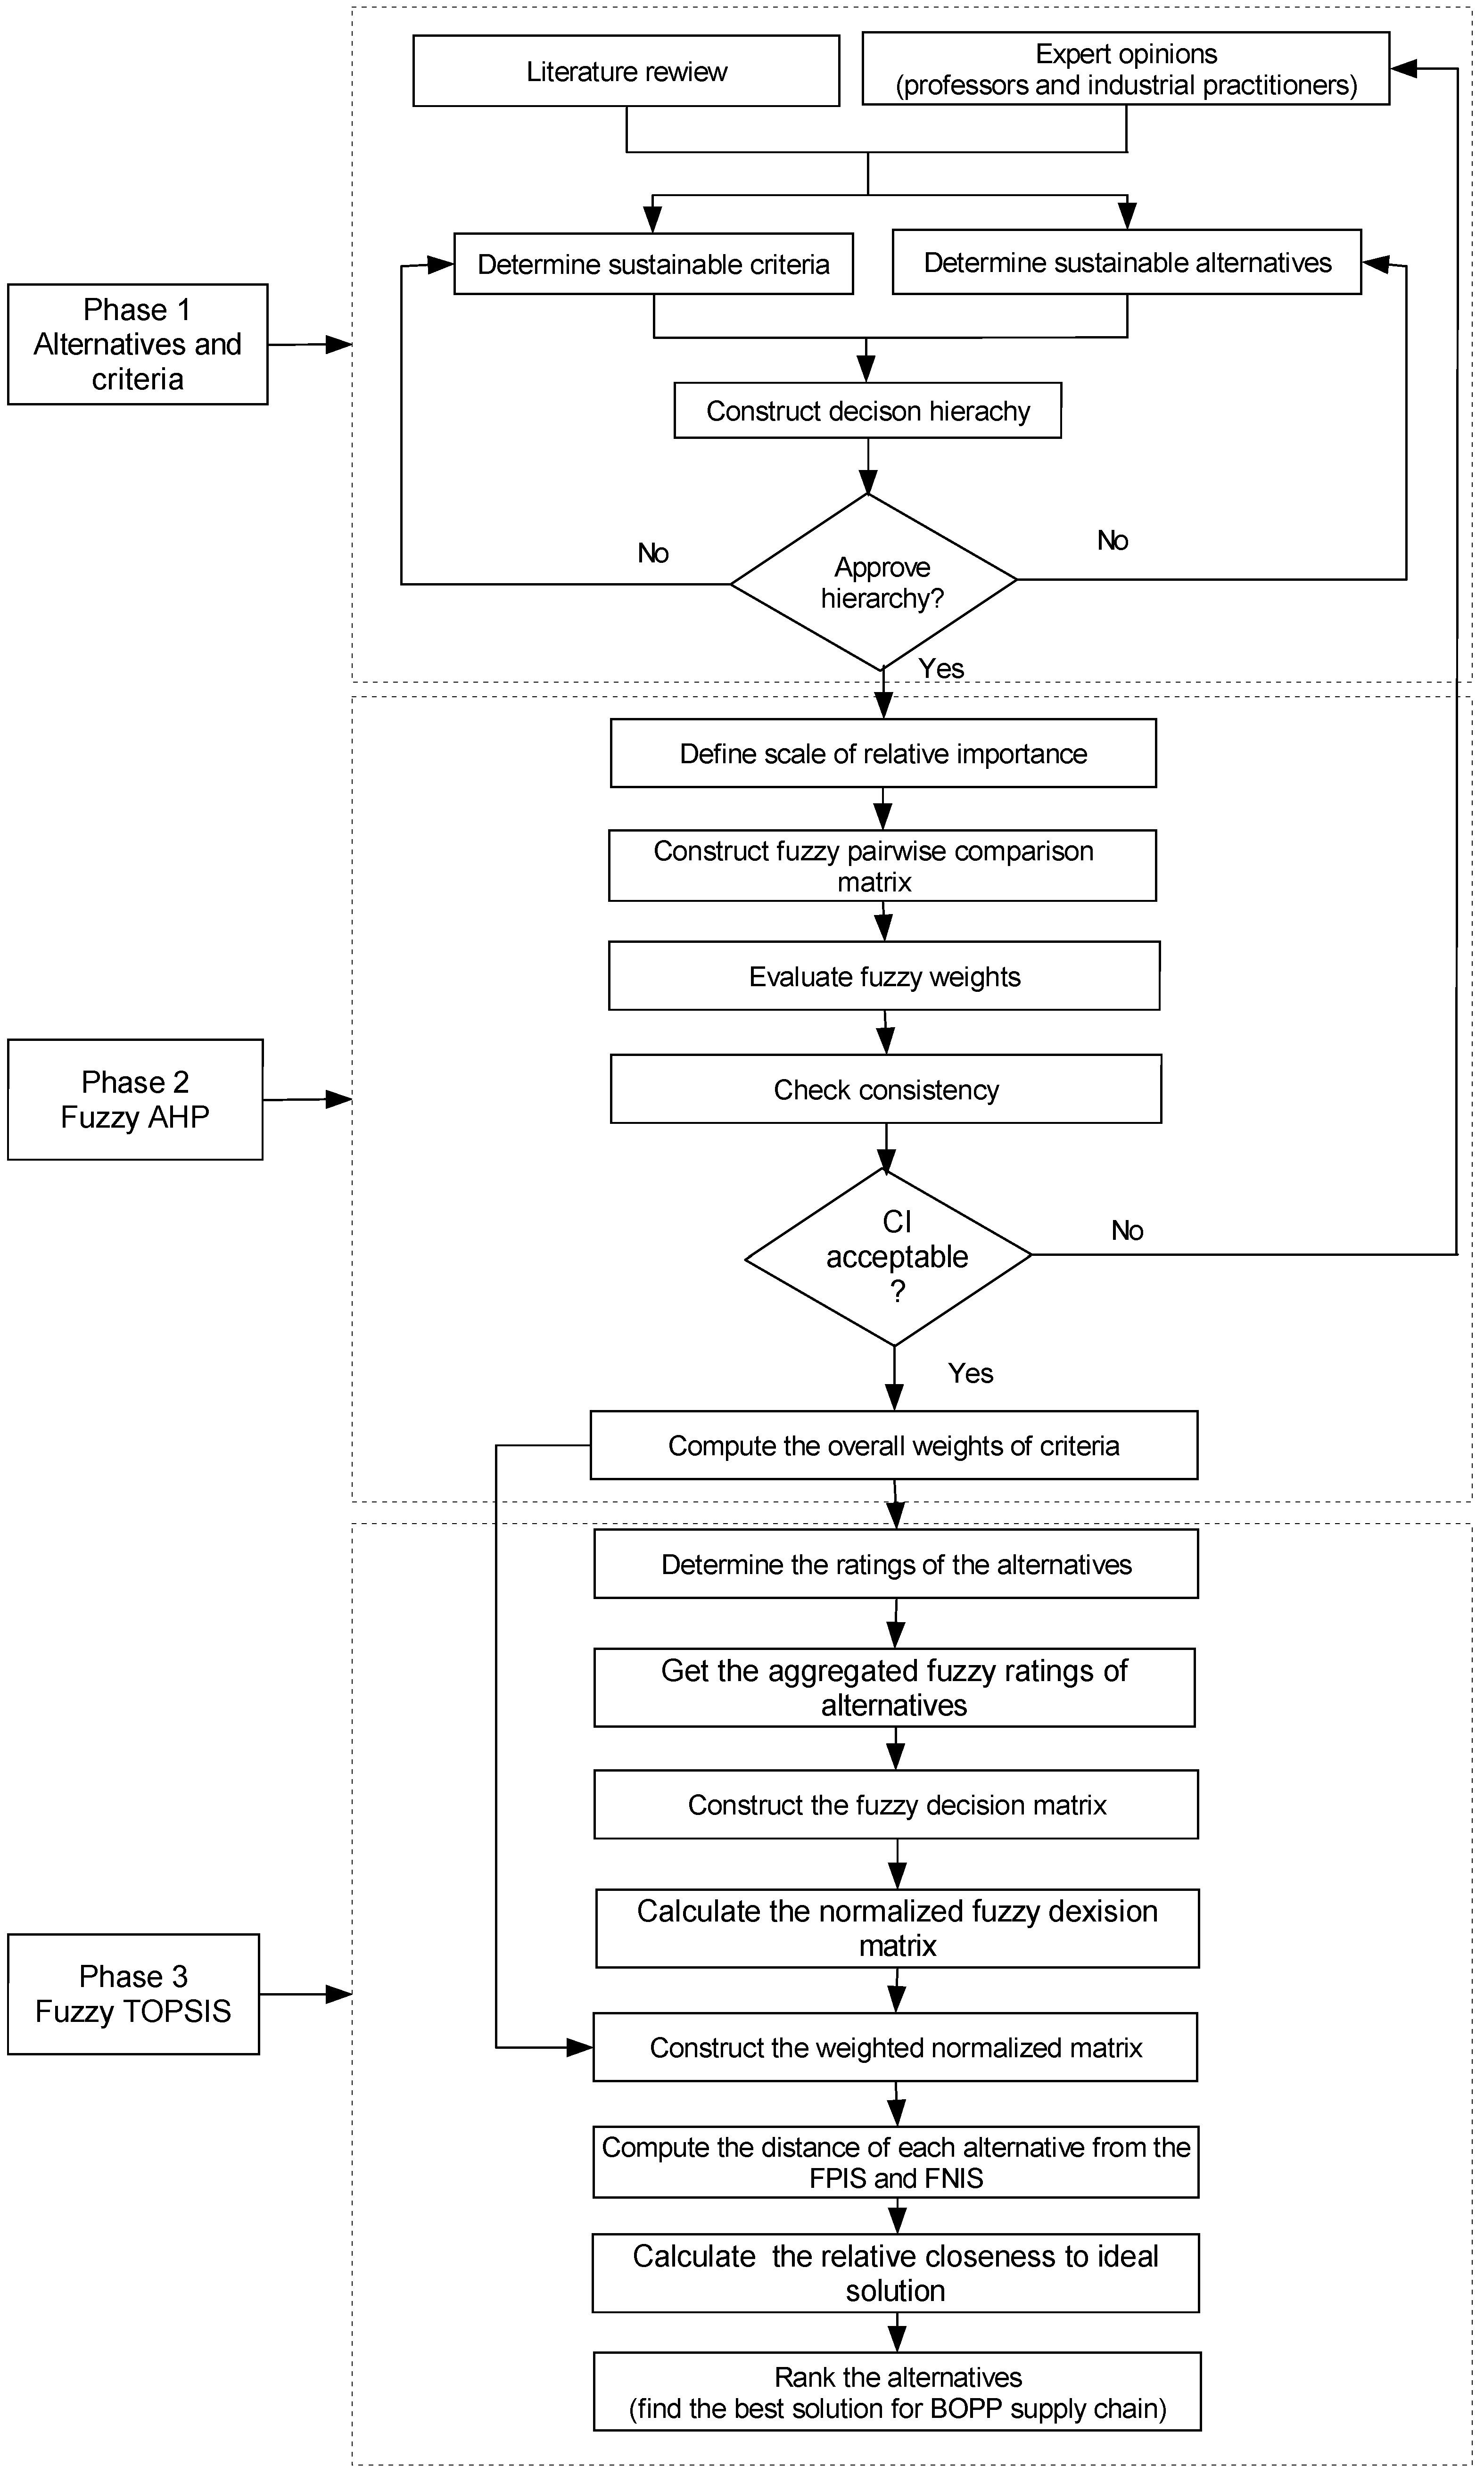
  • A fuzzy hybrid multi-criteria decision making framework is proposed to evaluate and select the optimal solution for the plastic film supply chain. A fuzzy AHP is first used to prioritize the criteria, and fuzzy TOPSIS is applied to rank the sustainability alternatives.
  • The proposed method is applied to a real case study at a focal BOPP plastic film company in Chengdu. The results from this model could provide decision support for policy makers to balance BOPP supply and demand, adjust the industry structure and promote regional sustainable eco-environmental development in China.
The remainder of the paper is organized as follows. Section 2 gives a literature review on sustainable performance assessment; Section 3 outlines the current status of the BOPP plastic film industry in China; Section 4 proposes a sustainable assessment framework; Section 5 presents an application example; and Section 6 concludes the study.

2. Literature Review

In this section, previous research on the sustainable dimensions of supply chain management and evaluation methods and plastic films assessments are reviewed to identify the sustainable criteria and methods to be used in our study.

2.1. SCM Sustainability Dimensions

Most sustainable supply chain management (SSCM) models have tended to only focus on either economic or environmental aspects [16,22,23,36]; few have integrated two sustainability aspects, and very few models have concurrently integrated three aspects [16]. In the following, we focus our review on those papers that have included two or three supply chain management sustainability dimensions.
Chaabane et al. [37] presented a mixed-integer linear programming-based framework for sustainable supply chain design and evaluated the tradeoffs between economic and environmental objectives under various cost and operating strategies in the aluminum industry. Eskandarpour et al. [31] proposed a literature review focused on optimization models and techniques on supply chain network design problems integrating sustainable development factors. Chardine-Baumann and Botta-Genoulaz [23] presented a framework for sustainable performance characterization and assessment. Sardar et al. [38] proposed a sustainable outsourcing strategy for international markets to reduce costs and cost reductions and increase capacity flexibility for domestic market outsourcing. Bouherroub et al. [22] developed an integrated approach for transposing sustainable development principles to supply chain modeling and applied it to a Canadian lumber industry case. In evaluating and selecting sustainable suppliers, Sarkis and Dhavale [39] took a triple-bottom-line approach based on a Bayesian framework and a Monte Carlo Markov Chain (MCMC) simulation to rank and select suppliers using special selection objectives. Gopal and Thakkar [40] examined how sustainable supply chain practices are relevant, and helped to improve industry supply chain performance and found that social and environmental performances had a positive relationship with economic performance. Shen [41] examined a current textile and clothing sustainable supply chain and applied the findings to an H&M case study to assess human wellbeing, environmental wellbeing and economic wellbeing from a Swedish perspective. You et al. [42] analyzed the Pareto frontier for the three sustainability dimensions. Matos and Hall [36] assessed sustainable development by applying the life cycle assessment (LCA) method to two case studies. Yusuf al. [43] studied the impact of sustainability on the operational and business performance of U.K. oil and gas supply chains. Björnberg et al. [15] investigated the sustainable key actors in a Swedish food supply chain and found that there was a less explicit consensus between the companies. Berning and Venter [44] applied a related supplier theory to decide on retailer progress in sustainable supply chain management. Varsei et al. [21] presented a multidimensional framework that could be useful for research scholars and supply chain practitioners in identifying and assessing various economic, environmental and social performance indicators. Varsei and Polyakovskiy [33] investigated a wine supply chain and proposed a generic model for sustainable wine supply chain network design that encompassed economic, environmental and social objectives. Balfaqih et al. found that performance measurement in supply chain management was a fruitful research field [32,45]. The sustainability dimensions are shown in Table 1.
As mentioned above, to the best of our knowledge, the only previous research that has referred to supply chain management assessment has been [21,23,36,39]; all other papers have tended to concentrate on supply chain design or planning. The first purpose of this paper is to define the sustainability assessment dimensions for the BOPP plastic film supply chain. In this paper, through a comprehensive research analysis, three concurrent sustainability dimensions have been identified; economic benefit, environmental protection and social wellbeing.

2.2. Review of Evaluation Methods

Performance measurement methods that consider multiple sustainability performance criteria encompass multiple dimensions [22]. There have been some notable contributions to the evaluation field. Seuring [12] divided sustainability models into four categories: life-cycle assessment (LCA)-based models, equilibrium models, multi-criteria decision making (MCDM) and analytical hierarchy process (AHP) applications. Mardani et al. [34] grouped research into four areas: engineering, management and business, science and technology; and after analysis found that hybrid fuzzy integrated and fuzzy MCDM methods were the first and second most commonly-used methods.
In the real world, there are many problems that need to deal with vague, imprecise and uncertain information [46], making it difficult to provide numerically-precise information [47]. The use of linguistic modeling in problems dealing with non-probabilistic uncertainty has proven to be logical and has produced successful results in different fields, with the vagueness and uncertainty being handled using fuzzy set theory [34].
Multiple criteria decision-making research has developed rapidly and has become a main research area for dealing with complex decision problems [46]. One of the most outstanding MCDM approaches has been the fuzzy AHP, which is able to handle linguistic variables from the uncertain imprecise judgments of experts [34]. Fuzzy AHP has been extensively used as a useful multi-criteria decision making tool or a weight estimation technique in diverse applications [12,46]. Recently, the use of fuzzy AHP has been extended to multi-criteria decision problems in a few other fields. Abdullah and Zulkifli [46] proposed a hybrid fuzzy AHP method and an interval Type-2 fuzzy Decision Making Trial and Evaluation Laboratory (DEMATEL) for human resource management. Ng [48] applied a fuzzy AHP method to evaluate the environmental performance of design alternatives. Kilincci and Onal [49] applied FAHP to a supplier selection problem in a washing machine company. Chen et al. [50] used FAHP to evaluate teaching performances, and Patil and Kant [51] proposed an FAHP approach for knowledge management.
Fuzzy TOPSIS is another MCDM method that has been widely used to solve problems in a fuzzy environment [47]. Fuzzy TOPSIS is based on the concept that the chosen alternative should be closest to the positive ideal solution (PIS) and the furthest from the negative ideal solution (NIS) [47,52,53]. Fuzzy TOPSIS methods are very suitable for solving real-life application problems under a fuzzy environment [51,53]. Cavallaro et al. [52] applied fuzzy TOPSIS to evaluate combined heat and power systems. Zyoud et al. [53] proposed a fuzzy AHP-TOPSIS framework for water loss management in developing countries. Lima-Junior and Carpinetti [54] used fuzzy TOPSIS for supplier evaluation and management. Kusi-Sarpong et al. [55] used a joint rough sets and fuzzy TOPSIS methodology to evaluate green supply chain practices in the mining industry. Additionally, Patil and Kant ranked the solutions for knowledge management adoption in a supply chain to overcome barriers [51].
Hybrid fuzzy integrated and fuzzy MCDM methods have been found to be the first and second most popular methods [34]. The hybrid FAHP-TOPSIS method as an FMCDM approach has been widely used in management and business [34,51,53]. The second purpose of this paper is to develop a framework to evaluate the performance of the plastic film supply chain, for which the hybrid FAHP-TOPSIS is employed.

2.3. Review of Plastic Film Assessment Research

While significant research has been done on plastic film, most has focused on the environmental assessment of the products. Jasch [25] applied an LCA methodology to evaluate the damage arising from the life cycle of a bi-layer film bag for food packaging from an environmental perspective. Leceta et al. [26] conducted an environmental assessment of bio-based films based on agro-industrial byproducts and marine residues in an effort to add value to these wastes. Barlow and Morgan [1] focused on packaging in the meat and cheese industry and analyzed the impact of films and bags and the influence of packaging on the levels of waste and energy consumption elsewhere in the system. Toniolo et al. [3] focused on the environmental advantages of two recycled plastic packages, one recyclable after use and one not, using the LCA approach. The results indicated that the choice of a comparative LCA application was an effective method for investigating the extent to which an innovative recyclable package was environmentally preferable to an alternative non-recyclable package. Martinho et al. [24] focused on increasing packaging sustainability through the use of eco-design tools and examined the factors that influenced consumer product purchasing and recycling behavior with respect to sustainable packaging. The sustainable variable was environmental awareness, which included purchase and disposal actions. Some assessments have focused on two dimensions, such as economic and environmental dimensions or environmental and social dimensions. Pålsson et al. [27] developed an evaluation model for the selection of packaging systems in supply chains from a sustainability perspective. Environmental calculations were based on carbon emissions, and economic calculations were based on costs. Grönman et al. [28] presented a systematic framework for sustainable food packaging design using SWOT analysis and used the LCA method to evaluate the environmental and economic functions. Pires et al. [29] considered sustainability criteria, which were aggregated using a multi-criteria decision making method on two dimensions: environmental aspects related to life cycle assessment and social aspects related to the environmental information on the packaging. There has to date been little research focused on all three dimensions. Zailani et al. [30] carried out a cross-sectional survey in 700 companies and found that eco-efficiency practices had a direct influence on the adoption of sustainable packaging and therefore affected the sustainable supply chain performance of the firm; however, no specific plastic film indicators were identified. The evaluation dimensions and indicators for plastic films are shown in Table 2.
To the best of our knowledge, there has been little research that has integrated the triple bottom line approach for plastic films supply chain management sustainability evaluations, and there have been few assessments on BOPP plastic film supply management. From this, therefore, it can be concluded that, at present, there is insufficient integration and maturity in the plastic film field [16,22,23] as there is no fully-integrated evaluation framework for the plastic film industry in line with the TBL approach. This paper seeks to enrich these contributions by developing a framework for a sustainable performance assessment of the BOPP plastic film supply chain in China. The framework is developed and reinforced by the simultaneous assessment concept of the TBL sustainability dimensions. The third purpose of this paper is to identify specific sustainability criteria for BOPP plastic film supply chain management, for which the above-mentioned research can offer a useful reference. It is evident that such sustainability dimensions, assessment methods and performance measurement indicators are a significant and integral part of sustainable plastic film supply chain management.

3. Current Status of BOPP Industry in China

Currently, China is the second largest economy in the world with an annual growth rate of about 7%. This economic growth has been placing massive demand on the packaging industry. Until 2015, there were about 110 BOPP film production companies and 230 production lines in China, with a total capacity of 5.16 million tonnes and a total output of 3.85 million tonnes. However, regardless of this growth, the current industrial concentration is too low. As can be seen in Table 3, the BOPP has experienced rapid development in recent years. Since 2004, China’s BOPP industrial capacity and production have had steady growth, with an annual growth rate of more than 10%. Total production capacity has increased by nearly two times from 1.93 million tonnes to 5.16 million tonnes. However, demand has not kept up with supply, which has caused serious problems for specific companies. Oversupply has resulted in closures, bankruptcies and company restructuring. At this time, BOPP enterprises are facing a severe test.
BOPP development has been uneven and has had prominent structural contradictions. In recent years, new production lines have been mainly for flat film production; however, functional film supply is unable to meet market demand. Therefore, there is overcapacity in some areas because of an irrational product structure, and these serious structural issues are expected to continue if the current product status remains the same. Seventy percent of domestic demand for BOPP film in 2011 was for flat film, 6% for pearl film, 5% for cigarette packaging film, 9% for capacitor film and 10% for all others (Figure 1). However, flat film demand has been gradually decreasing, and demand for functional film has been increasing year on year due to market changes. According to data from 2015, market flat film demand was about 60%, a decrease of 10% compared to 2011.
BOPP capacity is widely distributed in China, but is extremely uneven with large regional disparities. The economies of East China and South China are relatively developed with significant flexible packaging demand. Therefore, the numbers and capacities of BOPP packaging film manufacturing companies are much greater than in the Southwest or Northwest, in which there are no BOPP plants. As shown in Figure 2, BOPP packaging film capacity distribution is mainly concentrated in East China (Shanghai, Zhejiang, Anhui, Jiangsu, Shandong, Fujian and other provinces) and South China (Guangdong, Hainan and other provinces and regions). As the film industry development speed in the northeast, north and southwest is increasing and because of cost increases in South China and the Jiangsu and Zhejiang areas, the industry is expected to move to the north and west. Another major factor behind this expected move is the Chinese regional industrial support policy. There are no BOPP plastic film production lines in the northwest (Shaanxi, Gansu, Qinghai, Ningxia and Xinjiang). However, the demand for BOPP plastic film in this area has increased year on year. In particular, border exchanges with Central Asia (Kazakhstan and other countries and regions) are increasing with exports of BOPP from Xinjiang increasing annually. Northwest BOPP films are mainly purchased from the southwest (Chengdu and Chongqing), as well as from the South China and East China regions. Therefore, there is significant space for BOPP development in the western region of China.

4. The Proposed Framework for Sustainable Performance Assessment

There has been little research into identifying the criteria and prioritizing and ranking the alternatives to develop a sustainability assessment framework for the BOPP film supply chain for Chinese companies. There are many situations where only vague, imprecise and uncertain information is available, so it has been difficult to provide numerically-precise information. MCDM has proven to be a powerful widely-used tool for problems with multiple and often conflicting criteria [16,34]. In this paper, fuzzy AHP is used to determine the sustainability weights for the performance criteria, and fuzzy TOPSIS is applied to rank the sustainable alternatives.

4.1. The Sustainable Framework

A three-phase methodology has been applied to evaluate the criteria and select the sustainable alternatives for the BOPP industry (Figure 3).
Phase 1: Identification of sustainable criteria based on a literature review and expert opinion.
Phase 2: Using a fuzzy AHP approach to prioritize the criteria, develop a decision-support framework for an integrated sustainability evaluation of the BOPP plastic film supply chain in which the economic, environmental and social dimensions are integrated to assist decision makers with incorporating varying sustainability criteria preferences, so as to identify the most sustainable options.
Phase 3: Using a fuzzy TOPSIS method, the alternatives related to the BOPP film industry sustainability assessment are ranked to improve efficiency and effectiveness in the sector.

4.2. Sustainability Criteria Identification

Sustainable supply chain management is one of the key measures for the modern management emphasis on sustainable development [22]. TBL theory usually distinguishes three dimensions for supply chain sustainability assessments: economic performance, environmental protection and social responsibility [23,35]. Inspired by previous research and expert opinion, the suggested model here has fourteen criteria across the three dimensions, with five each for the economic and social dimensions and four for the environmental dimension, as shown in Figure 4.

4.2.1. Economic Dimension

Although there have been many tools developed to assess SCM practices, the five metrics of the supply chain operations reference model (SCOR) have often been used to evaluate economic performance [20,22,23,56]. Approximately 800 companies around the world have verified the model’s reference value [23,56]. As economic performance is a measure of the success of business activities, it can severely impact the BOPP supply chain. Research on SC economic performance measurements has usually included five indicators: reliability, responsiveness, flexibility, financial performance and quality [22,23,56].
Reliability refers to the delivery performance in the plastic film supply chain; that is, putting the correct product in the correct place at the correct time in the correct condition and with the correct quality packaging and the correct documentation to the correct customer [56,57].
Supply chain responsiveness is defined as the speed at which the plastic film supply chain supplies products to the customer [56]. From the perspective of the BOPP film supply chain, responsiveness refers to the efficiency of material flows, information flows and financial flows from the point-of-origin to the point-of-consumption [31].
Flexibility is the ability of the supply chain to respond to marketplace changes or to gain or maintain competitive advantage [56]. In the study, flexibility means that the BOPP plastic film supply chain must constantly evolve and improve as times and conditions change [57].
Financial performance is a broad term that includes the costs and asset management in SCM, such as design costs, purchase costs, source costs, production costs, delivery costs, return costs, supply chain costs, cost variances from expected, standard or contracted costs and complementary assets, as well as return on investment [23,36,39,56,57].
Quality is an important aspect of the client-vendor relationship [23,39,56]. Inferior quality affects the focal company’s financial performance, as well as its reputation [39]. In the BOPP film industry, quality is measured as product quality and service quality.

4.2.2. Environmental Dimension

Environmental assessment judges the environmental consciousness of the supply chain [39]; however, there is no consensus as to what the environmental and social performances should be, as this depends on the industrial sector and the region or the country in which the operations are located [22]. Several international standards, such as the OECD guidelines (Organization for Economic Co-operation and Development) [58], ISO 26000 [59], ISO 14001 [60], SA 8000 (Social Accountability 8000 International Standard) [61], GRI (Global Reporting Initiative) [62], the SCOR reference model [56] and scientific works, have proposed more or less generic criteria that could be adapted, but these standards do not encompass all sustainable development fields. In this paper, four environmental fields in the BOPP film supply chain management are isolated: energy consumption, carbon emissions, waste management and environmental management systems (EMS).
Energy consumption is one of the most used indicators in the environmental dimension [1,20,21,25]. In the BOPP film industry, energy consumption usually refers to the electricity, natural gas and energy sources used in the production and the distribution stages.
As climate change has now been recognized as a serious concern for modern society [17,28], carbon emissions’ reduction has become an urgent global issue in the last decade to mitigate climate change [27,33,37,42]. In the BOPP film industry, there are concerns about greenhouse gas emissions from the production and logistics stages.
Waste management is often representative of industrial development [21,31]. In the BOPP film industry, waste management usually refers to product abandonment in landfills, product recycling into raw materials and product reuse, returns or re-manufacturing for further consumption [17].
The environmental management system is a practical decision-support tool designed to assist organizations achieve better environmental performance, ensure continual improvements and prevent adverse environmental impacts [32,60]. In the BOPP plastic film industry, the EMS includes aspects such as the establishment of an environmental budget, environmental certification, environmental compliance and environmental evaluations [23].

4.2.3. Social Dimension

Social responsibility is a global indicator used to assess a company’s social performance. It assesses the social consequences of the company’s activity on its stakeholders [23]. Sustainable operations need a sustainable workforce and community. A socially-responsible supply chain attempts to improve the community within which it operates and ensures wellbeing for its employees and customers [39]. In this paper, we measure this dimension across five criteria: employment, health and safety, work conditions, societal commitment and customer issues.
Employment (or job creation and wealth) is the most important social criteria [37,62]. Companies seek to improve standards of living by providing full and stable employment [22,23,36]. The number of positions created in the supply chain and total employee turnover are used as social indicators in this study.
Health and safety evaluate the impact of a practice or product on employee and customer health and safety [23,31,36]. The aim is to promote and maintain the highest degree of physical, mental and social wellbeing for employees and customers to prevent occupational accidents and to ensure customers are not harmed by poor quality products.
Working conditions encompass many areas related to employee satisfaction; salaries and other compensation, work time, rest periods, vacations, human resource development, disciplinary practices, dismissals and maternity issues [23,37,62].
Societal commitment refers to the social responsibility the company shows towards the local community and stakeholders [39] and encompasses improvements in education, culture, healthcare and technological development, as well as contributions to societal investment [23,36,58].
Customer issues refer to all issues that individually affect each customer [31]. They are mainly focused on consumer healthcare and security, the protection of customer data and privacy, the provision of marketing and information to consumers and the offer of other essential services [23,36,58,59].

4.3. Methodology

To achieve the aim of this research, a fuzzy AHP-TOPSIS was used to first determine the relative priority of the BOPP sustainability evaluation criteria and then rank the sustainable alternatives for the BOPP film industry. In plastic film supply chain management, as decision making problems are generally vague and uncertain, fuzzy set theory can be used [34]. The sustainability dimensions and sub-criteria system have a hierarchical structure, meaning that both the importance weights for the dimensions and the sub-criteria can be determined using the AHP method [46,53]. As the expert preferences are described using linguistic judgments or variables, fuzzy set theory can be applied to address the inherent uncertainty in the preferences. Therefore, a FAHP method that integrates the AHP method and fuzzy sets is selected here to determine the criteria weights.
TOPSIS is another MCDM method, which is based on the chosen alternative being closest to the positive ideal solution and farthest from the negative ideal solution [47,52,53]. In the classical TOPSIS approach, personal judgments are represented using crisp values; in reality, however, measurements using crisp values are not always possible. A better approach may be linguistic values rather than crisp values, for which fuzzy set theory can be used. For this reason, the fuzzy TOPSIS method is suitable for solving real-life application problems under a fuzzy environment [51,53]. Using this technique, the options are evaluated with respect to a set of criteria as the linguistic experts’ opinions are subjective, vague and imprecise in nature [54]. Therefore, fuzzy TOPSIS is suitable for the BOPP plastic film assessment, which is used to rank the sustainable alternatives. Details of this fuzzy AHP-TOPSIS technique are given in the subsequent subsection.

4.3.1. Fuzzy AHP

AHP is a quantitative technique introduced by Satty [63] that gives structure to multi-criteria decision making solutions. Fuzzy AHP methods combine AHP with fuzzy set theory to solve hierarchical fuzzy problems and are able to handle linguistic variables to include expert uncertain imprecise judgments. Recently, fuzzy AHP has been widely used to solve multi-criteria decision problems in other fields, such as human resource management, supplier selection and performance evaluation [48,49,52]. For the sustainable assessment in this paper, a proposed fuzzy AHP approach was developed as outlined below.
(1)
Construct the criteria system and the hierarchical model. The dimensions and criteria were used to establish the criteria system, from which the AHP hierarchical model was structured.
(2)
Apply the fuzzy concepts. As decision making is very difficult in vague and uncertain environments, fuzzy set theory was used to handle this information.
(3)
Develop a fuzzy pairwise comparison matrix. The fuzzy scales of relative importance are given in Table 4.
(4)
Analyze the importance weights of the indicators. To determine the indicator importance weights, the fuzzy assessment matrix was analyzed and the entries converted into crisp values. However, for this operation, some appropriate calculation procedures were required. The details of the fuzzy set and the essential calculations for the extent analysis method are given in [51,63].

4.3.2. Fuzzy TOPSIS

TOPSIS is based on the concept that the chosen alternative should be closest to the positive ideal solution (PIS) and furthest from the negative ideal solution (NIS). Fuzzy set theory can be used to present linguistic values. Therefore, the fuzzy TOPSIS method is suitable for solving real-life application problems under a fuzzy environment [47].
The details of the essential calculations for the fuzzy TOPSIS extent analysis method are as described by Chen et al. [47,51].

5. Application Example

Based on the hybrid framework presented above, we give an example in this section for the evaluation and selection of sustainable supply chain performances in one of the largest and the most competitive BOPP plastic film companies in western China. The company is located in Sichuan Province, a province that has significant room for future BOPP development. The company products fall into two main categories: flat film and cigarette packaging film. Flat film is usually used for food, beverage and other packaging and accounts for 69% of the total income. Cigarette film is mainly supplied to tobacco factories and accounts for 31% of company income, but is the most profitable product. In recent years, due to pressure from customers, the government, non-government organizations (NGOs) and the increasingly intense global competition [12,22,23,31], sustainable development has been playing an increasingly important role in the BOPP plastic film supply chain. Faced with issues such as imbalanced supply and demand, irrational structures, unbalanced regional development, environmental protection and social wellbeing, the company needed a solid strategic approach to fully understand the criteria and the alternatives to achieve a sustainable effective BOPP supply chain in China. For this reason, this paper developed a decision-support framework to evaluate sustainability in the BOPP supply chain in a Chinese context, which could assist in both identifying and prioritizing the sustainability criteria and alternatives associated with the BOPP industry and improve efficiency and effectiveness through an integrated consideration of the economic, environmental and social dimensions.

5.1. Identification of Sustainable Performances and Feasible SCM Alternatives

In the first phase, to analyze the problem, a decision group of twelve experts was formed. There were two senior managers, three academicians, three senior SC member executives, two environment and forest ministry members and two customers. All experts were highly skilled in their respective domains and were proficient in decision making. In this study, fourteen sustainability performance sub-criteria based on the TBL approach were identified from the literature review and intensive discussions with the decision group members.
A four-level decision hierarchical structure was used in this research. Sustainable performance assessment was the objective on the first hierarchical level; the triple bottom line made up of the economic, environmental and social dimensions was on the second level; the fourteen sub-criteria were on the third level; and the sustainable alternatives were on the fourth level (Figure 4).

5.2. Determining Sustainable Performance Weights Using Fuzzy AHP

In this step, using linguistic variables, the expert panel was asked to make pairwise comparisons for the three TBL dimensions and the fourteen criteria using Table 4. The synthetic pairwise comparison matrix elements were then calculated using the geometric mean method:
a ˜ i j = ( a ˜ i j 1 a ˜ i j 2 a ˜ i j 12 ) , for dimension a ˜ 12 as an example:
a ˜ 12 = ( ( 2 , 3 , 4 ) ( 5 , 7 , 9 ) ( 1 , 1 , 1 ) ) 1 12 = ( ( 2 5 1 ) 1 12 , ( 3 7 1 ) 1 12 , ( 4 9 1 ) 1 12 ) = ( 2 . 6321 , 3 . 3133 , 3 . 9785 )
Other matrix elements were determined using the same calculation process, from which the synthetic pairwise comparison matrix of the dimensions was developed, as shown in Table 5.
(1)
To compute the fuzzy dimension weights, the calculation processes were as follows:
r ˜ 1 = ( a ˜ 11 a ˜ 12 a ˜ 13 ) 1 3 = ( ( 1 2 . 6321 2 . 3324 ) 1 3 , ( 1 3 . 3133 2 . 9299 ) 1 3 , ( 1 3 . 9785 3 . 5940 ) 1 3 ) = ( 1 . 8311 , 2 . 1332 , 2 . 4272 )
Similarly, the remaining r ˜ i for the other dimensions were calculated:
r ˜ 2 = ( 0 . 6971 , 0 . 8227 , 0 . 9714 ) r ˜ 3 = ( 0 . 4684 , 0 . 5361 , 0 . 6320 )
The weight of each dimension was obtained using w ˜ i = r ˜ i / i = 1 n r ˜ i as follows:
w ˜ 1 = ( 0 . 6111 , 0 . 6109 , 0 . 6022 ) w ˜ 2 = ( 0 . 2326 , 0 . 2356 , 0 . 2410 ) w ˜ 3 = ( 0 . 1563 , 0 . 1535 , 0 . 1568 )
(2)
The fuzzy mean and spread method was adopted to defuzzify and rank the fuzzy numbers:
M S w ˜ i = ( l w i + m w i + u w i ) / 3 M S w ˜ 1 = 0 . 6081 M S w ˜ 2 = 0 . 2364 M S w ˜ 3 = 0 . 1555
Using the same method, the fuzzy comparison matrices for the economic, environmental and social criteria were determined, as shown in Table 6, Table 7 and Table 8.
The results obtained from the calculation based on the pairwise comparison matrices provided in Table 5, Table 6, Table 7 and Table 8 are presented in Table 9.
The CR (Consistency Ratio) values for all matrices were less than 0.1; therefore, these matrices were consistent. Quality was found to be of the highest importance in the order, followed by financial assets.

5.3. Ranking Alternatives Using Fuzzy TOPSIS

It was assumed that all experts were of the same importance. The expert group was asked to establish a fuzzy evaluation matrix using the linguistic terms shown in Table 10. Alternatives A1, A2, A3, A4 and A5 were solutions given by the Board of Directors office of the focal plastic film company. The five alternatives were different because of the different numbers of upstream and downstream enterprises. In this paper, we only considered a three-echelon supply chain, which included suppliers, the focal company and the clients.
The fuzzy decision matrix for the alternatives was determined using x ˜ i j = 1 12 ( x ˜ i j 1 x ˜ i j 2 x ˜ i j 12 ) in Table 11. Using R ˜ = [ r ˜ i j ] m × n , the fuzzy-decision matrix was normalized, as shown in Table 12. The fuzzy weighted normalized decision matrix was determined using V ˜ = [ v ˜ i j ] m × n , i = 1 , 2 , , m , j = 1 , 2 , , n in Table 13. The final evaluation and ranking of alternatives were then determined by d i * = d ( v ˜ i j , v ˜ j * ) , i = 1 , 2 , , 5 , j = 1 , 2 , , 14 , d i = d ( v ˜ i j , v ˜ j ) , i = 1 , 2 , , 5 , j = 1 , 2 , , 14 , and C C i = d i d i * + d i , i = 1 , 2 , , 5 , as shown in Table 14.

5.4. Results and Discussions

From the literature review, it was found that most plastic film assessments only considered one sustainability dimension [1,3,24,25,26]; few considered two dimensions [27,28,29]; and very few considered three dimensions [30]. Academic and corporate interest in sustainable supply chain management has risen considerably in recent years [16]. In this paper, the triple bottom line approach (economic benefit, environmental protect and social responsibility) was employed to assess the plastic film supply chain.
In the plastic film industry, the main method used has been life cycle assessment, which is usually focused on the environmental dimension [1,25,29]. However, a multi-criteria decision making method is more suitable for the sustainability assessment of multi-dimensional problems [12,32,34]. In this paper, a hybrid FAHP-TOPSIS methodology was developed to evaluate the sustainability criteria and to select sustainable alternatives. This paper assessed the sustainability criteria in plastic film supply chain management. Because of the fierce competition and the imbalances in supply and demand, it is very important for this focal plastic film company in China to develop sustainability evaluation systems.
Plastic film assessments have generally focused on the product itself [1,3,29] and have rarely considered evaluation from a supply chain management perspective [30]. With the development of plastic film sustainable supply chain management, increasingly more companies are focusing on sustainable assessment from the perspective of supply chain management [12,16,32]. In this paper, the criteria and selected alternatives were assessed from a plastic film supply chain management perspective.
Few plastic film supply chain sustainability indicator systems have concurrently considered the economic, environmental and social dimensions [12,16,30]. However, conventional indicators are insufficient when seeking to assess the performance of sustainable supply chains, as they predominantly focus on environmental issues and mainly emphasize the product itself [1,3,32]. In this paper, we identified fourteen indicators suitable for the plastic film industry, which can provide theoretical meaning and practical value for theoretical research and company operations.
As shown in Table 5, the priority of rankings for the sustainability assessment criteria dimensions for BOPP industry supply chain management was economic-environmental-social. The economic dimension was 0.6081 and was ranked first; the environmental dimension was 0.2364 and was ranked second; and the social dimension was 0.1555, so was ranked third. Markman and Krause (2016) believed that the environment should be given first priority, with society second and the economic dimension third [64]. Luthra et al. (2015) believed that the environmental dimension should also be the first priority, but placed the economic second and the social dimension third [65]. The conclusion here, therefore, differs from the conclusions reached in these recent studies. Struggling firms are unable to prioritize environmental sustainability ahead of societal and economic sustainability [64]. The BOPP industry in China is faced with overcapacity, and there is an imbalance between supply and demand. Enterprises that have operating difficulties either close down or phase out a production line, with some facing bankruptcy and others reorganizing their companies to ensure continued survival. Therefore, as the focal company is also facing intense competition to survive and develop, they need to place greater attention on the economic dimension. The second reason that the environment is not considered the first priority is that the BOPP film raw material is polypropylene, which is an environmentally-friendly material, so it has little negative impact on the environment. The priority for the specific indicators within the respective dimensions is given in Table 9. The research findings were discussed with the expert group to gain a better understanding of the contemporary issues associated with the BOPP supply chain management in a Chinese context, which could improve chain effectiveness and sustainability.
The “economic dimension (Eco)” was first in the order and consequently had the highest priority in reference to the other criteria dimensions. Ther were five specific criteria in this dimension, as shown in Table 6, Eco5>Eco4>Eco1>Eco3>Eco2; which had the following respective weights; Quality (0.3395)>Financial performance (0.2773)>Reliability (0.2379)>Flexibility (0.1250)>Responsiveness (0.0203). Of these, ‘Quality (Eco5)’ had the highest priority. Economic problems are related to a product’s life span, one of the most important features of which is the unique product function. Therefore, decision makers need to logically consider quality issues. ‘Financial performance (Eco4)’ was ranked second after ‘Quality’, meaning that effective financial management was seen as relatively important for economic development and improvements in living standards. ‘Reliability (Eco1)’ was ranked third. In a BOPP film supply chain, products, forecasts, inventories and customer service should be reliable. The fourth ranked criterion was ‘Flexibility (Eco3)’ with ‘Responsiveness (Eco2)’ ranked last in the list. As international and national market BOPP industry demands fluctuate over time, a company needs to be responsive to these market changes by adjusting current products or developing new products.
The “environmental dimension (Env)” was found to be the second most important indicator of the three dimensions, indicating the significance of improving the environmental sustainability of the BOPP supply chain. This particular dimension had four specific indicators. As shown in Table 7, the associated environmental criteria were ranked Env1>Env2>Env3>Env4, indicating that the Energy consumption(0.4709)>Carbon emissions (0.2169)>Waste management (0.1703)>Environmental management system(0.1419). The ‘Energy consumption (Env)’ criterion was of the greatest importance, followed by ‘Carbon emissions (Env2)’. This ordering implied that decision makers need to prioritize energy conservation and emissions reductions in the first place in the environmental dimension of supply chain operations. As the BOPP production process requires that the raw material be heated, the company consumes a great deal of electricity and natural gas. Further, because of seasonal temperature differences, power consumption in winter is more than twice that in summer. If there is a decrease in power consumption, there is a commensurate decrease in carbon emissions and pollution. The third ranked criterion in this dimension was ‘Waste management (Env3)’. Fortunately, BOPP film can be easily recycled and reprocessed into products for many different applications, and when incinerated, only carbon dioxide and water vapor are produced, with no pollution. When used in landfill sites, plastic waste has the positive benefit of stabilizing the ground without producing unpleasant or harmful byproducts. ‘Environmental management system (Env4)’ was the last ranked in the environmental management priority sequence.
The “social dimension (Soc)” was placed last in the priority list. There were five specific criteria in this particular dimension. As shown in Table 8, the order of the related criteria was Soc1>Soc2>Soc3>Soc5>Soc4, with the following weights; Employment (0.3694)>Health and safety (0.2864)>Working conditions (0.1599)>Customer issues (0.1024)>Societal commitment(0.0819). ‘Employment (Soc1)’ was ranked first under this dimension as in a developing country such as China, the most important corporate social responsibility has been recognized as the promotion of employment. ‘Health and safety (Soc2)’ was ranked second, primarily because in the BOPP supply chain, health and security are very important for both employees and customers. The ‘Working conditions (Soc3)’ criterion was ranked third, indicating the increasing attention stakeholders are paying to the work environment and employee living standards. ‘Customer issues (Soc5)’ was the fourth ranked criterion, and the final place of importance was the ‘Societal commitment (Soc4)’ criterion.
An overall ranking of all criteria was also determined by assigning global weights. The ranking was identified as Eco5>Eco4>Eco1>Env1>Eco3>Soc1>Env2>Soc2>Env3>Env4>Soc3>Soc5>Soc4>Eco2, as shown in Table 9. According to the FAHP analysis, Quality (Eco5), Financial performance (Eco4), Reliability (Eco1), Energy consumption (Env1) and Flexibility (Eco3) were the top five most important sustainability criteria in the BOPP supply chain with respective values of 0.2064, 0.1686, 0.1447, 0.1113, and 0.0760. Responsiveness (Eco2), Societal commitment (Soc4) and Customer issues (Soc5) were the least important criteria with respective values of 0.0123, 0.0127 and 0.0159. As shown in Table 14, the SCM alternatives from most important to least were A1>A2>A5>A3>A4. Therefore, A1 with a value of 0.0950 was the best solution for the BOPP focal company, and A4 with a value 0.0512 was the least significant solution for the situation.
In our case study, the selection of the alternatives was only a preliminary recommendation, as the final solution needs to be further discussed by the Board of Directors.

6. Conclusions

In this paper, the current status of the Chinese BOPP plastic film industry was discussed. We presented a framework to characterize the sustainable performance of the BOPP plastic film industry from a supply chain management perspective. Despite the growing interest in evaluating sustainable performance in business and management, there have been few effective approaches that have concurrently adopted the three sustainability dimensions for plastic film supply chain management. From a comprehensive literature review and expert opinion, a hybrid fuzzy multi-criteria decision making method was designed that linked the sustainability criteria and alternatives to plastic film supply chain management. To illustrate our approach, a real BOPP plastic film industry case study in Sichuan was presented. The results from the study provide a new insight for plastic film supply chain management. The contributions of this study are as follows:
(1)
A sustainability indicator system was developed for plastic film supply chain management that concurrently considered the economic, environmental and social dimensions. The indicators were specifically identified for the BOPP plastic film industry, so could provide theoretical and practical value for similar studies in the future.
(2)
A fuzzy multi-criteria decision making framework was proposed to evaluate and select the optimal solution for the plastic film supply chain. Fuzzy AHP was used to prioritize the criteria, and fuzzy TOPSIS was applied to rank the sustainable alternatives. The results in this paper indicated that the method was effective and efficient.
(3)
The proposed method was applied to a real BOPP plastic film company case study in Chengdu. Results from this model could provide decision support for policy makers seeking to balance BOPP supply and demand, adjust industry structure and promote regional sustainable eco-environmental development in China.
The developed framework could assist BOPP plastic film companies identify the criteria and solutions so as to realize sustainable supply chain management. In further research, different multi-criteria decision making models could be applied to the same problem and the results compared. There is also value in extending the research reported in this paper to other industries in China and beyond.

Acknowledgments

This work was supported by the National Natural Science Foundation of China under the Grant No. 71301110 and 71671118, the Humanities and Social Sciences Foundation of the Ministry of Education (No. 13XJC630015), the Research Fund for the Doctoral Program of Higher Education of China (No. 20130181120059) and also supported by the Fundamental Research Funds for the Central Universities (No. skqy201525).

Author Contributions

All authors contributed substantially to the research presented in this paper. Jiuping Xu, Xianglan Jiang and Zhibin Wu conceived and designed the research and methodology. Jiuping Xu contributed the research idea. Zhibin Wu proposed framework of the paper. Xianglan Jiang analyzed the data and wrote the paper. All authors read and approved the final manuscript.

Conflicts of Interest

The authors declare no conflict of interest.

References

  1. Barlow, C.Y.; Morgan, D.C. Polymer film packaging for food: An environmental assessment. Resour. Conserv. Recycl. 2013, 78, 74–80. [Google Scholar] [CrossRef]
  2. Battini, D.; Calzavara, M.; Persona, A.; Sgarbossa, F. Sustainable Packaging Development for Fresh Food Supply Chains. Packag. Technol. Sci. 2016, 29, 25–43. [Google Scholar] [CrossRef]
  3. Toniolo, S.; Mazzi, A.; Niero, M.; Zuliani, F.; Scipioni, A. Comparative LCA to evaluate how much recycling is environmentally favourable for food packaging. Resour. Conserv. Recycl. 2013, 77, 61–68. [Google Scholar] [CrossRef]
  4. Plastic Europe. Plastics—The Facts 2012. An Analysis of European Plastics Production, Demand and Waste Data for 2011; Plastic Europe: Brussels, Belgium, 2012. [Google Scholar]
  5. Jiang, M.; Lin, S.; Jiang, W.; Pan, N. Hot embossing holographic images in BOPP shrink films through large-area roll-to-roll nanoimprint lithography. Appl. Surf. Sci. 2014, 311, 101–106. [Google Scholar] [CrossRef]
  6. Rhim, J.W.; Park, H.M.; Ha, C.S. Bio-nanocomposites for food packaging applications. Prog. Polym. Sci. 2013, 38, 1629–1652. [Google Scholar] [CrossRef]
  7. Cozzolino, C.A.; Campanella, G.; Türe, H.; Olsson, R.T.; Farris, S. Microfibrillated cellulose and borax as mechanical, O 2-barrier, and surface-modulating agents of pullulan biocomposite coatings on BOPP. Carbohydr. Polym. 2016, 143, 179–187. [Google Scholar] [CrossRef] [PubMed]
  8. Ho, J.; Jow, T.R. High field conduction in biaxially oriented polypropylene at elevated temperature. IEEE Trans. Dielectr. Electr. Insul. 2012, 19, 990–995. [Google Scholar]
  9. Tortai, J.; Denat, A.; Bonifaci, N. Self-healing of capacitors with metallized film technology: Experimental observations and theoretical model. J. Electrost. 2001, 53, 159–169. [Google Scholar] [CrossRef]
  10. Chang, P.C.; Hsieh, J.C.; Wang, Y.W. Genetic algorithms applied in BOPP film scheduling problems: Minimizing total absolute deviation and setup times. Appl. Soft Comput. 2003, 3, 139–148. [Google Scholar] [CrossRef]
  11. Bruntland, G.H. Report of the World Commission on Environment and Development: Our Common Future. Available online: http://www.un-documents.net/wced-ocf.htm (accessed on 28 August 2016).
  12. Seuring, S. A review of modeling approaches for sustainable supply chain management. Decis. Support Syst. 2013, 54, 1513–1520. [Google Scholar] [CrossRef]
  13. Ageron, B.; Gunasekaran, A.; Spalanzani, A. Sustainable supply management: An empirical study. Int. J. Prod. Econ. 2012, 140, 168–182. [Google Scholar] [CrossRef]
  14. Elkington, J. Cannibals with Forks: The Triple Bottom Line of 21st Century; Capstone Publishing Ltd.: Oxford, UK, 1997. [Google Scholar]
  15. Björnberg, K.E.; Jonas, E.; Marstorp, H.; Tidåker, P. The Role of Biotechnology in Sustainable Agriculture: Views and Perceptions among Key Actors in the Swedish Food Supply Chain. Sustainability 2015, 7, 7512–7529. [Google Scholar] [CrossRef]
  16. Seuring, S.; Müller, M. From a literature review to a conceptual framework for sustainable supply chain management. J. Clean. Prod. 2008, 16, 1699–1710. [Google Scholar] [CrossRef]
  17. Hassini, E.; Surti, C.; Searcy, C. A literature review and a case study of sustainable supply chains with a focus on metrics. Int. J. Prod. Econ. 2012, 140, 69–82. [Google Scholar] [CrossRef]
  18. O’Rourke, D. The science of sustainable supply chains. Science 2014, 344, 1124–1127. [Google Scholar] [CrossRef] [PubMed]
  19. Glaser, G. Policy: Base sustainable development goals on science. Nature 2012, 491, 35–35. [Google Scholar] [CrossRef] [PubMed]
  20. Schöggl, J.P.; Fritz, M.M.; Baumgartner, R.J. Toward supply chain-wide sustainability assessment: A conceptual framework and an aggregation method to assess supply chain performance. J. Clean. Prod. 2016, 131, 822–835. [Google Scholar] [CrossRef]
  21. Varsei, M.; Soosay, C.; Fahimnia, B.; Sarkis, J. Framing sustainability performance of supply chains with multidimensional indicators. Supply Chain Manag. 2014, 19, 242–257. [Google Scholar] [CrossRef]
  22. Boukherroub, T.; Ruiz, A.; Guinet, A.; Fondrevelle, J. An integrated approach for sustainable supply chain planning. Comput. Oper. Res. 2015, 54, 180–194. [Google Scholar] [CrossRef]
  23. Chardine-Baumann, E.; Botta-Genoulaz, V. A framework for sustainable performance assessment of supply chain management practices. Comput. Ind. Eng. 2014, 76, 138–147. [Google Scholar] [CrossRef]
  24. Martinho, G.; Pires, A.; Portela, G.; Fonseca, M. Factors affecting consumers’choices concerning sustainable packaging during product purchase and recycling. Resour. Conserv. Recycl. 2015, 103, 58–68. [Google Scholar] [CrossRef]
  25. Siracusa, V.; Ingrao, C.; Giudice, A.L.; Mbohwa, C.; Dalla Rosa, M. Environmental assessment of a multilayer polymer bag for food packaging and preservation: An LCA approach. Food Res. Int. 2014, 62, 151–161. [Google Scholar] [CrossRef]
  26. Leceta, I.; Etxabide, A.; Cabezudo, S.; de La Caba, K.; Guerrero, P. Bio-based films prepared with by-products and wastes: Environmental assessment. J. Clean. Prod. 2014, 64, 218–227. [Google Scholar] [CrossRef]
  27. Pålsson, H.; Finnsgård, C.; Wänström, C. Selection of packaging systems in supply chains from a sustainability perspective: The case of Volvo. Packag. Technol. Sci. 2013, 26, 289–310. [Google Scholar] [CrossRef]
  28. Grönman, K.; Soukka, R.; Järvi-Kääriäinen, T.; Katajajuuri, J.M.; Kuisma, M.; Koivupuro, H.K.; Ollila, M.; Pitkänen, M.; Miettinen, O.; Silvenius, F.; et al. Framework for sustainable food packaging design. Packag. Technol. Sci. 2013, 26, 187–200. [Google Scholar] [CrossRef]
  29. Pires, A.; Martinho, G.; Ribeiro, R.; Mota, M.; Teixeira, L. Extended producer responsibility: A differential fee model for promoting sustainable packaging. J. Clean. Prod. 2015, 108, 343–353. [Google Scholar] [CrossRef]
  30. Zailani, S.; Shaharudin, M.R.; Govindasamy, V.; Ismail, M.; Mahdzar, S.F.A.S. The eco-efficiency practices of the sustainable packaging and its effect towards sustainable supply chain performance. In Proceedings of the 2015 International Symposium on Technology Management and Emerging Technologies (ISTMET), Kedah, Malaysia, 25–27 August 2015; pp. 448–453.
  31. Eskandarpour, M.; Dejax, P.; Miemczyk, J.; Péton, O. Sustainable supply chain network design: An optimization-oriented review. Omega 2015, 54, 11–32. [Google Scholar] [CrossRef] [Green Version]
  32. Beske-Janssen, P.; Johnson, M.P.; Schaltegger, S. 20 years of performance measurement in sustainable supply chain management–what has been achieved? Supply Chain Manag. 2015, 20, 664–680. [Google Scholar] [CrossRef]
  33. Varsei, M.; Polyakovskiy, S. Sustainable supply chain network design: A case of the wine industry in Australia. Omega 2016. [Google Scholar] [CrossRef]
  34. Mardani, A.; Jusoh, A.; Zavadskas, E.K. Fuzzy multiple criteria decision-making techniques and applications—Two decades review from 1994 to 2014. Expert Syst. Appl. 2015, 42, 4126–4148. [Google Scholar] [CrossRef]
  35. Linton, J.D.; Klassen, R.; Jayaraman, V. Sustainable supply chains: An introduction. J. Oper. Manag. 2007, 25, 1075–1082. [Google Scholar] [CrossRef]
  36. Matos, S.; Hall, J. Integrating sustainable development in the supply chain: The case of life cycle assessment in oil and gas and agricultural biotechnology. J. Oper. Manag. 2007, 25, 1083–1102. [Google Scholar] [CrossRef]
  37. Chaabane, A.; Ramudhin, A.; Paquet, M. Design of sustainable supply chains under the emission trading scheme. Int. J. Prod. Econ. 2012, 135, 37–49. [Google Scholar] [CrossRef]
  38. Sardar, S.; Lee, Y.H.; Memon, M.S. A Sustainable Outsourcing Strategy Regarding Cost, Capacity Flexibility, and Risk in a Textile Supply Chain. Sustainability 2016, 8, 234. [Google Scholar] [CrossRef]
  39. Sarkis, J.; Dhavale, D.G. Supplier selection for sustainable operations: A triple-bottom-line approach using a Bayesian framework. Int. J. Prod. Econ. 2015, 166, 177–191. [Google Scholar] [CrossRef]
  40. Gopal, P.R.C.; Thakkar, J. Sustainable supply chain practices: An empirical investigation on Indian automobile industry. Prod. Plan. Control 2016, 27, 49–64. [Google Scholar] [CrossRef]
  41. Shen, B. Sustainable fashion supply chain: Lessons from H&M. Sustainability 2014, 6, 6236–6249. [Google Scholar]
  42. You, F.; Tao, L.; Graziano, D.J.; Snyder, S.W. Optimal design of sustainable cellulosic biofuel supply chains: multiobjective optimization coupled with life cycle assessment and input-output analysis. AIChE J. 2012, 58, 1157–1180. [Google Scholar] [CrossRef]
  43. Yusuf, Y.Y.; Gunasekaran, A.; Musa, A.; El-Berishy, N.M.; Abubakar, T.; Ambursa, H.M. The UK oil and gas supply chains: An empirical analysis of adoption of sustainable measures and performance outcomes. Int. J. Prod. Econ. 2013, 146, 501–514. [Google Scholar] [CrossRef]
  44. Berning, A.; Venter, C. Sustainable supply chain engagement in a retail environment. Sustainability 2015, 7, 6246–6263. [Google Scholar] [CrossRef] [Green Version]
  45. Balfaqiha, H.; Nopiaha, Z.M.; Saibania, N.; Al-Noryb, M.T. Review of supply chain performance measurement systems: 1998–2015. Comput. Ind. 2016, 85, 135–150. [Google Scholar] [CrossRef]
  46. Abdullah, L.; Zulkifli, N. Integration of fuzzy AHP and interval type-2 fuzzy DEMATEL: An application to human resource management. Expert Syst. Appl. 2015, 42, 4397–4409. [Google Scholar] [CrossRef]
  47. Chen, C.T. Extensions of the TOPSIS for group decision-making under fuzzy environment. Fuzzy Sets Syst. 2000, 114, 1–9. [Google Scholar] [CrossRef]
  48. Ng, C. Evidential reasoning-based Fuzzy AHP approach for the evaluation of design alternatives’ environmental performances. Appl. Soft Comput. 2016, 46, 381–397. [Google Scholar] [CrossRef]
  49. Kilincci, O.; Onal, S.A. Fuzzy AHP approach for supplier selection in a washing machine company. Expert Syst. Appl. 2011, 38, 9656–9664. [Google Scholar] [CrossRef]
  50. Chen, J.F.; Hsieh, H.N.; Do, Q.H. Evaluating teaching performance based on fuzzy AHP and comprehensive evaluation approach. Appl. Soft Comput. 2015, 28, 100–108. [Google Scholar] [CrossRef]
  51. Patil, S.K.; Kant, R. A fuzzy AHP-TOPSIS framework for ranking the solutions of Knowledge Management adoption in Supply Chain to overcome its barriers. Expert Syst. Appl. 2014, 41, 679–693. [Google Scholar] [CrossRef]
  52. Cavallaro, F.; Zavadskas, E.K.; Raslanas, S. Evaluation of Combined Heat and Power (CHP) Systems Using Fuzzy Shannon Entropy and Fuzzy TOPSIS. Sustainability 2016, 8, 556. [Google Scholar] [CrossRef]
  53. Zyoud, S.H.; Kaufmann, L.G.; Shaheen, H.; Samhan, S.; Fuchs-Hanusch, D. A framework for water loss management in developing countries under fuzzy environment: Integration of Fuzzy AHP with Fuzzy TOPSIS. Expert Syst. Appl. 2016, 61, 86–105. [Google Scholar] [CrossRef]
  54. Lima-Junior, F.R.; Carpinetti, L.C.R. Combining SCOR® model and fuzzy TOPSIS for supplier evaluation and management. Int. J. Prod. Econ. 2016, 174, 128–141. [Google Scholar] [CrossRef]
  55. Kusi-Sarpong, S.; Bai, C.; Sarkis, J.; Wang, X. Green supply chain practices evaluation in the mining industry using a joint rough sets and fuzzy TOPSIS methodology. Resour. Policy 2015, 46, 86–100. [Google Scholar] [CrossRef]
  56. Supply Chain Operations Reference Model: Overview of SCOR Version. Available online: http://www.supplychainchannel.org/HigherLogic/System/DownloadDocumentFile.ashx?DocumentFileKey=117df 97d-b32d-439e-9e8d-ce735309cc48 (accessed on 28 August 2016).
  57. Gunasekaran, A.; Patel, C.; Tirtiroglu, E. Performance measures and metrics in a supply chain environment. Int. J. Oper. Prod. Manag. 2001, 21, 71–87. [Google Scholar] [CrossRef]
  58. Gordon, K.; Mitidieri, C. Multilateral Influences on the OECD Guidelines for Multinational Enterprises; OECD Publishing: Paris, France, 2005. [Google Scholar]
  59. International Organization for Standardization (ISO). Guidance on Social Responsibility; ISO: Geneva, Switzerland, 2010. [Google Scholar]
  60. Curkovic, S.; Sroufe, R. Using ISO 14001 to promote a sustainable supply chain strategy. Bus. Strategy Environ. 2011, 20, 71–93. [Google Scholar] [CrossRef]
  61. Social Accountability International. Social Accountability 8000 International Standard; Social Accountability International: New York, NY, USA, 2014. [Google Scholar]
  62. Initiative, G.R. Sustainability Reporting Guidelines, Version 3.0; Oxford University Press: Oxford, UK, 2006. [Google Scholar]
  63. Satty, T.L. How to make a decision: The analytic hierarchy process. Eur. J. Oper. Res. 1990, 48, 9–26. [Google Scholar] [CrossRef]
  64. Markman, G.D.; Krause, D. Theory building surrounding sustainable supply chain management: Assessing what we know, exploring where to go. J. Supply Chain Manag. 2016, 52, 3–10. [Google Scholar] [CrossRef]
  65. Luthra, S.; Mangla, S.K.; Kharb, R.K. Sustainable assessment in energy planning and management in Indian perspective. Renew. Sustain. Energy Rev. 2015, 47, 58–73. [Google Scholar] [CrossRef]
Figure 1. BOPP consumption structure.
Sustainability 08 01042 g001
Figure 2. BOPP packaging film production distribution area in 2015.
Sustainability 08 01042 g002
Figure 3. Research methodology phases.
Sustainability 08 01042 g003
Figure 4. Hierarchical structure of sustainable performances based on the triple bottom line (TBL) approach.
Sustainability 08 01042 g004
Table 1. Supply chain sustainability dimensions and indicators.
ReferencesTypesDimensionsIndicators
Chaabane et al. (2012) [37]DesignEconomicTotal supply chain cost
EnvironmentalGHG emissions
Eskandarpour et al. (2015) [31]ReviewEnvironmentalGHG emissions, waste, energy use, material recovery, others
SocialWork conditions, societal commitment, customer issues
Boukherroub et al. (2015) [22]PlanningEconomicReliability, responsiveness, flexibility, financial performance, quality
EnvironmentalResources consumption, climate change, pollution, hazardous material
SocialHealth and safety, job creation and wealth, work conditions
Chardine-Baumann and Botta-Genoulaz (2014) [23]AssessmentEconomicReliability, responsiveness, flexibility, financial performance, quality
EnvironmentalEnvironmental management, use of resources, pollution, dangerousness, natural environment
SocialWork conditions, human rights, societal commitment, customers issues, business practices
Sarkis and Dhavale (2015) [39]Supplier selectionEconomicCost variance from expected, standard or contracted cost; quality of the products or services purchased; on-time order deliveries
EnvironmentalSupplier’s energy efficiency; penalties related to environmental violations; use of environmental and pollution control technology
SocialPhilanthropic contributions, responsibility to the community; employee turnover rate
Matos and Hall (2007) [36]AssessmentEconomicOrganizational: complementary assets (access to capital, market, internal expertise, economies of scale), firm competencies, capabilities intellectual, property protection, other appropriability mechanisms
EnvironmentalAir emissions, water discharge quality, energy consumption, water use, waste management, land disturbance and reclamation diversity
SocialJobs created, knowledge enhances/transferred to local communities, health and safety, health and safety of local communities, equal opportunities and diversity, potential negative side effect on or from secondary, stakeholders, stakeholders engagement satisfaction
You et al. (2012) [42]DesignEconomicTotal supply chain cost, biofuel selling incentive and byproduct credit
EnvironmentalTotal annual CO 2 equivalent emissions
SocialAccrued local jobs (full-time equivalent for a year)
Varsei and Polyakovskiy (2016) [33]DesignEconomicTotal supply chain cost
EnvironmentalGHG emissions
SocialUnemployment, regional GDP
Varsei et al. (2014) [21]ReviewEconomicTotal supply chain cost, service level
EnvironmentalGHG emissions, water usage, energy consumption, waste generation, the use of hazardous and toxic substances
SocialLabor practices and decent work, human rights, society, product responsibility
Table 2. Plastic films assessment dimensions and indicators.
ReferencesDimensionsIndicators
Barlow and Morgan (2013) [1]EnvironmentalWaste, energy consumption
Toniolo et al. (2013) [3]EnvironmentalAir and water emissions: climate change, ozone depletion, human toxicity, photochemical oxidant formation, particulate matter formation, ionizing radiation, terrestrial acidification, fresh water eutrophication, marine eutrophication, terrestrial ecotoxicity, freshwater ecotoxicity, agricultural land occupation, urban land occupation, natural land transformation, water depletion, metal depletion, fossil depletion
Grönman et al. (2013) [28]EnvironmentalClimate change, waste amounts, material use
Leceta et al. (2014) [26]EnvironmentalCarcinogens, resp.organics, resp. inorganics, climate change, radiation, ozone layer, ecotoxicity, acidif./eutrophic., land use, minerals, fossil fuels
Siracusa et al. (2014) [25]EnvironmentalCO 2 -emissions and fossil fuel consumption
Pålsson et al. (2013) [27]EconomicTotal supply chain cost
EnvironmentalCO 2 -emissions
Pires et al. (2015) [29]EnvironmentalAbiotic depletion, acidification, eutrophication, global warming, human toxicity, photochemical oxidation, incorporation of recycled material
SocialRecycling bin symbol, recycled material content information, carbon footprint information, trash bin symbol, information absence
Table 3. BOPP production and capacity chart in China (Ttt, ten thousand tonnes).
YearAnnual Production (Ttt)Annual Capacity (Ttt)Annual Production Growth Rate (%)Annual Capacity Growth Rate (%)Capacity Utilization (%)
2004130193 67.36%
200516619527.69%1.04%85.13%
20061692001.81%2.56%84.50%
20071852079.47%3.50%89.37%
20081962325.95%12.08%84.48%
200922126812.76%15.52%82.46%
201025530415.38%13.43%83.88%
20112703615.88%18.75%74.79%
201230839914.07%10.53%77.19%
20133314507.47%12.78%73.56%
201437249311.78%9.33%75.20%
20153855163.49%4.67%74.61%
Table 4. Scale of relative importance used in the pairwise comparison matrix.
Intensity of ImportantLinguistic VariablesMembership Function
1 ˜ Equally important/preferred(1,1,1)
2 ˜ Between 1 and 3(1,2,3)
3 ˜ Weakly important/preferred(2,3,4)
4 ˜ Between 3 and 5(3,4,5)
5 ˜ More important/preferred(4,5,6)
6 ˜ Between 5 and 7(5,6,7)
7 ˜ Significantly more important/preferred(6,7,8)
8 ˜ Between 7 and 9(7,8,9)
9 ˜ The most important/preferred(8,9,10)
Table 5. Fuzzy pairwise comparison matrix of the dimensions.
DimensionEconomicEnvironmentalSocial
Eco(1,1,1)(2.6321,3.3133,3.9785)(2.3324,2.9299,3.5940)
Env(0.2513,0.3018,0.3799)(1,1,1)(1.3480,1.8450,2.4126)
Soc(0.2340,0.2842,0.3605)(0.4391,0.5420,0.7002)(1,1,1)
Weight(0.6111,0.6109,0.6022)(0.2326,0.2356,0.2410)(0.1563,0.1535,0.1568)
MSw0.60810.23640.1555
Table 6. Fuzzy pairwise comparison matrix for the economic criteria.
Eco1Eco2Eco3Eco4Eco5
Eco1(1,1,1)(2.2134,2.9658,2.9658)(1.8942,2.4521,3.1665)(0.9902,1.2165,1.5131)(0.0156,0.0735,0.2778)
Eco2(0.2686,0.3372,0.4518)(1,1,1)(0.5034,0.6487,0.8538)(0.0009,0.0067,0.0546)(0.0001,0.0006,0.0096)
Eco3(0.3885,0.5111,0.6652)(1.1997,1.5945,2.1048)(1,1,1)(0.0062,0.0437,0.2376)(0.5620,0.6969,0.8613)
Eco4(0.5071,0.6286,0.7749)(1.0720,1.3099,1.5874)(1.1828,1.4678,1.8568)(1,1,1)(0.8909,1.0757,1.2836)
Eco5(1.1126,1.2431,1.4142)(1.6893,2.1493,2.5864)(1.1610,1.4350,1.7795)(0.7791,0.9296,1.1225)(1,1,1)
Weight(0.2005,0.2414,0.2718)(0.0086,0.0163,0.0360)(0.0957,0.1257,0.1537)(0.3099,0.2773,0.2447)(0.3853,0.3393,0.2938)
MSw0.23790.02030.1250.27730.3395
Table 7. Fuzzy pairwise comparison matrix for the environmental criteria.
Env1Env2Env3Env4
Env1(1,1,1)(2.1726,2.8107,3.5445)(2.5205,3.1249,3.7563)(1.8250,2.4521,3.1441)
Env2(0.2821,0.3558,0.4603)(1,1,1)(1.2537,1.6234,2.0656)(1.3480,1.6293,1.9310)
Env3(0.2662,0.3200,0.3967)(0.4841,0.6160,0.7977)(1,1,1)(1.3814,1.7822,2.2758)
Env4(0.3181,0.4078,0.5479)(0.6158,0.7371,0.8822)(0.4394,0.5611,0.7239)(1,1,1)
Weight(0.4679,0.4735,0.4712)(0.2187,0.2165,0.2156)(0.1709,0.1692,0.1707)(0.1425,0.1408,0.1425)
MSw0.47090.21690.17030.1419
Table 8. Fuzzy pairwise comparison matrix for the social criteria.
Soc1Soc2Soc3Soc4Soc5
Soc1(1,1,1)(1.2288,1.5567,2.0349)(2.2134,2.8240,3.4947)(1.2460,1.6293,2.1889)(2.6925,3.4040,4.0793)
Soc2(0.5207,0.6645,0.8335)(1,1,1)(2.2671,3.1806,4.0395)(1.1740,1.7203,2.3324)(1.4983,2.0584,2.5891)
Soc3(0.2862,0.3541,0.4518)(0.2476,0.3144,0.4411)(1,1,1)(0.9720,1.2962,1.7303)(1.8430,2.4896,3.1889)
Soc4(0.0004,0.0125,0.2545)(0.4287,0.5813,0.8518)(0.5779,0.7715,1.0288)(1,1,1)(1.1497,1.5603,2.0266)
Soc5(0.2451,0.2938,0.3714)(0.3862,0.4858,0.6674)(0.3136,0.4017,0.5426)(0.4934,0.6409,0.8698)(1,1,1)
Weight(0.3920,0.3708,0.3453)(0.2915,0.2928,0.2749)(0.1667,0.1595,0.1534)(0.0415,0.0759,0.1284)(0.1082,0.1011,0.0980)
MSw0.36940.28640.15990.08190.1024
Table 9. Final priority for the SCM sustainable performances.
DimensionDimension WeightCRCriteriaRelative WeightRelative RankGlobal WeightGlobal Rank
Economical0.60810.0049Eco10.237930.14473
Eco20.020350.012314
Eco30.125040.07605
Eco40.277320.16862
Eco50.339510.20641
Environmental0.23640.0747Env10.470910.11134
Env20.216920.05137
Env30.170330.04039
Env40.141940.033510
Social0.15550.0534Soc10.369410.05746
Soc20.286420.04458
Soc30.159930.024911
Soc40.081950.012713
Soc50.102440.015912
Table 10. Linguistic variables for the ratings.
Linguistic VariableFuzzy Number
Very poor (VP)(0,0,1)
Poor (P)(0,1,3)
Medium poor (MP)(1,3,5)
Fair (F)(3,5,7)
Medium good (MG)(5,7,9)
Good (G)(7,9,10)
Very good (VG)(9,10,10)
Table 11. Fuzzy decision matrix for the alternatives. A1, Alternative 1.
A1A2A3A4A5
Eco1(6.4167,7.6667,8.4167)(6.5000,8.3333,9.4167)(4.8333,6.5833,8.0833)(5.0833,6.5833,7.7500)(4.0833,6.0000,7.8333)
Eco2(5.3333,7.0000,8.3333)(5.2500,7.0000,8.3333)(5.5000,7.5000,8.8333)(4.2500,6.0833,7.7500)(5.2500,6.5833,7.5833)
Eco3(5.9167,7.6667,8.8333)(5.0833,6.8333,8.2500)(4.0000,5.6667,7.2500)(4.3333,5.8333,7.0833)(4.6667,5.8333,6.9167)
Eco4(6.5000,8.0000,8.9167)(5.4167,7.1667,8.5000)(5.8333,7.6667,8.9167)(5.1667,6.7500,8.0000)(6.2500,7.8333,8.9167)
Eco5(6.7500,8.2500,9.0000)(6.3333,8.1667,9.3333)(5.0000,6.9167,8.5000)(4.4167,6.0000,7.4167)(5.8333,7.7500,9.0000)
Env1(6.4167,8.0000,9.0000)(6.2500,7.9167,8.9167)(4.9167,6.7500,8.2500)(5.2500,7.0000,8.2500)(5.2500,6.8333,8.0833)
Env2(4.1667,5.8333,7.3333)(4.0000,5.8333,7.5833)(3.3333,5.0000,6.6667)(4.2500,6.1667,7.9167)(3.2500,4.7500,6.3333)
Env3(4.6667,6.1667,7.4167)(4.8333,6.5000,7.8333)(3.6667,5.5000,7.4167)(5.0000,6.9167,8.5000)(4.9167,6.2500,7.3333)
Env4(4.7500,6.0000,7.0833)(4.6667,6.5833,8.0833)(4.0000,5.7500,7.4167)(5.5000,7.3333,8.7500)(4.5833,6.5000,8.0000)
Soc1(5.2500,7.1667,8.5833)(5.5833,7.0833,8.1667)(5.1667,6.9167,8.3333)(3.5833,5.4167,7.1667)(4.0000,5.4167,6.9167)
Soc2(5.8333,7.6667,8.9167)(6.2500,8.0000,9.1667)(5.5000,7.4167,8.9167)(3.7500,5.6667,7.5000)(5.5833,7.4167,8.6667)
Soc3(6.5833,8.0000,8.8333)(4.9167,6.5000,7.7500)(4.7500,6.6667,8.1667)(4.0000,5.9167,7.5833)(6.3333,8.0000,9.2500)
Soc4(7.5000,8.9167,9.5000)(6.3333,8.0833,9.1667)(4.6667,6.5000,8.0000)(5.3333,7.2500,8.7500)(6.5000,8.2500,9.3333)
Soc5(4.9167,6.5000,7.6667)(5.4167,7.0833,8.4167)(5.1667,6.9167,8.3333)(4.7500,6.5000,8.0000)(4.8333,6.4167,7.7500)
Table 12. Fuzzy normalized decision matrix.
A1A2A3A4A5
Eco1(0.6814,0.8142,0.8939)(0.6903,0.8849,1.0000)(0.5133,0.6991,0.8584)(0.5398,0.6991,0.8230)(0.4336,0.6372,0.8319)
Eco2(0.6038,0.7925,0.9434)(0.5943,0.7925,0.9434)(0.6226,0.0566,1.0000)(0.4811,0.6887,0.8774)(0.5943,0.7453,0.8585)
Eco3(0.6698,0.8679,1.0000)(0.5755,0.7736,0.9340)(0.4528,0.6415,0.8208)(0.4906,0.6604,0.8019)(0.5283,0.6604,0.7830)
Eco4(0.7290,0.8972,1.0000)(0.6075,0.8037,0.9533)(0.6542,0.8598,1.0000)(0.5794,0.7570,0.8972)(0.7009,0.8785,1.0000)
Eco5(0.7232,0.8839,0.9643)(0.6786,0.8750,1.0000)(0.5357,0.7411,0.9107)(0.4732,0.6429,0.7946)(0.6250,0.8304,0.9643)
Env1(0.7130,0.8889,1.0000)(0.6944,0.8796,0.9907)(0.5463,0.7500,0.9167)(0.5833,0.7778,0.9167)(0.5833,0.7593,0.8981)
Env2(0.5263,0.7368,0.9263)(0.5053,0.7368,0.9579)(0.4314,0.6471,0.872)6(0.5368,0.7789,1.0000)(0.4105,0.6000,0.8000)
Env3(0.5490,0.7255,0.8726)(0.5686,0.7647,0.9216)(0.4314,0.6471,0.8726)(0.5882,0.8137,1.0000)(0.5784,0.7353,0.8627)
Env4(0.5429,0.6857,0.8095)(0.5333,0.7524,0.9238)(0.4571,0.6571,0.8476)(0.6286,0.8381,1.0000)(0.5238,0.7429,0.9143)
Soc1(0.6117,0.8350,1.0000)(0.6505,0.8252,0.9515)(0.6019,0.8058,0.9709)(0.4175,0.6311,0.8350)(0.4660,0.6311,0.8058)
Soc2(0.6364,0.8364,0.9727)(0.6818,0.8727,1.0000)(0.6000,0.8091,0.9727)(0.4091,0.6182,0.8182)(0.6091,0.8091,0.9455)
Soc3(0.7117,0.8649,0.9550)(0.5315,0.7027,0.8378)(0.5135,0.7207,0.8829)(0.4324,0.6396,0.8198)(0.6847,0.8649,1.0000)
Soc4(0.7895,0.9386,1.0000)(0.6667,0.8509,0.9649)(0.4912,0.6842,0.8421)(0.5614,0.7632,0.9211)(0.6842,0.8684,0.9825)
Soc5(0.5842,0.7723,0.9109)(0.6436,0.8416,1.0000)(0.6139,0.8218,0.9901)(0.5644,0.7723,0.9505)(0.5743,0.7624,0.9208)
Table 13. Fuzzy weighted normalized decision matrix.
A1A2A3A4A5
Eco1(0.0835,0.1201,0.1463)(0.0846,0.1305,0.1637)(0.0629,0.1031,0.1405)(0.0661,0.1031,0.1347)(0.0531,0.0940,0.1362)
Eco2(0.0032,0.0079,0.0205)(0.0032,0.0079,0.0205)(0.0033,0.0006,0.0217)(0.0026,0.0069,0.0190)(0.0032,0.0075,0.0186)
Eco3(0.0392,0.0667,0.0926)(0.0337,0.0594,0.0865)(0.0265,0.0493,0.0760)(0.0287,0.0507,0.0743)(0.0309,0.0507,0.0725)
Eco4(0.1381,0.1520,0.1474)(0.1151,0.1362,0.1405)(0.1239,0.1457,0.1474)(0.1097,0.1282,0.1322)(0.1328,0.1488,0.1474)
Eco5(0.1703,0.1832,0.1706)(0.1598,0.1814,0.1769)(0.1262,0.1536,0.1611)(0.1114,0.1333,0.1406)(0.1472,0.1721,0.1706)
Env1(0.0776,0.0992,0.1136)(0.0756,0.0982,0.1125)(0.0594,0.0837,0.1041)(0.0635,0.0868,0.1041)(0.0635,0.0847,0.1020)
Env2(0.0268,0.0376,0.0482)(0.0257,0.0376,0.0498)(0.0214,0.0322,0.0438)(0.0273,0.0397,0.0520)(0.0209,0.0306,0.0416)
Env3(0.0219,0.0289,0.0359)(0.0226,0.0305,0.0379)(0.0172,0.0258,0.0359)(0.0234,0.0325,0.0411)(0.0230,0.0293,0.0355)
Env4(0.0180,0.0228,0.0278)(0.0177,0.0250,0.0317)(0.0151,0.0218,0.0291)(0.0208,0.0278,0.0343)(0.0173,0.0247,0.0314)
Soc1(0.0375,0.0475,0.0541)(0.0399,0.0470,0.0515)(0.0369,0.0459,0.0525)(0.0256,0.0359,0.0452)(0.0286,0.0359,0.0436)
Soc2(0.0290,0.0376,0.0419)(0.0311,0.0392,0.0431)(0.0274,0.0363,0.0419)(0.0187,0.0278,0.0353)(0.0278,0.0363,0.0407)
Soc3(0.0186,0.0212,0.0230)(0.0139,0.0172,0.0202)(0.0134,0.0177,0.0213)(0.0113,0.0157,0.0198)(0.0179,0.0212,0.0241)
Soc4(0.0051,0.0110,0.0201)(0.0043,0.0100,0.0194)(0.0032,0.0080,0.0169)(0.0036,0.0089,0.0185)(0.0044,0.0102,0.0197)
Soc5(0.0099,0.0120,0.0140)(0.0109,0.0130,0.0154)(0.0104,0.0127,0.0152)(0.0095,0.0120,0.0146)(0.0097,0.0118,0.0142)
Table 14. Final evaluation and ranking of alternatives.
Alternatives d i * d i CC i Rank
A113.18201.38440.0951
A213.18770.83070.05932
A313.27100.75240.05374
A413.30210.71760.05125
A513.25580.76310.05443

