4.1. Emergy-Based Evaluation of Urban Metabolism
We used the data on materials, energy, and capital flows in Yangzhou from 1995 to 2014 to calculate the solar emergy of renewable resources, nonrenewable resources, and purchased (imported) resources.
The emergy of one material or energy can be calculated using Equation (1).
The original data of sunlight is calculated according to:
where
Ex refers to the available joules of one material or energy,
α represent the mean annual sun radiation and
X represent the total area of Yangzhou.
The original data of wind can be measured by:
where
θ represent the kinetic energy of the wind.
The original data of rain (geopotential) is calculated by:
where
H refers to the average elevation,
μ refers to the annual rainfall,
g represent the acceleration of gravity, and
P is the water density.
The original data of rain (chemical) is calculated by:
where
μ refers to the annual rainfall,
G represent the Gibbs free energy of rain, and
P is the water density.
The original data of the earth cycle can be measured by:
where
Hf refers to the heat flux.
The original data of topsoil loss is measured by:
where
Xa refers to the area of cultivated land,
Se represent the rate of the soil erosion,
Om is the organic content of a unit mass of soil, and
Oe represent the organic matter energy.
The original data of other materials or energies are calculated according to:
where
Q refers to the consumption of material or energy, and
Ce represent the conversion coefficient of energy.
The emergy of economic inputs can then be measured in monetary terms:
where
M represents a particular economic input (usually in USD), Emergy is the total emergy used by the region being studied, and $ is the GDP of the region.
In this paper, we adopted 15.83 × 10
24 seJ as the planetary baseline value for annual emergy input [
28]. The data of solar transformity are from Liu [
24], Huang [
3], and Zhang [
4]. The solar emergy values of each item are shown in
Table 2.
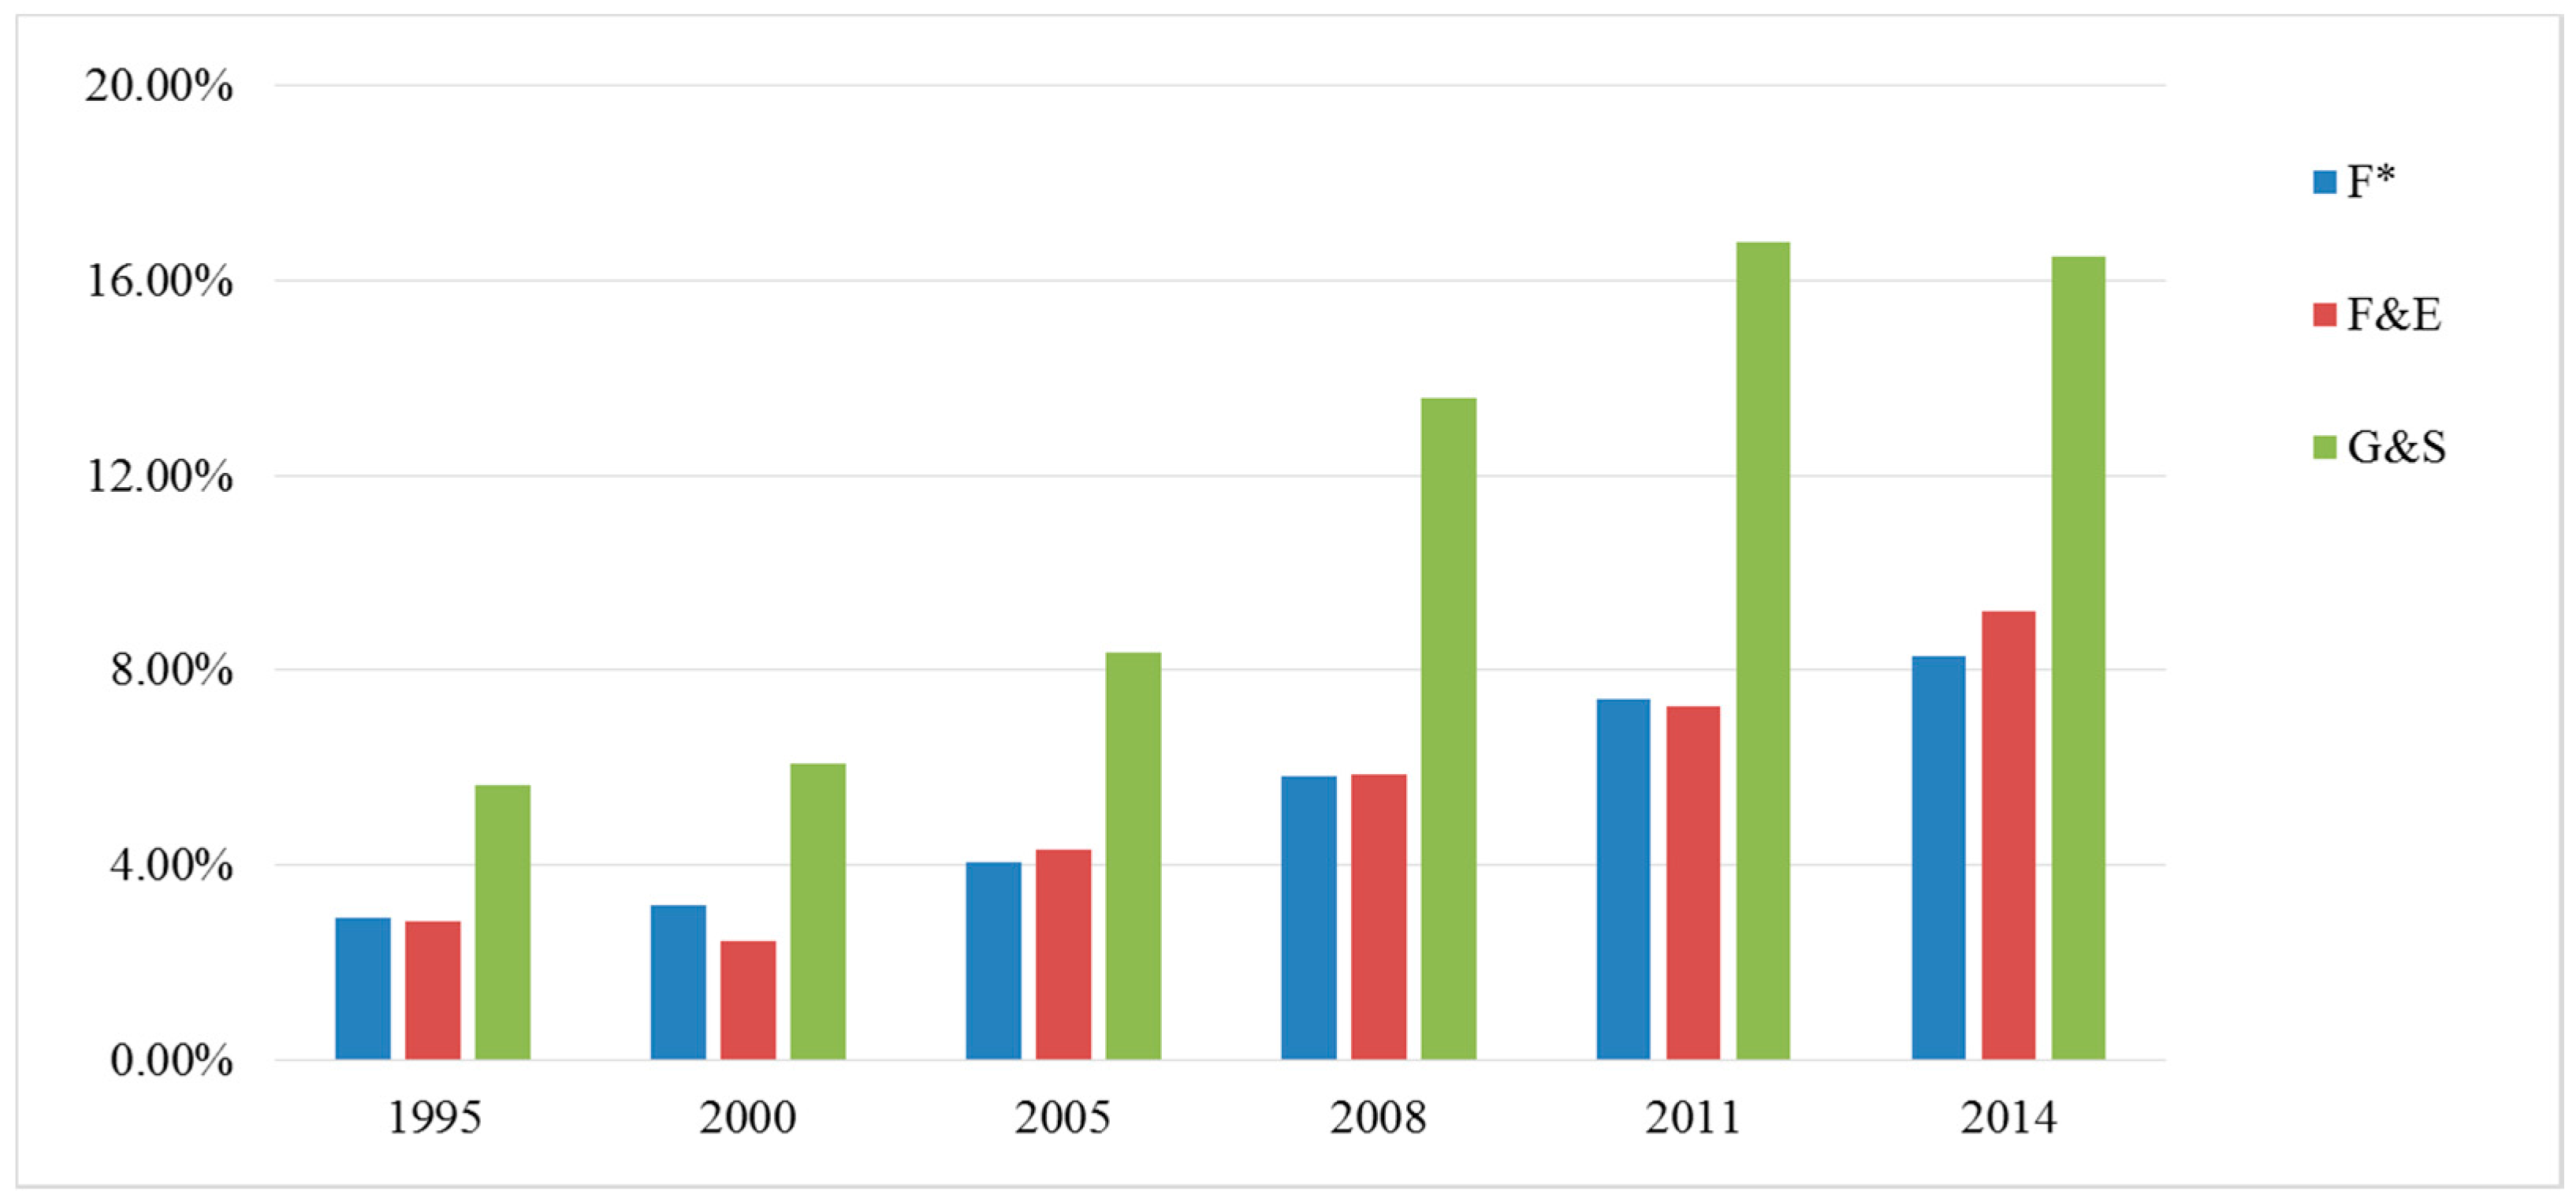
In the study area, F turned into a dominant flow sustaining the daily activities in Yangzhou, representing 11.43% of U in 1995 to 33.98% of U in 2014.
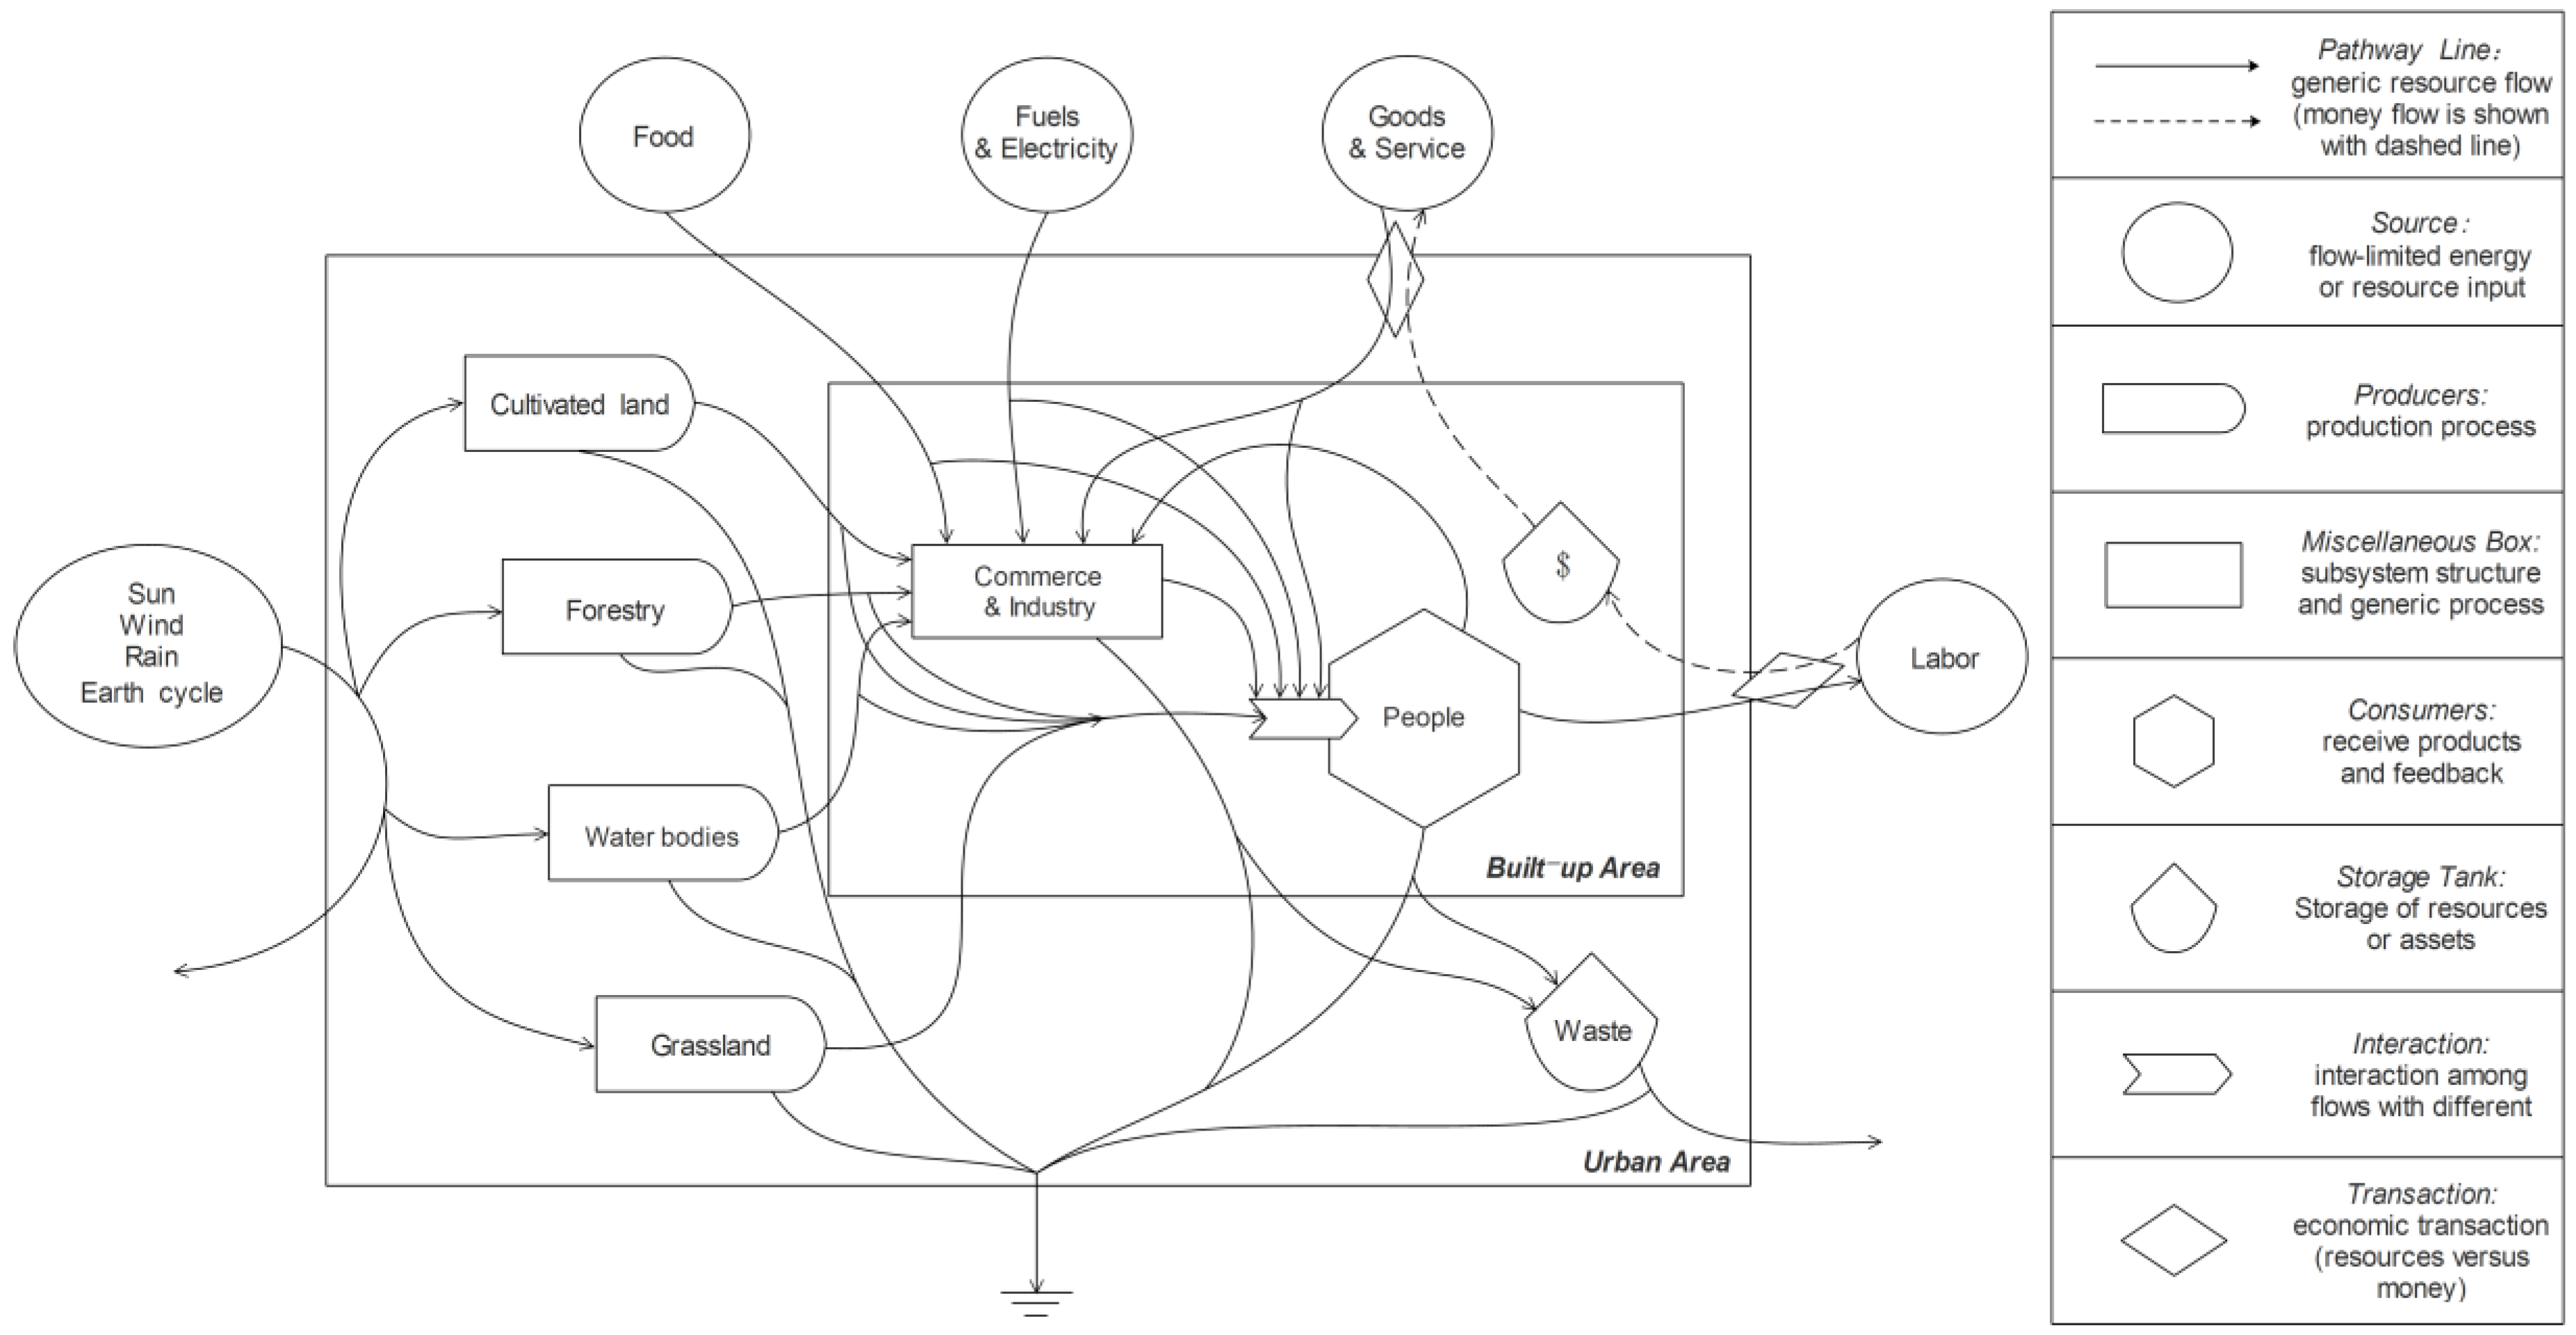
Figure 3 shows the main aggregated emergy flows as a percentage of U, of which food is F*, fuels and electricity are F&E, and goods and services are G&S.
The three main aggregated emergy flows (food, fuels and electricity, goods and services) all increased to some degree. The aggregated emergy flow of food increased from 2.91% in 1995 to 8.28% in 2014. The aggregated emergy flow of fuels & electricity increased significantly from 2.86% in 1995 to 9.20% in 2014. The aggregated emergy flow of goods & services also had a significant increase from 5.65% in 1995 to 16.51% in 2014. The changing percentages showed that all the main aggregated emergy flows had obvious changes from 1995 to 2014. People’s standard of living in Yangzhou increasingly relied on the large supply of food, resource utilization, and goods and services. This revealed that human beings were pursuing a richer material life and higher spiritual enjoyment with the economic development and evolution of the society.
Table 3 presents the indices for evaluating the urban metabolic status of Yangzhou. From 1995 to 2014, the U of Yangzhou increased about 156.56%, which showed that the emergy flux of people’s lives in Yangzhou had a remarkable development. In 2014, the imported resource emergy accounted for 33.98% of U, which increased by 2.97-fold during the study period, and showed that the living standards in Yangzhou had greatly improved from 1995 to 2014. It also showed that the development of people’s lives in Yangzhou was highly dependent on imported resources.
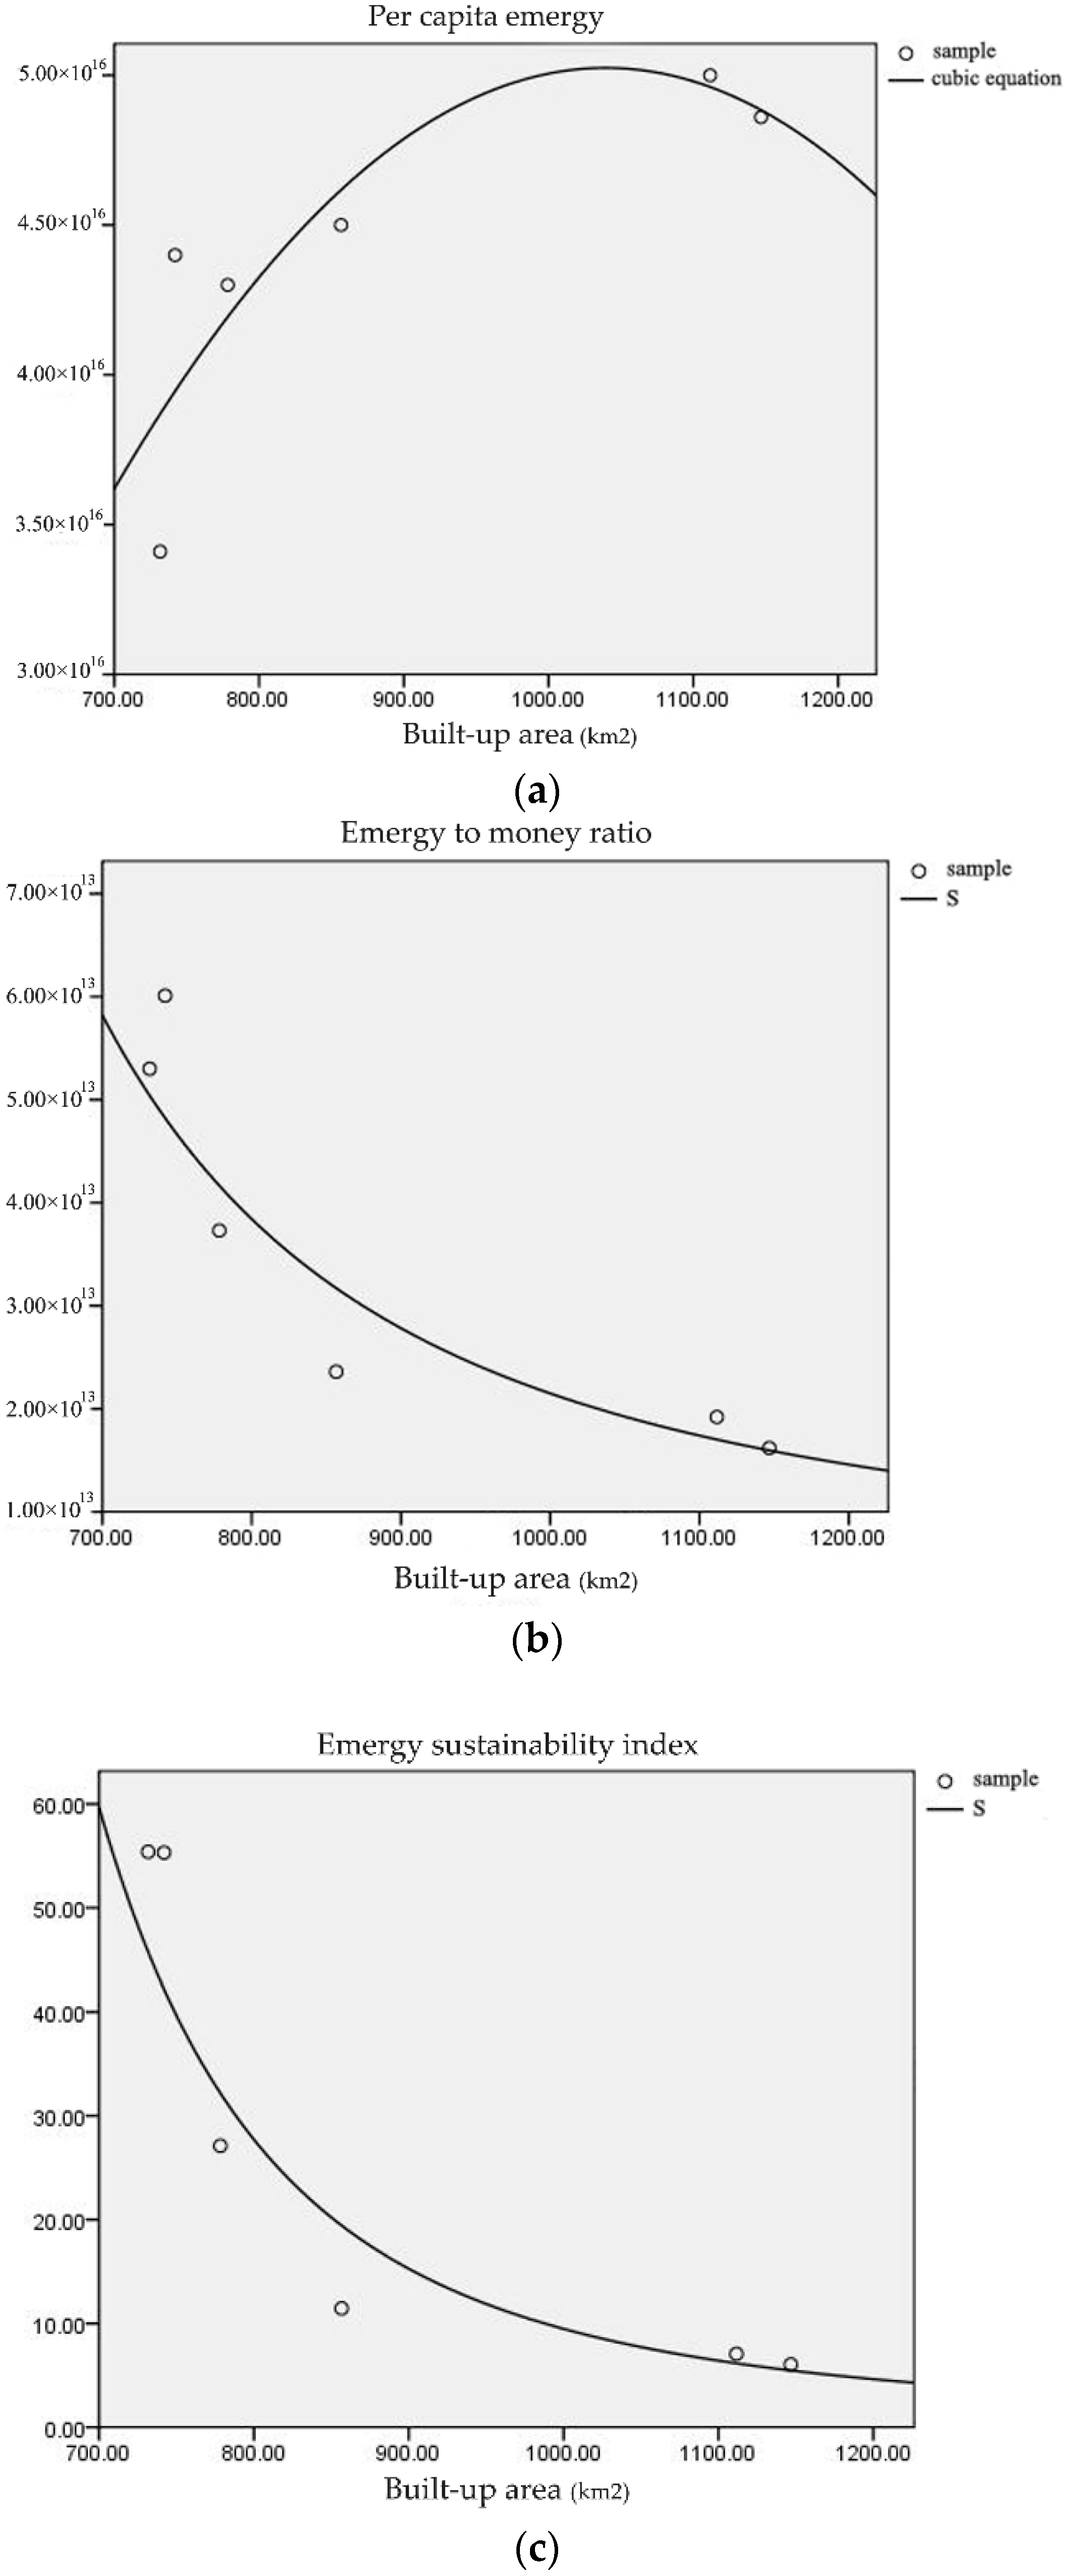
Per capita emergy increased 142.45% from 3.41 × 10¹⁶ in 1995 to 4.86 × 10¹⁶ in 2014, which showed that the living standard of urban residents had improved; on the other hand, it also revealed that the resource utilization was increasingly intense. The improvement of social and economic conditions was still based on a large amount of resource consumption. The emergy-to-money ratio was on the decline from 5.30 × 10¹³ in 1995 to 1.62 × 10¹³ in 2014. It showed that the power of money to purchase emergy was gradually decreasing. The emergy sustainability index had sharply declined from 55.40 in 1995, to 27.11 in 2005, and to 11.45 in 2008, which decreased about 79.33% during this period. However, it began to decrease slowly between 2011 and 2014, which was 7.07 in 2011 and 6.05 in 2014. The variation tendency of the emergy sustainability index revealed that the degree of coordination between the social-economic development and the ecological environment in the urban metabolism system was still at a lower level.
4.2. Analysis of Land Use Change
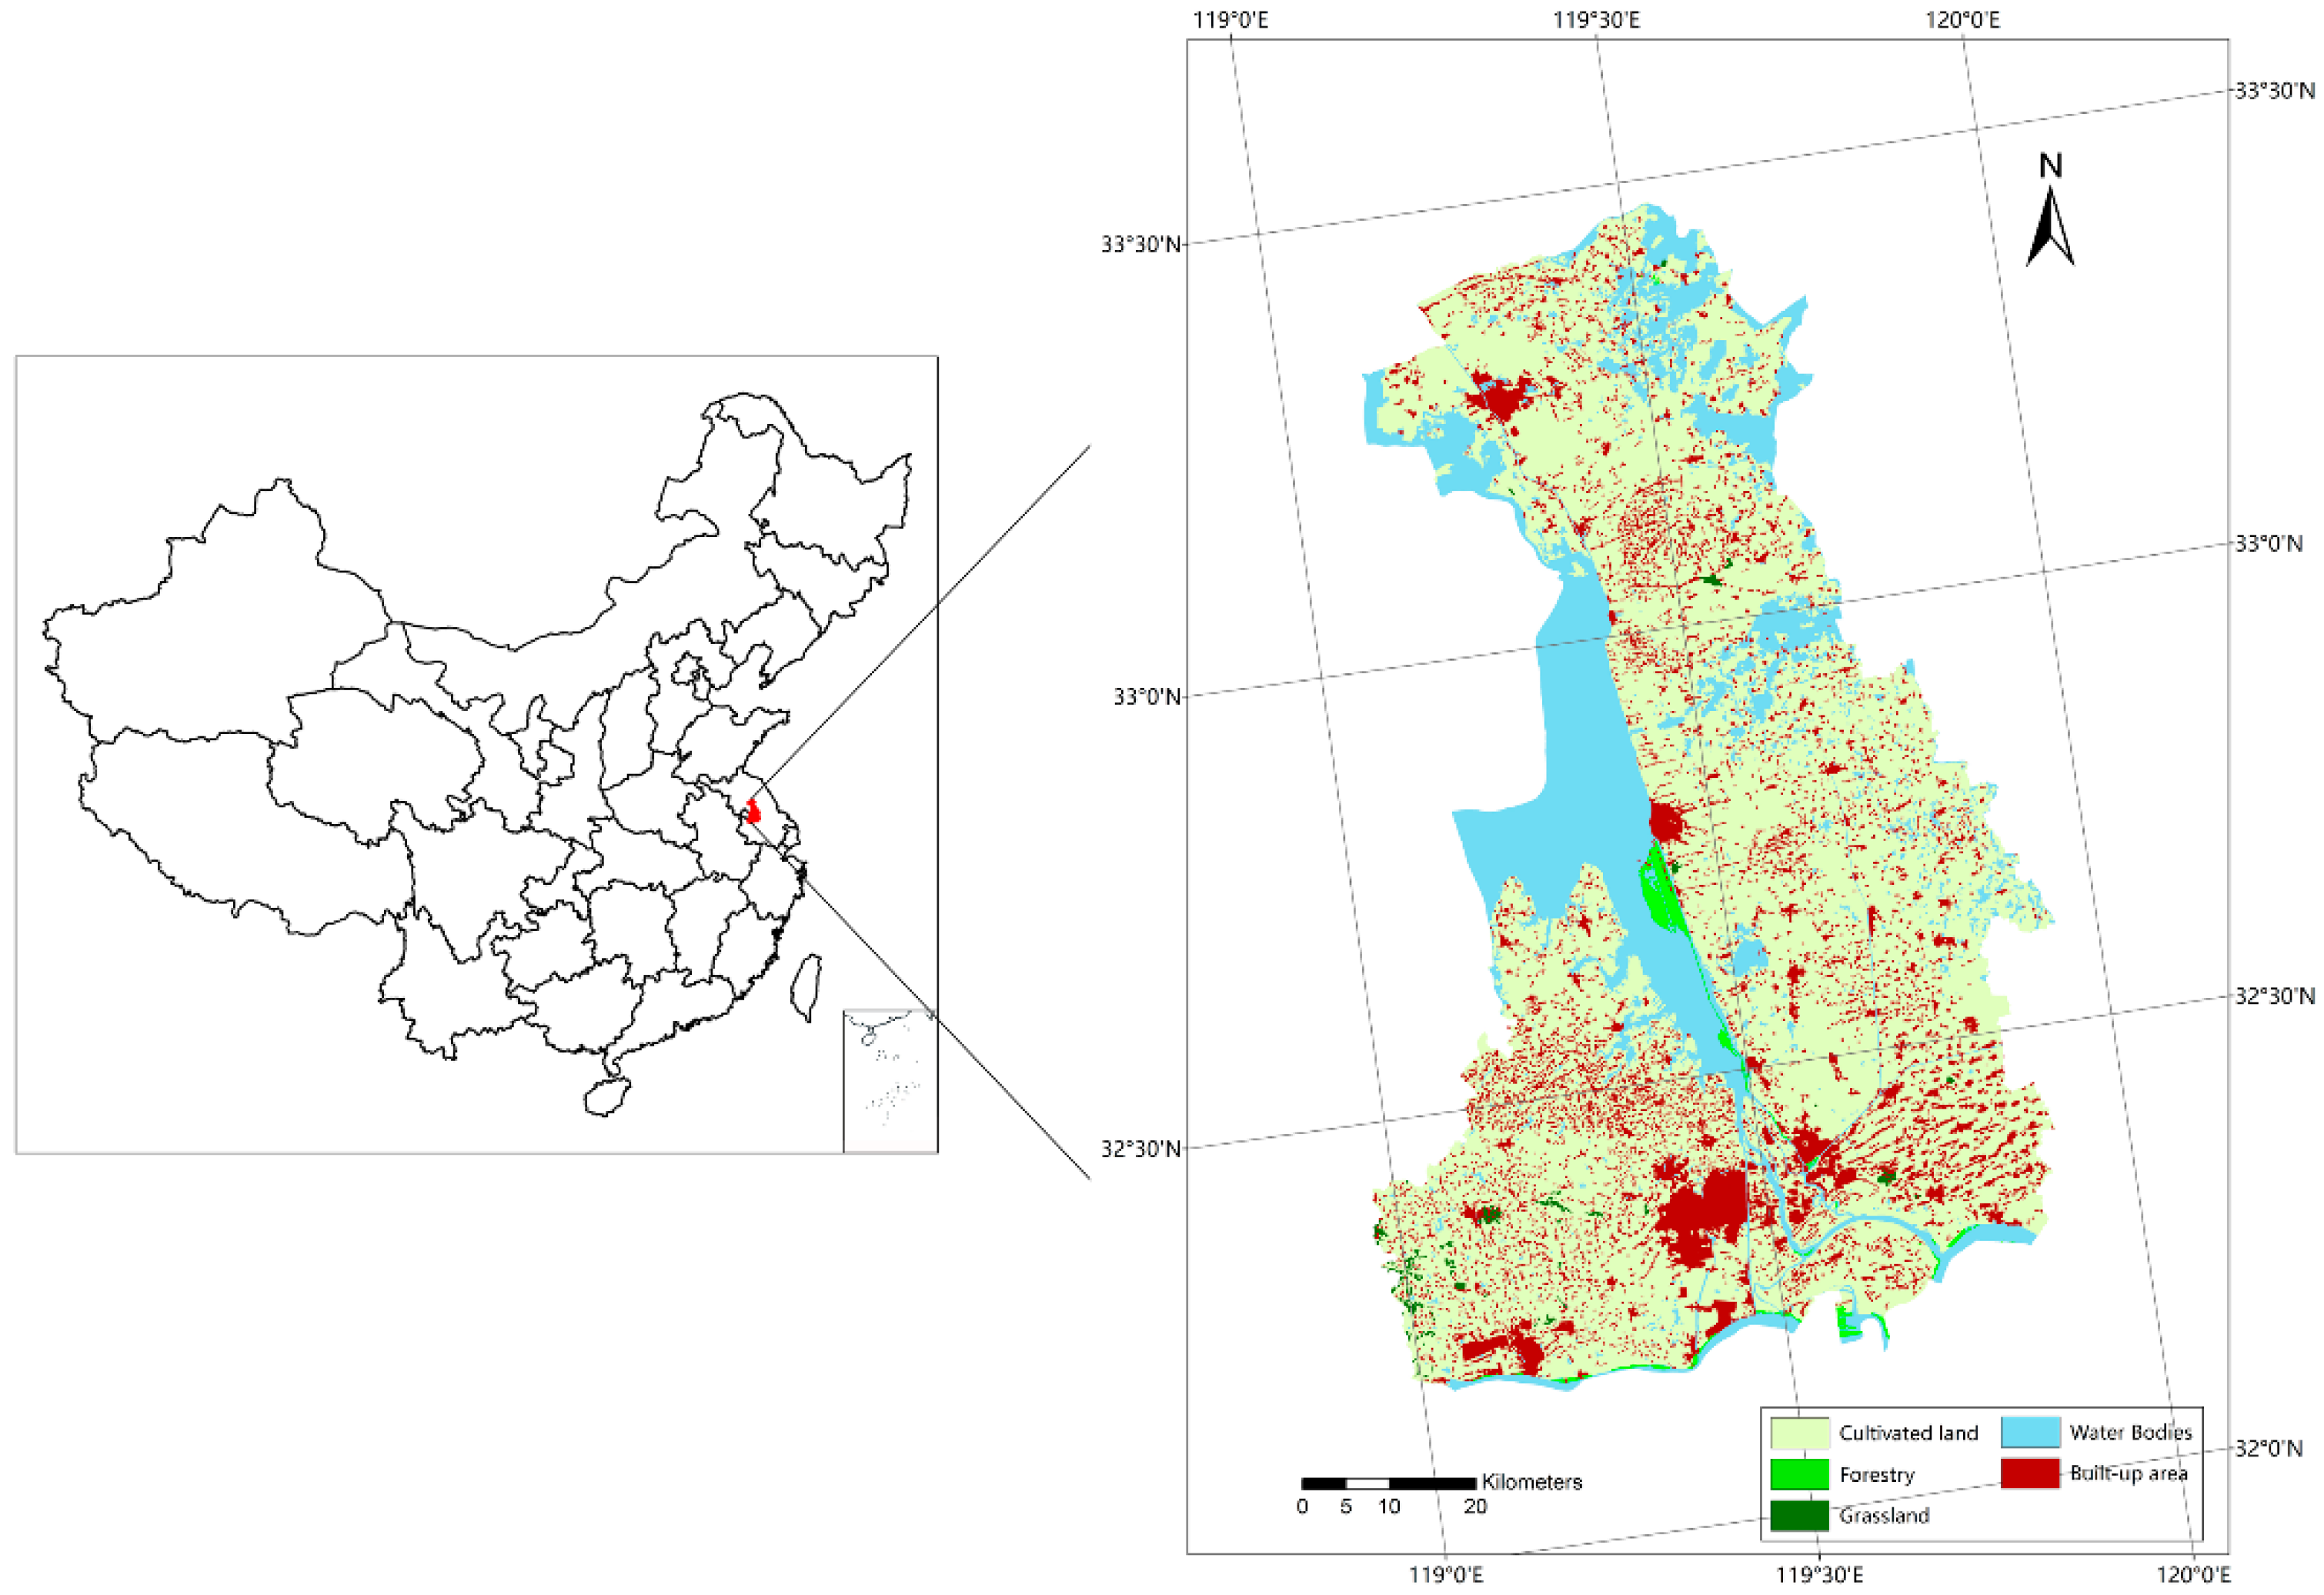
By using the graphic editor function and the spatial analysis faculty of the Arc INFO platform, the status of land use in Yangzhou was analyzed, including land area and land use structure.
The total urban land area of Yangzhou is 6628.49 km
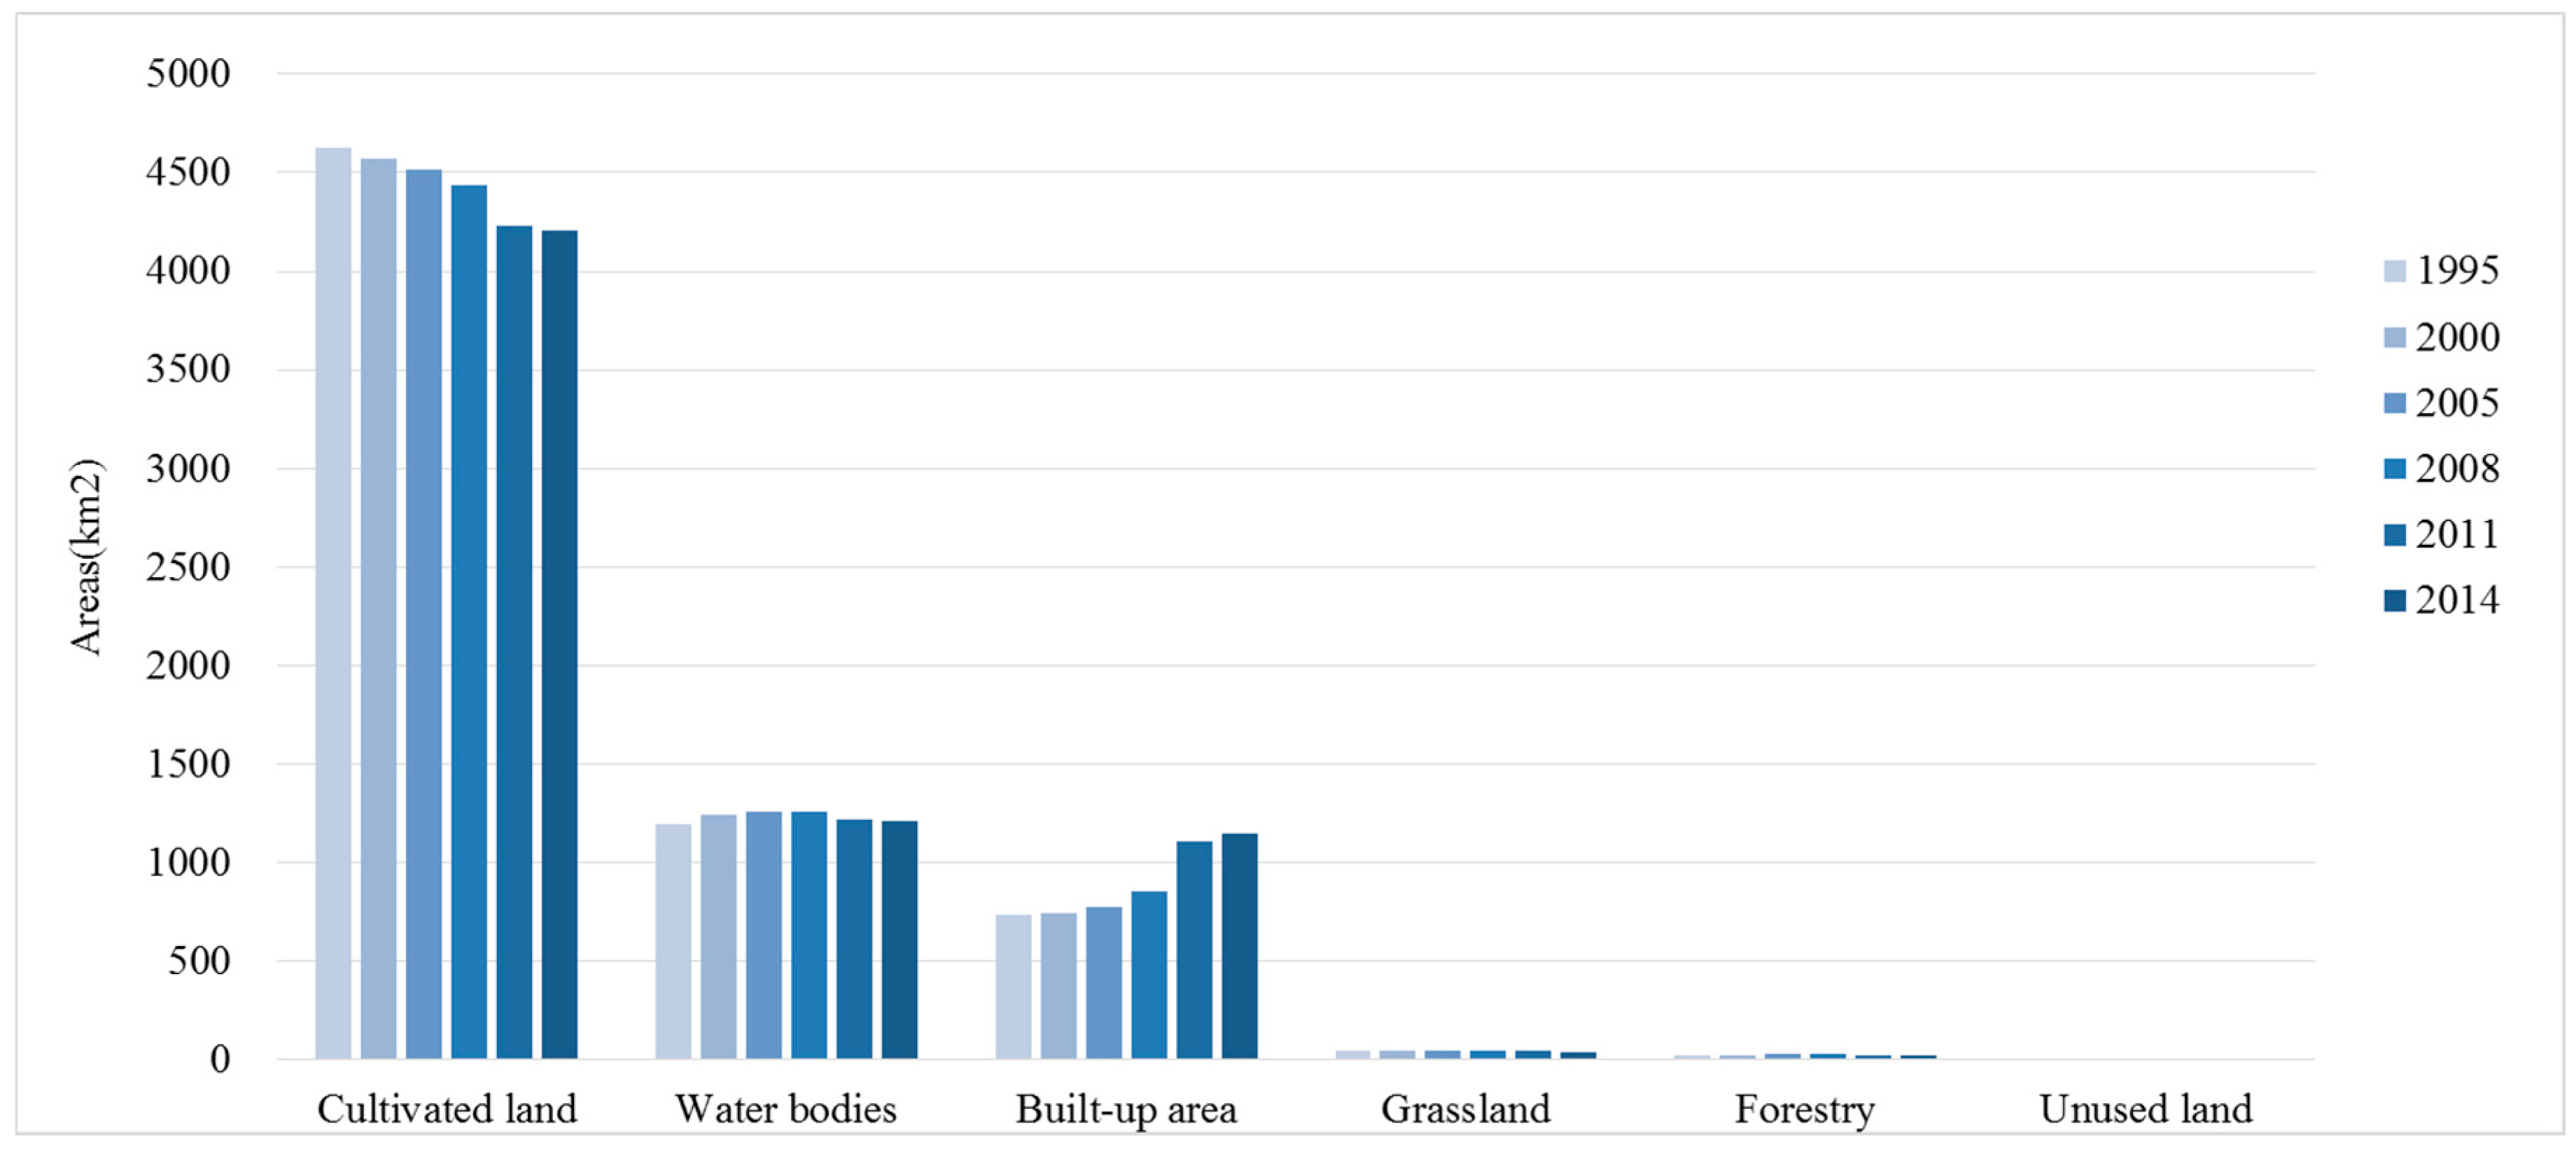
2. The structure of land use is presented in
Figure 4. The area of cultivated land decreased each year from 1995 and the proportion of bodies of water increased to 19.02% in 2008, and then decreased to 18.21% in 2014. The variation of the area of grassland and forests was relatively minor. The proportion of unused land was only 0.004% in 1995, and its effect on land use was negligible. The years between 2005 and 2011 was a significant period in which the built-up area expanded by encroaching on the cultivated land, in which the proportion increased from 11.74% in 2005 to 16.77% in 2011. With the development of urbanization, a large number of people tend to flock to the city. Hence, more built-up land will be needed and cultivated land will continue to be reduced.
We then used Formula (2) to calculate the Rd values of each type of land, shown in
Table 4.
As shown in
Table 4, the rate of cultivated land decline accelerated from 1995 to 2011, which was about −0.235% during 1995–2005, −0.58% during 2005–2008, and −1.55% during 2008–2011. However, in the period of 2011–2014, the rate had slowed down considerably, and was only −0.18%. Meanwhile, the built-up area was enlarging, and the rate of expansion increased, which was 0.28% during 1995–2000, 0.98% during 2000–2005, 3.35% during 2005–2008, and 9.92% during 2008–2011. It showed that the rate of built-up area expansion was faster than that of the cultivated land reduction. However, the rate of built-up area expansion decreased to 1.05% during 2011–2014. The area of bodies of water had increased during 1995–2008, and then decreased during 2008–2014, and the rate of increase was gradually reduced during 1995–2008. Because of the small area occupied by woodland and grassland, the variation of forests and grassland was not obvious during 1995–2008, but they both decreased during 2008–2014.
From
Table 4, we can see that the variation of the built-up area expansion. From 1995–2005 there was a stage of steady growth, which kept growing at under 1% per year. Then the built-up area expansion entered a fast development stage during the next 6 years between 2005 and 2011, which grew at an average rate of 6% per year. In the 3 years after 2011, it reverted to a steady growth stage with the growth rate of 1% per year. This showed that urbanization, which caused the expansion of the built-up area, was the main driving force of land use change in Yangzhou city. Because of the policy of expanding domestic demand in China after 2008, the urbanization of Yangzhou city entered a period of rapid development. Due to the expansion of the built-up area and the decrease of the cultivated land that were caused by urbanization, people’s lives and human well-being in Yangzhou city experienced a great change during this period.
Furthermore, the land use change is also related to the population dynamics, excluding urbanization and economic development. According to the last demographic survey, the urban population of Yangzhou grew slowly in the 10 years from 2005 to 2014. The urban population of Yangzhou was 2,221,800 in 2005, and increased to 2,318,400 in 2014. The rate of population increase was 4.35% and the annual growth rate was 0.44%. Yangzhou is one of the most developed cities in China, and the per capita GDP had surpassed 12,000 US dollars in 2014. Due to the one-child policy and the developed economy, the rate of ageing populations was 17.8% in 2008, which was above average in China. As a consequence, the impact of population dynamics on emergy-based indices was minimal in Yangzhou and this paper focused on the impact of land use change.
4.3. Sensitivity Analysis of Urban Metabolism and Land Use Change
According to
Section 4.2, the change of the cultivated land and the built-up area were the most critical changes during the period from 1995–2014. We selected the change of the cultivated land and the built-up area as the typical changes to evaluate the impact of land use change on urban metabolism. As shown in
Table 5 and
Table 6, we calculated
β between the change of the cultivated land/built-up area and the land emergy-based indices.
The level of sensitivity was divided into 4 levels:
① ≤ 0 indicated non-sensitivity, the changes of emergy-based indices and land use had no synchronization characteristics;
② 0 < ≤ 15 indicated low-sensitivity;
③ 15 < ≤ 30 indicated mid-sensitivity;
④ > 30 indicated high-sensitivity.
The β of U to cultivated land was negative during 1995–2011, which showed that it was non-sensitive in this period. During 2011–2014, the β of U to cultivated land increased to 1.66, which showed that it was low-sensitivity. The sensitivity of the emergy export-oriented ratio to the cultivated land were non-sensitive from 1995 to 2014. The change of β of the per capita emergy to the cultivated land had no obvious regularity, but generally the per capita emergy was non-sensitive to the cultivated land. The sensitivity of the emergy-to-money ratio to the cultivated land changed from non-sensitivity, to high-sensitivity, and then to mid-sensitivity. The sensitivity of the emergy sustainability index to the cultivated land first increased from low-sensitivity to high-sensitivity, and then decreased to low-sensitivity. During 2005–2008, the β of emergy sustainability index was 49.54, which reached the maximum value.
The β of U to the built-up area was 22.82 during 1995–2000, and it decreased to less than 15 during 2000–2011, and then decreased further to −1.38 during 2011–2014. The sensitivity of the emergy export-oriented ratio to the built-up area changed from low-sensitivity to high-sensitivity and then to low-sensitivity. During 2005–2008, the β of the emergy export-oriented ratio to the built-up area was 35.96, which reached its maximum value. From a general view, the β of the per capita emergy to the built-up area was positive during most of the study period. The sensitivity of the emergy-to-money ratio to the built-up area changed from low-sensitivity during 1995–2000 to non-sensitivity during 2000–2014. The emergy sustainability index was non-sensitive to the built-up area during the whole study period.
The results of the sensitivity analysis showed that the built-up area had a more significant effect on the total emergy change of urban metabolism compared to the cultivated land. Nevertheless, the substantial correlation between the built-up area and U had been diminishing with the urban expansion. At the same time, the β of the emergy export-oriented ratio and the per capita emergy indicated similar trends while the cultivated land decreased and the built-up area increased. This showed that the emergy flux, emergy export-oriented ratio, and the per capita emergy had a positive correlation with the built-up area. However, with the rapid development of urbanization, this influence weakened. The results also revealed that the increase of the built-up land had negative impacts on the emergy-to-money ratio and the emergy sustainability index. With the urban area expansion, people’s living standards improved significantly and their material lives became richer, while the people's lives were also increasingly dependent on external resources and material inputs. On the other hand, the sensitivity analysis showed that the ecological-economic efficiency and long term sustainability of the system was reduced, with the area of cultivated land decreasing.


