Article

Soil Organic Carbon Stocks in Terrestrial Ecosystems of China: Revised Estimation on Three-Dimensional Surfaces

1
State Key Laboratory of Soil and Sustainable Agriculture, Institute of Soil Science, Chinese Academy of Science, Nanjing 210008, Jiangsu, China
2
Nanjing Branch of Chinese Academy of Science, Nanjing 210008, Jiangsu, China
3
Northeast Institute of Geography and Agroecology, Chinese Academy of Sciences, Changchun 130102, Jilin, China
*
Author to whom correspondence should be addressed.
Sustainability 2016, 8(10), 1003; https://doi.org/10.3390/su8101003
Submission received: 2 May 2016 / Revised: 27 September 2016 / Accepted: 27 September 2016 / Published: 14 October 2016
(This article belongs to the Special Issue Soil Science in Conservation Agricultural Systems)

Abstract

:
The estimation of soil organic carbon (SOC) stock in terrestrial ecosystems of China is of particular importance because it exerts a major influence on worldwide terrestrial carbon (C) storage and global climate change. Map-based estimates of SOC stocks conducted in previous studies have typically been applied on planimetric areas, which led to the underestimation of SOC stock. In the present study, SOC stock in China was estimated using a revised method on three-dimensional (3-D) surfaces, which considered the undulation of the landforms. Data were collected from the 1:4 M China Soil Map and a search work from the Second Soil Survey in China. Results indicated that the SOC stocks were 28.8 Pg C and 88.5 Pg C in soils at depths of 0–20 cm and 0–100 cm, corresponding to significant increases of 5.66% and 5.44%, respectively. Regression analysis revealed that the SOC stock accumulated with the increase of areas on 3-D surfaces. These results provide more reasonable estimates and new references about SOC stocks in terrestrial ecosystems of China. The method of estimation on 3-D surfaces has scientific meaning to promote the development of new approaches to estimate accurate SOC stocks.

1. Introduction

Modification of anthropogenic activities on the stimulation of carbon dioxide (CO2) emission to the atmosphere has underlined the contribution of carbon imbalance to global climate change. In parallel with the intensive economic development, the swift increase of fossil fuel CO2 emissions from China eclipsed those from the US in late 2006, which promoted China to be the largest CO2 emitter in the world [1]. Quantifying the carbon (C) balance of Chinese ecosystems is necessary to assess the national magnitude, and is critical for the management of global ecosystems with gradual CO2 growth [2].
Organic C sequestrated by soils contributes to the mitigation of CO2 emissions to a great extent [3,4,5]; hence, evaluating the potential of soil organic C (SOC) reservoirs is critical for managing the C balance in the terrestrial system [6,7]. Current values of estimates on SOC stock in the terrestrial ecosystem of China ranged from 50.0 Pg C to 92.4 Pg C in soils at the depth of 1 m beneath the surface (Table 1). These values were mainly collected by computing sets of data from three sources, i.e., the China Soil Maps (CSMs) at the scale of 1:4 M and of 1:1 M and soil series of China as well. The estimate using soil series probably failed to obtain sufficient precision because its values exhibited a large variation and the minimum value was only 50 Pg [8]. In contrast, estimates using large-scale soil maps, namely the 1:4 M or 1:1 M CSM, could supply values with an acceptable variation. Specifically, the 1:4 M CSM was created in 1998 based on results from studies on soil classification, distribution, mapping, and zoning between the 1970s and 1990s. The mapping units in the 1:4 M CSM referred to those in the first edition of the CSM based on studies of Chinese soil classification since 1984 using diagnostic horizon and characteristics and published in 1991. The approach to map the SOC distribution in these regional estimates can be processed to stratify the area by land use and/or soil type, to calculate mean SOC stocks, and to attribute this value to the corresponding polygons/grid-cells on the map. Regardless of the soil map scale, these estimates relied on SOC density (SOCD) and tended to generate extreme results due to the great heterogeneity of the landscape. The area for the SOC estimate was traditionally acquired from the planimetric form. This is a typical projection of a three-dimensional (3-D) surface but is quite different from the objective area of the surface; therefore, currently planimetric-based methods may have underestimated the SOC stock in China.
Research has shown that the land area can be estimated more accurately through the 3-D surface approach [19] relative to the planimetric one [6,20,21,22,23]. The accuracy of this approach can be increased because the 3-D surfaces could better describe rugged terrain [24]. Current values of SOC stock in China on 3-D surfaces were mainly estimated at regional scales [21,23,24]; relevant information is insufficient at the national scale. Hence, in the present study, national-scale SOC stock in terrestrial system of China was estimated on the 3-D surfaces according to the method of a new algorithm for surface area. It is obvious that when the 3-D surface area is involved as a parameter in the calculation of the total SOC stock at the national scale, the sum tends to be greater than that derived from a 2-D surface. However, to what extent this increment being greater has never been determined for the whole land surface of China, and this was taken as the main aim of this study. In addition, the relationship between the total 3-D area and the total SOC stock tended to be positive because the total SOC was the sum of the results from each polygon. This relationship seemed unlikely to be a linear one due to the involvement of elevation index in our algorithm. Because most values of SOC stocks in terrestrial systems of China were obtained by computing data from the 1:4 M CSM (Table 1), this map was also employed as the data source in this study so as to enable possible comparisons between our results and those of others. Our study would supply an instance of estimation for the total SOC stock on the 3-D surface at the national scale using the algorithm method. The results can also supply some new references for the estimates on total SOC stock in China.

2. Materials and Methods

2.1. Soil Data Source

Estimates of SOC stock require information of the spatial distribution of different soil types, SOC content, bulk density, and stoniness with soil depth [25]. The digitized 1:4 M CSM was supplied by the Institute of Soil Science, Chinese Academy of Sciences as the data source. It includes 8005 polygons representing 247 basic soil map units and 71 major soil map units. The basic and major map units correspond to the subgroups and soil groups of the Chinese Soil Taxonomy (CST) (the first edition) by the research group and cooperative research group on CST in 1991, respectively.
The investigating soil data were collected from the China Soil Scientific Database (CSSD) [26] based on the Second Soil Survey in China [13]. These data included values about the SOC (%) in soils of a given layer, bulk density, and so on. The database includes 2456 soil profiles containing 8714 soil layers. Because the second soil survey in China employed the Chinese Soil Classification System (CSCS) based on the soil genesis theory, the soil types of the survey were referred to for the soil types of the CST according to the soil profile characteristics. A lookup table was created to easily identify the corresponding soil types between the two classification systems (i.e., CST and CSCS).

2.2. Surface Area Calculation

The calculation of 3-D surface was usually based on the Digital Elevation Model (DEM). In the study, we used the 3 arc-second C-band void-filled version 4 SRTM (Shuttle Radar Topography Mission) data [19], covering whole China with column numbers from 51 to 63 and row numbers from two to nine (the CGIAR Consortium for Spatial Information). In order to match the projection of the other maps, the SRTM DEM data were re-projected with pixel size of 90 × 90 m according to the projection of CSM after merging all the DEM tiles. Then the surface area in each polygon was calculated using Jenness’ method [20]. The method derives the surface area for a cell using elevation information for the center cell and the eight adjacent cells by generating eight 3-D triangles connecting each cell center point with the central points of the eight surrounding cells. The area of the portions of each triangle that lay within the cell boundary can be calculated and summed [20]. This method directly calculates the surface ratio (Sr), which is the ratio of the 3-D area to the planimetric area of each cell. According to Jenness [9] the method tended to be slightly less accurate than using Triangulated Irregular Networks (TINs) to generate surface-area statistics, but its accuracy and precision increased rapidly with increasing cell counts; hence this method fits the employment of our study at the national scale. The calculations were performed using ESRI ArcGIS software and an extension created by Jenness Enterprises [27]. The ArcGIS is a geographic information system (GIS) for working with maps and geographic information, including software of ArcMap, ArcCatalog, and ArcGlobe.

2.3. Estimates of Soil Organic Carbon Stocks

The SOCD of an individual profile with layers at a specified depth (0–20 cm and 0–100 cm) was calculated using the equation described by Batjes [25]:
T d = i = 1 k ρ i P i D i ( 1 F i )
where Td is the total SOCD (in kg·m−2) for all layers, k is the total number of all layers, ρi is the bulk density (kg·m−3) of layer i, Pi is the percent SOC (%) in soils of the layer i, Di is the thickness of layer i (m), and Fi is the volumetric fraction of fragments >2 mm.
We used a simple method to “link” the soil profile data with each polygon in the digitized soil map through soil subgroups. For soil subgroups with multi-profiles, the median SOCD of all profiles was assigned. For subgroups without soil profile data, the average SOCD of all profiles at its upper-level soil group was assigned.
Because the present estimation of SOC stock in China was conducted based on 3-D surface, the next important step was to calculate the surface area of each polygon in the map by multiplying the planimetric area and the average Sr value of all the cells within a given polygon. The total SOC mass of a polygon was determined using the following equation:
M d = S r A T d
where Md is the total mass of SOC (Pg C) held in the upper d cm of the soil in a polygon, Sr is the average value of the surface ratio within the polygon, A is the planimetric area of the polygon, and Td is the total SOCD (in Mg·m−2).

2.4. Statistical Analysis

Both SOC stock (Pg C) and SOC ratio (%) were calculated through dividing SOC content by all soil C contents in one soil layer. Both SOC stock and SOC ratio were averaged for their means using the data from soil groups as replicates (n = 71) for soils at depths of 0–20 cm and 0–100 cm, subsequently one-way ANOVA was performed to detect significant difference (Sig. = 0.05) between the two soil depths. As soon as the significance was detected, means were compared according to Tukey’s studentized range test at α = 0.05. Regression analysis was performed to determine the relationship between areas estimated on 3-D surfaces and SOC stock or SOC ratio using the data from soil groups. Fit curves were detected using Sigmaplot version 12.0 (Systat™ Software Inc., San Jose, CA, USA, 2011). The SOC stock of each soil type in terrestrial systems of China was subsequently calculated by summing up the values for all of the polygons of a given soil type using SPSS software version 24.0 (IBM Inc., Armonk, NY, USA, 2013).

3. Results

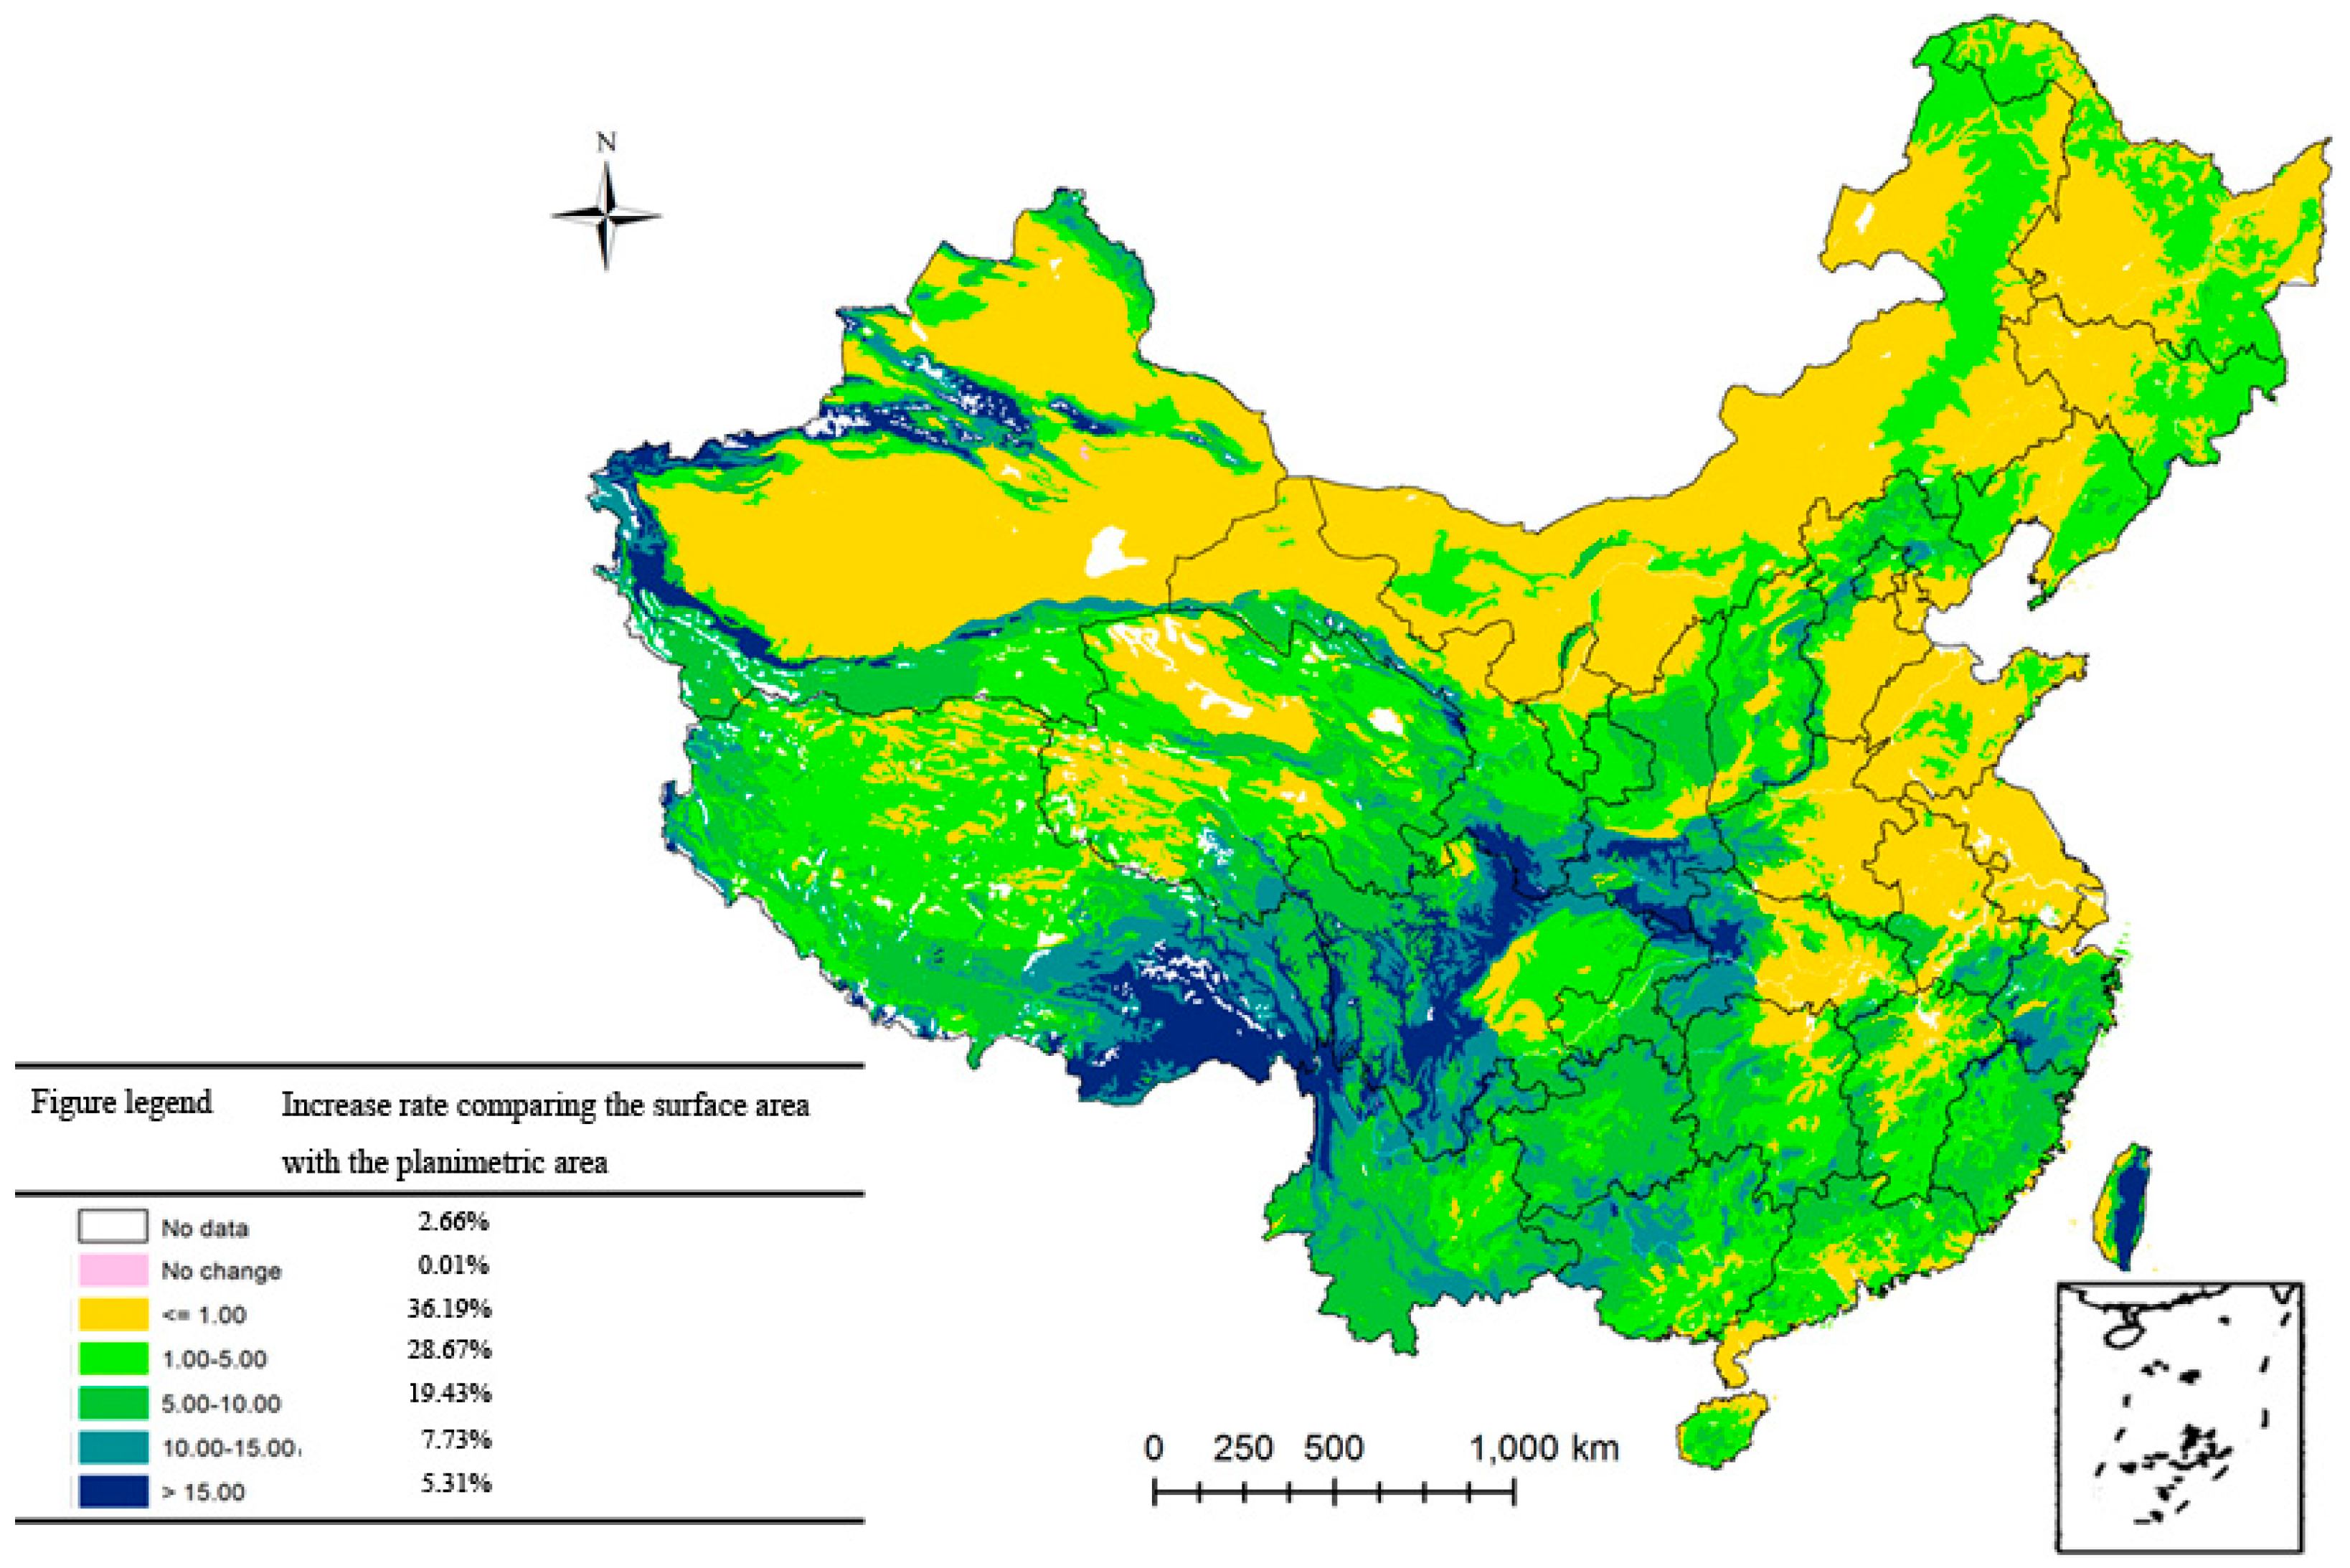
3.1. Area Distribution Calculated from 3-D Surfaces

According to the areas of 71 soil groups estimated on 3-D surfaces, red soil is the most widely distributed and accounts for 70% of total soil areas in China (Table 2). Besides red soil, brown sand soil, frost-calc soil, brown dessert soil, chao soil, and frost-sod soil all have an area larger than 40 × 104 km2, which together account for 27.60% of the total area. Twenty soil groups have an area between 10 × 104 km2 and 40 × 104 km2, accounting for 51.67% of the total area. The remaining 45 soil groups with an area smaller than 10 × 104 km2 account for only 13.52% of all of the total area.
On 3-D surfaces, the provinces of Inner Mongolia, Tibet, and Xinjiang have areas larger than 100 × 104 km2, which were calculated to be 115.24, 128.73, and 170.66 × 10⁴ km2, respectively (Table 3). Therefore, the region including these three provinces has the largest area, 574.60 × 10⁴ km2, of all the regions of China. The southwest region has the second largest area of 147.68 × 10⁴ km2, wherein the Sichuan and Yunnan Provinces have an area of 53.36 × 10⁴ km2 and 41.63 × 10⁴ km2, respectively, which are both larger than 40 × 104 km2 and also larger than all areas of other Provinces (Table 3).

3.2. SOC Stocks Estimated on 3-D Surfaces

The average SOC stock in soils at a depth of 0–100 cm was estimated to be greater than that of 0–20 cm (n = 71, sig. < 0.0001), but the average SOC ratio was not statistically different between the two soil depths (n = 71, sig. = 0.9978) (Figure 1). Frost-sod soil and red soil have the highest SOC ratio of higher than 6% for both soil depths; for the depth of 0–20 cm dark brown soil also has a higher SOC ratio than 6%. For SOC ratios between 2%–6%, there are 15 soil groups at depths of both 0–20 cm and 0–100 cm. All soil groups with a SOC ratio lower than 2% have less SOC stock than 2 Pg C (Figure 1).
Among all provinces, Tibet Province reserves the greatest SOC stock at depths of both 0–20 cm and 0–100 cm, the values of which were estimated to be 3.95 Pg C and 12.13 Pg C, respectively (Figure 2). Qinghai and Inner Mongolia Provinces have the second and third greatest SOC stock, respectively. Hence, the total SOC stock for the northwest region is the greatest among all regions for both depths. The southwest region reserves the second greatest SOC stock. In the northeast region, although there are only three provinces, the sum of their total SOC stocks contributes to the third largest SOC reserve among all regions. Due to well-urbanized metropolises, such as Beijing, Tianjin, and Shanghai, the total SOC stocks in the north and east regions containing these cities were estimated to be low (Figure 2). In general, SOC stocks in all regions across China are summed to be 28.79 Pg C and 88.46 Pg C for soils at depths of 0–20 cm and 0–100 cm, respectively.

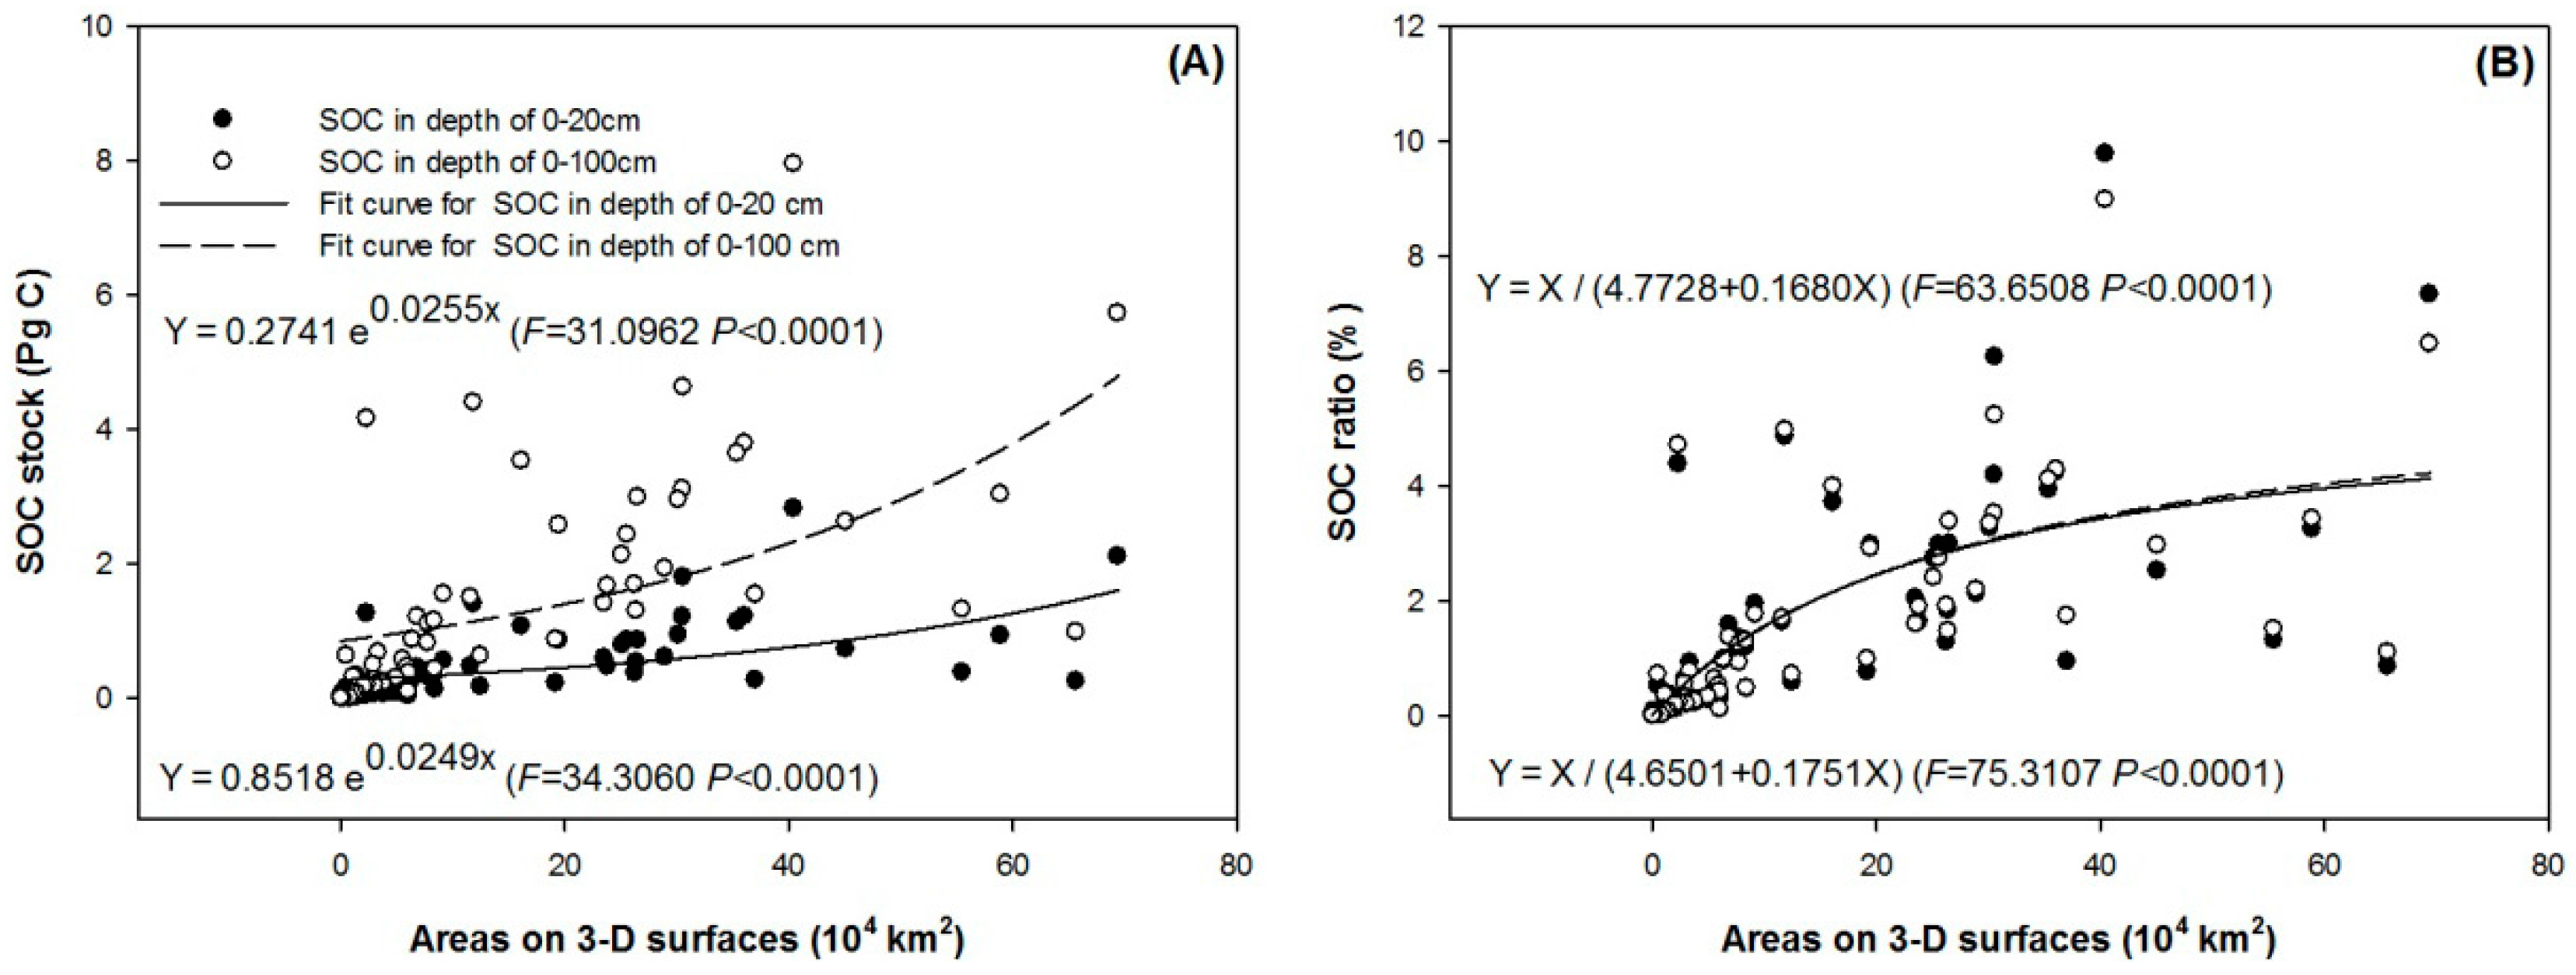
3.3. The Relationships between the 3-D Surface Area and the Two SOC Metrics

Areas on 3-D surfaces were well regressed with both the SOC stock and SOC ratio in the soil groups of China (Figure 3). The relationship between areas on 3-D surfaces and SOC stock could be fitted by an exponential growth curve, the regressive values on which were greater for SOC stock at a depth of 0–100 cm relative to that at a depth of 0–20 cm (Figure 3A), due to the greater variability of the SOC stock in the top 20 cm of soil. The relationship between areas on 3-D surfaces and the SOC ratio could be fitted by a hyperbola curve (Figure 3B), whose values were regressed to be a tiny increase for 0–100 cm compared to 0–20 cm. Thus, the SOC ratios could not be statistically distinguished for different soil depths (Figure 1).

4. Discussion

4.1. Area Estimations on 2-D and 3-D Surfaces

Thus, the calculation of SOC stock should have pre-assumed that the elevation did not affect the SOC stock. However, in our study this pre-assumption was null because elevation had some connection with the SOC through the parameter of Sr in Equation (2). In our study the most significant contribution to the scientific progress of SOC estimation was triggered by estimations on 3-D surfaces, which were disparately differentiated from the 2-D ones performed in previous studies. On 3-D surfaces, the total area of China was evaluated to be 962.62 × 10⁴ km2, which is larger than nearly all former results based on the 2-D surface (Table 1) and supports our first hypothesis. Thus, the parameter of elevation contributes to this significant increment to a great extent. To find the relationship between the rate of increase and the landform, the average elevation was calculated based on SRTM DEM data for each soil group by zonal analysis in ArcGIS. The increase rates could be divided into four classes according to soil groups, which were 0%–1%, 1%–5%, 5%–10%, and >10% (Table 4). The trend of increasing the average elevations with the increase rate indicated that it may be more reliable to estimate areas on 3-D surfaces than 2-D ones when predicting SOC stock in regions including mountainous terrains at the national scale. In contrast, Zhang et al. [24] pointed out that there was a relatively big difference (6%) between the planimetric area and the 3-D surface area in the mountainous region in southwestern China, which suggested that the landform had a considerable effect on the estimate of SOC stocks in the mountainous region.
Taking elevation into account also caused an increment of areas on 3-D surfaces relative to 2-D ones for soil groups, although both our study and the studies of others were performed from a common data source from CSM at the scale of 1:4 M [11,12,13,14]. The largest area was found containing soil groups of red soil, brown sand soil, and Frost-calc soil with values of 69.41, 65.66, and 58.92 × 10⁴ km2, respectively (Table 2). However, areas of 2-D surfaces for these three soil groups were estimated to be only 65.43 × 10⁴ km2, 65.47 × 10⁴ km2, and 37 × 104 km2, respectively, in Xie et al. [13]. On the other hand, area changes also occurred for provincial estimations, and nearly all provincial areas estimated on 3-D surfaces (Table 3) are larger than those on 2-D ones [17].
The greatest increment of the area ratio of the 3-D surface relative to the planimetric surface was mainly distributed in southwestern and extreme western regions (Figure 4), where lands are dominated by mountains and hills and tend to have higher elevation than other regions. In southwestern regions, SOC was mainly accumulated as stock due to abundant vegetation reserves, while in extreme western regions, such as Tibet, the vegetation reserve is not as sufficient as that in other regions, but the SOC can accumulate because of little effect on the soil due to anthropogenic activity over a long time. However, the widest increments of surface area were distributed mainly in the northern, northeastern, and eastern regions, where much land is dominated by meadows, forests, and cities. All these land use types are of high SOC stock or are under intensive anthropogenic disturbance. Traditional estimations on 3-D surfaces of China were probably performed on mountainous regions [24,28,29], whose areas were estimated to be larger on these 3-D surfaces compared to 2-D ones nearly at the regional scale [24]. Very little information about the area of the 3-D surface of China is available at the national scale. In our study, the areas on 3-D surfaces were found to be larger than the 2-D ones at the national scale of China (Figure 4). Zhang et al. [24] revealed that SOC stocks estimated by the GST-2D methods were lower than the GST-3D estimates mainly due to the under-estimation of the soil acreage for the surface area in the mountainous regions of southwestern China. At the regional scale of the southwestern and extreme west parts of the Chinese map, our findings about the highest increase rate of over 15% from areas on 3-D surfaces relative to 2-D ones (Figure 4) concur with current indications and results. However, these great increases only account for about 5% of the total increment and most area increase rates occupying over 60% of the total increment failed to be higher than 5%, suggesting that abundant parts of Chinese lands are probably “flat”, where elevations only attribute to influences on topographies to a minor extent. This is an important issue, but our study thus failed to involve this effect.

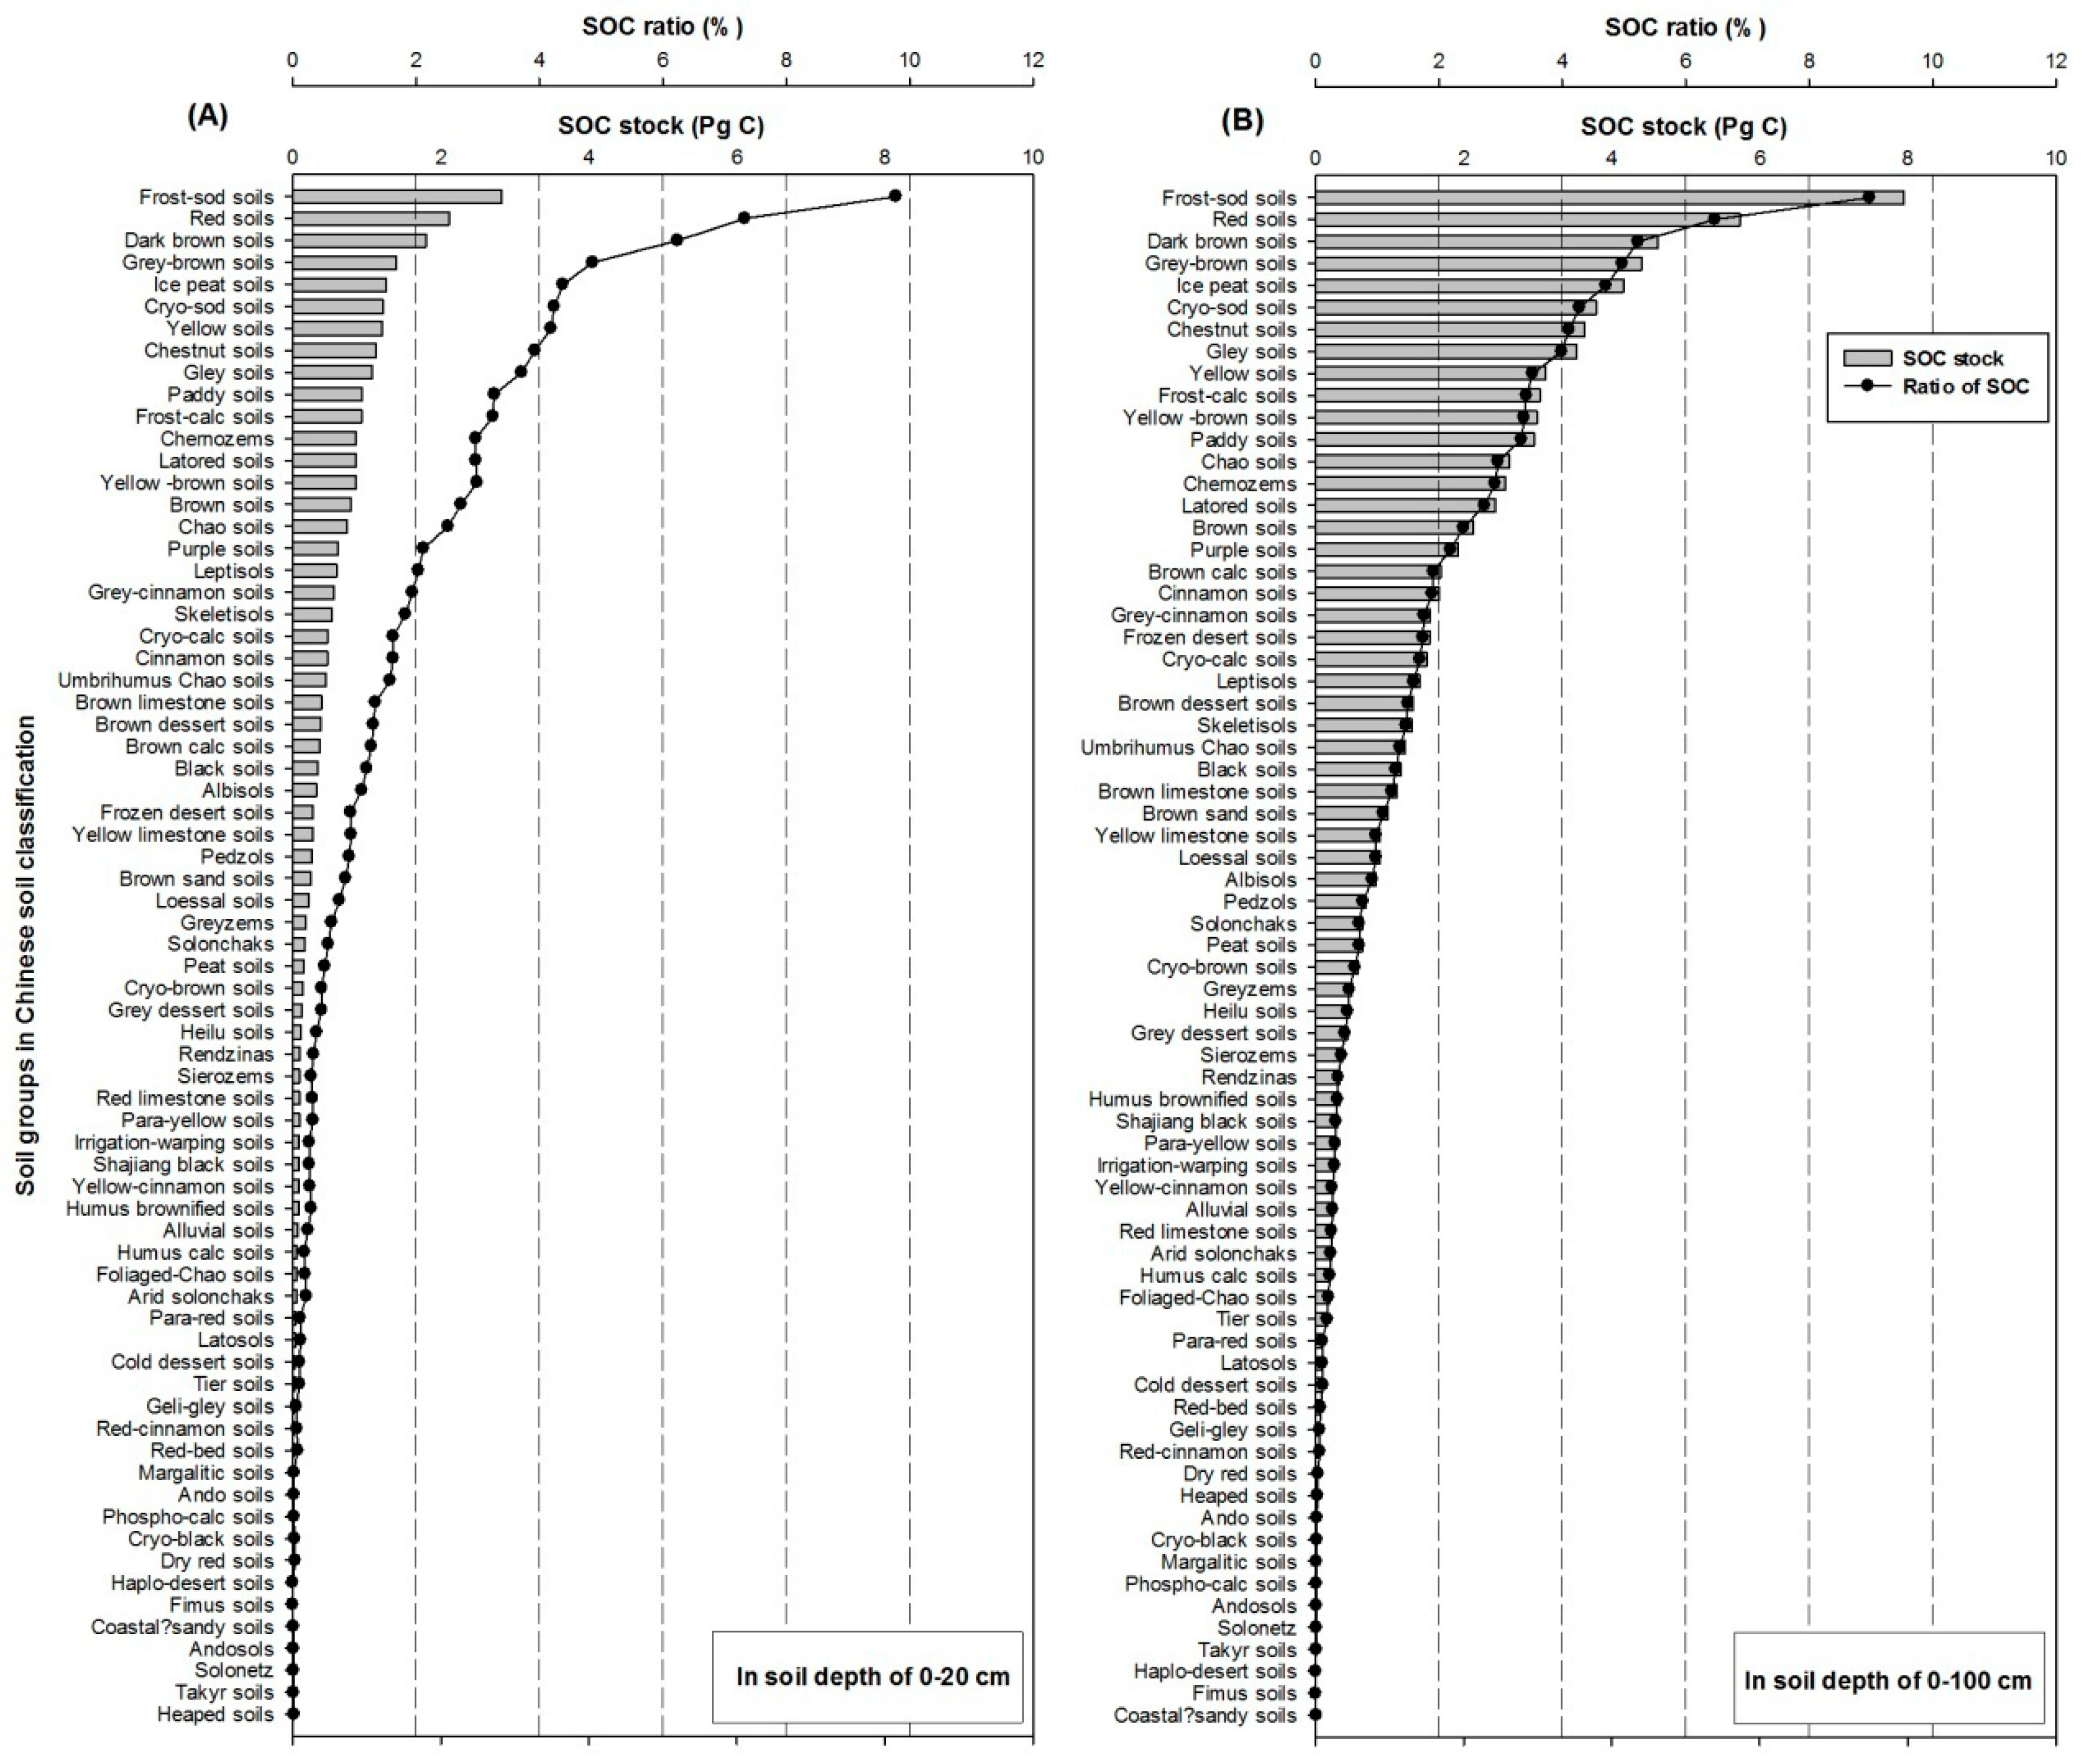
4.2. SOC Stock Estimated on 3-D Surfaces in Different Soil Groups of China

We firstly reveal the total SOC stock across China according to the estimation on 3-D surfaces in this study, and our results about the SOC stock for soil groups were different from the former ones estimated on 2-D surfaces (references in Table 1). In our study, the SOC stock in soils at the depth of 0–100 cm was estimated to be the greatest for Frost-sod soil, with a value of 7.95 Pg C, accounting for 8.98% of all soil groups, while that in red soil was estimated to be greater than 5 Pg C (5.73 Pg C), accounting for 6.47% of all soil groups (Figure 1). However, the results of Xie et al. [13] revealed that the SOC in Frost-sod soil was 7.27 Pg C, accounting for 8.61%, and that in red soil was 5.39 Pg C, accounting for 6.39%. These differences can be contributed to by the increment of the 3-D surface area relative to the planimetric one. In another study on the 3-D surface by Yu et al. [15], the SOC stock in red soil was estimated to be 6.02 Pg C, which was even greater than our results. Although these comparisons can give some relevant findings, they should be considered as references on the general differences among results from 2-D and 3-D surfaces because many uncertainties occurred among the current studies and it is impossible to conduct scientific statistical analysis on comparisons among different studies unless a future work commences a new investigation.
As Meersmans et al. [6] indicated, too many studies investigated SOC and/or total SOC stocks at different soil depths at a regional scale, where it was concluded that land use appears to have a strong influence on the SOC content in the top soils but does not play a significant role at a depth deeper than 1 m, which hinted a stronger effect of the upper soil layer on the SOC ratio. However, the SOC ratios in our study were not statistically different between the soils at the two depths. The result of the SOC ratio is a relative parameter and is not affected by the absolute values of soil depths. Comparing our results of SOC ratios with those obtained on 2-D surfaces [13], it can be found that our values were higher in soil groups with greater SOC stock. For example, at the depth of 0–20 cm, the highest SOC ratios in our study were 9.78% and 7.33% for frost-sod soil and red soil, respectively, but values for these two soils were only 9.41% and 7.27%, respectively, in the work of Xie et al. [13]. In soils at the depth of 0–100 cm, our results showed values of 8.98% and 6.47% which were higher in comparison with 8.61% and 6.39%, respectively. However, SOC ratios for some soil groups, such as latosol, humus calc soil, and red-bed soil, showed greater values in Xie et al. [13] than those in this study. Of course some uncertainties also existed due to a lack of scientific analysis on the comparisons, but we still consider the SOC ratio to be a reasonable parameter for comparing SOC stock statuses among studies due to its relative property, which can eliminate additional impacts (e.g., surface area estimation and soil depth) on comparing results.

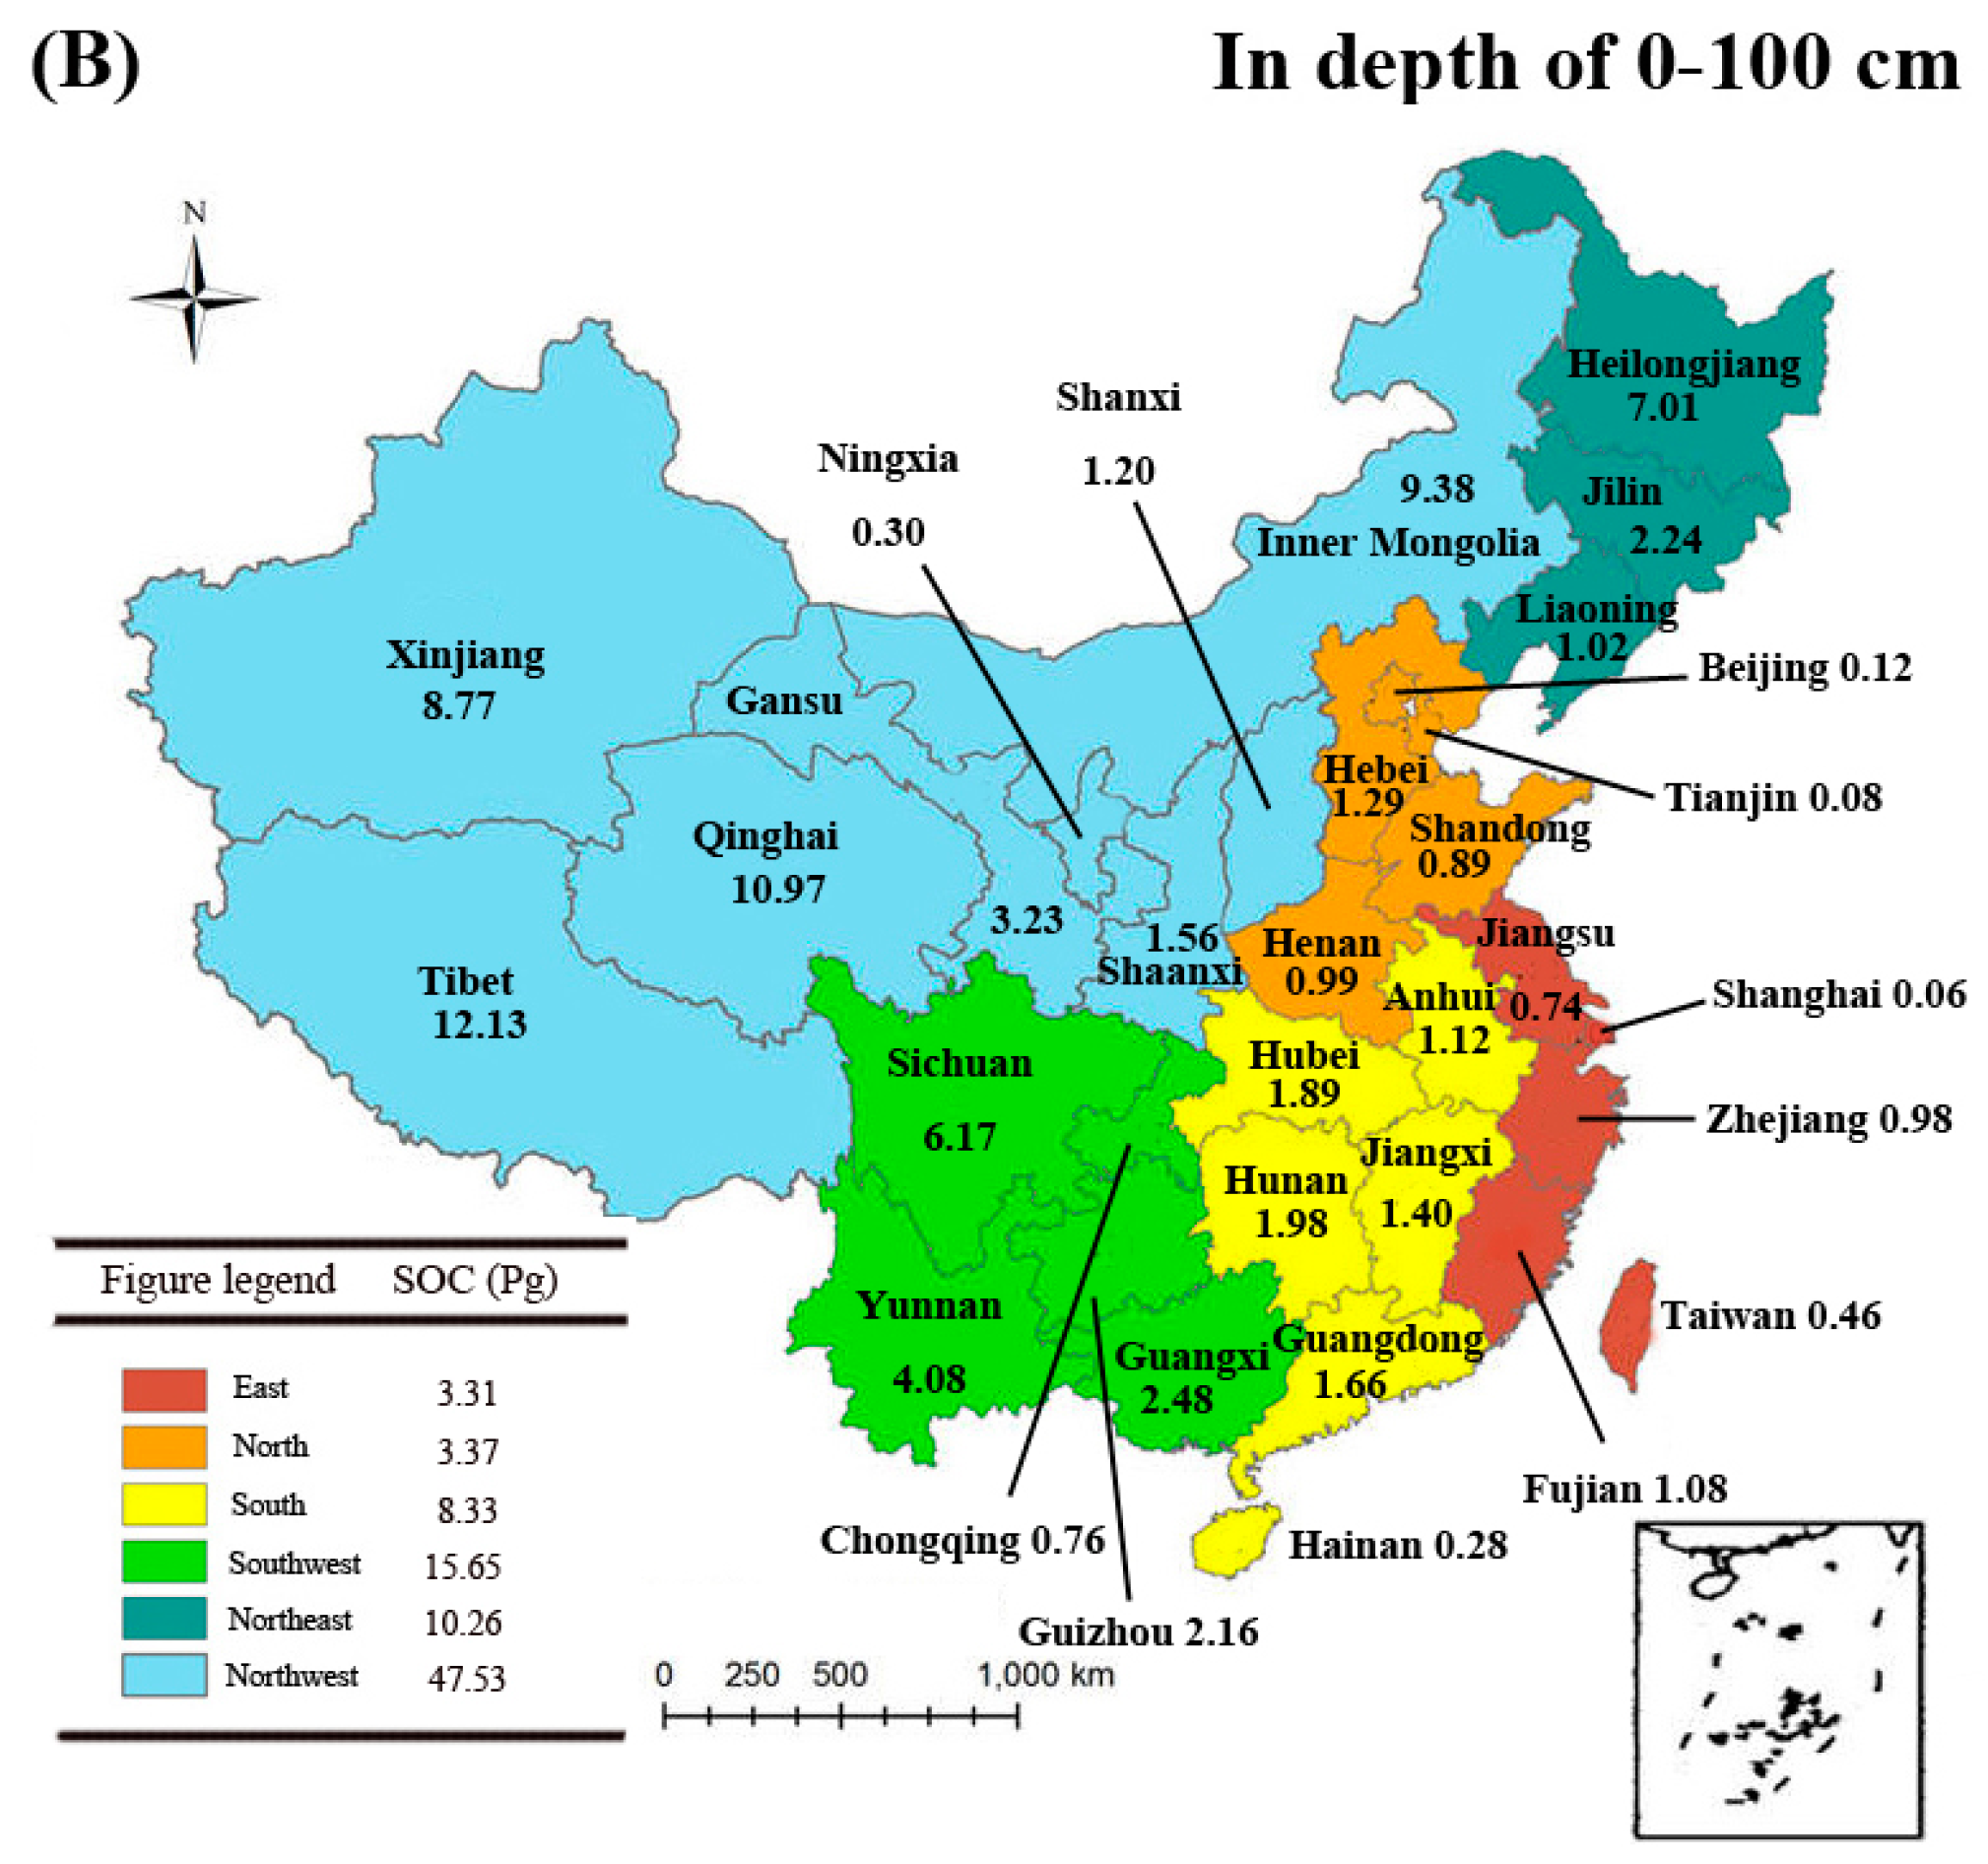
4.3. SOC Stock Estimated on 3-D Surfaces in Different Regional Provinces of China

The SOC stock for regional provinces was estimated to be greater on 3-D surfaces in our study compared to those on 2-D ones. Taking the SOC at the depth of 0–100 cm, for instance, the greatest SOC reserve was estimated from Tibet and Qinghai Provinces in northwestern China, whose values are 12.13 Pg C and 10.97 Pg C, respectively, while provinces with the lowest SOC reserves were estimated to be Beijing and Hainan, where the SOC stocks were estimated to be 0.12 Pg C and 0.28 Pg C, respectively (Figure 2). Results from Li et al. [14] revealed that the SOC stock in these four provinces was estimated to be only 10.44, 10.43, 0.11, and 0.27 Pg C, respectively. Increments of SOC stock for both soil groups and regional provinces in China result from the increment of the area, because the area is not involved in the calculation of SOCD. Our results regarding SOCD were almost the same as those of others in studies from China [11,12,13,14,15] and from other countries [7,30,31].
Our results showed that the whole Chinese SOC reserve is 88.46 Pg C in the soil at the depth of 0–100 cm, which was greater than the estimates of Pan [8], Wu et al. [11,12], Xie et al. [13], Li et al. [14], and Wei et al. [17] (Table 1). With regard to this, we accept our second hypothesis. The increased SOC by our estimation can probably be attributed to the increased areas estimated on 3-D surfaces in the soils of every region. The under-estimation of SOC on planimetric areas has also been indicated in some studies on national scales [6,7,24]. However, our results regarding the total SOC stock was found to be lower than those estimated by Wang et al. [9,10], Yu et al. [15,16], and Xie et al. [18]. This may be caused by at least three possible explanations. Firstly, the total area in Wang et al. [9,10] was estimated to be only 877.63 × 10⁴ km2, which is lower than our result of 962.62 × 10⁴ km2 (Table 2). This is a typical instance to illustrate the increment of SOC stock in our study. Secondly, the soil areas in Yu et al. [15,16] were evaluated to be 928.1 × 10⁴ km2 but the SOCD therein was evaluated to be much higher than ours due to the 1:1 M map scale they performed. Thirdly, Xie et al. [18] changed their data source to be soil series of China based on their former study [13], and this may have contributed to the higher SOC stock in Xie et al. [18] compared to that in both our study and in Xie et al. [13].
Using the data from soil groups, we found well-regressed relationships between areas on 3-D surfaces and the SOC stock or SOC ratio (Figure 3). This supports our third hypothesis and confirms the scientific meaning of the 3-D surface estimation performed in this study. With the increase of areas on 3-D surfaces, the SOC stock increased more swiftly at the depth of 0–100 cm compared to 0–20 cm, suggesting that the thicker the soil layers that are investigated, the greater the SOC stock that will be predicted by this regression. Unlike the results of the SOC stock, however, with the increase of the soil areas, increases of the SOC ratios in soils at both depths showed a generally similar trend as the surface area, but their fit curves appeared to start to differentiate from each other when surface areas increased up to 50 × 104 km2 (Figure 3B). With regard to this, among all Chinese soil groups, only four soils types, i.e., red soil, brown sand soil, frost-calc soil, and brown dessert soil, might have a higher SOC ratio in deeper soil layers as predicted by the regression.

4.4. Future Work Suggestions

Although we found some values of the SOC on the 3-D surface as they were described above, there were still some uncertainties in our results because the 3-D surface in this study was estimated using a new algorithm without significant special analysis on 3-D surface technically. However, the estimation performed in the present study fully considered the undulation of landforms as a means of approximating the soil surface area, and we deem it necessary to estimate SOC stock using 3-D method at the national scale of China in order to acquire a reliable result. In the future, DEM data with a higher spatial resolution will enable more accurate estimates of SOC stocks and should be considered in relevant studies. We also hope our method will be applied at local scales in more regions of other countries and even at the global scale for SOC stock estimation. Because the 90 m SRTM DEM data conceal very small terrain changes, the actual surface area remains greater than the estimate obtained using the 3-D surface method based on 90 m DEM data. It may therefore be possible to generate a more accurate estimate of SOC stock in China with DEM data at a higher spatial resolution. Moreover, the SOCD and soil depth may vary considerably when the topography is different, especially in very steep regions. Therefore, our estimate on SOC stock in soils at depths of 0–100 cm with the 3-D surfaces may be overestimated because the soil depth may less than 100 cm in very steep regions. We suggest that future work be conducted in these regions.

5. Conclusions

Traditional estimates of SOC were performed on a planimetric area, wherein the results may have been underestimated because the factor of elevation contributing to the SOC estimate was not involved. Therefore, we estimated the SOC stock in China in soils at depths of 0–20 cm and 0–100 cm using a new estimation method based on the 3-D surface. Our results indicated that the total area of Chinese land is 962.62 × 10⁴ km2, which is larger than most of the former 2-D results. Relative to the area on the 2-D surface, that on the 3-D surface was found to increase in most regions of China, with the greatest increment occurring in the southwestern and extreme western regions. Due to the increase of the surface area, the SOC stock was also estimated to be greater than that on the 2-D surface area for different soil groups or for regional provinces in China. As a result, the total SOC stock in the terrestrial ecosystem of China was estimated to be 28.8 Pg C and 88.5 Pg C at depths of 0–20 cm and 0–100 cm, which corresponded to significant increases of 5.66% and 5.44% compared to those estimated by the conventional method, respectively. There was a positive relationship between the 3-D-surface area and the SOC stock or SOC ratio in the soils of China.

Acknowledgments

This research was supported by the National Natural Science Foundation of China (No. 41401507), the Strategic Priority Research Program (B) of the Chinese Academy of Sciences (No. XDB15040300), and the Frontier Project from the Institute of Soil Science, Chinese Academy of Sciences (No. ISSASIP1629).

Author Contributions

Rui Zhou, Xieli Xian, and Xianzhang Pan conceived and designed the experiments; Rui Zhou performed the experiments; Changkun Wang and Ya Liu analyzed the data; Yanli Li and Rongjie Shi contributed analysis tools; Rui Zhou wrote the initial edition of the paper, which was mainly revised to be the current edition by Xianzhang Pan and Hongxu Wei.

Conflicts of Interest

The authors declare no conflict of interest.

References

  1. Gregg, J.S.; Andres, R.J.; Marland, G. China: Emissions pattern of the world leader in CO2 emissions from fossil fuel consumption cement production. Geophys. Res. Lett. 2008, 35, 1–5. [Google Scholar] [CrossRef]
  2. Piao, S.L.; Fang, J.Y.; Ciais, P.; Peylin, P.; Huang, Y.; Sitch, S.; Wang, T. The carbon balance of terrestrial ecosystems in China. Nat. Lett. 2009, 458, 1009–1015. [Google Scholar] [CrossRef] [PubMed]
  3. Choudhury, S.G.; Srivastava, S.; Singh, R.; Chaudhari, S.K.; Sharma, D.K.; Singh, S.K.; Sarkar, D. Tillage residue management effects on soil aggregation, organic carbon dynamics yield attribute in rice–wheat cropping system under reclaimed sodic soil. Soil Tillage Res. 2014, 136, 76–83. [Google Scholar] [CrossRef]
  4. Luo, Z.; Wang, E.; Sun, O.J. Can no-tillage stimulate carbon sequestration in agricultural soils? A meta-analysis of paired experiments. Agric. Ecosyst. Environ. 2010, 139, 224–231. [Google Scholar] [CrossRef]
  5. Ogle, S.M.; Swan, A.; Paustian, K. No-till management impacts on crop productivity, carbon input soil carbon sequestration. Agric. Ecosyst. Environ. 2012, 149, 37–49. [Google Scholar] [CrossRef]
  6. Meersmans, J.; van Wesemael, B.; de Ridder, F.; van Molle, M. Modelling the three-dimensional spatial distribution of soil organic carbon (SOC) at the regional scale (Flander, Belgium). Geoderma 2009, 152, 43–52. [Google Scholar] [CrossRef]
  7. Pilaš, I.; Kušan, V.; Medved, I.; Bakšic, N.; Marjanovic, H. Estimation of soil organic carbon stocks stock changes in Croatia (1980–2006)—Use of national soil database the Corine L Cover. Period. Biol. 2013, 115, 339–347. [Google Scholar]
  8. Pan, G.X. Study on soil organic inorganic carbon of China. Bull. Sci. Technol. Soc. 1999, 15, 330–332. (In Chinese) [Google Scholar]
  9. Wang, S.Q.; Zhou, C.H.; Li, K.R.; Zhu, S.L.; Huang, F.H. Analysis on spatial distribution characteristics of soil organic carbon reservoir in China. Acta Geogr. Sin. 2000, 55, 533–543. (In Chinese) [Google Scholar]
  10. Wang, S.Q.; Zhou, C.H.; Li, K.R. Estimation of soil organic carbon reservoir in China. J. Geogr. Sci. 2001, 11, 3–12. [Google Scholar]
  11. Wu, H.B.; Guo, Z.T.; Peng, C.H. Distribution storage of soil organic carbon in China. Glob. Biogeochem. Cycles 2003, 17, 1–13. [Google Scholar] [CrossRef]
  12. Wu, H.B.; Guo, Z.T.; Peng, C.H. Land use induced changes of organic carbon storage in soils of China. Glob. Chang. Biol. 2003, 9, 305–315. [Google Scholar] [CrossRef]
  13. Xie, X.L.; Sun, B.; Zhou, H.Z.; Li, Z.P.; Li, A.B. Organic carbon density storage in soils of China spatial analysis. Acta Pedol. Sin. 2004, 41, 35–43. (In Chinese) [Google Scholar]
  14. Li, Z.P.; Han, F.X.; Su, Y.; Zhang, T.L.; Sun, B.; Monts, D.L.; Plodinec, M.J. Assessment of soil organic carbonate carbon storage in China. Geoderma 2007, 138, 119–126. [Google Scholar] [CrossRef]
  15. Yu, D.S.; Shi, X.Z.; Sun, W.X.; Wang, H.J.; Liu, Q.H.; Zhao, Y.C. Estimation of China soil organic carbon storage density based on 1:1000000 soil database. Chin. J. Appl. Ecol. 2005, 16, 2279–2283. (In Chinese) [Google Scholar]
  16. Yu, D.S.; Shi, X.Z.; Wang, H.J.; Sun, W.X.; Warner, E.D.; Liu, Q.H. National Scale Analysis of Soil Organic Carbon Storage in China Based on Chinese Soil Taxonomy. Pedosphere 2007, 17, 11–18. [Google Scholar] [CrossRef]
  17. Wei, S.G.; Dai, Y.J.; Liu, B.Y.; Zhu, A.X.; Duan, Q.Y.; Wu, L.Z.; Ji, D.Y.; Ye, A.Z.; Yuan, H.; Zhang, Q.A. China data set of soil properties for land surface modeling. J. Adv. Model. Earth Syst. 2013, 5, 212–224. [Google Scholar]
  18. Xie, Z.B.; Zhu, J.G.; Liu, G.; Cadisch, G.; Hasegawa, T.; Chen, C.; Sun, H.F.; Tang, H.Y.; Zeng, Q. Soil organic carbon stocks in China changes from 1980s to 2000s. Glob. Chang. Biol. 2007, 13, 1989–2007. [Google Scholar] [CrossRef]
  19. Hole-Filled SRTM for the Globe Version 4, the CGIAR-CSI SRTM 90 m Database. Available online: http://srtm.csi.cgiar.org (accessed on 7 April 2008).
  20. Jenness, J.S. Calculating landscape surface area from digital elevation models. Wildl. Soc. Bull. 2004, 32, 829–839. [Google Scholar] [CrossRef]
  21. Li, W.H.; Gong, J.H. Quantitative simulation for difference between true surface area planimetric area. Appl. Res. Comput. 2008, 25, 983–985. (In Chinese) [Google Scholar]
  22. McGarigal, K.; Tagil, S.; Cushman, S.A. Surface metrics: an alternative to patch metrics for the quantification of landscape structure. Landsc. Ecol. 2009, 24, 433–450. [Google Scholar] [CrossRef]
  23. Zhang, Z.M.; van Coillie, F.; de Wulf, R.; de Clercq, E.M.; Ou, X.K. Comparison of surface planimetric landscape metrics for mountainous land cover pattern quantification in Lancang Watershed, China. Mt. Res. Dev. 2012, 32, 213–225. [Google Scholar]
  24. Zhang, Y.; Zhao, Y.C.; Shi, X.Z.; Lu, X.X.; Yu, D.S.; Wang, H.J.; Sun, W.X.; Darilek, J.L. Variation of soil organic carbon estimates in mountain regions: A case study from Southwest China. Geoderma 2008, 146, 449–456. [Google Scholar] [CrossRef]
  25. Batjes, N.H. Total carbon nitrogen in the soils of the world. Eur. J. Soil Sci. 1996, 47, 151–163. [Google Scholar] [CrossRef]
  26. Zhou, H.Z. Sharing of soil information data distributed inquiry data base of 1:4 M soil information of China. Acta Pedol. Sin. 2002, 39, 483–489. [Google Scholar]
  27. ESRI ArcScript. Available online: http://arcscripts.esri.com/ (accessed on 1 August 2013).
  28. Li, W.; Mao, L.; Bo, M. Incorporating topography in a cellular automata model to simulate residents evacuation in a mountain area in China. Phys. A Stat. Mech. Its Appl. 2013, 392, 520–528. [Google Scholar]
  29. Sun, R.H.; Zhang, B.P.; Chen, L.D. Regional-scale identification of three-dimensional pattern of vegetation landscapes. Chin. Geogr. Sci. 2014, 24, 104–112. [Google Scholar] [CrossRef]
  30. Hoffman, U.; Yair, A.; Hikel, H.; Kuhn, N.J. Soil organic carbon in the rocky desert of northern Negev (Israel). J. Soils Sediments 2012, 12, 811–825. [Google Scholar] [CrossRef]
  31. Olson, K.R. Soil organic carbon sequestration, storage, retention loss in US croplands: Issues paper for protocol development. Geoderma 2013, 195, 201–206. [Google Scholar] [CrossRef]
Figure 1. Distribution and ratio of soil organic carbon (SOC) in soils at depths of 0–20 cm (A) and 0–100 cm (B) in representative soil groups of China.
Sustainability 08 01003 g001
Figure 2. Spatial distributions of SOC mass (Pg C) in soils at depths of 0–20 cm (A) and 0–100 cm (B) estimated on the 3-D surfaces in provinces in China.
Sustainability 08 01003 g002aSustainability 08 01003 g002b
Figure 3. Relationships between areas on 3-D surfaces and SOC stock (A) or SOC ratio (B) in soils at depths of 0–20 cm and 0–100 cm in China. All data were originated from estimations of different soil groups, i.e., area-values were obtained from Table 2 and values of SOC stock and SOC ratio were obtained from Figure 1.
Sustainability 08 01003 g003
Figure 4. Spatial distributions between the increase ratio of the 3-D surface area compared with the planimetric one in China.
Sustainability 08 01003 g004
Table 1. Estimates on SOC stock in terrestrial systems of China in soils at depths of 0–100 cm using different estimation methods.
SOC Stock (Pg)Number of Soil ProfilesReferences
Data source from China Soil Map at the scale of 1:4 M
92.42473Wang et al. [9,10]
70.334,411Wu et al. [11,12]
84.42456Xie et al. [13]
83.82456Li et al. [14]
Data source from China Soil Map at the scale of 1:1 M
89.17292Yu et al. [15,16]
72.58979Wei et al. [17]
Data source from soil series of China
50.02500Pan [8]
89.62473Xie et al. [18]
Table 2. Estimates on areas and soil organic carbon densities (SOCD) of different soil groups estimated on 3-D surfaces.
Soil Groups in Chinese Soil ClassificationSoil AreaSOCD (kg·m−2)
Distribution (104 km2)Ratio (%)Depth of 0–20 cmDepth of 0–100 cm
Red soils69.417.213.048.25
Brown sand soils65.666.820.381.49
Frost-calc soils58.926.121.595.14
Brown dessert soils55.525.770.682.38
Chao soils45.114.691.615.81
Frost-sod soils40.454.26.9619.64
Frozen desert soils37.063.850.734.15
Cryo-sod soils36.093.753.3910.5
Chestnut soils35.433.683.1910.27
Dark brown soils30.63.185.8715.12
Yellow soils30.573.183.9510.25
Paddy soils30.183.143.129.79
Purple soils28.963.012.116.68
Yellow-brown soils26.552.763.2411.22
Skeletisols26.422.741.994.93
Brown calc soils26.32.731.46.28
Latored soils25.612.663.349.47
Brown soils25.142.613.128.46
Cinnamon soils23.862.481.977
Leptisols23.552.452.55.98
Chernozems19.52.034.3813.17
Loessal soils19.2321.144.51
Gley soils16.161.686.6221.83
Solonchaks12.511.31.345.02
Grey-brown soils11.891.2311.7837
Cryo-calc soils11.641.214.0312.88
Grey-cinnamon soils9.230.966.0416.84
Grey dessert soils8.460.881.595.06
Black soils8.40.874.113.7
Brown limestone soils7.850.824.9214.16
Albisols7.790.814.1510.8
Umbrihumus Chao soils6.890.726.5817.62
Yellow limestone soils6.410.674.2713.56
Sierozems6.110.631.426.1
Cold dessert soils6.070.630.521.72
Heilu soils5.980.621.867.75
Cryo-brown soils5.60.582.4210.12
Shajiang black soils5.030.521.565.78
Yellow-cinnamon soils4.440.461.826.21
Arid solonchaks3.850.41.625.75
Alluvial soils3.750.391.926.51
Pedzols3.390.357.7827.63
Foliaged-Chao soils3.10.321.836.13
Irrigation-warping soils3.050.322.548.88
Greyzems2.950.316.1916.54
Humus calc soils2.440.252.268.35
Ice peat soils2.360.2553.46176.46
Tier soils2.130.221.537.93
Red limestone soils1.940.24.7711.71
Para-red soils1.930.21.865.11
Rendzinas1.490.156.5622.17
Red-bed soils1.480.151.464.82
Para-yellow soils1.310.147.1821.48
Humus brownified soils1.180.127.227.04
Red-cinnamon soils1.130.121.695
Latosols1.060.113.538.85
Takyr soils0.850.090.271.19
Dry red soils0.680.071.584.91
Peat soils0.540.0627.91115.93
Coastal sandy soils0.30.030.551.57
Solonetz0.220.021.022.99
Geli-gley soils0.150.0212.3140.27
Ando soils0.150.023.7411.18
Heaped soils0.140.013.6419.55
Cryo-black soils0.110.018.0715.29
Andosols0.110.011.697.04
Haplo-desert soils0.10.010.471.21
Margalitic soils0.090.016.114.51
Phospho-calc soils0.050.0112.6716.49
Fimus soils0.0403.510.35
Total962.62100
Table 3. Provincial area distributions of SOC in soils of China on 3-D surfaces.
RegionProvincesArea (×104 km2)Regional Sum (×104 km2)
SouthAnhui14.3094.62
Hubei19.54
Jiangxi17.27
Hunan22.09
Guangdong18.00
Hainan3.43
SouthwestChongqing8.86147.68
Sichuan53.36
Guangxi25.02
Guizhou18.83
Yunnan41.63
EastJiangsu9.7037.98
Shanghai0.67
Fujian12.78
Zhejiang10.93
Taiwan3.90
NorthHebei19.1354.22
Henan16.86
Shandong15.38
Beijing1.71
Tianjin1.13
NortheastJilin19.4179.82
Liaoning14.75
Heilongjiang45.66
NorthwestGansu42.22574.60
Inner Mongolia115.24
Ningxia5.27
Qinghai74.22
Shanxi16.25
Shaanxi22.00
Tibet128.73
Xinjiang170.66
Total 988.93
Table 4. Statistics of average elevations for different increase rates.
Increase Rate (%)Soil Class NumberAverage Elevation (m)
0–124876.86
1–5221174.67
5–10171655.33
>1082829.59

