1. Introduction
Research indicates that electric vehicles are not only able to decrease vehicle emissions [
1] and slow global warming [
2], but also are able to enhance the sustainability of road traffic in the future [
3]. With energy, environment and other issues becoming increasingly prominent, many countries began to realize the importance of environmentally-friendly electric vehicles. Most manufacturers also have started to develop and commercialize environmentally-friendly electric vehicles [
4]. However, electric vehicles are currently limited by insufficient charging infrastructures and driving mileage (the longest driving range per battery charge). Considering that car sharing is more suitable for people’s short-term travel demands, the combination of electric vehicles and car sharing is a good way to avoid these weaknesses and to provide a cleaner transport mode.
Certain cities in the world, such as Barcelona, Paris, Berlin, Hamburg, Rotterdam and Stockholm, are implementing electric vehicle sharing (EVS) [
5]. In China, EVS is still in the initial development phase. China Car Club in Hangzhou and Eduoauto in Beijing are the pioneers for developing EVS. China Car Club was invested in by Intunecapital in early 2013, and it is based on the model of self-purchasing cars. Eduoauto is based on the model of light assets, and the operational vehicles are mainly provided by enterprises qualified for car rental, not bought by the company itself. eHi Car Services launched a pilot EVS program in Jading district of Shanghai in June 2013, but the progress is very slow. At present, there are several EVS services, such as EVCARD hosted by Shanghai International Automobile City, YiKaZuChe in Beijing, Weigongjiao in Hangzhou,
etc.In recent years, governments have begun to attach more importance to EVS, which contributed to the rapid development of EVS. In July 2014, the General Office of the State Council in China released the No. 35 document of “Instructions on accelerating the promotion and application of new energy vehicles” [
6], which emphasized the needs of “exploring innovative business models, such as the time-sharing leasing, car sharing, vehicle leasing, mortgage purchase for new energy vehicles,
etc.”. The EVS program also has received support from the local governments. The Beijing Municipal Science and Technology Commission has listed EVS as a key supported project and set up many operational indicators. Other cities, such as Shanghai, Hangzhou, Shaoxing, Ningbo, Wuhan, Shenzhen, Yancheng, Chongqing, and so on, have launched or are actively ready to launch an EVS program.
From the analysis above, it can be known that the number of EVS enterprises operating is few, and most of them lack experience. With the support from the government, there will be more and more domestic companies involved in EVS in the next few foreseeable years. Nevertheless, how consumers think about EVS, whether they will use the service and their related preference are still unclear. Therefore, in order to promote all-round development of EVS and to help the enterprises achieve better operation, a questionnaire was designed to collect information about the acceptance of consumers and influencing factors for using EVS. Some suggestions are provided for EVS operators to promote its rapid development in China.
2. Literature Review
In the late 1980s, a preliminary model of car sharing appeared abroad. However, scholars started to research car sharing in the 1990s. At the beginning of the research, most studies were at the qualitative level, and scholars paid more attention to the feasibility of the car sharing model and consumer usage. Based on a large number of empirical studies, Meijkamp [
7] in The Netherlands pointed out that car sharing as an alternative to private cars, because it had higher economic and ecological efficiency. Barth and Shaheen [
8] had an opinion that car sharing could improve the traffic efficiency by reducing the number of private cars and improve the efficiency of energy and emissions. They also introduced a variety of car sharing systems and described the development prospect of car sharing in China. Prettenthaler and Steininger [
9] researched how driving mileage influenced the car sharing users to make decisions. Results showed that using car sharing was better than using private cars when user’s travel range was less than 18,000 km per year. However, if insurance and the vehicle depreciation rate are taken into account, the balanced driving distance of users decreased to 15,000 km. Seik [
10] studied car sharing in Singapore and found that members still mainly used public transport for travelling to work after attaining membership, but turned more often to shared cars rather than public transport for marginal uses, such as leisure and social trips. Most of them chose car sharing for its marginal use and cost savings.
Entering the 21st century, foreign scholars gradually began to study the operation system of car sharing, the optimization of staff, site layout, vehicle allocation,
etc., from the quantitative perspective. Barth and Todd [
11] used a computer to simulate the distribution of available vehicles and energy consumption in car sharing sites. Results showed that the influencing factors of the car sharing system were the proportion of demand, the charging strategy for the electric vehicles and the vehicle allocation algorithm. The main problems of the car sharing service that should be considered at the beginning of the establishment were service pricing, target customer selection, vehicle type selection, site location,
etc. [
12]. Xu and Lim [
13] established a mathematical model for the vehicles sharing site layout in Singapore and used the improved neural network model to predict the car sharing net flows. Kek
et al. [
14] provided a three-stage decision optimization model for the car sharing operator. They analyzed the optimal distribution of staff and vehicles and used operational data from the Singapore sharing company to verify the model. Correia and Antunes [
15] had studied the problem of car sharing site planning. Under the goal of maximizing the profit for the car sharing operating company, they established a mixed integer programming model to solve the unbalanced number of sharing cars between different sites.
At present, there are few research works on EVS abroad, and most of them focus on operating status analysis and consumer surveys. Quantitative studies on EVS are rare. Alessandro
et al. [
16] introduced the EVS project of Green Move and studied the shared service strategies and objectives. By investigating the feasibility of EVS as a private car for elderly, Shaheen
et al. [
17] found that 30% of respondents were interested in participating, but all participants would make a plan before they would use the car, indicating that EVS still has the range anxiety problem. This problem is caused by the limited driving range of electric vehicles. Using data from 533 members of the EVS program in Seoul, Kim
et al. [
18] found that the participants were rather reluctant to change their car ownership, but had intensions to continue participating in the program. Social and economic perspectives were the most important factors affecting the participants’ attitudes. In addition, the attitudes varied depending on personal characteristics, such as gender, age and income.
Domestic research progress on the car sharing model is relatively late. In 2000, Huang and Yang [
19] were the first to research car sharing and introduced its development history abroad. They summarized the benefits of this new public transport pattern, the impact on travel behavior and its possible target market (people who have no private cars or have a high cost of ownership). Market demand, quality of service and advanced public transportation are important factors for successful car sharing. Ye and Yang [
20] summarized and introduced the concept, development status and influence of car sharing. They also explained its characteristics (low-cost, flexible) and target group (replacement selection for people who wanted to buy a second car). Gao [
21] explained the concept of “shared car” in detail and presented the concept of “Auto Club”. Its development prospect in China was also studied. Qiu [
22] analyzed the key influencing factors for car sharing development in China. Results showed that educational level of respondents, number of owned private cars and convenience of EVS had impacts on consumers’ use willingness. Xue
et al. [
23] combed the classification of car sharing and analyzed the impact of this service on car ownership, travel cost, usage cost, energy savings and emission reduction. Through an empirical study, they found that the target group of car sharing was people who are 25–40 years old and have an above average educational level. The model of Zipcar in the United States was studied by Wu [
24]. He investigated the potential market of car sharing service in Guangzhou and demonstrated the significance of promoting car sharing. He pointed out that car sharing is very promising in China and will be an alternative to other means of transportation. By introducing the development of car sharing in Hanover, He [
25] pointed out that a shared car could replace 6–10 private cars and radically reduce automobile usage. Xia
et al. [
26] had carried out empirical research on an informal car sharing service in Beijing from the perspective of economic and ecological efficiency. They suggested that the government should regulate such an industry and formulate relevant policies to support the development of shared services.
From the analysis above, it is obvious that domestic research on EVS is very small in quantity. More studies are focused on the operating model description, case analysis and the prospect forecast of traditional vehicle sharing. From the perspective of operators, a questionnaire was implemented in Shanghai to find factors affecting consumers’ use willingness of electric vehicle sharing, including travel characteristics, expectation of EVS and socio-demographics and then proposed corresponding suggestions for station location, driving range choice and model selection for EVS. At the same time, the target group and potential market in Shanghai for using EVS were pointed out. This will help the operations of enterprises effectively.
4. Analysis Results
4.1. Descriptive Statistics
4.1.1. Demographic Variable
Table 3 illustrates the demographic characteristics of respondents. As shown in
Table 3, most respondents are male (61.6%), which is higher than the proportion of women. The main age groups are 20s and 30s, which should be the major groups for using EVS. Forty one-point-seven percent of respondents are single, and the percentage of married having kids is 37.6%. Fifty eight-point-six percent of people have private cars, and 7.9% of them even have two or more cars. Most respondents (68.3%) had a Bachelor’s degree or above. The monthly income is mainly concentrated in 3001–10,000 yuan (49.1%), and more than 15,000 yuan or below 1000 yuan are the least, which accords with the research. The distribution of the occupation is relatively balanced overall. Ordinary staff and technical staff account for 20.2%, respectively.
Table 3.
Descriptive statistics for the demographic characteristics of respondents.
Table 3.
Descriptive statistics for the demographic characteristics of respondents.
| Variable | Description | Percentage |
|---|
| Gender | Male | 61.6% |
| Female | 38.4% |
| Age | Under 18 | 1.5% |
| 18–25 | 28.1% |
| 26–30 | 30% |
| 31–40 | 24.6% |
| 41–50 | 8.4% |
| Above 50 | 5.4% |
| Number of owned private cars | None | 41.4% |
| One | 50.7% |
| Not less than two | 7.9% |
| Marital status | Single | 41.7% |
| Married, but have no child | 20.7% |
| Married and have kids | 37.6% |
| Educational level | Junior high school and the following: | 3.6% |
| Senior high school | 10.2% |
| Junior college | 17.9% |
| Bachelor’s | 49.1% |
| Master’s and above | 19.2% |
| Occupation | Party and government cadre/teacher/police | 7.2% |
| Clerk | 20.2% |
| Business owner/shareholder, etc. | 4.3% |
| Technicist | 20.2% |
| Worker/server | 5.4% |
| Company management personnel | 7.9% |
| Freelancer | 5.4% |
| Retired staff/student | 29.4% |
| Personal monthly income | Under 1000 yuan | 5.3% |
| 1000–3000 yuan | 18.5% |
| 3001–6000 yuan | 26.6% |
| 6001–10,000 yuan | 24.0% |
| 10,001–15,000 yuan | 10.6% |
| Above 15,001 yuan | 6.6% |
| No fixed income | 8.4% |
4.1.2. Travel Characteristics
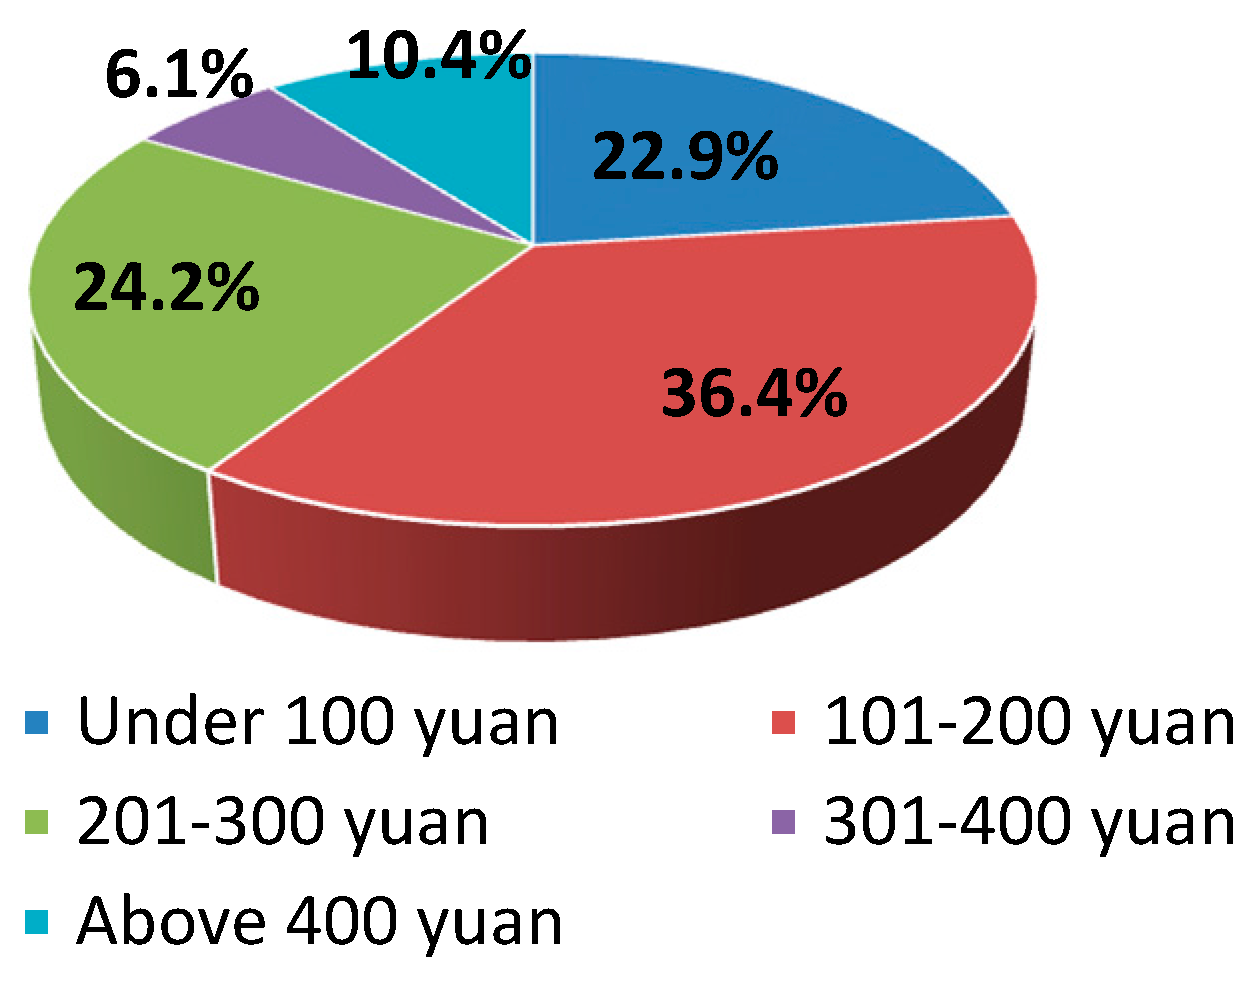
As shown in
Figure 1, 83.5% of percipients have a monthly transportation expenditure within 300 yuan. The percentage spending more than 400 yuan monthly is only 10.4%. In the aspect of factors considered when choosing the trip mode, most respondents consider time primarily. The secondary is travel purpose, and cost is the least considerable factor (
Figure 2). The above result conforms to the normal situation that residents in big cities consider travel time, cost, convenience, safety and comfort when they choose the trip mode [
30].
Figure 1.
Distribution of monthly transportation expenditure.
Figure 1.
Distribution of monthly transportation expenditure.
Figure 2.
Factors considered when choosing the trip mode.
Figure 2.
Factors considered when choosing the trip mode.
4.1.3. Expectations for EVS
With assistance from the investigators, respondents had preliminarily knowledge of EVS. The percentage of people who chose to use EVS is 42.4%. About 27% of people kept a neutral stance, which means quite a few people still maintain a wait-and-see attitude towards new things. This will be a customer resource to pursue during the development of EVS in the near future. The distribution of use willingness is shown as
Figure 3.
Figure 3.
Whether to choose EVS.
Figure 3.
Whether to choose EVS.
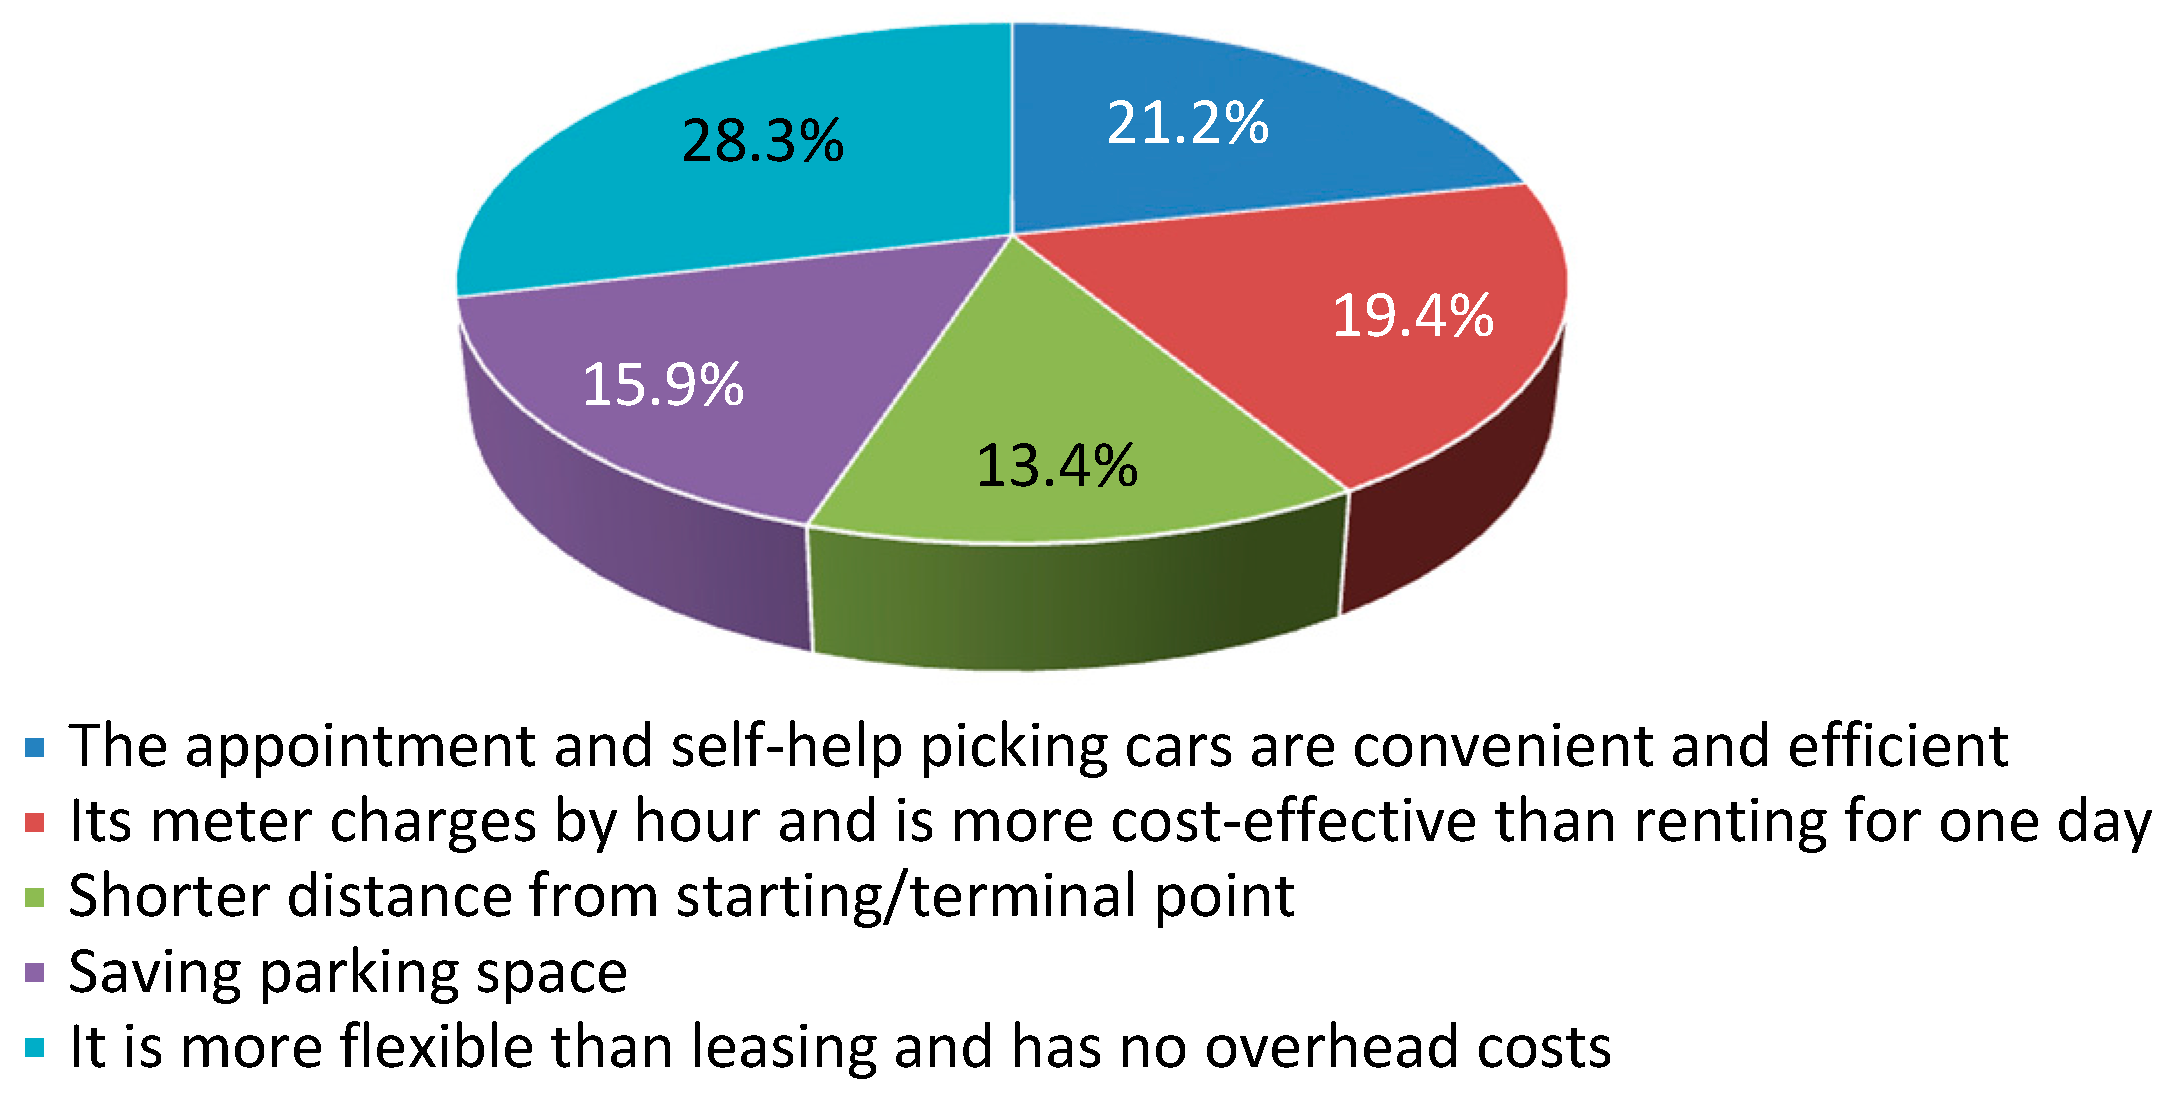
When the respondents were asked about the attractiveness of EVS, their opinions were rather dispersed. More respondents selected the options of “the appointment and self-help picking cars are convenient and efficient”, “it charges by hour and that is more cost-effective than renting for one day” and “it is more flexible than leasing and has no overhead costs” (as shown in
Figure 4). It can be concluded that most consumers pay more attention to the convenience and economic benefits of the EVS service. Therefore, the service price should be as low as possible to offer consumers a chance to experience its economy and convenience, thus enlarging customer population.
Figure 4.
Attractive points of using EVS.
Figure 4.
Attractive points of using EVS.
When the respondents were asked about the suitable usage scenario of EVS, the two options that had the largest proportions are shopping and entertainment, with percentages of 22.1% and 23.8%, respectively (
Figure 5). As a result, stations for EVS can be deployed around shopping malls, entertainment and leisure centers, so it can be convenient for users to rent and return vehicles.
Figure 5.
Suitable usage scenario of EVS.
Figure 5.
Suitable usage scenario of EVS.
For the question of suitable vehicle type for EVS, respondents said that compact, small or mini cars would be more suitable. Cars of the A0 segment (small cars) accounted for the highest percentage of 27.2%. Respondents also preferred compact cars and mini cars (
Figure 6). This also suggests that EVS is mainly used to meet people’s needs for daily short-distance flexible transportation, and their demand for space is small.
Figure 6.
Suitable vehicle types for EVS.
Figure 6.
Suitable vehicle types for EVS.
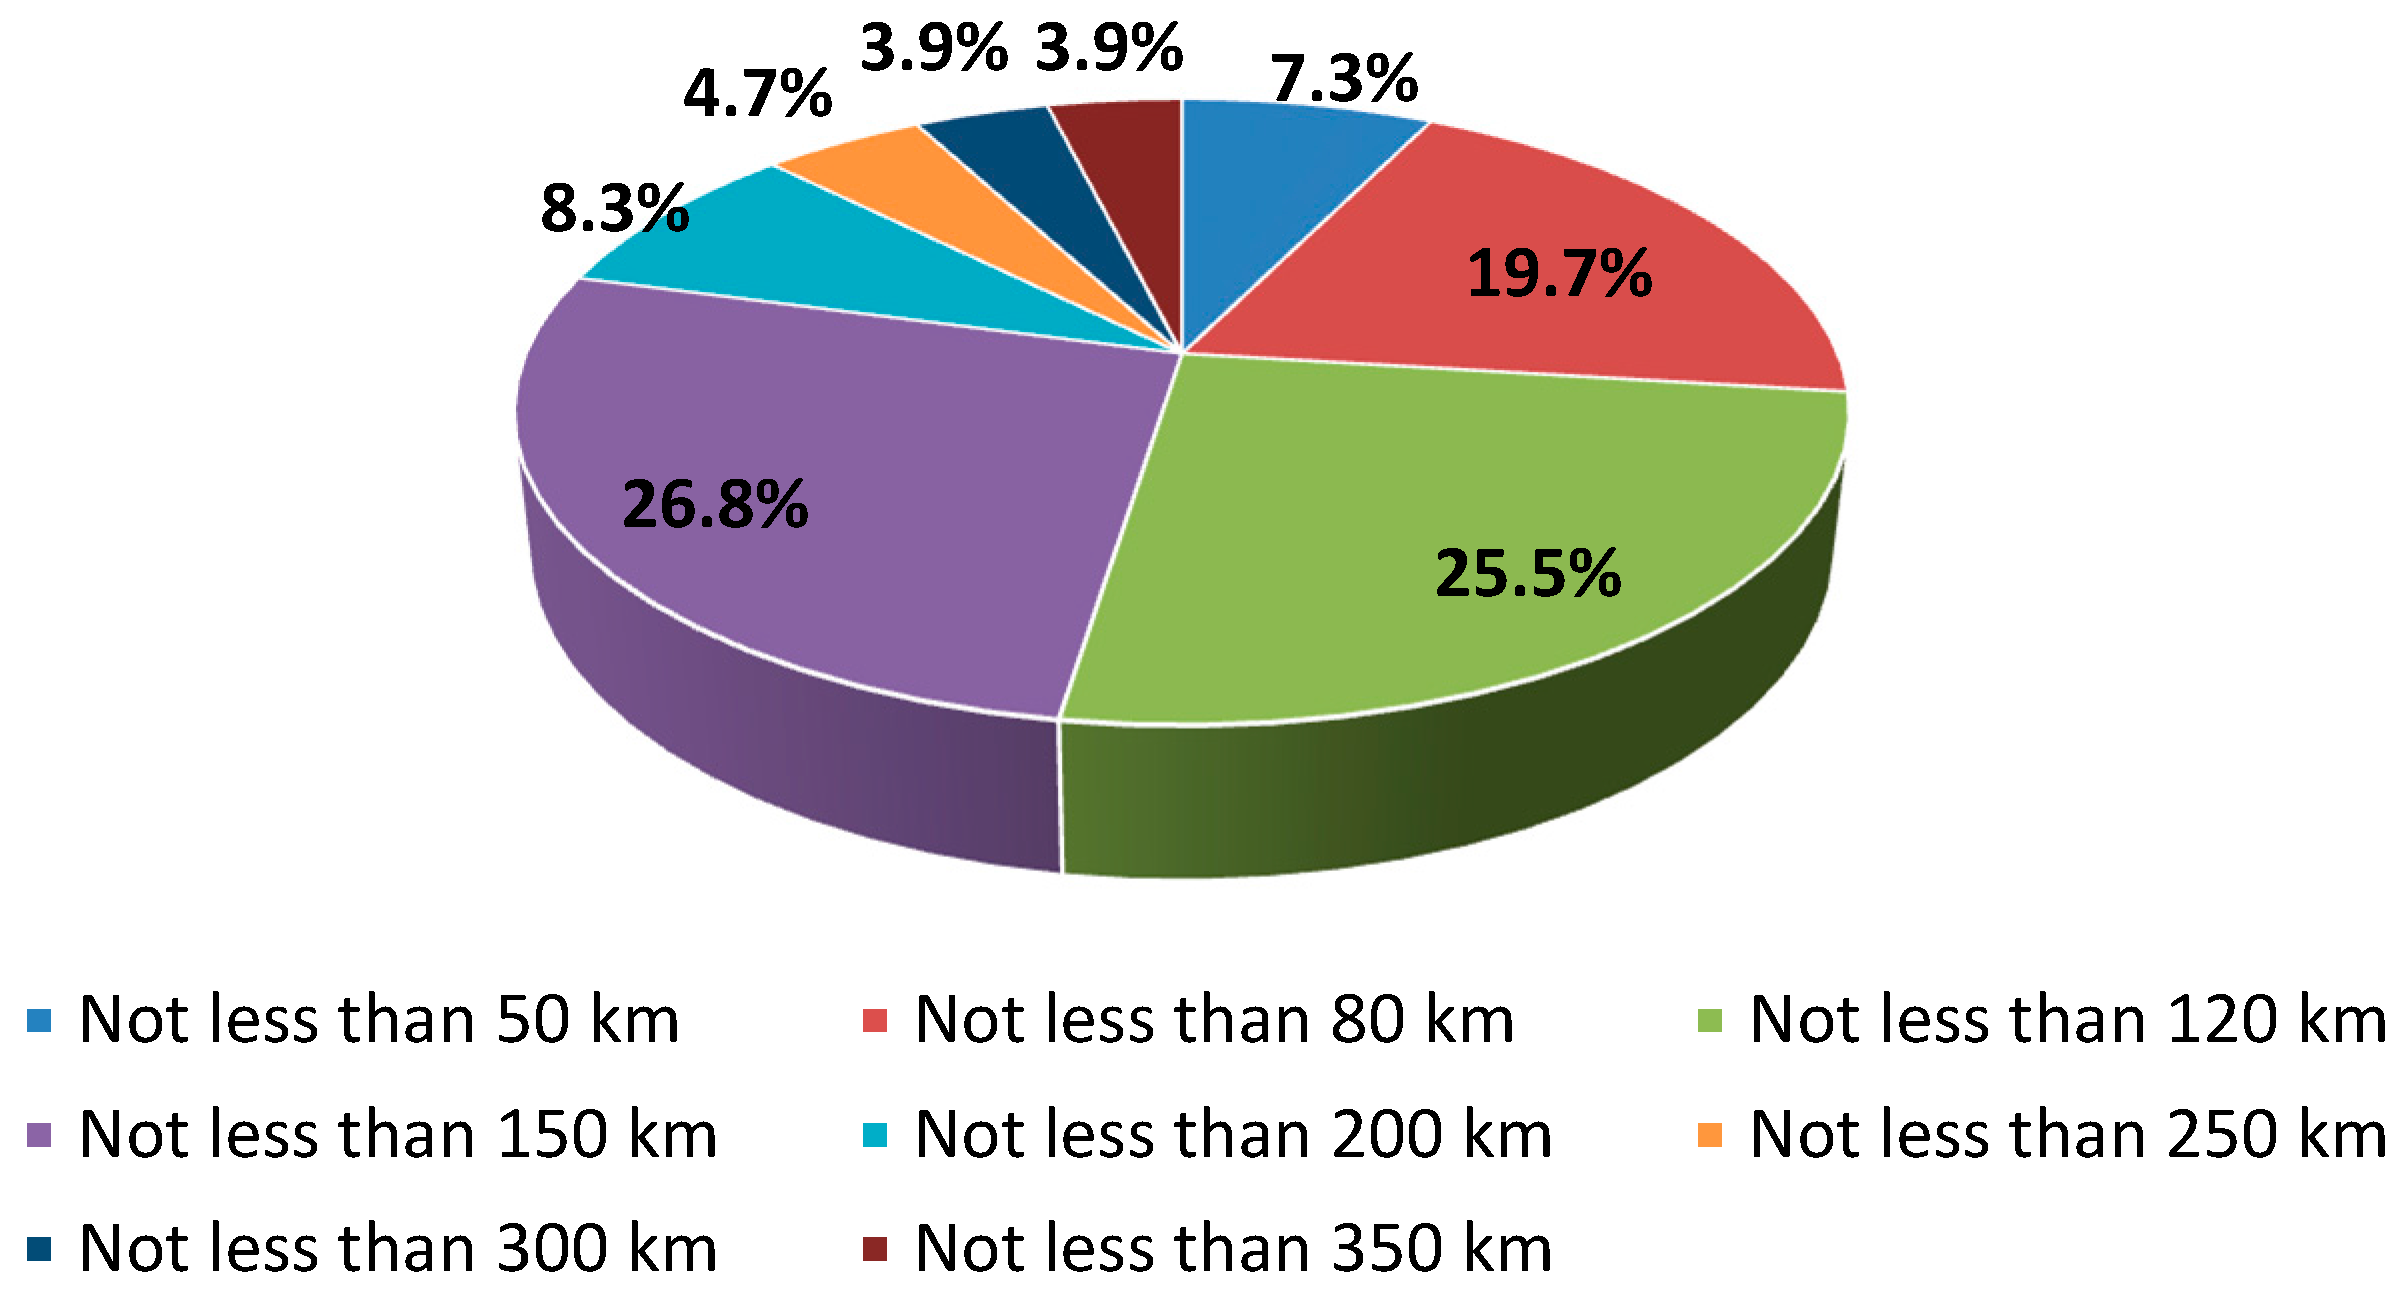
When asked about the acceptable minimum driving range of electric vehicles, 26.8% of respondents held the opinion that it should not be less than 150 km, as shown in
Figure 7. The sum of percentages for “not less than 50 km”, “not less than 80 km”, “not less than 120 km” and “not less than 150 km” is 79.2%. A deep travel behavior investigation was done in 2014 with 67 residents in Shanghai. All travel behaviors were recorded for 14 days, including trip mode, time, distance,
etc. The results show that the average travel distance for a single trip is 15.8 km, and the average daily travel range is 33.8 km, which is far lower than what the mainstream models on the market can offer. Another research work showed that when consumers were asked about the driving range for private electric vehicles, 35.8% of them responded that it should be between 120 km and 160 km [
31]. Thus, it can be seen that most participants have higher tolerance towards the driving range of shared electric vehicles than private ones.
Figure 7.
Acceptable minimum driving range of EV.
Figure 7.
Acceptable minimum driving range of EV.
4.2. Statistics in Cross Tabulation Table
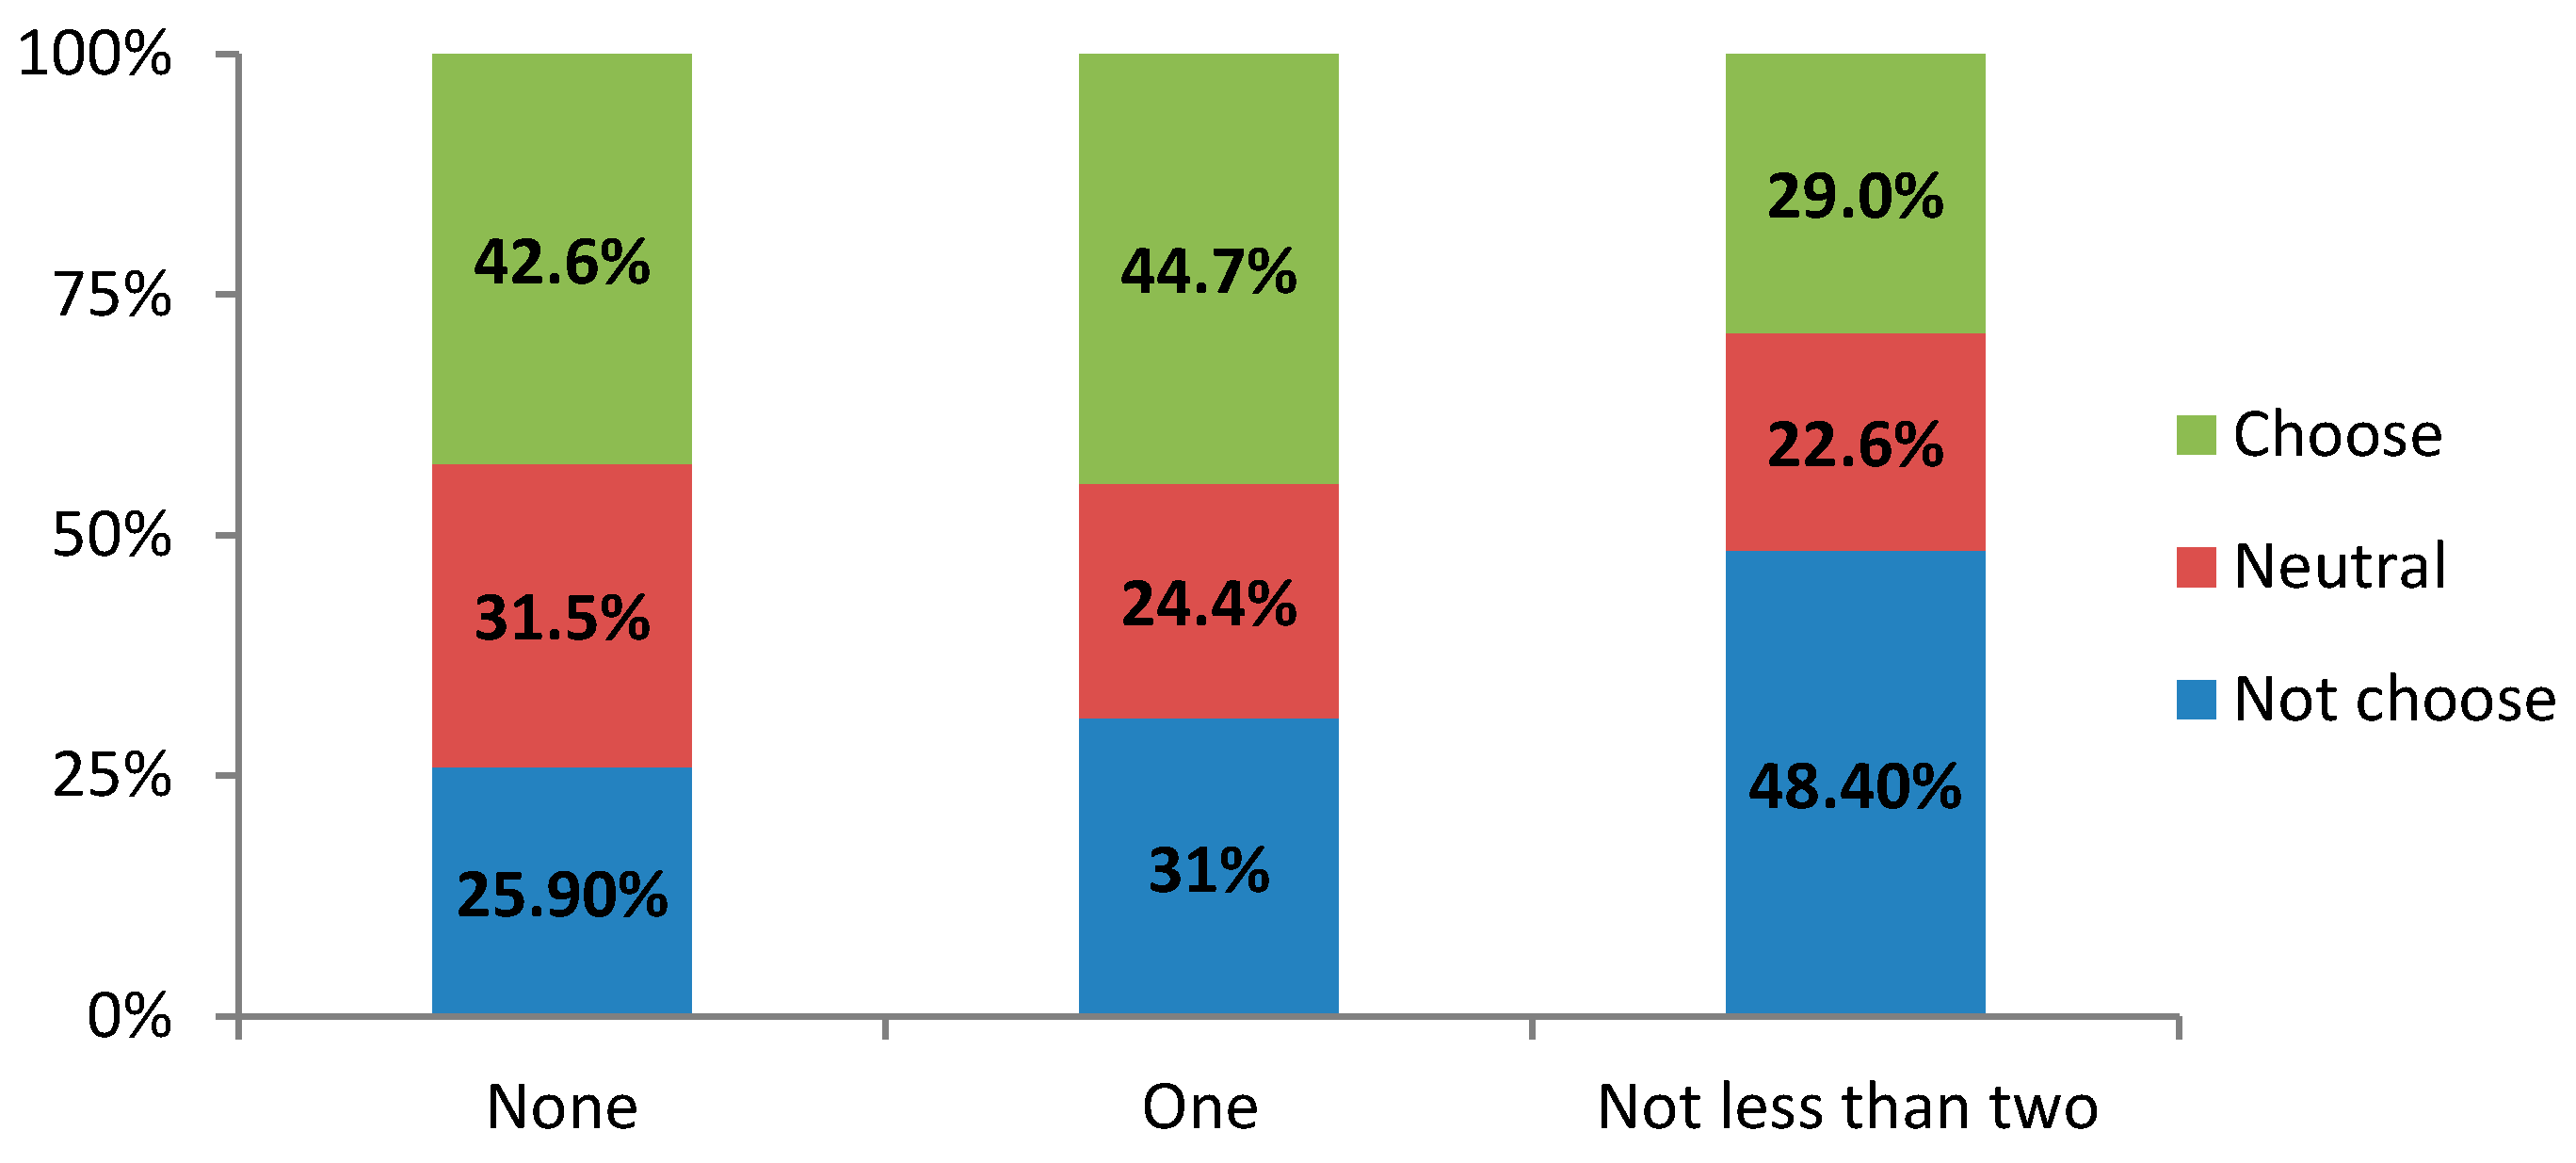
Figure 8 indicates that the number of owned private cars has an impact on the willingness to use EVS.
(1) With an increase in the number of owned private cars, the ratio of people who are willing to use the service shows a declining trend soon after rising. That is to say, the EVS acceptance of people in possession of only one private car is higher than that of people who do not have or have more than one private car. The reasons for this phenomenon may be that: (i) people in possession of private cars have more driving experience, and it is easier for them to accept a new transportation pattern; (ii) the EVS is a new type of transportation, and even the people who have a private car want to experience this new transportation system; (iii) because of severe traffic jams during rush hour, parking difficulty and high parking fees, a car owner is more willing to choose EVS as a method for short trips; (iv) the economic environment of people who have two or more private cars is better, and they tend not to consider whether the means of travel is economical. Compared to people who only have one car, reducing their usage willingness is also reasonable. At the same time, it also indicates that the target group of EVS is not only the people who have no private cars.
Figure 8.
The relationship between willingness and the number of owned private cars.
Figure 8.
The relationship between willingness and the number of owned private cars.
(2) Along with the increase of owned private cars, people’s attitude towards whether to adopt EVS becomes clearer. The ratio of keeping neutral decreases.
4.3. Multinomial Logistic Regression for the Target Group
In this paper, the dependent variable is the choice willingness for EVS (“will not choose” is coded as one, “keeping neutral” as two, “will choose” as three). In order to define the target group of EVS, multinomial logistic regression was used. Independent variables were selected from three aspects: (1) travel characteristics (including main trip mode in daily use and monthly transportation expenditure), (2) expectations for EVS (including acceptable minimum driving range of the EV, acceptable maximum duration for going to stations, acceptable maximum duration for the waiting and handling procedure and acceptable highest price of EVS) and (3) demographic characteristics (including gender, age, number of owned private cars, marital status, educational level, occupation and personal monthly income).
4.3.1. Model Fitting Test
SPSS20.0 was used to analyze the questionnaires, and
Table 4 shows the likelihood ratio test for the final model and the intercept-only model. Here, the value of chi-squared is equal to the difference value between the −2 log likelihood in the intercept-only model and the final model. The significance level of the chi-squared test was 0.001, which is far less than 0.05. Therefore, the final model is superior to the intercept-only model, which means that the final model is established, and the fitting effect is significantly good. The indexes of Cox and Snell R-squares, Nagelkerke R-squared and McFadden R-squared were used to test the explainable degree of the equations on the variation of the explained variables. The bigger the R-squared is, the better the goodness of fit is. The value of these three indexes are 0.353, 0.400 and 0.204, and they indicate that independent variables can explain 35.3%, 40% and 20.4% of the variation of the explained variables. Although the three R-squared values are not very high, the result is acceptable.
Table 4.
Model fitting information.
Table 4.
Model fitting information.
| Model | Model Fitting Criteria | Likelihood Ratio Tests | R2 |
|---|
| −2 log likelihood | Chi-square | Sig. | Cox and Snell | Nagelkerke | McFadden |
|---|
| Intercept-only | 762.673 | - | - | - | - | - |
| Final | 607.323 | 155.350 | 0.001 | 0.353 | 0.400 | 0.204 |
4.3.2. Coefficient Test of Variables
Table 5 shows the likelihood-ratio test in the final model for each independent variable. Through the statistical results, it can be seen that main trip mode in daily use, monthly transportation expenditure, acceptable minimum driving range of the EV, acceptable highest price of EVS, age and marital status have significant influences on the willingness to use EVS when the significance level is 0.1 [
18]. People who usually take the subway or bus for daily transportation have a strong willingness to use EVS. People with a high monthly transportation expenditure are more likely to pursue the economical mode of EVS. Marital status often decides whether the respondents need to buy private cars, and this has a great impact on the decision to use the EVS service. The driving range of EV affects respondents’ decisions of whether to choose the shared service instead of other modes of transportation. Respondents aged between 20 and 40 years old show a stronger receptivity to new things and the concept that they must have private cars is weaker. This makes them more willing to use the EVS service.
Table 5.
Likelihood ratio test.
Table 5.
Likelihood ratio test.
| Effect | Model Fitting Criteria | Likelihood Ratio Tests |
|---|
| −2 log likelihood of reduced model | Chi-square | Sig. |
|---|
| Intercept | 607.323 a | 0.000 | 0.000 |
| Main trip mode in daily use | 632.206 | 24.883 | 0.015 |
| Monthly transportation expenditure | 631.696 | 24.373 | 0.002 |
| Acceptable minimum driving range of EV | 638.755 | 31.432 | 0.005 |
| Acceptable maximum duration for going to stations | 611.525 | 4.202 | 0.379 |
| Acceptable maximum duration for waiting and handling procedure | 612.404 | 5.081 | 0.279 |
| Acceptable highest price of EVS | 615.445 | 8.122 | 0.087 |
| Gender | 611.914 | 4.591 | 0.101 |
| Age | 633.589 | 26.266 | 0.003 |
| Number of owned private cars | 610.889 | 3.566 | 0.468 |
| Marital status | 624.302 | 16.979 | 0.002 |
| Educational level | 620.193 | 12.870 | 0.116 |
| Occupation | 624.859 | 17.536 | 0.229 |
| Personal monthly income | 621.654 | 14.331 | 0.280 |
4.3.3. Parameter Estimation Results
Table 5 and
Table 6 show the parameter estimation results of different groups. The reference category for the dependent variable is choose not to use. The reference categories for the independent variables are in black bold, as shown in
Table 1.
If the estimated coefficient of a factor (B) is significantly positive, then the probability of this factor belonging to the current category level is higher than the probability of it belonging to the reference category, with all of the other factors being fixed [
32].
Estimated Model Results of the Choose to Use Group
As shown in
Table 6, the factors of main trip mode in daily use, monthly transportation expenditure, driving range of electric vehicles, gender, age, marital status and occupation are statistically significant. The following is a detailed analysis of these results. (1) People who usually take the subway, bus or bike are more willing to use EVS. (2) With the increase of monthly transportation expenditure, its regression coefficient changes from negative to positive, which indicates that the higher the monthly transportation expenditure is, the more consumers prefer to choose EVS. (3) The driving range of electric vehicles has a significant influence on consumers’ willingness to use EVS, with a negative coefficient. The absolute value of the coefficient increases as the driving range of electric vehicles increases, indicating that when the driving range of electric vehicles is higher, more consumers tend not to use EVS services. This result conflicts with previous expectations. The reasons may be that EVS is designed to provide a short commute for people, and the driving range of general electric vehicles has been able to meet that demand. The total cost of the operator increases as the driving range of electric vehicles increases, and then, the single use price for EVS may increase. For reasons of travel economy, consumers are more reluctant to use this business. It should be pointed out that the front reason is just guesswork; further research is required to give more information and to find out the cause. (4) Gender is significant to consumers’ use willingness, with the probability ratio of male being 2.081-times higher than that of female. This means that males are more willing to use EVS than females. (5) Age has a significant influence on consumers’ choices, and the coefficient is positive. The absolute value of the coefficient decreases as the age increases, which indicates that consumers’ use willingness of EVS will be reduced as the age increases. People who are aged between 18 and 30 have the strongest use willingness. The reasons may be that this group is at the beginning of economic independence and usually pursue economic and effective ways to travel, and their receptivity to new modes of transportation is better. (6) Marital status is significant with a negative coefficient, indicating that the use willingness of unmarred people is lower than that of married people. This may controvert the former expectations. However, through the former analysis, the results can be obtained that people who own private cars have a stronger use willingness than people having no cars (that can be found in
Figure 8). In this investigation, 73.2% of participants having private cars are married. Therefore, the use willingness of married people being higher than that of unmarried people is understandable. From the analysis above, the population characteristics of people choosing to use EVS are male, aged between 18 and 30, and usually taking the subway and bus as the daily transportation modes.
Table 6.
Parameter estimation results: choose to use.
Table 6.
Parameter estimation results: choose to use.
| Independent Variables | B | Wald | Sig. | Exp(B) |
|---|
| Intercept | −2.283 | 1.437 | 0.231 | |
| [Main trip mode in daily use = 1]: subway | 1.705 | 2.870 | 0.090 | 5.499 |
| [Main trip mode in daily use = 2]: bus | 2.016 | 3.750 | 0.053 | 7.508 |
| [Main trip mode in daily use = 6]: bicycle | 3.226 | 7.190 | 0.007 | 25.173 |
| [Monthly transportation expenditure = 1]: 0–100 yuan | −1.260 | 3.092 | 0.079 | 0.284 |
| [Monthly transportation expenditure = 4]: 301–400 yuan | 1.606 | 3.593 | 0.058 | 4.981 |
| [Minimum driving range of EV = 4]: not less than 150 km | −1.882 | 3.523 | 0.061 | 0.152 |
| [Minimum driving range of EV = 6]: not less than 250 km | −2.564 | 4.403 | 0.036 | 0.077 |
| [Minimum driving range of EV = 7]: not less than 300 km | −4.939 | 12.600 | 0.000 | 0.007 |
| [Gender = 1]: male | 0.733 | 4.517 | 0.034 | 2.081 |
| [Age = 2]: 18–25 years old | 3.571 | 10.951 | 0.001 | 35.556 |
| [Age = 3]: 26–30 years old | 2.194 | 4.545 | 0.033 | 8.969 |
| [Marital status = 1]: single | −2.289 | 11.271 | 0.001 | 0.101 |
| [Occupation = 3]: business owner/shareholder, etc. | 2.154 | 4.159 | 0.041 | 8.619 |
Estimated Model Results of the Choose to Remain Neutral Group
As shown in
Table 7, the factors of acceptable highest price of EVS, occupation and personal monthly income have significant impacts on the use willingness of people who keep a neutral stance. The detailed analysis is as follows. (1) The acceptable highest price of EVS is significant to consumers’ use willingness with a negative coefficient, indicating that the increasing service price could reduce consumers' willingness to use it. (2) Business owners/shareholders hold a neutral opinion about the EVS service. This may relate to their existing economic and social status,
etc. These people have better living conditions, and they may not need this service to save money or improve travel conditions. (3) The probability of keeping neutral is higher than that of not choosing, which indicates that the exclusion effect of people with lower average monthly income for EVS is reduced. From the analysis above, people who keep a neutral stance have lower personal monthly income. If we want to encourage these people to change their existing attitude to use the EVS, a reasonable price should be offered to attract them to join in on the premise of guaranteeing profits.
Table 7.
Parameter estimation results: choose to remain neutral.
Table 7.
Parameter estimation results: choose to remain neutral.
| Independent Variables | B | Wald | Sig. | Exp(B) |
|---|
| Intercept | −2.888 | 1.743 | 0.187 | |
| [Acceptable highest price of EVS = 1]: 30 yuan/month + 60 yuan/h | −0.829 | 2.864 | 0.091 | 0.436 |
| [Occupation = 3]: business owner/shareholder, etc. | 1.887 | 2.924 | 0.087 | 6.598 |
| [Personal monthly income = 1]: below 1000 yuan | 2.348 | 4.402 | 0.036 | 10.463 |
| [Personal monthly income = 2]: 1000–3000 yuan | 1.767 | 4.051 | 0.044 | 5.854 |
Prediction for Use Proportion
As shown in
Table 2, most respondents are male clerks aged 26–30 years old and have an average monthly income of 3001–6000 yuan. For a respondent having these features, the probability that he will choose, not choose and keep a neutral stance can be calculated by Equations (1)–(5) according to the multinomial logistic regression results.
Therefore, the probability for a 26–30-year-old male clerk who has a personal monthly income of 3001–6000 yuan to use EVS is 72.1%.
According to the calculation method above, when other factors remain unchanged, the relationship between age and the use probability ratio of male clerks who have a 3001–6000 yuan monthly income can be obtained and is shown in
Figure 9. It is possible to see that age has a great influence on personal decisions to use the EVS, which is consistent with the former analysis. People aged 18–30 are more likely to use EVS. When people’s age is more than 30 years old, the probability of not choosing is bigger than that of choosing. Additionally, as the age increases, the probability of a neutral stance increases, and consumers are more reluctant to use EVS. Furthermore, the post-1990s generation in China is growing up, and their receptivity is better than other groups. They will be the major customers of EVS in the near future. Therefore, the market space for EVS business is huge. The suggestion is that the EVS service could aim at young people aged between 18 and 30 as their customers.
Figure 9.
The relationship between age and the willingness to using EVS.
Figure 9.
The relationship between age and the willingness to using EVS.
In a similar way, when other factors keep constant, the relationship between personal monthly income and the willingness to use EVS is shown as
Figure 10. The following is the results. (1) Overall, with the increase of personal monthly income, the choice probability of individuals to use EVS decreases after rising first. When the personal monthly income is 3001–6000 yuan, the probability of choosing reaches the maximum of 72.1%. (2) When the personal monthly income is low, the probability of not choosing is high. The reason may be the relatively weak economic capacity of the low income group. When the monthly income is higher (more than 15,001 yuan), the probability of choosing is higher than that of not choosing. However, the value of the former is still below 50%, which indicates that the probability of not choosing for consumers with high monthly income (more than 15,001 yuan) is very big. This may be related to their social status, economic condition,
etc. Therefore, EVS should be geared toward the needs of the main group at middle-income level.
Figure 10.
The relationship between monthly income and the willingness to use EVS.
Figure 10.
The relationship between monthly income and the willingness to use EVS.
5. Suggestions
In the operational aspect, the following suggestions are offered for the development of EVS.
(1) According to the regression analysis results (
Table 6 and
Table 7), people who are male, aged between 18 and 30 and usually taking the subway and bus as the daily transportation mode are the target group for using EVS. Combined with the probability calculation (
Figure 9 and
Figure 10), the suggestion is that operators should pay more attention to young people who are 18–30 years old and have a middle-level income.
(2) In the early development of EVS, the type of shared electric vehicles should give priority to compact, small or mini cars.
Car sharing is designed to satisfy people’s short, temporary and flexible transportation demand. Most people will use it for shopping and entertainment (
Figure 5), and they expect that the EVS would be economical (
Figure 4). Most people who would like to use EVS are young, and their income is not very high (
Figure 10). In order to decrease consumers’ use-cost to show the economy of sharing and satisfy the need to carry certain items at the same time, the type of shared EV should focus on compact, small or mini cars. This can reduce the cost of operators and indirectly reduce the use-cost of shared cars. On the other hand, governments can offer certain subsidies to reduce the enterprises’ pressure on operating funds in the early stage. This can promote the industrialization of electric vehicles and also improve the operational enterprises' enthusiasm.
(3) In the early developmental stage, the driving range of shared electric vehicles should reach 120 km.
More than half of the respondents (
Figure 7) said the driving range of shared electric vehicles should reach 120 km at least, which indicates that most people hold tolerant attitudes towards the problem of driving range. However, there were more than a quarter of people who hoped that the driving range could reach 150 km. From regression the result in
Table 6, it is indicated that the increasing driving range will decrease consumers’ use willingness (the reason is stated in
Section 4.3.3). Therefore, in the early stage of development, for reasons of cost, capital,
etc., it is recommended that the driving range of shared electric vehicles should reach 120 km.
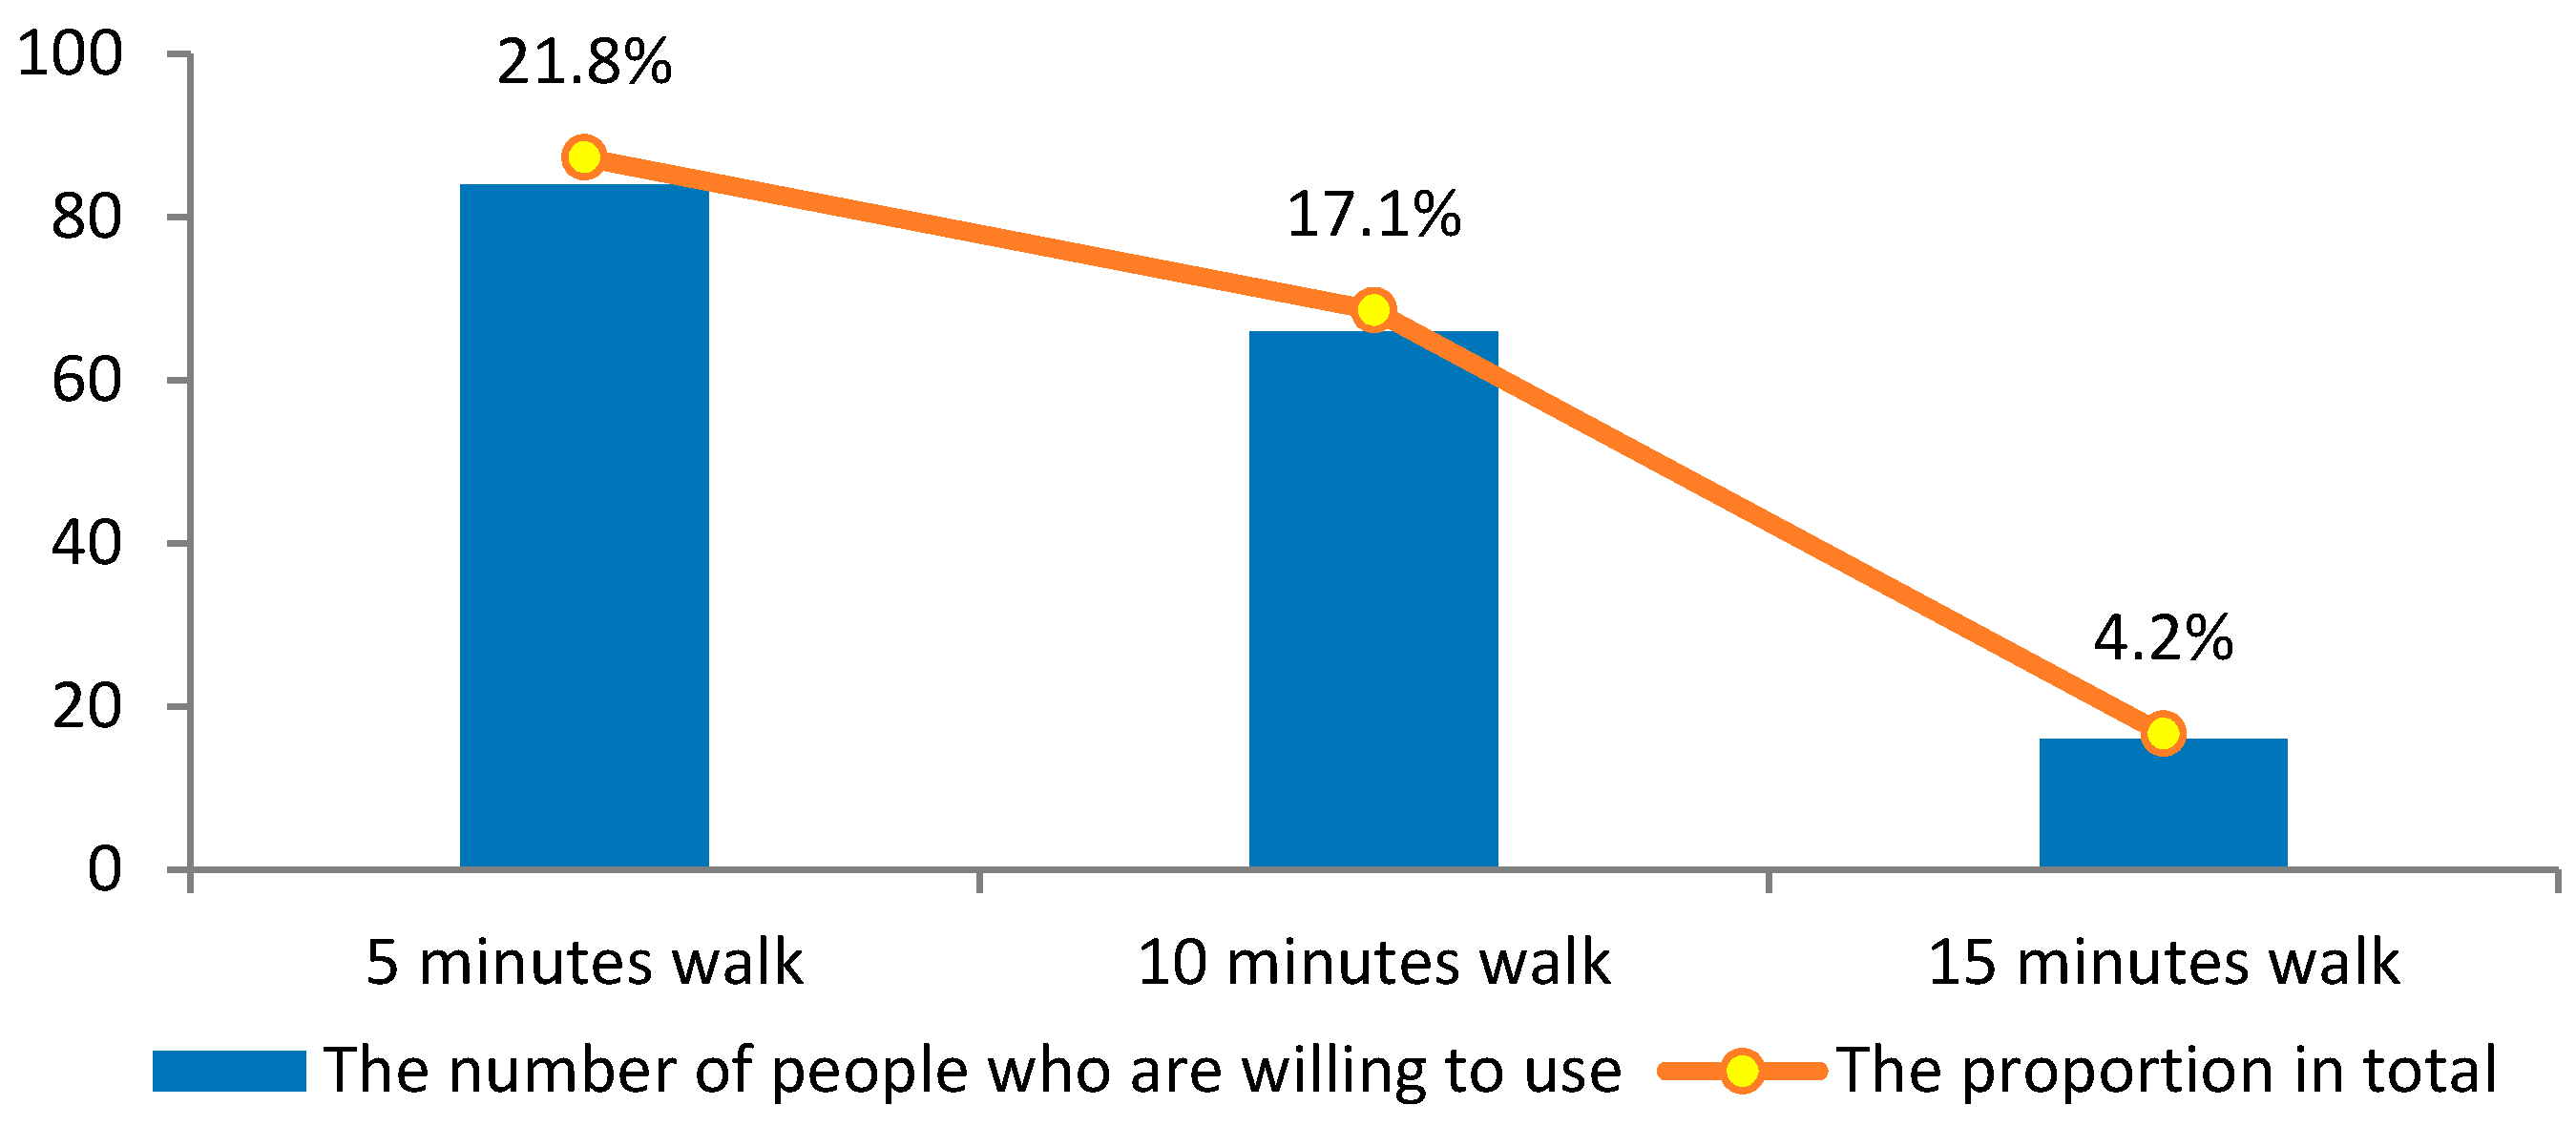
(4) When laying out the sites, the walking time for consumers to stations should be controlled to be within 10 min.
Theoretically, the walking time for consumers to the stations should be as short as possible, which means more sites are needed. However, more sites mean large amounts of money for investment, and it is also likely to cause high operational and maintenance cost, a low utilization rate,
etc. Therefore, a reasonable number and layout of sites are needed to improve vehicle utilization, reduce operating costs, and at the same time, meet consumers’ need for the convenient usage of cars. According to
Figure 11 and
Figure 12, 92.5% of participants accept the walking time within 10 min. When the walking time increases from five to 10 min, the percentage of people who are willing to use EVS decreases by 4.7%, which is acceptable. Considering the cost and utilization rate, the suggestion is that the walking time for consumers to the station should be controlled to be within 10 min.
Figure 11.
Acceptable maximum duration for going to stations (N = 385).
Figure 11.
Acceptable maximum duration for going to stations (N = 385).
Figure 12.
The relationship between time for going to stations and use willingness (N = 385).
Figure 12.
The relationship between time for going to stations and use willingness (N = 385).
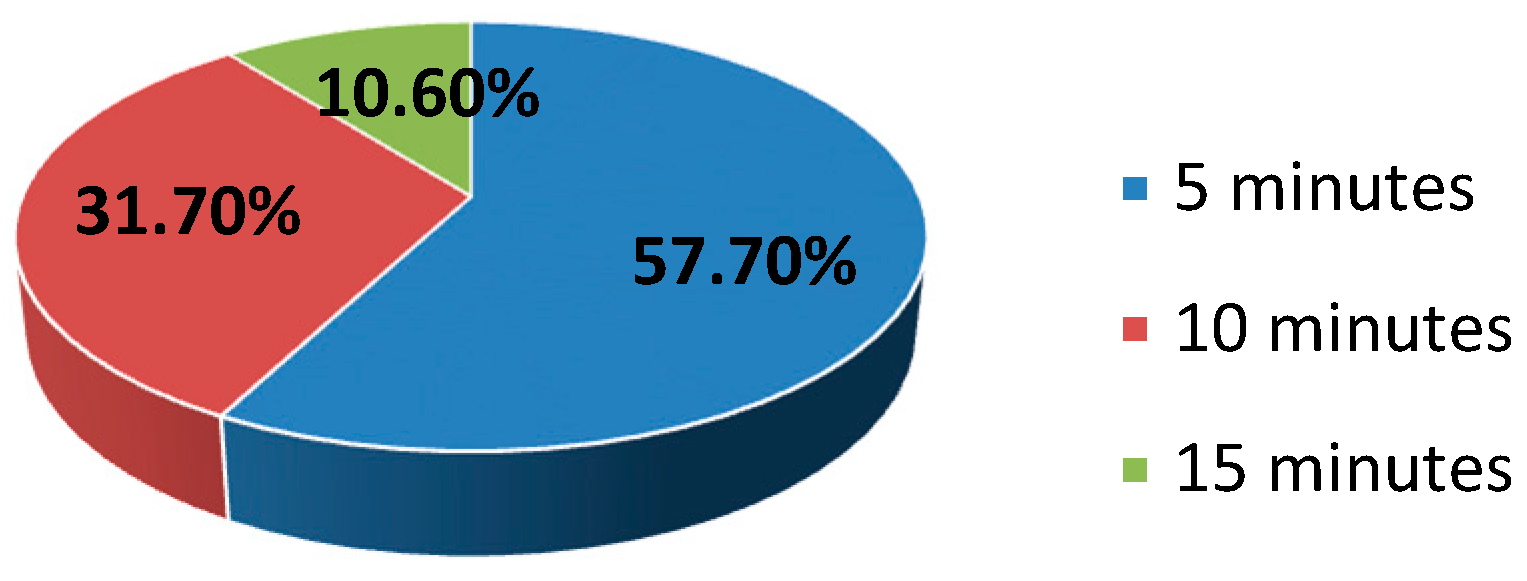
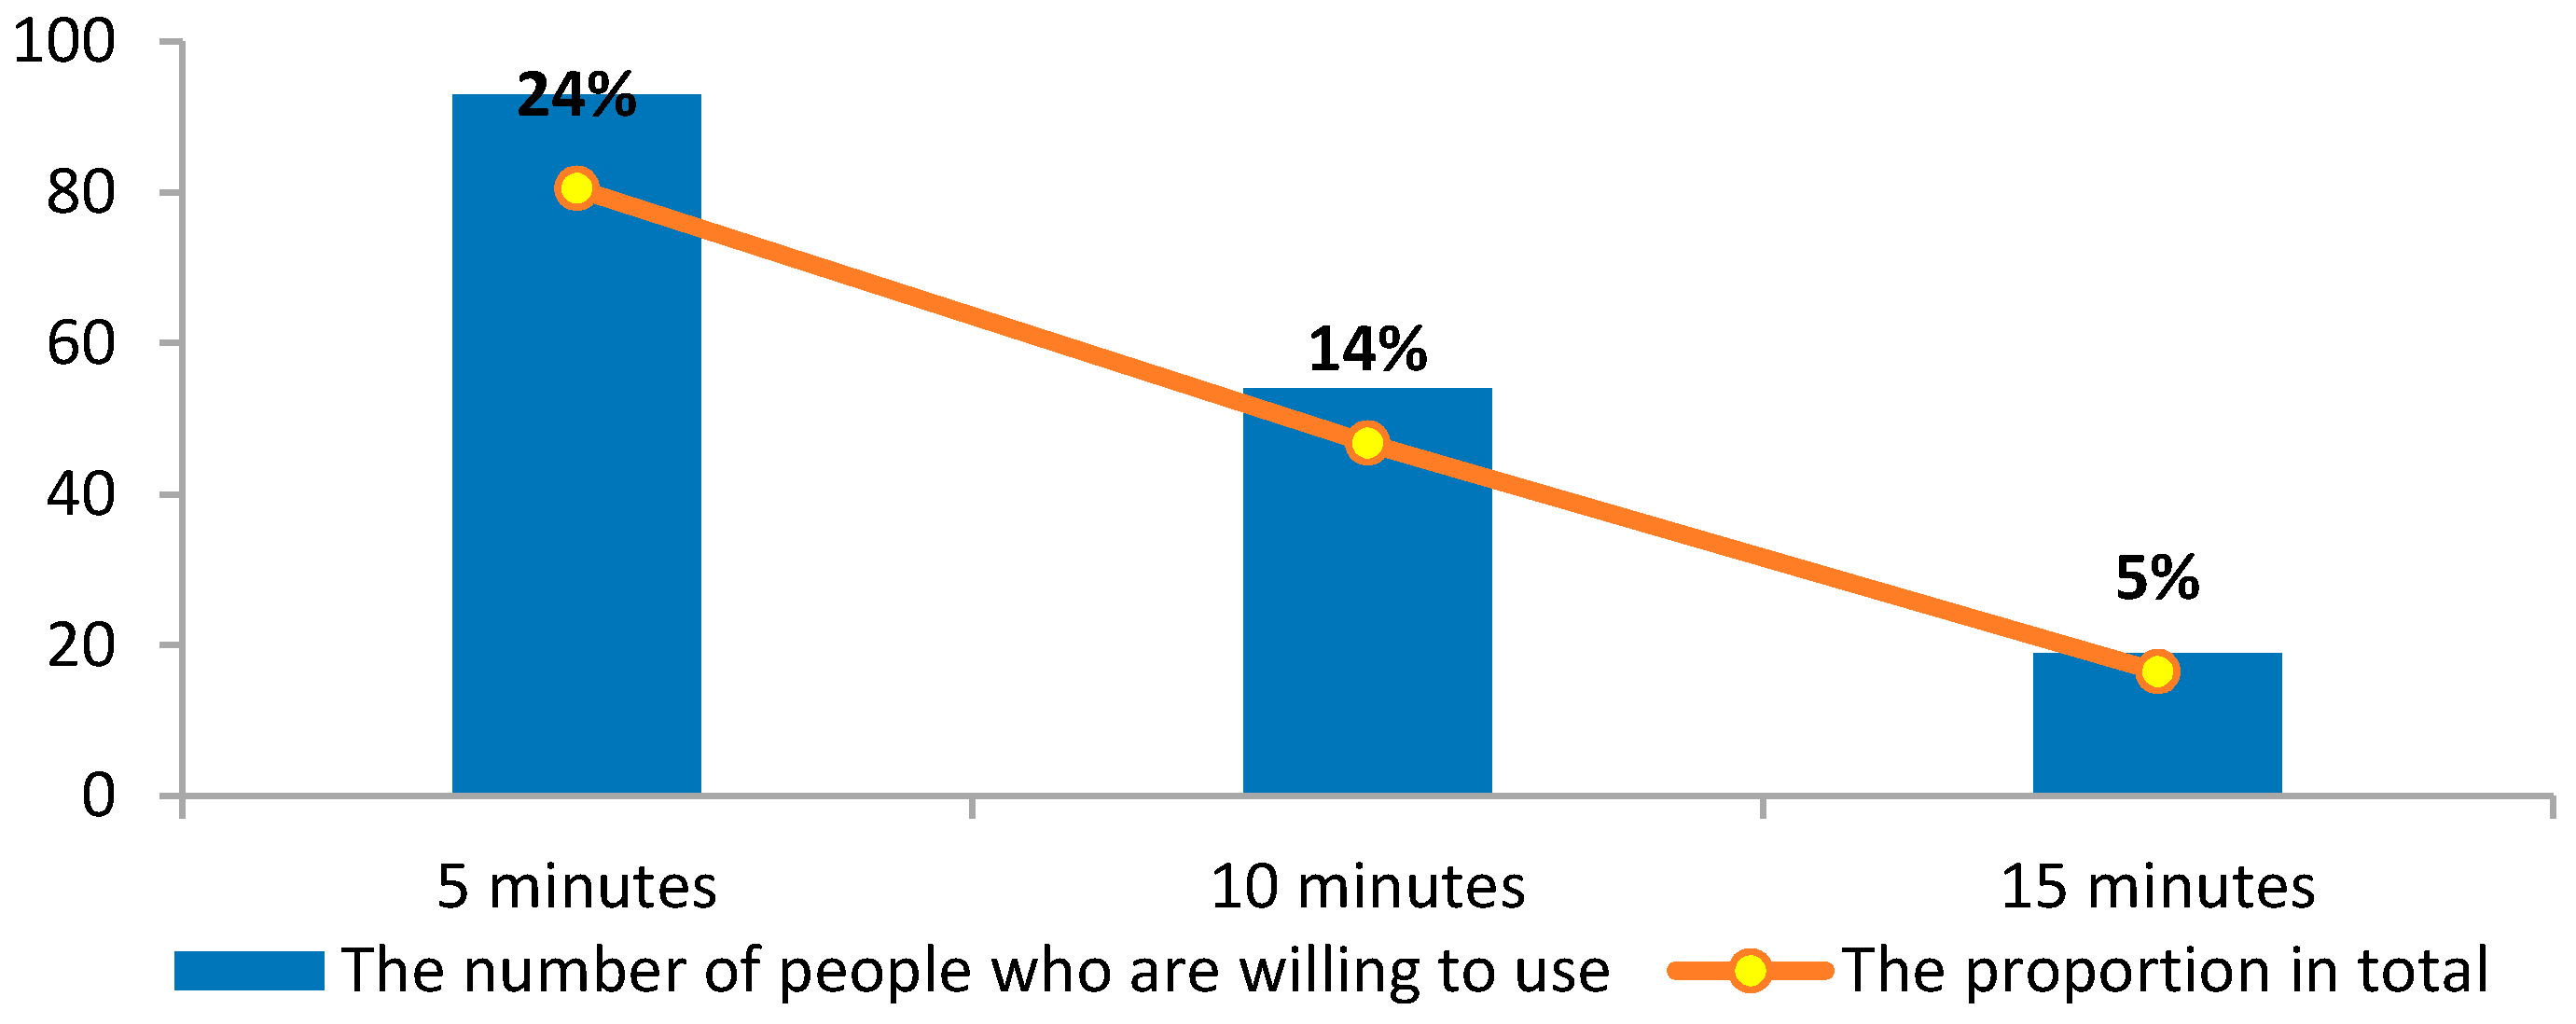
(5) The waiting time for consumers to go through the formalities and pick up cars should be controlled within five minutes.
Convenient appointments and self-help picking up cars are some of the most attractive points that consumers think the EVS service should have. As shown in
Figure 13 and
Figure 14, 89.4% of participants can accept that the longest waiting time is within 10 min. However, when waiting time increases from five to 10 min, the percentage of people who are willing to use EVS decreases from 24% to 14%, which is a big decline. Therefore, services, such as picking up the cars or returning the cars, should be automatic and self-supported. The suggestion is that operators should open a variety of channels for customers to complete the procedures of booking, picking up cars, returning cars and paying the bill conveniently and effectively. These can help control the total waiting time to be within five minutes.
Figure 13.
Acceptable maximum duration for the waiting and handling procedure (N = 385).
Figure 13.
Acceptable maximum duration for the waiting and handling procedure (N = 385).
Figure 14.
The relationship between waiting time and use willingness (N = 385).
Figure 14.
The relationship between waiting time and use willingness (N = 385).
6. Conclusions
In the early development of EVS, in order to achieve a good commercial operation, it is necessary to investigate with respect to the consumers the important influencing factors for the acceptance of EVS. Therefore, to solve these problems, a questionnaire was conducted in Shanghai. According to the results, relevant suggestions are offered to achieve a wide range promotion of EVS.
Through the multiple logistic regression analysis, the factors of the main trip mode in daily use, monthly transportation expenditure, acceptable minimum driving range of electric vehicles, gender, age, marital status and occupation have significant influences on the willingness to choose EVS. Males are more willing to use EVS than females. Younger people have a stronger receptivity to new things than the old. As age increases, the use willingness of consumers decreases. In short, the population characteristics of people choosing to use EVS are male, aged between 18 and 30 and usually taking the subway and bus as the daily transportation modes. Otherwise, the factors of acceptable highest price of EVS, occupation and personal monthly income have a significant impact on the use willingness of people who keep a neutral stance. The increase of service price will reduce the use willingness, and the exclusion effect of people with a low average monthly income is lower. As a result, if we want to encourage these people to change their existing attitude to use EVS, a reasonable price should be made to attract them to join on the premise of incurring no deficit. The probability for a 26–30 year-old male clerk who has a personal monthly income of 3001–6000 yuan in Shanghai to use EVS is as high as 72.1%, which indicates that the development prospect for EVS in Shanghai is good.
In the operational aspects, suggestions are provided for operators as follows. (1) The operators should pay more attention to people who are 18–30 years old and have a middle-level income. (2) In the early development of EVS, the electric vehicles used for sharing should be concentrated on compact, small or mini cars to achieve the aim of low-cost operation and good sharing economy. (3) The driving range of shared electric vehicles should not be less than 120 km to reduce consumers' range anxiety. (4) During the laying out of sites, a reasonable number of sites are necessary to guarantee that the walking time to stations is within 10 min for consumers. (5) Operators need to optimize the leasing system and implement automation and self-support as far as possible. This can help control the total waiting time to within five minutes.


