Article

Innovative Carbon Allowance Allocation Policy for the Shenzhen Emission Trading Scheme in China

1
Research Center on Modern Logistics, Graduate School at Shenzhen, Tsinghua University, Shenzhen 518055, China
2
South University of Science and Technology of China, University Town, Nan Shan District, Shenzhen 518055, China
3
Environmental Science and Engineering Center, Harbin Institute of Technology Shenzhen Graduate School, Shenzhen 518055, China
*
Author to whom correspondence should be addressed.
These authors contributed equally to this work.
Sustainability 2016, 8(1), 3; https://doi.org/10.3390/su8010003
Submission received: 13 September 2015 / Revised: 11 December 2015 / Accepted: 14 December 2015 / Published: 22 December 2015
(This article belongs to the Section Energy Sustainability)

Abstract

:
The initial allocation of tradable carbon emission allowances is among the most contentious issues in developing an emission trading scheme (ETS). China faces serious dilemmas of system complexity and information incompleteness and asymmetry in allocating carbon allowance among enterprises. As one of the pilot ETS regions, Shenzhen has launched the first regional cap-and-trade ETS (SZ ETS) in China. Adhering to the overall plan and classification analysis, SZ ETS intends to solve the aforementioned dilemmas by developing innovative allowance allocation policies. A fundamental principle is to allocate allowances based on carbon intensity and actual output, according to which a two-step allocation procedure is constructed. A competitive game mechanism is introduced for allowance allocation among manufacturing enterprises. Empirical results indicate the following: (1) Carbon allowance allocation based on carbon intensity and actual output can mitigate carbon emission growth by reducing CO2 emitted per unit output, and, thus, buffer the shocks of unexpected economic fluctuations to ETS stability; (2) Competitive game allocation may contribute to improving the use of scattered information to enhance the efficiency of information and emission resource allocation. Exploring SZ ETS may provide a reference for formulating future national carbon allowance allocation policies in China and other developing regions.

1. Introduction

China is the largest carbon emitter in the world [1]. It accounted for 28% of the global energy-related carbon emissions in 2013 and 80% of the net global carbon emission increments from 2008 to 2013 [2]. The Chinese government has committed to be a responsible developing country by reducing its carbon emission intensity by 40%–45% in 2020 compared with that in 2005 [3]. It aims to realize this endeavor mainly through market-oriented policy instruments. The National Twelfth Five-Year Plan (2011–2015) proposes the gradual establishment of a nationwide cap-and-trade emission trading scheme (ETS). Subsequently, the National Development and Reform Commission (NDRC) of China appoints seven regional ETS pilots, namely, Beijing, Shanghai, Tianjin, Chongqing, Shenzhen, Guangzhou, and Hubei, to explore the correct path to establishing national ETS in the country in the near future [4].
One of the most important and contentious issues in constructing an ETS is the initial allocation of tradable carbon emission allowances to enterprises or installations [5]. Although experiences can be gained from existing ETSs, China still faces dire challenges in formulating its own carbon allowance allocation policy. Compared with those of countries with developed economies, the rapid and precarious economic growth, industrial structure transformation, and consumption level update of China pose two significant dilemmas on its carbon allowance allocation: system complexity and information incompleteness and asymmetry. These dilemmas are particularly critical in establishing the pilot ETS in Shenzhen, which is the first special economic zone and one of the four largest cities in China. Therefore, this study selects the ETS of Shenzhen (SZ ETS) as a case study to analyze its exploration of carbon emission allowance allocation.
SZ ETS is the first regional cap-and-trade scheme in China [6]. It was initiated on 18 June 2013 and completed its first compliance year with 99.4% of enterprises fulfilling their carbon emission compliance obligation until 30 June 2014 [7]. SZ ETS presents a general concept of “overall plan and classification analysis” to solve the policy dilemma of system complexity. On the one hand, a set of unified allocation principle and procedure is formulated for all the regulated enterprises, namely, a principle to allocate allowances based on carbon intensity constraint and actual output as well as a two-step procedure composed of prior pre-allocation and ex post confirmed allocation. On the other hand, three types of allocation mechanisms are specified for the standardized product enterprises, large-scale group manufacturing enterprises, and other average manufacturing enterprises according to their classification features. Furthermore, SZ ETS innovatively applies the theory of bounded rationality evolutionary game to guide the pre-allocation of carbon allowances among average manufacturing enterprises, and, thus, addresses the policy dilemma of information incompleteness and asymmetry. A competitive game allocation mechanism is developed and practiced in SZ ETS, which encourages regulated enterprises to participate in allocation discussions. Hence, using scattered information is improved to mitigate information asymmetry between the government and enterprises as well as to reduce the information incompleteness of both parties. Consequently, the combination of bounded rationality evolutionary game and competitive free allocation may contribute to the literature by providing a fresh idea to improve the information efficiency of initial carbon allowance allocation, particularly in the infancy phase of ETS development. From the perspective of practice, the set of innovative allowance allocation policies explored by SZ ETS may provide a reference for establishing future national allowance allocation policies in China and other developing regions or countries.
The remainder of this paper is organized as follows. Section 2 presents an overview of the existing practice in carbon allowance allocation policies, and then the dilemmas of China are described through comparative analyses of policy backgrounds. Section 3 introduces the case study of SZ ETS and its exploration of the general allocation policy framework. Section 4 further expounds the allocation policy innovations introduced by SZ ETS. Then, Section 5 discusses the empirical results. Finally, Section 6 concludes the paper and provides some outlooks.

2. Dilemma in the Carbon Allowance Allocation Policy Making of China

2.1. Overview of the Existing Carbon Allowance Allocation Policies

If property right is clear and transaction cost is zero, it is argued that the initial allocation of resource does not affect its final distribution [8,9]. However, in reality, the assumption of zero transaction cost is always untenable and the effect of income distribution does actually influence resource trading to some extent [10,11]. Therefore, the formulation of initial carbon allowance allocation policy not only affects the efficiency of scarce emission resource allocation, but has significant impacts on certain important aspects of fairness, carbon market efficiency and social welfare [12,13,14,15]. To conduct a sound initial allowance allocation can help to improve the efficiency of emission resource final distribution and welfare effects [16]. Then the follow-on problem is how to develop the reasonable and effective carbon allowance allocation policy.
The Europe Union emission trading scheme (EU ETS) is by far the largest cap-and-trade ETS around the world. It covers the power and heat generation sectors, selected energy-intensive industrial sectors and aviation sector [17,18,19]. The EU ETS is implemented in three consecutive periods, during which carbon allowance allocation policies correspondingly change. In the first (2005–2007) and second (2008–2012) phases, more than 90% of allowances are allocated for free and mainly by grandfathering [20]. It is suggested that free allocation has the advantages of mitigating political resistance from carbon-intensive industries and being easy to implement in the initial phase of an ETS [21]. Besides, the grandfathering mechanism based on historical baseline emissions can underpin the inter-temporal consistency [5] and deliver incentives for regulated emission installations to report their historical data [22]. However, the above allocation policy presents two big flaws of “allowance oversupply” and “windfall profit” during 2005–2012, and is questioned about the issues of unfairness and investment distortion [23,24]. Based on the previous experience and data accumulation, the EU-ETS moves to the allocation policy dominant by auction and benchmarking in the third period (2013–2020). Except for the sectors with high carbon leakage exposure [19], the proportion of auction is significantly increased to avoid rent-seeking and improve allocation efficiency and fairness [25,26]. Moreover, the benchmarking is widely applied to issue free allowances, which is based on the EU-wide harmonized product emission benchmarks and historical baseline outputs. As each product is assigned an equal amount of allowances, the benchmarking allocation effectively reduces the competitive distortion existing in the previous stages. However, the mechanism is highly dependent on high quality data, and has problem to be applied in the sectors with heterogeneity products [27,28].
The Regional Greenhouse Gas Initiative (RGGI) is the first cap-and-trade ETS operated in the United States [29]. It starts to run in 2009 and only covers the electricity sector. As the risk of carbon leakage is very low for the electricity sector, approximately 90% of carbon allowances are issued through quarterly regional auctions in the RGGI covered states [30]. The California cap-and-trade program (California ETS) is the second mandatory carbon trading scheme in the country. It launches in 2013 and regulates GHG emissions from the electricity generating and importing sectors, other energy supply sectors, and energy-intensive industrial sectors [31]. Considering the extensive sectoral coverage, the policies of allowance allocation are specifically formulated for different sector classifications. For the sectors of electricity generating and importing, the majority of allowances are allotted by auction. However, for the industrial sectors highly exposed to external competition, allowance allocation is mainly free of charge in order to reduce carbon leakage [32]. In addition, the amount of free allowance issued to eligible industrial entities is calculated by the benchmarking mechanism based on the historical baseline output, product emission benchmark and assistance factor specified for each industrial activity.
The New Zealand emission trading scheme (NZ ETS) is the first economy-wide mandatory ETS which starts from 2010. It covers GHG emissions from the sectors of electricity production, industrial process, transport fuel, forestry, agriculture, synthetic gas and waste [33]. Under the scheme, the initial allowance allocation among covered emitters are entirely free of charge without any auction in the short term. It should be noted, however, that the mechanisms of free allocation vary by sectors [34,35]. The free allocation of carbon allowances to the fishing sector is conducted by grandfathering while that to the pre-1990 forestry sector is performed by benchmarking. As to the emissions-intensive industries sectors and agriculture sector, the free allocation is based on an output-intensity mechanism, which calculates the number of free allowances issued to an enterprise by multiplying its real product output with the average carbon emission intensity per unit output of the sector it belongs to.
The Tokyo emission trading scheme (Tokyo ETS) is the first cap-and-trade ETS operated in Japan. As a metropolitan-level scheme, it regulates not only the direct CO2 emissions from fossil fuel consumptions, but also the energy indirect CO2 emissions caused by using electricity and heat power [36]. As a result, about 1400 factories, offices and commercial buildings scattered across various sectors are incorporated into the Tokyo ETS’s regulation, which significantly increases the complexity and difficulty to make initial carbon allowance allocation. In spite of this extensive sector coverage, the government of Tokyo metropolitan formulates one relatively simple and uniform allowance allocation policy so as to improve the ETS’s acceptability and operability. At first, all the allowances are freely issued to the covered industrial installations and buildings. Secondly, the government sets the unified carbon emission compliance factor for each class of regulated emitter, respectively being 6% for factories and buildings that implement regional central heating and cooling and 8% for the rest buildings. Finally, the number of free allowances received by a covered entity is determined by its highest 3-year average carbon emissions during 2002–2007 and its carbon emission compliance factor set by the government.
Judging from the above overview, it is easy to find that the formulation of allowance allocation policy is highly related with the ETS’s characteristics and needs to be continuously optimized with the ETS’s development. Several experiences can be summarized from these existing ETSs’ practice: (1) Free allocation is widely applied in the initial stage of an ETS and is gradually replaced by auction; (2) If the ETS has a complex and diversified coverage, carbon allowance allocation mechanisms may vary by sectors; (3) Grandfathering allocation based on historical emissions and benchmarking allocation based on historical product outputs are two main approaches to issue free carbon allowances, and the later one has been increasingly applied in practice.

2.2. Dilemma in the Carbon Allowance Allocation Policy Making of China

A comparative analysis of policy backgrounds must be conducted when the existing policy experience is used for reference. All the aforementioned allocation policies are formulated and implemented by developed economies, which have established mature market economy systems. For example, the European Union ETS (EU ETS) targets only sectors with large-scale direct emissions because carbon costs can be effectively passed by price signals to curb energy indirect emissions from consumers. However, the socialist market economy system in China remains in its development and perfecting processes, and its price mechanism does not function efficiently in some fields. Meanwhile, the statistics of China National Energy Bureau indicates that electricity consumption and related indirect carbon emissions from the manufacturing sectors exhibit vigorous growth in China. The indirect carbon emissions from energy-guzzling manufacturing industries should also be considered and should be regulated by the future national ETS of China to mitigate the rapid growth of consumption-driven emissions. Thus, the simultaneous regulations of both direct and indirect emissions may provide the ETS of China with an extensive sector coverage, and, thus, increase the system complexity of the initial allowance allocation.
Moreover, the relatively steady economic growth and industrial structure of developed economies make their policy choices reasonable to allocate free allowances based on historical data. By contrast, China is currently under the stages of rapid industrialization and urbanization as well as industrial structural transformation. The erratic growth of emission gross and the dynamic change of emission structure make extrapolating future development from historical data risky for China. The current salient features of China do not only question the applicability of grandfathering and benchmarking mechanisms but also pose a considerable challenge in exploring a development-oriented allocation policy. Thus, additional information on future output, emission, emission reduction potential and cost is required to reduce the uncertainty of the carbon allowance allocation of China. In the field of future development, the problem of information incompleteness and asymmetry becomes extremely prominent during the allocation process. On the one hand, obtaining sufficient information to make accurate judgments regarding future development trajectories (information incompleteness) is unrealistic for both the government and enterprises. On the other hand, prevailing information gaps also exist between the government and enterprises (information asymmetry). The government is obviously at the inferior position in terms of information because enterprises master private information on their own development plans and carbon emission reduction potentials. Critically, incomplete and asymmetric information increases the tendency for the phenomena of “regulation capture” and “the squeaking wheel gets the oil” to appear during carbon allowance allocation.
In summary, China faces two dilemmas in formulating carbon allowance allocation policies: system complexity and information incompleteness and asymmetry. With regard to the former dilemma, the experiences in the California ETS and the NZ ETS indicate that system complexity can be effectively reduced by setting a series of allocation policies specified by sectors. However, the second dilemma has long plagued existing ETSs and has yet to be resolved effectively. For example, EU ETS has been suffering from the crisis of “allowance oversupply” and “windfall profit.” Given that additional information on future development is introduced, the dilemma eventually becomes increasingly prominent in the allowance allocation of China. In this context, certain innovative allocation policies must be explored to address the issue of information incompleteness and asymmetry effectively.

2.3. Literature Review on Resource Allocation under Incomplete and Asymmetric Information

The problem of information incompleteness and asymmetry is widely discussed in information economics and game theory. Information incompleteness refers to the phenomenon in which the economic agent (or player) does not master sufficient information to make an accurate judgment or decision. This phenomenon is common in reality and is primarily caused by the objective uncertainty of the environment and related variables, as well as the limited knowledge and cognitive ability of the economic agent [37,38]. Information asymmetry is a special situation of information incompleteness that denotes that information is not only incomplete but also asymmetrically distributed among economic agents. Therefore, asymmetrical information is absolutely incomplete information, whereas the reverse may not be true. Moreover, information asymmetry pays significant attention to the case in which one party has more or better information than others to explore the possible influences of information difference and the related power imbalance among bilateral or multiple participants. The problem of information incompleteness and asymmetry is a considerable challenge in realizing efficient resource allocation because this problem may cause decision-making mistakes and market failures, such as inefficient investment, excess supply, adverse selection, and moral hazard. Therefore, many researchers have exerted efforts to explore methods that can effectively solve the aforementioned problem, such as signaling and screening [39], information revelation [40,41], transparency improvement [42,43], incentive [44], repeated game and reputation [45,46], and dynamic renegotiation [47]. As discussed earlier, carbon allowance allocation suffers from incomplete and asymmetric information. Neither the government nor covered enterprises has mastered complete information to make an accurate prediction. Collecting sufficient information about the future output, emission, and emission reduction potential of all the covered enterprises is extremely difficult for the government. Gaining sufficient information about other enterprises or even its own future development is also unrealistic for a covered enterprise because of various uncertainties. Moreover, an obvious information asymmetry exists between the government and enterprises. Given that enterprises have private information about their own development, the government is under the position of information inferiority.
In this context, the application of auction in carbon allowance allocation must be enhanced [25,30]. Carbon allowance auction is a game between enterprises and the government, as well as among enterprises themselves. Enterprises compete with one another under this situation to bid for a certain quantity of allowances, whereas the government sets auction rules and issues allowances to enterprises with the highest bidding price. In theory, the bidding curve submitted by a regulated enterprise should be equal to its marginal abatement cost curve to realize the expected profit maximization. Therefore, an auction reveals the private information and true preference of enterprises to a certain extent, which contributes to the alleviation of information incompleteness and asymmetry. In recent years, the information efficiencies and allocative effects of various carbon allowance auction formats have been examined in numerous studies. Auction arguably performs better than free allocation because the former allocates allowances to enterprises with the strongest demands, avoids unfairness related to “windfall profit” [23], and reduces rent-seeking and investment distortion [24,25,26]. Auction is also expected to bring in a “double dividend,” given that auction revenue can be used to finance climate change mitigation actions and reduce relevant tax distortions [48]. However, as a mechanism of paid distribution, auction may significantly increase the emission compliance costs of covered enterprises and may cause considerable declines in outputs and profits, which make it difficult to implement; hence, strong resistance may be demonstrated by carbon-intensive industries. Auction may also lead to evident competitiveness losses of foreign trade industries and high carbon leakage risks [32,49]. In addition, auction performance may even be inferior to free allocation performance when market power or collusion exists [50]. As discussed in Section 2.2, the ETS of China will be established in a developing economy with an immature market economy system and certain regulated price regimes. It may also cover energy-guzzling manufacturing industries, most of which are highly exposed to external competitions. Therefore, auction is not considered an appropriate allocation choice in the initial development stage of the ETS of China.
However, auction certainly provides an important explanation, that is, game theory can also offer guidance to improve the information efficiency of free allocation. An approximate combination of game theory and free allowance allocation should be explored to address the dilemma of incomplete and asymmetric information. Game theory focuses on phenomena with competitive nature and rational behavior, and the early literature on this theory generally assumes that “all participants know; all participants know that all participants know; all participants know that all participants know that all participants know”. Nash and other scholars have discussed the game equilibrium under an absolute rationality framework. However, incomplete or asymmetric information and bounded rationality are inevitable in the reality of game because of objective environment uncertainty and the cognitive constraint of players [38,45,51,52,53]. Hence, theory of bounded rationality evolutionary game begins to gain attention. The theory holds that bounded rational players generally cannot determine the optimum strategies at the beginning of a game. However, they can continuously adjust strategies on the margin through ongoing imitations, trials, and learning to improve their own benefits during the game process. Moreover, the dynamic of evolutionary game gradually replaces slightly satisfactory situations with significantly satisfactory situations, and a stable equilibrium is eventually achieved [54,55,56,57]. The theory does not only examine the effects and interplays among bounded rational enterprises but also function efficiently in solving the information failure problem and in simulating the dynamic learning process, which makes this theory extremely close to reality [58]. Therefore, the theory of bounded rationality evolutionary game provides an ideal instrument to investigate the resource allocation issue among bounded rational individuals with incomplete and asymmetric information. This theory was originally applied to guide water resource allocation among multi-interest bodies in an integrated river basin [59,60,61]. Moreover, a bounded rational dynamic game model between land developers and inspectors is built to analyze the decision-making process for land hoarding [62]. An evolutionary incomplete information game is also used to guide the formulation of subsidy policies by modeling the relationships of stakeholders in a green supply chain [63,64]. Furthermore, the theory is applied to study auction allocation. Traditional bidding models may possibly fail to reflect the process during which bidders observed and learned from other bidders; however, evolutionary game-based models have potential in dynamically and retrospectively simulating bidding strategies [65]. On this account, an imperfect information evolutionary game is developed to discuss bidding strategies in the electricity market with price elastic demands [66]. In recent years, the theory has begun to be applied in an international climate change negotiation and greenhouse gas (GHG) emission mitigation burden sharing [67,68,69]. The essence of global climate game is that every country attempts to obtain as much as possible in allocating global future energies, resources, and GHG emission spaces [70]. Hence, cooperation and negotiation among countries/regions are proposed as the only solution to the challenge of global climate change [71,72].
In summary, the theory of bounded rationality evolutionary game provides an appropriate theoretical foundation to guide the design of a free allowance allocation policy that can effectively address the problem of information incompleteness and asymmetry. Under the guidance of this theory, a government-led free allocation can be switched to a game-based free allocation among enterprises themselves to help the government dispense with its inferior position in information. Regulated enterprises should also be actively encouraged to participate in allocation discussions through well-established information transmission and sharing channel as well as through the learning and strategy adjustment mechanism, so as to enhance the information efficiency of free carbon allowance allocation by improving the use of the private information of decentralized enterprises.

3. Shenzhen’s Exploration to Formulate Carbon Allowance Allocation Policy

3.1. Case Study

Shenzhen is located in the southeast coastland of China, across the border from Hong Kong. As the first special economic zone in the country, Shenzhen has achieved impressive economic growth during the last three decades and has become the fourth largest city in China. At present, the city is at the critical transitional stage of the industrialization and urbanization processes and is facing a series of typical problems to mitigate urban carbon emissions. As a “policy petri dish”, Shenzhen is authorized as one of the ETS pilot regions to explore an appropriate path to establish a national ETS of China.
Carbon emissions in Shenzhen have increased rapidly from 2005 to 2010 with an average annual growth rate of 4.9% [73]. In the trend, the growth of indirect carbon emissions is particularly evident because of the soaring energy consumption demands from the manufacturing, commercial, and residential sectors. Given the unified electricity price setting mastered by the state and the immature market system in China, abating consumption-driven carbon emissions through the price transmission mechanism will be extremely difficult for Shenzhen. Hence, some measures must be introduced to control demand-side carbon emissions directly. Therefore, SZ ETS incorporates energy indirect emissions into its coverage to regulate both direct carbon emissions from fossil fuel combustion and indirect carbon emissions caused by electricity and heat consumption. The following sections imply that the carbon emissions of an enterprise contain both direct and indirect carbon emissions (as well as carbon intensity). As an urban-level “cap-and-trade” scheme, SZ ETS only covers enterprises located within the administrative region of Shenzhen, in which an inclusion threshold of 3000 t CO2-e/year is set. During the pilot period of 2013-2015, the scheme covers 635 medium and large emitters scattered across all sorts of industries. The carbon emissions of these enterprises account for nearly 39% of total urban emissions. The synchronous regulation of direct-indirect emission and the extensive sector coverage have significantly increased the complexity of allowance allocation under SZ ETS. First, the design of the allocation policy must carefully address the possible cross effects between direct and indirect emissions to avoid double accounting. Second, the characteristics of carbon emission and production activity dramatically vary across the covered sectors. Some sectors are dominated by direct emissions, whereas others are dominated by indirect emissions; some sectors yield standardized products, whereas others make diversified products; some sectors depend on a government pricing system or on monopoly producers, whereas others fully compete. Thus, policymakers should fully consider the features of various sectors. Third, formulating a suitable allocation mechanism for manufacturing sectors and enterprises is also a considerable challenge without an experience or case for reference.
In addition, the economic development of Shenzhen is characterized by continuous industrial structure optimization and upgrade. The city has initially formed an industrial pattern dominated by the industry and tertiary industry. However, the internal structure of the industry section of Shenzhen remains under a process of dynamic change, during which heavy manufacturing industries are increasingly replaced by light manufacturing industries. The outputs of light manufacturing industries are more unstable, and consequently, more difficult to predict than those of heavy manufacturing industries. The carbon emissions of Shenzhen, along with this economic trend, present a rapid but fluctuating growth and a dynamic structure change [74,75]. The average annual growth rate of direct emissions from 2005 to 2010 is 1.3%, whereas that of indirect emissions is 16.1% [73]. The emission shares of energy production industries decrease, whereas those of manufacturing industries increase. Carbon emission changes have become increasingly uncertain at the manufacturing subsector level and at the enterprise level, which leads to highly unpredictable business-as-usual (BAU) emissions. Obtaining the private information mastered by manufacturing enterprises regarding their own development plans and emission reduction potential is also unrealistic for the government. Thus, information on future output, emission, and emission reduction potential is seriously incomplete and asymmetrically distributed between the government and regulated enterprises in Shenzhen.
In summary, the allowance allocation of SZ ETS faces the representative issues that must be carefully addressed during the development of the prospective national ETS of China. Therefore, SZ ETS is selected as the case study.

3.2. Shenzhen’s Exploration to Formulate Carbon Allowance Allocation Policy

Learning experience from existing ETSs, the SZ ETS decides to issue more than 90% of its carbon allowances for free during the 2013-2015 pilot period [76]. The exploration of the free carbon allowance allocation of the scheme is based on the general principle of the overall plan and classification analysis, of which the policy framework can be illustrated in Figure 1.
First, a fundamental principle is formulated to allocate carbon allowance based on carbon emission intensity and actual output [76]. The synchronous regulation of both direct and indirect emissions is generally disputed for the possibility of double accounting, given that declines in power consumption may reduce power production, and consequently, the corresponding abatements of carbon emission. Under this principle, the number of allowances issued to power generation enterprises is based on their actual outputs, which avoids “windfall profits” caused by power production cuts and mitigates cross effects between direct and indirect emissions. Moreover, neither the government nor covered enterprises can master complete information to make an entirely accurate prediction on uncertain future development. Therefore, implementing the aforementioned principle also helps buffer the shocks of unexpected output fluctuations to the stability of ETS. A two-step allocation procedure is established accordingly, which consists of “prior pre-allocation” and “ex post confirmed allocation”. Before commencing with the compliance period, carbon allowances are pre-allocated for all three compliance years. The main objective of this step is to set the target carbon intensities of covered enterprises and then combine them with the expected output information to determine the pre-allocation of the exogenous fixed emission cap. The pre-allocated allowances are issued annually to regulated enterprises and can be used for market trading. For example, the pre-allocated tradable allowances for t year are issued to an enterprise on 28 February, t year. SZ ETS introduces an innovative post-adjustment mechanism to conduct confirmed allocation. The number of adjusted allowances of an enterprise is calculated through its unchangeable target carbon intensity set by the pre-allocation step and the gap between its expected and actual outputs. SZ ETS requires regulated enterprises to conduct the processes of monitoring, reporting, and verifying annual economic outputs and to submit output verification reports, which ensure the authenticity and reliability of the actual output data. For example, the pre-allocated allowances of an enterprise for t year are deducted or augmented according to the difference between its annual projected outputs and the actual outputs listed in the output verification report. Thus, the confirmed allowances for t year is finally determined through the given annual target carbon intensity and the actual annual output on 31 May, t + 1 year. The post-adjustment mechanism also sets a constraint condition in which the overall cap on the annual post-confirmed allowances from all covered enterprises cannot exceed the ceiling of the exogenous fixed cap set during pre-allocation. This observation has two implications: (1) When the ceiling is not exceeded, the cap on post-confirmed allowances dynamically changes with the actual outputs, and the net deductions of the pre-allocated allowances are cancelled by the competent department. (2) Once the ceiling is exceeded, the cap on the post-confirmed allowances is reduced to the fixed cap by multiplying the confirmed allowances of each enterprise by a unified deflating factor. After the adjustment, the enterprises can surrender their confirmed allowances for carbon emission compliance for t year, and the enterprises that hold surplus allowances can sell or bank them for future use [74]. In summary, pre-allocation decomposes the exogenous fixed cap into tradable allowances for trading during the compliance year. The target carbon intensities of covered enterprises are formulated, which further affects the final allocations of these enterprises and ensures the realization of carbon intensity reduction targets. Moreover, the confirmed allocation dynamically adjusts the post-confirmed allowances of every enterprise, and consequently, their integrated cap to reduce the risk of allowance oversupply and guarantee that the post-confirmed emission cap will not exceed the fixed emission cap set during pre-allocation.
Figure 1. Policy framework of free carbon allowance allocation under the Shenzhen emission trading scheme (SZ ETS).
Sustainability 08 00003 g001
Second, three kinds of pre-allocation policies are specified for standardized product enterprises, large-scale group manufacturing enterprises, and other average manufacturing enterprises according to their classification characteristics. The classification of standardized product enterprises refers to the enterprises in the sectors of power generation, water purification and supply, gas distribution, and glass production, and 14 enterprises are covered in total. For these sectors, carbon intensity is set as the amount of CO2 emitted per unit product. The relatively clear information on future output and emission reduction potential results in allocating the allowances of standardized product enterprises through a government-led method, which is detailed in Section 4.1. However, standardizing products is impractical for manufacturing enterprises, of which the carbon intensity is set as the amount of CO2 emitted from per unit industrial added value. In the manufacturing sector, the allocation policies remain varied according to large-scale group enterprises and other average enterprises. Four large-scale group manufacturing enterprises are covered by SZ ETS. These enterprises occupy over 60% of urban industrial added values and have 19 interlinking subsidiaries. A negotiation-based allocation policy is applied to issue allowances directly to these groups mainly for two reasons. First, the government has relatively sufficient information and influence in the one-to-one negotiation with the regulated group. Second, group-based allocation helps avoid emission leakage across their subsidiaries. The detailed policy design is presented in Section 4.2.
A serious problem of information incompleteness and asymmetry exists in the remaining 602 average manufacturing enterprises, and the government is under the position of information inferiority, which indicates that government-led allocation cannot function efficiently. Therefore, pre-allocating carbon allowances among average manufacturing enterprises must introduce information on the effective allocation mechanism. The theory of bounded rationality evolutionary game provides an important instrument to investigate the issue of resource allocation with incomplete and asymmetric information. SZ ETS develops a competitive game allocation mechanism to issue carbon allowances to average manufacturing enterprises by adopting this theory for guidance. These carbon allowances encourage enterprises to participate in the allocation discussion process, and, thus, improve the use of dispersed information to enhance the information efficiency of allowance allocation. The innovative competitive game allocation mechanism is discussed in detail in Section 4.3.

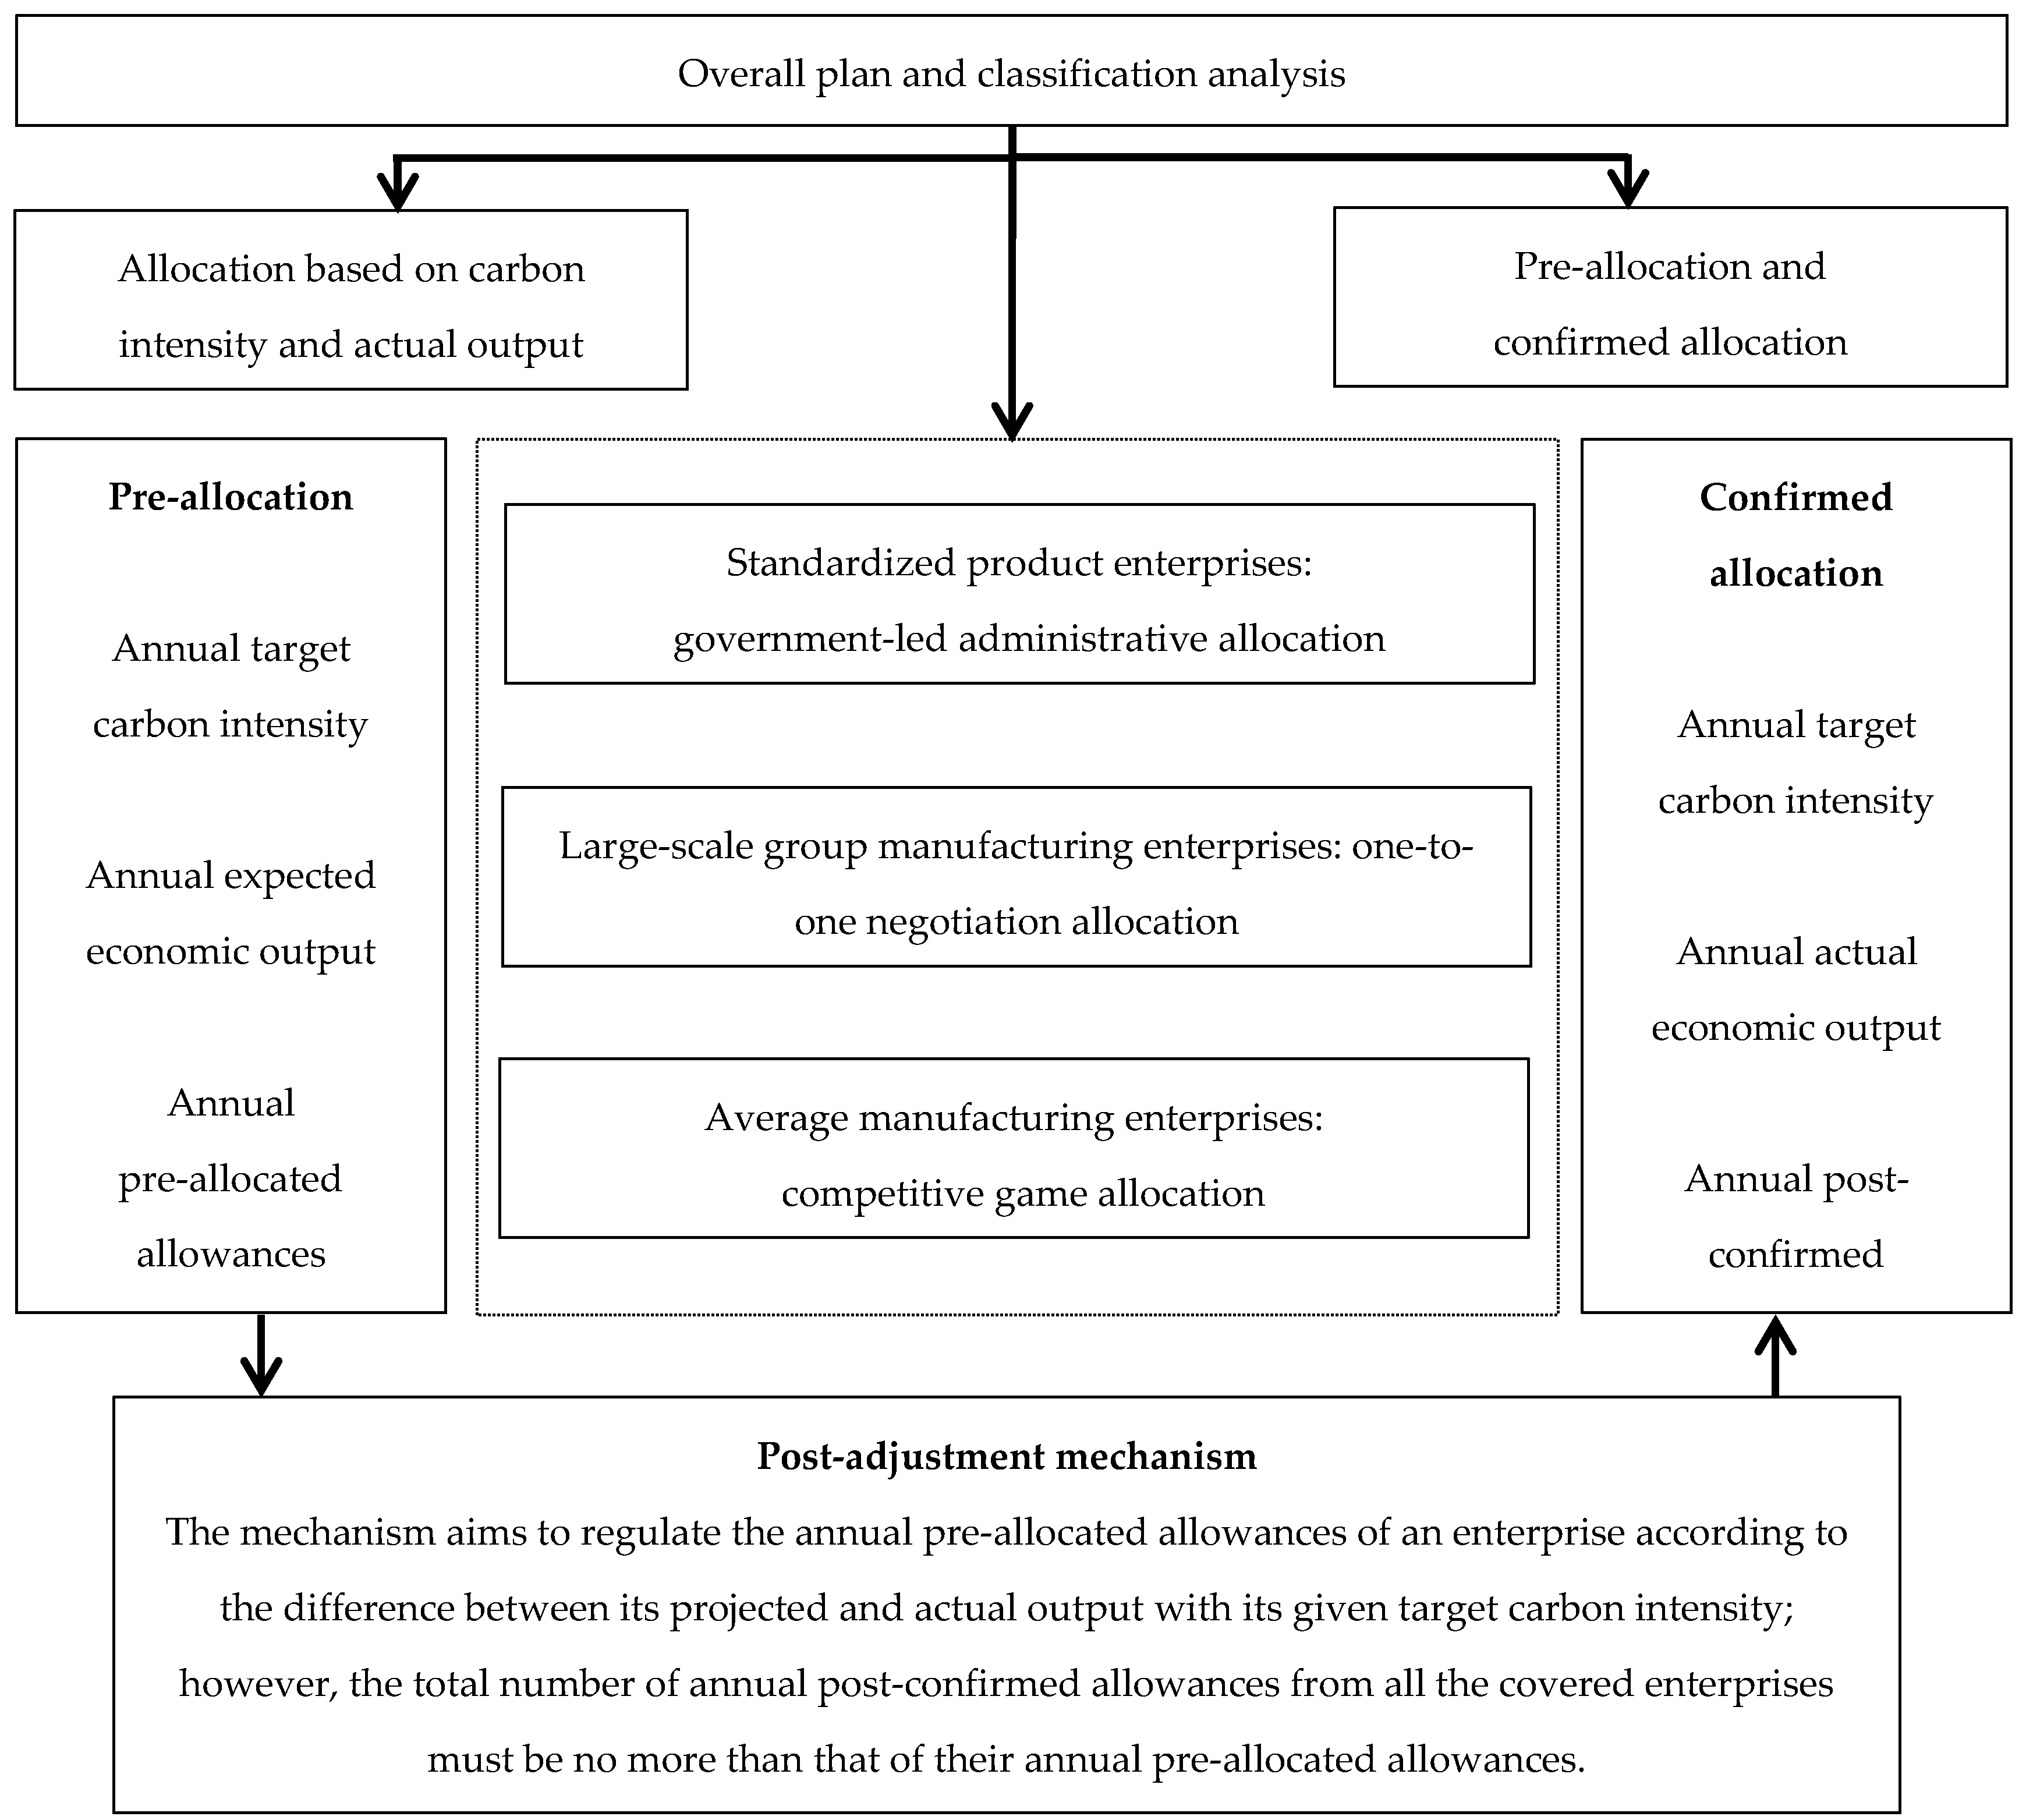
4. Carbon Allowance Allocation Method for SZ ETS

4.1. Standardized Product Enterprises

For the standardized products enterprises, the number of annual carbon allowances (Ei—tons) is determined by four factors: historical carbon emission, annual output growth rate, emission reduction potential and early mitigation action, and can be calculated by Equation (1):
E i = E i , 0 × ( 1 + γ i ) × ( 1 - α i ) + E i , r × β i
The historical carbon emissions during 2009–2011 are verified by the independent third-party verification agencies, the average value of which is selected as the baseline emission (Ei,0—tons) of each regulated enterprise. Emission reduction potential factor (αi—%/year) largely represents the requirement of carbon intensity reduction. For each standardized-product sector, the average carbon intensity of the top 10% enterprises inside a sector is set as the reference value of sectoral advanced emission level. Then, the emission reduction potential factor of an enterprise is proportional to the gap between its own baseline carbon intensity and the sectoral reference value. The higher the baseline carbon intensity of an enterprise is than the reference value, the larger its emission reduction potential factor is, which means the enterprise should make greater efforts to reduce its carbon intensity. The expected annual growth rate (γi—%/year) of product output is determined through questionnaire surveys to related experts and government officers, respectively being set as 1%, 1%, 10% and 10% for the power generation enterprise, water purification and supply enterprise, gas distribution enterprise and glass production enterprise. Besides, the early mitigation action carried out by an enterprise is also considered in the allocation process. If applying for early mitigation action awards, an enterprise needs to employ a third-party verification agency to verify its carbon emission reductions (Er,i—tons), during which the certification methodology applied is similar to the United Nation Clean Development Mechanism (CDM). After that, the certificated amount of early emission reductions is multiplied by an adjustment factor (βi) to calculate the allowance award of early mitigation action. For the first stage of Shenzhen ETS, βi is set to be 0.5 for all standardized product enterprises.

4.2. Large-Scale Group Manufacturing Enterprises

For the large-scale group manufacturing enterprises, carbon allowances are allocated by one-to-one negotiation between the government and the covered group. The allocation is conducted at the group level, which means that the government only determines the total number of carbon allowances issued to the whole group. Then, as the group has more sufficient information on its own subsidiaries and their linkages, it is entitled to decide how to distribute the given allowances inside the group. The amount of annual carbon allowances (Ei) available to a large-scale manufacturing group is computed by its expected annual industrial added value (Vi), historical baseline carbon intensity (γi,0) and carbon intensity reduction target (ηi), which can be expressed as Equation (2):
E i = V i × γ i , 0 × ( 1 - η i )
The method of series extrapolation is used to obtain the preliminary range of the expected industrial added value of a manufacturing group. Then, the extrapolating economic growth trend is combined with site survey and market analysis to eventually determine the expected annual industrial added value. The historical baseline carbon intensity of a group is set as the minimum of its carbon intensities during the baseline period of 2009–2011. The formulation of carbon intensity reduction target is the core of allowance negotiation allocation. On the one hand, the government puts forward a “top-down” carbon intensity reduction requirement based on the professional investigation on the group’s emission reduction potential and cost. On the other hand, the group submits its carbon emission demands for creating unit industrial added value creation in its own interests. The “top-down” emission reduction requirement and the “down-top” emission demand are discussed in rounds of negotiation between the government and the manufacturing group delegates. Finally, the mutually agreed trade-off reached by multiple negotiations is set as the carbon intensity reduction target of the manufacturing group.

4.3. Average Manufacturing Enterprises

The bounded rationality evolutionary game provides an important instrument by which all the behaviors, strategies, and interactions of bounded rational individuals with incomplete and asymmetric information can be studied within a unified framework. In reality, participants with bounded rationality cannot determine the optimum strategies during the first time; however, they can continuously adjust their strategies by trying and learning to enhance their benefits during the process of a multi-round evolutionary game. A steady equilibrium can be eventually realized in the dynamics of an evolutionary game, under which any individual player is reluctant to change its strategy unilaterally. Thus, SZ ETS applies the theory of bounded rationality evolutionary game as a guide to developing a competitive game allocation mechanism for average manufacturing enterprises. The detailed mechanism designs are elucidated in the following paragraphs, including the game rules, information transmission and sharing, the game subjects, equilibrium, and the experimental framework.

4.3.1. Design of Game Rules

As the organizer of a competitive game allocation, the competent government department classifies covered manufacturing enterprises into a series of game groups according to the industry attributes and production scales of these enterprises. The cap on allowances available for pre-allocation and the carbon intensity reduction target for each game group are also established. Given that enterprises may strategically report expected industrial added values and carbon emissions to obtain as many free allowances as possible, the design of game rules should ensure the realization of the carbon emission and carbon intensity reduction targets of the government, and simultaneously encourage enterprises to tell the truth about their expected carbon emissions and outputs during the compliance period.
First, the collective restriction rule is established to coordinate individual and collective rationality. From the perspective of collective interest, the competent department sets the upper limit of the available allowances and carbon intensity benchmark for the game group. Moreover, collective rationality aims to reward high-performance enterprises (HPEs) and punish low-performance enterprises (LPEs) within the group. Thus, the Pareto optimality of collective rationality aims to realize the carbon emission mitigation targets of the government while designating LPEs with more emission mitigation responsibilities. As game players, enterprises submit their expected industrial added values, carbon emissions, and carbon intensities for the coming compliance year to apply for initial free allowances. However, the individual rationality of a regulated enterprise is to obtain as many allowances as possible to maximize its interests. Therefore, the strategic behavior driven by individual rationality may diverge from the Pareto optimality of collective rationality. The total carbon emission demands submitted by regulated enterprises may overstep the cap set by the government. Moreover, the carbon intensity calculated from the submitted total carbon emission demands and the total added values may also exceed the carbon intensity benchmark. Therefore, a constraint condition is introduced to associate the benefits of an individual enterprise with collective rationality. In particular, if the submitted total carbon emission demands exceed the given cap or if the submitted average carbon intensity is higher than the given carbon intensity benchmark, then the number of allowances issued to every enterprise should be multiplied by a deduction coefficient to satisfy collective restriction.
Second, the stimulus and punishment rule is critical in stabilizing the equilibrium of the game, which also embodies the basic principles of allowance allocation. Most enterprises are motivated to report a high number to receive high allowances. Therefore, the stimulus and punishment rule should be formulated. An enterprise with a good carbon emission performance and a strong commitment to carbon emission reduction is rewarded with a relatively low minimum carbon intensity reduction requirement and an allowance payoff close to its reported carbon emission. An enterprise with poor carbon emission performance and minimal or even negative contribution to carbon emission reduction is punished with a relatively high minimum carbon intensity reduction requirement and an allowance payoff less than its reported carbon emission. The reward and punishment mechanism judges the reported data of an enterprise by comparing these data with the verified historical carbon emission and output data of the enterprise, as well as with the reported data of the other enterprises in the same group and with the carbon intensity benchmark of the group. The expected carbon emission and the added value reported by an enterprise are considered reasonable if they satisfy the minimum carbon intensity reduction requirement of an enterprise and if a better emission performance than that of the average level of other enterprises in the group is achieved. Otherwise, data are considered false reports, and the allowance payoff for the enterprise is reduced compared with its expected value. A new round of the game is triggered by the deviations between actual and expected payoffs when enterprises are rewarded for reasonable reports and punished for false strategic actions.
Under the aforementioned stimulus and punishment rule, an enterprise is motivated to tell the truth about its expected carbon emissions and outputs within a compliance period. An enterprise may receive a relatively strict carbon intensity reduction requirement when it makes a false report of high output, given that its reduction commitment can be compared with those of large-scale enterprises. Moreover, the amount of pre-allocated allowances for an enterprise is eventually adjusted according to its actual outputs at the end of the year. Pre-allocated allowances received through a false report of high output are withdrawn to ensure that the implementation of an enterprise’s carbon intensity reduction commitment is represented by its in-game promise. An enterprise is directly punished in the game through an allowance payoff that is significantly less than its reported emission and a relatively high intensity reduction requirement when it gives a false report on high carbon emissions. An enterprise may be rewarded with allowances during game pre-allocation when it makes a false commitment of large carbon intensity reduction. However, an allowance shortage occurs if an enterprise fails to deliver its false promise of large carbon intensity reduction during the compliance year. Thus, individual rationality is guided to reconcile with collective rationality, and the evolutionary game gradually achieves equilibrium through enterprises’ continuous learning and information sharing.

4.3.2. Information Transmission and Sharing

Information transmission and sharing is important in the knowledge accumulation, learning, and strategic adjustment of the limited rational player in the dynamics of an evolutionary game. Therefore, developing an effective mechanism for information communication is critical.
Prior to the start of the game, the competent department announces the following information to all players: (1) the given fixed emission cap as well as the historical and target carbon emission intensity benchmarks of the sector into which the regulated enterprise is classified; (2) the historical carbon emission, output, and carbon intensity of the regulated enterprise during the baseline period, as well as the minimum required carbon intensity reduction; and (3) the game rules, maximum rounds of finite repeated games, and opportunities to learn the game.
During each round, dispersed information is collected from the players and then delivered and shared among them. The competent department publishes the following information from the players after each round of the game: (1) the expected total carbon emissions and the added values reported by all the players, as well as the average carbon intensity derived from this group; (2) the scatter diagram, which describes the distribution of carbon emission performance as displayed by all the players in this round; (3) the allowance payoff specified for each player coupled with the ranking of the player in terms of carbon intensity and carbon emission abatement in the round; and (4) whether equilibrium is realized in the current round of game evolution.
The stable equilibrium of the evolutionary game eventually terminates the evolution process of the enterprise-participated allocation, and the distribution of allowances among the enterprises within the game group is determined. After the final round of the game, the players (enterprises) are notified individually regarding the number of allowances issued to them during the compliance period. Meanwhile, the gross number of carbon allowances allocated to the group is announced to all the enterprises within the group, along with its average carbon emission intensities.

4.3.3. Game Agent and Equilibrium

(1) Enterprise heterogeneity and payoff matrix
Based on the heterogeneity hypothesis, enterprises are categorized into HPEs and LPEs in terms of carbon factor productivity. The carbon factor productivity of an enterprise is denoted by its historical carbon emission intensity, which is calculated from its verified carbon emissions and industrial added values during the baseline period. The historical data used are generated from a certified third party institution authorized by the competent department of SZ ETS to ensure the accuracy of historical carbon emissions and industrial added values. The pure strategies of enterprises are classified into two types: the strategy to maximize output benefit (MOB) and the strategy to maximize allowance benefit (MAB). Under pure MOB strategy, an enterprise attempts to obtain allowances by telling the truth about its actual output contribution and emission demand. Under pure MAB strategy, an enterprise attempts to obtain more allowance by submitting a large number of emission demands. The payoff matrix of the carbon allowance allocation game can be expressed as shown in Table 1. The probability of an HPE to apply pure MOB strategy is x, whereas the probability of an HPE to adopt pure MAB strategy is 1 − x. The probability of an LPE to utilize pure MOB strategy is equal to y, whereas the probability of an LPE to use pure MAB strategy is 1 − y. Probability x can also be interpreted as the proportion of enterprises applying pure MOB strategy in the HPE group, whereas y is interpreted as the proportion of enterprises applying pure MAB strategy in the LPE group. However, an HPE and an LPE that apply the same strategy may receive different payoffs because of heterogeneity. Parameters a – d represent the payoffs of the representative LPE agent under various combinations of strategies by all the players, whereas parameters e–h denote those of the representative HPE agent.
Table 1. Payoff matrix of the carbon allowance allocation game.
HPE (A)
MOB strategy of A1 (x)MAB strategy of A2 (1 − x)
LPE (B)MOB strategy of B1 (y)a, ec, g
MAB strategy of B2 (1 − y)b, fd, h
The payoff of a representative HPE (A) player for pure MOB strategy (A1) and pure MAB strategy (A2) can be calculated using Equations (3) and (4), respectively, whereas the payoff for its mixed strategy can be computed using Equation (5):
E ( A 1 ) = y e + ( 1 y ) f
E ( A 2 ) = y g + ( 1 y ) h
E ( A ) = x [ y e + ( 1 y ) f ] + ( 1 x ) [ y g + ( 1 y ) h ]
Similarly, Equations (6)–(8) correspond to the payoffs of a representative LPE (B) player for pure strategies B1 and B2, as well as its mixed strategy:
E ( B 1 ) = x a + ( 1 x ) c
E ( B 2 ) = x b + ( 1 x ) d
E ( B ) = y [ x a + ( 1 x ) c ] + ( 1 y ) [ x b + ( 1 x ) d ]
(2) Evolutionary stable strategy and game equilibrium
According to the game rules described earlier, the payoff of a player in each round is dependent not only on its own strategy but also on the strategies used by the other players and on the emission reduction target formulated by the competent government department. Therefore, enterprises cannot easily apply their optimal strategies at the incipient stage or gain common knowledge of rationality. However, an enterprise can enhance its cognition and rationality by continuously learning from previous trials during the dynamic evolutionary game. Suppose that an enterprise adjusts its probability in the t + 1 round to apply two pure strategies based on its payoffs in the past t rounds of game, this study applies the replicator dynamics model to simulate the evolutionary game process of enterprises [77]. If the average payoff of a particular pure strategy (MOB or MAB) is higher than the average payoff of a hybrid strategy during the past t rounds of game, then an enterprise tends to enhance the particular pure strategy in the coming rounds of the game. The adjustment speed is directly proportional to the payoff gap between the pure strategy and the mixed strategy. The larger the gap is, the faster the adjustment speed is in attaining the particular pure strategy. Equations (9) and (10) respectively present the differential equations for an HPE player to update its probability of x and an LPE player to adjust its probability of y in the t round of game:
d x d t = x [ E ( A 1 ) E ( A ) ]
d y d t = y [ E ( B 1 ) E ( B ) ]
Then, the dynamic evolution functions of HPE and LPE players can be derived and expressed as Equations (11) and (12):
d x d t = x ( 1 x ) [ ( e f g + h ) y ( h f ) ]
d y d t = y ( 1 y ) [ ( c d ) ( b + c a d ) x ]
According to vested interests and dynamic evolution functions, bounded rational enterprises gradually adjust their strategy (by updating the probability of x or y) on the margin to improve their own interests during the repetitive game process. When less satisfying states are constantly replaced with more satisfying states, the evolutionary game eventually achieves a dynamic equilibrium under which any individual is no longer willing to change its strategy unilaterally. The asymptotic stability of the evolutionary game is analyzed based on the previous equations to determine whether a stable equilibrium can be achieved and to investigate its existence condition. Assuming for any (x0, y0)∈([0,1], [0,1]) at the starting moment, there always exists a point (xt, yt)∈([0,1], [0,1]) which represents a mixed strategy set composed by the (xt, 1 − xt) of HPE players and the (yt, 1 − yt) of LPE players at the t moment.When dx/dt = 0 and dy/dt = 0, both HPE and LPE players have no motivation to change their probabilities of mixed strategies unilaterally. If 0 < (dc)/(ab + dc) < 1 and 0 < (hf)/(eg + hf) < 1, five equilibrium points exist in the dynamics of the evolutionary game, namely, (0, 0), (0, 1), (1, 0), (1, 1), and [(dc)/(ab + dc), (hf)/(eg + hf)].
The next step is to analyze the stability of the preceding five equilibrium points. An equilibrium point (x*, y*) is regarded as stable if it can automatically converge back to its original state via replicator dynamics after any disturbance, which is also called evolutionary stable strategy. Equations (13) and (14) are used to assess the stabilities of these game equilibrium points. According to stability theorem of differential equations, d2x*/dt2 < 0, d2y*/dt2 < 0 is the sufficient condition for the stability of equilibrium point (x*, y*). The corresponding values of the preceding five equilibrium points are (f − h, c − d), (e − g, d − c), (h − f, a − b), (g − e, b − a), and (0, 0), respectively. When the conditions c d < 0, f h < 0, a b > 0, and e g > 0 are satisfied, the equilibrium points (0, 0) and (1, 1) are determined as stable equilibrium points, whereas the points (0, 1) and (1, 0) are not. A fifth equilibrium point exists. However, its stability cannot be directly determined using the value of the second derivative.
d 2 x d t 2 = ( 1 2 x ) [ ( e f g + h ) y ( h f ) ]
d 2 y d t 2 = ( 1 2 y ) [ ( c d ) ( b + c a d ) x ]

4.3.4. Experimental Framework Design of the Competitive Game Allocation

The SZ ETS converts the theoretical model of bounded-rationality evolutionary game to be a relatively simple and operational mechanism of competitive game allocation, which is applied to hundreds of its average manufacturing enterprises. The experimental framework design of the competitive game allocation is detailed as follows:
(1) Manufacturing enterprises covered by the SZ ETS are classified into various game groups, according to manufacturing classification, output scale, and similarities in production activity and emission facilities.
(2) The total amount of allowances available to a game group is set by the government, coupled with the historical and target carbon emission intensity benchmarks of the game group. All of the information is announced to the regulated enterprises within the group before the game starts.
(3) The minimum requirement of carbon emission intensity reduction is specified to every enterprise according to the gap between the enterprise’s carbon intensity and the group’s benchmark in the baseline period. The higher the historical carbon emission intensity of an enterprise is, the tougher the requirement will be set to cut its carbon emission intensity. The enterprise that had a high performance in its historical carbon intensity or commits a significant reduction in its carbon intensity of the compliance period will be encouraged.
(4) An enterprise submits its emission demands and projected outputs to compete with the other enterprises in the same group for free allowance. In each round, the distribution of allowances is determined by the information, knowledge and strategies of all the enterprises, as well as their interactions. The outcome is provided to the enterprises after each round to help them optimize their strategies. It should be noted that a mechanism of stable matching is introduced in order to accelerate the convergence of bounded-rationality evolutionary game. Moreover, the rounds of game are devised to be finite. The enterprise that is satisfied with its allowance payoff in a round can choose to accept it and exits from the game. However, if the enterprise is dissatisfied, it can refuse to accept its allowance payoff in this round and competes with the other remaining enterprises in the next round of game. However, as the cap on allowances available to the group is fixed, the amount of allowances accepted by the enterprises is deducted and the number of allowances available for allocation decreases with the increasing rounds of game. In the final round, the enterprises that have yet to accept allowances can derive their allocation only from the remaining allowances. In summary, the experimental designs of the competitive game allocation mechanism contribute to improving the use of scattered information mastered by decentralized enterprises, and are beneficial to practice an operation.

5. Results and Discussions of Shenzhen’s Carbon Allowance Allocation

This section presents the results of allowance pre-allocation, target carbon intensity, and confirmed allocation of allowance under the overall plan and classification analysis. It also discusses the effect of innovative policies on addressing the dilemma of information incompleteness and asymmetry in the carbon allowance allocation of China, which is mainly reflected in three aspects. The first aspect is to improve the accuracy of the future output and BAU carbon emission predictions. The second aspect is to obtain improved information on carbon emission reduction potential. The third aspect is to mitigate the shocks of economic fluctuation to ETS stability.

5.1. Carbon Allowance Pre-Allocation

Table 2 describes the results of the allowance pre-allocation of Shenzhen. The comparisons among historical baseline carbon emissions, BAU carbon emissions, and annual pre-allocated carbon allowances are also presented in the table. According to the data verified by a third party verification institution, the average annual carbon emissions of the 635 covered enterprises, which include direct and indirect carbon emissions, during the baseline period of 2009–2011 are 32.1 million metric tons. The 2013–2015 average annual BAU emissions are calculated through the expectations of sector output and carbon intensity under the BAU scenario, which are estimated to be approximately 37.6 million metric tons. Based on the pre-allocation policies discussed earlier, the average annual allowances issued to the regulated enterprises are 34 million metric tons during the compliance period of 2013–2015. Therefore, the amount of annual pre-allocated allowances is 6.2% higher than that of the average annual baseline emissions and 9.5% lower than that of the average annual BAU emissions. On the one hand, the pre-allocation of allowances considers the carbon emission demand driven by the rapid economic output growth during the industrialization and urbanization of Shenzhen. On the other hand, it achieves significant carbon emission reductions compared with the BAU scenario, which slows down the growth of urban carbon emissions in Shenzhen.
The sector structure of BAU carbon emissions is significantly different from that of the historical baseline carbon emissions because of the difference in sector output growth and the related energy consumption. If the grandfathering mechanism based on historical data is applied in the carbon allowance allocation of China, then the initial allowance allocation may significantly deviate from the actual emission situation. Some sectors may gain “windfall profit” for their capacity destructions, whereas other sectors may bear substantial allowance shortage and emission cost burden for their rapid output growth. The structure of pre-allocated carbon allowances is similar to that of BAU carbon emissions, which indicates that the pre-allocation can remarkably identify the real trend of carbon emission change in China in the near future. The growth of the average annual pre-allocation for manufacturing enterprises is more significant than that for standardized product enterprises. The proportion of carbon emissions of manufacturing enterprises has increased from 45.9% in 2009–2011 to 53.8% in 2013–2015. Simultaneously, the sector structure of carbon emissions within manufacturing enterprises changes dramatically. For example, the 2013–2015 average annual BAU emissions of the communication equipment, computer, and other electronic product manufacturing sectors (Sector 5) are expected to be 54.8% higher than their 2009–2011 average annual baseline emissions, whereas that of the textile, footwear and related products, and artwork manufacturing sector (Sector 9), and the cultural, educational, sport article, and furniture manufacturing sector (Sector 10), are 10% and 0.3% higher than their average annual baseline emissions, respectively. The average annual pre-allocations of sector 5 achieve a 13.0% reduction compared to its BAU emissions, but is still 34.6% higher than its average annual baseline emissions. However, the average annual pre-allocations of Sectors 9 and 10 realize the −9.1% reduction compared with their BAU emissions, and are also 0.8% and 8.5% lower than their average annual baseline emissions respectively. The pre-allocation results indicate that the competitive game contributes to motivating manufacturing enterprises to report their expected outputs and carbon emissions truthfully, which may help to solve the challenge of incomplete and asymmetric information on future outputs and carbon emissions.
Table 2. Comparison of pre-allocated allowances, historic baseline emissions, and business-as-usual (BAU) emissions by sector.
SectorNumber of EntitiesAverage Annual Baseline Emission 2009–2011Average Annual BAU Emission 2013–2015Average Annual Pre-Allocated Allowance 2013–2015Rate of Change Compared to Baseline EmissionRate of Change Compared to BAU Emission
ea104 t CO2104 t CO2104 t CO2%%
Sector 18167515731498−10.6%−4.8%
Sector 219990.3%−4.7%
Sector 342527264.0%−4.7%
Sector 4126413846.2%−8.3%
Sector 51967621180102634.6%−13.0%
Sector 616028938533516.2%−13.0%
Sector 716327137131716.9%−14.5%
Sector 8313843393.4%−9.3%
Sector 99141514−0.8%−9.1%
Sector 1024343431−8.5%−9.1%
Sector 11244958501.5%−13.1%
Sector 121415262243.8%−13.6%
Total6353206376234046.2%−9.5%
Note. Sector 1 to 12 respectively represent the sectors of “Power generation”, “Gas distribution”, “Water purification and supply”, “Glass”, “Communication equipment, computers, and other electronic products”, “Electrical machinery, instruments, and equipment”, “Non-metallic mineral, chemical fiber, textile, plastic, and rubber products”, “Paper, printing, media, and chemical products”, “Textile, footwear and related products, and artworks”, “Cultural, educational, sports articles, and furniture”, “Food, beverage, and other related agricultural products” and “Others”.

5.2. Historical and Target Carbon Emission Intensity

The fundamental principle of SZ ETS is to allocate allowances based on the target carbon intensity and actual output, with an aim to mitigate urban emission growth by cutting CO2 emitted per unit product or output. The main objective during the pre-allocation process is to set the target carbon intensity for each regulated enterprise. According to the pre-allocation policies discussed earlier, the target carbon intensity of a standardized product enterprise is determined by government-led administrative instructions, that of a large-scale manufacturing group is generated by its one-to-one negotiation with the competent government department, and that of an average manufacturing enterprise is formulated by its competitive game with other enterprises within the same sector.
The comparison of historical baseline carbon intensity and target carbon intensity by sector is presented in Table 3. The rates of carbon intensity reduction achieved during the competitive game allocation are obviously larger than those delegated by the government, which are the ratios of reduction from the historical carbon intensity baseline to the target carbon intensity benchmark of the group (sector). For all the seven manufacturing sectors, the average annual target carbon intensity of the sector committed by enterprises belonging to the sector is actually lower than its target carbon intensity benchmark, which is set by the government before game allocation. Therefore, the results indicate that exploring competitive game allocation significantly helps resolve the policy dilemma of information incompleteness and asymmetry on carbon emission reduction potential. The subjective initiative of regulated enterprises is motivated by encouraging these enterprises to participate in the discussion process. Moreover, the use of scattered information is, to some extent, improved to enhance the efficiency of carbon emission resource allocation.
Table 3. Comparison of historical baseline carbon intensity and target carbon intensity by sector.
SectorAverage Annual Baseline Carbon Intensity (2009–2011)Average Annual Target Carbon Intensity (2013–2015)Rate of Change
t CO2/per unit outputt CO2/ per unit output%
Sector 16.96.4−7.3%
Sector 2167.0156.9−6.0%
Sector 32.01.8−10.0%
Sector 40.80.7−12.2%
Sector 50.50.4−22.1%
Sector 61.00.7−28.5%
Sector 72.11.4−33.3%
Sector 81.00.7−24.3%
Sector 90.40.3−29.1%
Sector 101.71.0−37.9%
Sector 111.71.2−30.9%
Note: Per unit output for the power generation, water purification and supply, gas distribution, glass production sectors are 104 KW·h electricity, 104 t water, 104 t natural gas and t glass respectively. Per unit output for the manufacturing sectors is denoted as 104 RMB industrial added value. Sector 1 to 12 respectively represent the sectors of “Power generation”, “Gas distribution”, “Water purification and supply”, “Glass”, “Communication equipment, computers, and other electronic products”, “Electrical machinery, instruments, and equipment”, “Non-metallic mineral, chemical fiber, textile, plastic, and rubber products”, “Paper, printing, media, and chemical products”, “Textile, footwear and related products, and artworks”, “Cultural, educational, sports articles, and furniture”, “Food, beverage, and other related agricultural products” and “Others”.

5.3. Pre-Allocation and Confirm-Allocation of Carbon Allowances

Before the compliance period starts, allowances are issued to a regulated enterprise through the pre-allocation procedure. When a compliance year ends, the competent government department regulates the pre-allocation of allowances in accordance with the difference between the projected and actual outputs. The confirmed allocation process of allowances for an enterprise is eventually determined by its target carbon intensity and actual output in the past compliance year.
Table 4 presents the number of pre-allocated and confirm allocated annual carbon allowances in 2013 under SZ ETS. The amount of confirmed allowances for the compliance year is approximately 30.9 million metric tons, which is 7% lower than the amount of pre-allocated allowances. At the sector level, the number of pre-allocated allowances is reduced in six sectors and increased in six other sectors. Therefore, the actual gross output of carbon emission and its sector structure in 2013 deviated from the expected scenario in Shenzhen. Under EU ETS, the same deviation resulted in the crisis of “surplus allowance” and “windfall profit”. However, under SZ ETS, the innovative post-adjustment policy allows the allowances issued to an enterprise to be determine eventually by the actual annual output of the enterprise. Thus, the two-step allocation procedure contributes to bufferring the shocks of economic fluctuation to ETS stability.
Table 4. Comparison of pre-allocated and confirm-allocated carbon allowances by sector in 2013.
SectorPre-Allocated Allowances Confirm-Allocated Allowances Rate of Change
104 t CO2104 t CO2%
Sector 114981385−7.5%
Sector 299−3.1%
Sector 32626−0.1%
Sector 43324−26.7%
Sector 5981855−12.9%
Sector 63253270.5%
Sector 73063132.2%
Sector 838404.9%
Sector 9131511.5%
Sector 10303516.7%
Sector 114946−6.2%
Sector 12212310.9%
Total33303097−7.0%
Note. Sector 1 to 12 respectively represent the sectors of “Power generation”, “Gas distribution”, “Water purification and supply”, “Glass”, “Communication equipment, computers, and other electronic products”, “Electrical machinery, instruments, and equipment”, “Non-metallic mineral, chemical fiber, textile, plastic, and rubber products”, “Paper, printing, media, and chemical products”, “Textile, footwear and related products, and artworks”, “Cultural, educational, sports articles, and furniture”, “Food, beverage, and other related agricultural products” and “Others”.

6. Conclusions

China is the largest developing country and the largest carbon emitter in the world. The government of China endeavors to mitigate its carbon emission growth through market-oriented carbon ETS. Although some experiences can be gained from policy practice conducted in existing ETSs, China still faces considerable challenges in formulating its carbon allowance allocation policy. In 2012, a regional ETS pilot program is implemented by the Chinese government to explore the right path toward building a nationwide carbon market in the near future. Shenzhen, as one of the ETS pilot regions, has launched the first regional cap-and-trade ETS in China. Allowance allocation in SZ ETS suffers from representative issues that should be addressed in the development of the national carbon market in China. Consequently, SZ ETS is selected as the case study and its exploration to draft an innovative allocation policy is analyzed. The main conclusions can be summarized as follows.
(1) Compared with countries with developed economies, the rapid economic growth, consumption level update, and industrial structure transformation of China pose two significant dilemmas in its carbon allowance allocation policy making: system complexity and information incompleteness and asymmetry. Based on the experience of California ETS and NZ ETS, the system complexity of the carbon allowance allocation of China can be reduced to formulate allocation policies specified by sectors. However, some innovative allocation policies should be explored to solve the dilemma of information incompleteness and asymmetry in China.
(2) Adhering to the overall plan and classification analysis, SZ ETS has boldly explored the formulation of innovative allowance allocation policies so as to address the representative issues that confront it both in theory and in practice. A fundamental principle is to allocate carbon allowance based on the target carbon emission intensity and actual output. In addition to this principle, a two-step procedure that consists of pre-allocation and confirmed allocation is constructed. The innovative post-adjustment mechanism is introduced to regulate the pre-allocation of allowances in accordance with the difference between the projected and actual outputs. Thus, the confirmed number of allowances is eventually determined through the actual output. Moreover, three kinds of allocation policies are specified for different classifications of enterprises. The theory of bounded rationality evolutionary game is introduced to address the problem of information incompleteness and asymmetry. Under the guidance of this theory, a competitive game allocation is developed and applied to average manufacturing enterprises.
(3) The results of the allowance allocation under SZ ETS indicate that the allocation policy based on target carbon intensity and actual output has the potential in lowering carbon emission growth by cutting reducing the amount of CO2 emitted per unit output. Moreover, this allocation policy also contributes to mitigating the shocks of economic fluctuation to ETS stability. The average annual target carbon intensity committed by enterprises within the game group is actually lower than the target carbon intensity benchmark set up by the government. Thus, the competitive game allocation helps to motivate the subjective initiative of regulated enterprises, and the use of scattered information is improved to enhance the efficiency of carbon emission resource allocation.
As a “policy petri dish” for China, SZ ETS has introduced several important innovations in its allowance allocation policy making. To a certain extent, the exploration of SZ ETS may contribute to providing the current literature fresh ideas for improving the information efficiency of initial carbon allowance allocation, and may also help to offer a significant reference for developing China’s national ETS in the future. However, the development of the SZ ETS is still in its infancy; its efficiency and effectiveness need to be proved by long-term practice. To conduct a comprehensive and thorough impact assessment of the SZ ETS, therefore, is an important orientation for further improving and deepening the research in the future.

Acknowledgments

This work was supported by The Natural Science Foundation of Guang Dong Province, China (Grant No. 2014A030310404) and Shenzhen city Special Strategic Emerging Industry Development Foundation (Grant No. JCYJ20150331151358130).

Author Contributions

Both of the authors have contributed to the idea of the survey. Yang Peng analyzed the data; Lixin Miao and Ji Li provided some significant advice and checked through the whole paper; Bin Ye and Jingjing Jiang wrote the paper.

Conflicts of Interest

The authors declare no conflict of interest.

References and Notes

  1. Gregg, J.; Andres, R.; Marland, G. China: Emissions pattern of the world leader in CO2 emissions from fossil fuel consumption and cement production. Geophys. Res. Lett. 2008, 35. [Google Scholar] [CrossRef]
  2. Liu, Z.; Guan, D.B.; Crawford-Brown, D.; Zhang, Q.; He, K.; Liu, J. A low-carbon road map for China. Nature 2013, 500, 143–145. [Google Scholar] [CrossRef] [PubMed]
  3. The State Council of the People’s Republic of China. 2009. Available online: http://www.china.com.cn/policy/txt/2009–11/26/content_18962547.htm (accessed on 15 December 2015).
  4. The National Development and Reform Commission of China (NDRC). The Notice on Implementing Pilot Cap-and-Trade Schemes; NDRC: Beijing, China, 2011.
  5. Ahman, M.; Burtraw, D.; Kruger, J.; Zetterberg, L. A ten-year rule to guide the allocation of EU emission allowances. Energy Policy 2007, 35, 1718–1730. [Google Scholar] [CrossRef]
  6. Jiang, J.J.; Ye, B.; Ma, X.M. The construction of Shenzhen’s carbon emission trading scheme. Energy Policy 2014. [Google Scholar] [CrossRef]
  7. Shenzhen Development and Reform Commission. 2014. Available online: http://sztqb.sznews.com/html/2014-07/03/content_2929089.htm (accessed on 15 December 2015).
  8. Coase, R.H. The nature of the firm. Economica 1937, 4, 386–405. [Google Scholar] [CrossRef]
  9. Coase, R.H. The problem of social cost. J. Law Econ. 1960, 3, 1–44. [Google Scholar] [CrossRef]
  10. Arrow, K.J. The Organization of Economic Activity: Issues Pertinent to the Choice of Market Versus Non-Market Allocation. 1969. Available online: http://www.uvm.edu/-jdericks/EE/Arrow2.pdf (accessed on 15 December 2015).
  11. Guzzini, E.; Palestrini, A. The empty core in the Coase theorem: A critical assessment. Econ. Bull. 2009, 29, 3095–3103. [Google Scholar]
  12. Burtraw, D.; Palmer, K.; Bharvirkar, R.; Paul, A. The Effect of Allowance Allocation on the Cost of Carbon Emissions Trading; Resource for the Future: Washington, DC, USA, 2001; pp. 1–30. [Google Scholar]
  13. Burtraw, D.; Palmer, K.; Bharvirkar, R.; Paul, A. The effect on asset values of the allocation of carbon dioxide emissions allowance. Electr. J. 2002, 15, 51–62. [Google Scholar] [CrossRef]
  14. Sijm, J. EU ETS allocation: evaluation of present system and options beyond 2012. Energy 2006, 30, 285–292. [Google Scholar]
  15. Sterner, T.; Muller, A. Output and abatement effects of allocation readjustment in permit trade. Clim. Chang. 2008, 86, 33–49. [Google Scholar] [CrossRef] [Green Version]
  16. Pan, X.; Teng, F.; Wang, G.H. A Comparison of Carbon Allocation Schemes: On the Equity-Efficiency Tradeoff. Available online: http://dx.doi.org/10.1016/j.energy.2014.05.109 (accessed on 15 December 2015).
  17. EC. Directive 2003/87/EC of the European Parliament and of the Council of 13 October 2003 Establishing a Scheme for Greenhouse Gas Emission Allowance Trading within the Community and Amending Council Directive 96/61/EC (Text with EEA relevance). Official Journal L275, 25/10/2003P. 0032–0046. 2003. [Google Scholar]
  18. EC. Directive 2008/101/EC of the European Parliament and of the Council of 19 November 2008 Amending Directive 2003/87/EC so as to Include Aviation Activities in the Scheme for Greenhouse Gas Emission Allowance Trading within the Community, Official Journal of the European Union L 8/3. 2008. [Google Scholar]
  19. EC. Directive 2009/29/EC of the European Parliament and of the Council of 23 April 2009 Amending Directive 2003/87/EC so as to Improve and Extend the Greenhouse Gas Emission Allowance Trading Scheme of the Community. Official Journal of the European Union L140/63. 2009. [Google Scholar]
  20. Lecourt, S.; Pallière, C.; Sartor, O.J. The Impact of Emissions-Performance Benchmarking on Free Allocations in EU ETS Phase 3. 2013. Available online: http://cadmus.eui.eu/bitstream/handle/1814/26334/RSCAS_2013_17.pdf?sequence=1&isAllowed=y (accessed on 15 December 2015).
  21. Stavins, R.N. What can we learn from the grand policy experiment? Lessons from SO2 allowance trading. J. Econ. Perspect. 1998, 12, 69–88. [Google Scholar] [CrossRef]
  22. Jaekyun, A. Assessment of initial emission allowance allocation methods in the Korean electricity market. Energy Econ. 2014, 43, 244–255. [Google Scholar]
  23. Sijm, J.; Neuhoff, K.; Chen, Y. CO2 cost pass-through and windfall profits in the power sector. Clim. Policy 2006, 6, 49–72. [Google Scholar] [CrossRef]
  24. Fischer, C.; Fox, A.K. On the Scope for Output-Based Rebating in Climate Policy; Resources for the Future: Washington, DC, USA, 2010. [Google Scholar]
  25. Tietenberg, T. Emissions Trading-Principles and Practice; Resources for the Future: Washington, DC, USA, 2006. [Google Scholar]
  26. Goulder, L.H.; Marc, A.C.; Dworsky, H.M. Impacts of alternative emissions allowance allocation methods under a federal cap-and-trade program. J. Environ. Econ. Manag. 2010, 60, 161–181. [Google Scholar] [CrossRef]
  27. Edwards, T.H.; Hutton, J.P. Allocation of carbon permits within a country: A general equilibrium analysis of the United Kingdom. Energy Econ. 2001, 23, 371–386. [Google Scholar] [CrossRef]
  28. Takeda, S.; Arimura, T.H.; Tamechika, H.; Fischer, C.; Fox, A. Output-Based Allocation of Emissions Permits for Mitigating the Leakage and Competitiveness Issues for the Japanese Economy; Resources for the Future: Washington, DC, USA, 2011. [Google Scholar]
  29. RGGI. Regional Greenhouse Gas Initiative: An Initiative of the Northeast and Mid-Atlantic States of the US. 2010. Available online: http://www.rggi.orgS (accessed on 15 December 2015).
  30. Perdan, S.; Azapagic, A. Carbon trading: current schemes and future developments. Energy Policy 2011, 39, 6040–6054. [Google Scholar] [CrossRef]
  31. California Air Resources Board (CARB). Assembly Bill 32: Global Warming Solutions Act. 2012. Available online: http://www.arb.ca.gov/cc/ab32/ab32.htm (accessed on 21 December 2015). [Google Scholar]
  32. Bushnell, J.; Chen, Y. Allocation and leakage in regional cap-and-trade markets for CO2. Resour. Energy Econ. 2012, 34, 647–668. [Google Scholar] [CrossRef]
  33. New Zealand Government (NZG). The New Zealand Emissions Trading Scheme. 2010. Available online: http://www.climatechange.govt.nz/emissions-trading-scheme/about/S (accessed on 15 December 2015). [Google Scholar]
  34. New Zealand Ministry for the Environment (NZ ME). Industrial Allocation under the New Zealand Emissions Trading Scheme: Fact Sheet. 2009. Available online: http://www.mfe.govt.nz/publications/climate/industrial-allocation-under-nz-ets/index.htmlS (accessed on 15 December 2015). [Google Scholar]
  35. New Zealand Ministry for the Environment (NE ME). Industrial Allocation Update. Emissions Trading Bulletin No.12. 2009. Available online: http://www.mfe.govt.nz/publications/climate/emissions-trading-bulletin-12/emissions-tradingbulletin-12.pdf (accessed on 15 December 2015). [Google Scholar]
  36. Tokyo Metropolitan Government. Tokyo Cap-and-Trade Program: Japan’s First Mandatory Emissions Trading Scheme. Emission Cap and Trade Section, Urban and Global Environment Division; Bureau of Environment, Tokyo Metropolitan Government: Tokyo, Japan, 2010. Available online: http://www.kankyo.metro.tokyo.jp/kouhou/english/index.htmlS (accessed on 15 December 2015).
  37. Pearlman, J.G. Diverse information and rational expectations models. J. Econ. Dyn. Control 1986, 10, 333–338. [Google Scholar] [CrossRef]
  38. Aumann, R. Rationality and bounded rationality. Games Econ. Behav. 1997, 21, 2–14. [Google Scholar]
  39. Hörne, J. Signalling and Screening. In The New Palgrave Dictionary of Economics, 2nd ed.; Palgrave Macmillan: Basingstoke, UK, 2008. [Google Scholar]
  40. Marín, J.M.; Rahi, R. Information revelation and market incompleteness. Rev. Econ. Stud. 2000, 67, 563–579. [Google Scholar] [CrossRef]
  41. Morris, S.; Shin, H.S. The social value of public information. Am. Econ. Rev. 2002, 92, 1521–1534. [Google Scholar] [CrossRef]
  42. Granados, N.F.; Gupta, A.; Kauffman, R.J. The impact of IT on market information and transparency: A unified theoretical framework. J. Assoc. Inf. Syst. 2006, 7, 148–178. [Google Scholar]
  43. Carboni, G.; Ellison, M. Inflation and output volatility under asymmetric incomplete information. J. Econ. Dyn. Control 2011, 35, 40–51. [Google Scholar] [CrossRef]
  44. Aspremont, C.D.; Gerard-Varet, L.A. Incentives and incomplete information. J. Public Econ. 1979, 11, 25–45. [Google Scholar] [CrossRef]
  45. Simon, H.A. Administrative Behavior—A Study of Decision Making Processes in Administrative Organization; Macmillan Publishing Co. Inc.: New York, NY, USA, 1971. [Google Scholar]
  46. Kreps, D.M.; Wilson, R. Reputation and imperfect information. J. Econ. Theory 1982, 27, 253–279. [Google Scholar] [CrossRef]
  47. Roberts, M.R. The role of dynamic renegotiation and asymmetric information in financial contracting. J. Financ. Econ. 2015, 116, 61–81. [Google Scholar] [CrossRef]
  48. Parry, I.W.H.; Williams, I.R.C.; Goulder, L.H. When can carbon abatement policies increase welfare? The fundamental role of distorted factor markets. J. Environ. Econ. Manag. 1999, 37, 52–84. [Google Scholar] [CrossRef]
  49. Jensen, J.; Rasmussen, T.N. Allocation of CO2 emissions permits: A general equilibrium analysis of policy instruments. J. Environ. Econ. Manag. 2000, 40, 111–136. [Google Scholar] [CrossRef]
  50. Dormady, N.C. Market power in cap-and-trade auctions: A Monte Carlo approach. Energy Policy 2013, 62, 788–797. [Google Scholar] [CrossRef]
  51. Chatterjee, K.; Samuelson, W. Bargain under incomplete information. Oper. Res. 1983, 31, 835–851. [Google Scholar] [CrossRef]
  52. Williamson, O.E. The Economic Institutions of Capitalism; The Free Press: New York, NY, USA, 1985. [Google Scholar]
  53. Fudenberg, D.; Levine, K.D. The Theory of Learning in Games; The MIT Press: Cambridge, MA, USA, 1998. [Google Scholar]
  54. Lipman, B.L. Information processing and bounded rationality: A survey. Can. J. Econ. 1985, 28, 67–75. [Google Scholar] [CrossRef]
  55. Lucas, R.E. Adaptive behavior and economic theory. J. Bus. 1986, 1, 234–249. [Google Scholar]
  56. Binmore, K.; Samuelson, L. Evolutionary stability in repeated games played by finite automata. J. Econ. Theory 1992, 57, 278–305. [Google Scholar] [CrossRef]
  57. Rader, R. The organization of decentralized information processing. Econometrica 1993, 61, 189–197. [Google Scholar]
  58. Azzoni, R.V.; Isai, Y.J. Estimating the costs of environmental protection in Brazil. Ecol. Econ. 1994, 11, 127–133. [Google Scholar] [CrossRef]
  59. Norio, H. Hyperganme analysis of the lake Biwa conflict. Water Resour. Res. 1985, 2l, 917–926. [Google Scholar]
  60. Lord, B.W.; Wallance, G.M.; Shillito, M.R. Linked models for Indian water rights disputes, managing water-related conflicts: the engineer’s role. Am. Soc. Civil Eng. 1990, 16, 325–332. [Google Scholar]
  61. Frisvold, B.G.; Caswell, F.M. Transboundary water management game-theoretic lessons for projects on the US-Mexico border. Agric. Econ. 2000, 24, 101–111. [Google Scholar]
  62. Bao, H.J.; Zhuang, H.M. Logic and controls of developers’ land hoarding. Mod. Urban Res. 2012, 11, 61–66. [Google Scholar]
  63. Zhu, Q.H.; Dou, Y. Evolutionary game model between governments and core enterprises in greening supply chains. Syst. Eng. Theory Pract. 2007, 27, 85–89. [Google Scholar] [CrossRef]
  64. Tian, Y.H.; Govindan, K.; Zhu, Q.H. A system dynamics model based on evolutionary game theory for green supply chain management diffusion among Chinese manufacturers. J. Clean. Prod. 2014, 80, 96–105. [Google Scholar] [CrossRef]
  65. Stanford Encyclopedia of Philosophy. 2010. Available online: http://plato.stanford.edu/entries/game-evolutionary/ (accessed on 6 December 2010).
  66. Wang, J.H.; Zhou, Z.; Botterud, A. An evolutionary game approach to analyzing bidding strategies in electricity markets with elastic demand. Energy 2011, 16, 3459–3467. [Google Scholar] [CrossRef]
  67. Kemfert, C.; Lise, W.; Tol, R.S.J. Games of climate change with international trade. Environ. Resour. Econ. 2004, 28, 209–232. [Google Scholar] [CrossRef]
  68. Breton, M.; Zaccour, G.; Zahaf, M. A game-theoretic formulation of Joint Implementation of environmental projects. Eur. J. Oper. Res. 2006, 168, 221–239. [Google Scholar] [CrossRef]
  69. Bernard, A.; Haurie, A.; Vielle, M.; Viguier, L. A two-level dynamic game of carbon emission trading between Russia, China, and Annex B countries. J. Econ. Dyn. Control 2007, 9, 1–27. [Google Scholar] [CrossRef]
  70. Zhang, H.B. Environment and International Relationship-the Rational Thought of Global Environmental Problems; Shanghai People’s Press House: Shanghai, China, 2008; p. 31. [Google Scholar]
  71. Dale, G. Climate War—The Coming Third World War; Feng, B., Translator; CITIC Publishing House: Beijing, China, 2010. [Google Scholar]
  72. Yu, S.W.; Wei, Y.M.; Wang, K. Provincial allocation of carbon emission reduction targets in China: An approach based on improved fuzzy cluster and Shapley value decomposition. Energy Policy 2014, 66, 630–644. [Google Scholar] [CrossRef]
  73. Shenzhen Urban Development Research Center (SZUDRC). The GHG Emission Inventory of Shenzhen: 2005–2010; Shenzhen Municipal People’s Government (SZ MPG): Shenzhen, China, 2012.
  74. Jiang, J.J.; Ye, B.; Ma, X.M.; Miao, L.X. Controlling GHG emissions from the transportation sector through an ETS: Institutional arrangements in Shenzhen, China. Clim. Policy 2014. [Google Scholar] [CrossRef]
  75. Ye, B.; Jiang, J.J.; Miao, L.X. Sustainable energy options for a low carbon demonstration city project in Shenzhen, China. J. Renew. Sustain. Energy 2015. [Google Scholar] [CrossRef]
  76. Shenzhen Municipal People's Government (SZ MPG). Interim Measures of Shenzhen’s Carbon Emission Trading Management; Shenzhen Municipal People’s Government (SZ MPG): Shenzhen, China, 2014.
  77. Sun, Q.W.; Lu, L.; Yan, C.L.; Che, H.A. Asymptotic stability of evolutionary equilibrium under imperfect knowledge. Theory Pract. Syst. Eng. 2003, 7, 11–16. [Google Scholar]

