Article

A New Systematic Approach to Vulnerability Assessment of Innovation Capability of Construction Enterprises

1
Institution of Construction Economics, Chang’an University; NO.161, Chang’an Road, Xi’an 710061, China
2
Department of Technology, Illinois State University; Normal, IL 61790, USA
*
Authors to whom correspondence should be addressed.
Sustainability 2016, 8(1), 17; https://doi.org/10.3390/su8010017
Submission received: 5 October 2015 / Revised: 8 December 2015 / Accepted: 18 December 2015 / Published: 25 December 2015
(This article belongs to the Special Issue Sustainable Business Models)

Abstract

:
The purpose of this research is to study the vulnerability of construction enterprises’ innovation capabilities (CEIC) and their respective primary influencing factors. This paper proposed a vulnerability system framework of CEIC, designed two comprehensive assessments for analysis, namely the entropy and set pair analysis method (E-SPA) and the principle cluster analysis and SPA method (P-SPA), and compared grades to verify the vulnerability assessments. Further, the paper quantitatively assessed the major influencing factors in facilitating management, reducing vulnerability, and improving the ability of construction enterprises to respond to changes in the construction industry. The results showed that vulnerability could be effectively and systematically evaluated using E-SPA. However, managing or reducing entrepreneurial sensitivity and improving the ability to respond was critical to supporting sustainable CEIC. The case studies included in this paper suggested that in ensuring sustainable CEIC, companies should concentrate on highly educated human resources, R&D investments, intellectual property related innovations, and government support. This research provided a practical framework and established a sustainable strategy for companies to manage their vulnerability in developing innovation capability. In addition, this research presented an innovative and effective way to quantitatively analyze vulnerability which offered a foundation to signify a new paradigm shift in construction sustainable development.

1. Introduction

As a critical driver of the sustainable development of a nation, a region, an industry, or an enterprise, innovation can provide a continual basis for sustainable socio-economic development and growth. Construction innovation, as a sustainable driver and a crucial condition, represents the pulse of construction economic development of any nation [1,2,3]. The innovative capabilities of construction enterprises thus hold a key position in advancing industrial and national development [4,5]. The current innovation status of the construction industry reflects the complex features of the industry [6]. As any nation or region will have demand for continued construction, statistics related to this construction make up a major portion of an economy’s well-being. The innovation accomplishments of construction enterprises are affected by the innovation efforts of other firms, and are achieved through the continuing cooperation among industries for breakthroughs in products, processes, and designs. These breakthroughs reflect the strength and innovative desires and interests of construction companies. However, compared to other industries, there is a lack of focus on the diffusion rates of innovation in different sectors of construction, such as building and civil infrastructure. Depending on the developmental level of an economy, the need for civil infrastructure may vary. However, innovation is needed at all levels of economic development [7]. Civil infrastructure companies are large in size and have potential for radical innovations, while residential construction companies are usually small and give limited consideration as to how to effectively convert new research and development into innovation. Often, large companies do not invest sufficiently in innovation as they already dominate a major portion of the existing market. Smaller companies on the other hand need to demonstrate higher degrees of innovation in order to enter or even stay in the market [8]. A similar observation was made by Hultgren and Tantawi [9] in the study of potential radical innovation in large firms.
However, researchers recently noticed that sustainable economic development has its vulnerability, which was considered as a new paradigm shift in the analysis of uncertainty in economic studies of system sensitivity and response capability. Vulnerability research has a wide range of applications, including climate change prediction, natural disaster prevention, food security, and public health improvement [10,11,12,13,14,15,16,17,18,19,20,21]. Generally, innovation vulnerability relates to the risk or uncertainty of a company’s innovation capability. Therefore, eliminating risks or identifying weaknesses is perhaps a preferred method of overcoming vulnerability. Elimination should, however, not simply lead to the avoidance of uncertainty when studying innovation capability, because uncertainty can sense or trace new directions or paths of economic development and thereby represents an innovative strength [18,19]. This new cognitive reasoning requires firms to treat uncertainty as part of innovation capability and develop a strategy to overcome it, or manage uncertainty instead of eliminating it. Construction entrepreneurs should consider the opportunities stemming from uncertainties as well. With this understanding, it is a crucial prerequisite for successful promotion of construction enterprise’s innovation capability (CEIC) to develop and implement a strategy when managing the uncertainty that is part of CEIC. However, there is still a lack of quantitative research to assess the uncertainty involved in innovation, particularly in relation to estimating innovation capability at a firm, industrial, or national level [22,23]. A similar discussion can be found in Costanza et al. [24] ”to say that we should not do valuation of ecosystems is to deny the reality that we already do, always have and cannot avoid doing so in the future”. The research by Costanza et al. [24] emphasized the importance of quantifying ecosystem values for the support of policy decisions or influencing public opinions. This research stressed the necessity for quantitative research in innovation uncertainty. This research was based on an inverse perspective of the relationship between uncertainty and innovation capability. Furthermore, it studied the vulnerability of CEIC and worked to build a system approach to assess the vulnerability of CEIC [11,13,15,16,17,20,21,25,26,27]. This new approach aimed to manage and reduce the vulnerability of CEIC and to support the sustainable improvement of CEIC.
In order to assess the vulnerability of CEIC, this research quantitatively analyzed the individual vulnerabilities of the major influence factors of CEIC with the objective to manage and improve their responsive abilities. In order to achieve this goal, this research constructed a framework of vulnerability of CEIC, using two comprehensive methods of vulnerability assessment in socio-economic research. The two methods were the entropy and set pair analysis method (E-SPA) and the principle cluster analysis and SPA method (P-SPA). This research also implemented these methods in eight construction enterprises to analyze their CEIC, and compared the respective results. The results demonstrated the functions of the vulnerability framework in the uncertainty analysis of construction innovation. The results are applicable to other industries too.
This research expands the field of innovation functions of a company to enhance its competitiveness and sustainable development from an inverse perspective when managing innovation risks. It identified new areas of economic growth with potential broad impact on multiple industries. At an industrial level, the research may help governments, industrial associations, and other organizations implement targeted incentives for innovation planning, to reduce uncertainty and risk, to respond to an innovation-driven service economy, and to promote regional and national innovation. In the long run, the research can help to enhance the positions of industries and facilitate national innovation strategies for economic development and restructuring.
The rest of the paper is structured as follows. Section 2 focuses on the review of literature, links of analysis levels, and the research agenda. Section 3 provides the research methods. Section 4 builds the vulnerability framework based on the selected theories and methods and implements the research procedure and measurements to analyze the vulnerability of CEIC. Section 5 presents the research results, summarizes the conclusions, and highlights the implications of vulnerability assessment for innovation capability in enterprises, and at industrial and national levels.

2. Literature Review

2.1. Innovation and Uncertainty

Enterprises are becoming more specialized than ever before. Based on the technological know-how of a company, competition may lead to additional challenges with respect to innovation and handling uncertainty. Adaptability paired with innovation therefore becomes a key factor to advance technological diversity and the willingness to experiment with new products and services. According to Bell and Pavitt [27], firms rarely fail because of an inability to master a new field of technology, but because of the lack of adaptability and responsiveness to new industry demands and the inability to proactively embrace and discover new technological opportunities [28].
Companies are vulnerable to external factors if they are not well prepared or not strategically aligned with the new innovative technologies. Companies need to be willing to take risks in order to succeed in the competitive construction industries. Finding the right approach to balancing risk versus a company’s vulnerability and its innovative capability is key to success. Facing constant competition in the advancement of any industry for new technology separates company strategies that are sustainable from those that are not. Major differences in this approach seem to exist between larger and smaller companies in the same industries since key challenges for the strategic management of technology depend on a company’s size and its core business: small firms must focus on defining and defending their product niche while large firms focus on building and exploiting competences based on R&D or on complex production or information systems. Companies require continuous learning, the capacity to integrate specialists, and a willingness both to break down established functional and divisional boundaries and to take a view to the long term [29].
Among a multitude of research, Schumpeter’s concept of long waves, a theory of technical innovation and structural change, shows that the successful diffusion of this technology depends on a wide variety of institutional changes. Freeman et al. points to a number of policies including flexible working hours, training and less restrictive macroeconomic demand policies which would help to generate higher levels of innovation [30]. This concept could certainly be extended to the sustainability of an innovation friendly company environment. Innovation does not lead to success just by itself if it is not supported by progressive and flexible federal, regional, and company specific policies. Otherwise, potential risk factors or the perception of uncertainty will hinder the advancement and sustainability of a progressive innovative environment.
Nevertheless, innovation processes are often criticized because they do not accurately portray the process of industry movement, in which there were uncertain and dynamic interactions among knowledge, resources, and environments [31]. Therefore, striving to remove uncertainty might lead to the risk of hindering or even completely impeding innovation rather than promoting it. Despite much success in overcoming uncertainty, it has become clear that uncertainties can never be completely removed. Instead, uncertainty keeps emerging in new forms accompanying complex scientific processes, organization structures, and technical systems. Strategies should be prepared at different levels of acceptance of uncertainty and be utilized to benefit social-economic developments [18]. Uncertainty is not a deficiency, but a structural feature embedded in any entrepreneurial entity. Likewise, uncertainty is not strictly a shortcoming, rather an important factor that can lead to growth. The endeavor to eliminate uncertainty holds the risk of jeopardizing rather than promoting innovation.
Dealing with uncertainty is a continuous process for construction innovation. The concept of coping with uncertainty, as opposed to removing it through planning and control, was presented and substantiated by Bohle [32]. This new cognitive approach to manage uncertainty in innovation processes is not just wishful thinking. For example, Bohle [32] proposed approaches such as experience-led and subject-based actions in project management. They provided new ways of dealing with uncertainty in project management. However, these methods have barely been further developed into quantitative instruments for systematic promotion of innovation processes [32]. This paper developed a new system with quantitative methods to manage the uncertainty in construction innovation. Meanwhile, the system has the ability to react and overcome uncertainty with countermeasures, instead of eliminating uncertainty which might weaken the power of innovation.

2.2. Vulnerability

As an emerging area, systematic studies of vulnerability began with research on natural disasters, with the purpose to achieve sustainable development of the environment through reducing uncertainty, sensitivity, and vulnerability [10]. At present, scholars widely use the methodologies of vulnerability research to explore economic domains, such as financial vulnerability and household vulnerability [10,21,33,34,35]. For example, Dominitz and Manski [17] first discussed the vulnerability of a country’s economic system. United Nations Development Programme (UNDP) [35] defined the concept of economic vulnerability as the capability to suffer the damage due to the impact of unanticipated events in the process of economic development. Vulnerability relates to the sensitivity to disturbance inside and outside of a system and the lack of capability to respond to make necessary changes to the system’s structure and functions. In addition, sensitivity and adaptability are key components of the evaluation of the vulnerability of a system [14,16,21,33,34,36,37,38,39].
Vulnerability management includes the assessment of a system’s sensitivity and adaptability by managing or restricting the potential hazards to realize the systematic promotion in the political, social, economic, or environmental fields. In recent years, examples of systems for which vulnerability assessments were performed include, but are not limited to, climate changes, natural disasters, ecological crises, food security, and public health. The research methods used include composite index method, fuzzy method, scenario analysis, and input-output method [14,16,21,25,33,34,36,37,38,39]. Such assessments were conducted on behalf of a range of different organizations, from small businesses to large enterprises. For example, Gnangnon [25] endowed different weights to various economic growth-indicators to calculate economic vulnerability indices in developing countries. Turner et al. [21] proposed a framework of factors and linkages to study the potential effects of the vulnerability of a couple of human–environment systems which was also related to the sensitivity and resilience of the system.
However, innovation capability is an important driver of any economic system, and the assessment of the vulnerability of innovation capability has not drawn enough attention, especially in regards to CEIC. Therefore, it is urgent to study how to measure the level of vulnerability, select indices, and manage index information to conduct a vulnerability assessment of CEIC. In this research, the authors first selected indices of vulnerability by using the entropy method. The entropy method is a common method to generate the objective weight of index system [40,41]. The next method used in this research is Set Pair Analysis (SPA), which is a novel method to target the uncertainty in a system [42,43]. The core thought of set pair analysis was to treat the confirmed uncertainty of the object to be studied as a confirmed uncertainty system, and to analyze and study the connection and conversion of the research objects for the similarities and differences. The core concept of set pair analysis was the set pair and the connection degree [42]. Another comparison method of principle cluster analysis (PCA) was also used to assess vulnerability. PCA assessment is usually used for the vulnerability assessment of tourism economic systems or city economic systems [38,44,45,46,47]. Using Entropy SPA (E-SPA) and PCA-SPA (P-SPA), the authors analyzed cases of large construction companies to reveal their vulnerability levels.

2.3. Construction Enterprise’s Innovation Capability (CEIC)

From a system point of view, construction innovation capabilities at firm, regional, and national levels are three closely related categories, which support and influence each other, characterized by general factors to realize the overall achievement of sustainable innovation. In innovation systems, the national, regional or industrial technical changes and economic growth are the outcomes of the innovation activities that take place among all firms. However, the changes are not simply the summation of firm-level innovation capabilities, but the result of their interactions at national, regional or industrial levels instead. At national or regional levels, innovation measurements are calculated by agencies such as European Innovation Scoreboard [48], OECD STI Outlook [49], Nordic Innovation Monitor [50], UNCTAD indicators [51] and World Bank indicators [52]. The measured innovation efficiencies refer to innovation input and output, innovation activity, innovation environment, etc. with relevant indicators.
CEIC can be used as an important carrier for national and regional innovation strategies. It is usually implemented at a micro level to foster, form, and upgrade innovation capabilities [3,23,53,54,55,56,57,58], such as innovation environments, innovation investment capabilities, cooperative innovation capabilities, intellectual property capabilities, and change-innovation capabilities [1]. Innovation capabilities enable construction enterprises to create, deploy, and maintain advantageous business performance in the long run. The representations of innovation capabilities, such as distinct skills, processes, procedures, organizational structures, decision rules, and disciplines, undergird enterprise-level sensing, seizing, and reconfiguring capacities.
At the enterprise-level, there are three main types of studies that focused on construction innovation capability. The first type of studies concentrated on analyzing and evaluating the major changes in overall innovation capability and specified the current status and history of innovation capability, e.g., international comparative study [59,60,61]. The second type of studies focused on the evaluations of enterprise innovation capabilities in key sectors (or areas), a.k.a. primary businesses’ innovation. For example, equipment manufacturing, strategic approaches for emerging markets, and process plant construction are considered as business innovation [1,2,4,62,63,64,65]. The third type focused on evaluating and comparing the different types and sizes of CEIC [53,66,67,68,69,70,71], such as domestic and foreign-funded enterprises, large, small-and-medium and micro enterprises, or state-owned and private enterprises.
In terms of types of constitution, CEIC refers to industrial innovation, technological innovation, system innovation, organizational innovation, and collaborative innovation [1,3,72,73]. The participants of CEIC involve government, business, universities, individuals, and community groups. The input factors of CEIC include capital investment, intellectual property, training, human resources (HR), etc. Researchers noticed that CEIC contributed to the enhancement of national competitive advantage, optimization of industrial resource allocation and the employment market, reduction of energy dissipation and pollution, and improvement of social welfare [3]. The systematic framework of CEIC gradually transited from individual and closed-end efforts into open-ended and multilateral cooperative processes. The multilateral interactions help to form the cooperative effects to improve the efficiency of labor, information, knowledge, technology, management and capital to implement CEIC strategies [4,74,75]. Even though the above studies focused on product capability, technology patents, knowledge transfer, university–industry–government cooperation, or output efficiency, there is still deficiency in holistic understanding of the social and organizational aspects of innovations. For example, as an important innovation resource, HR and the associated working conditions become key enablers and central factors of innovations. So, instead of studying the individual parameters of production, technology, and organization etc., this research studied CEICs systematically in a framework. Additionally, the generic innovation models [71,76] put forward that the frameworks with successful innovation outcomes were built by considering the focus of innovation, contextual factors, organizational capabilities and innovation processes. The links between the key concepts used in this research are shown in Figure 1. With the adoption of the extensions of generic innovation models, the framework of CEIC included the following items:
Figure 1. Links between key concepts.
Sustainability 08 00017 g001
(A) An ideal environment for innovation capability. The environment of CEIC should be at a high level of economic development, enterprise information management, and human resource access, and with the support from government and social sectors to create an accessible and sustainable environment [77,78].
(B) Adequate resources for innovation capability. Without an innovation resource pool, it is difficult for CEIC to carry out innovation activities, such as management innovation, technology innovation, and product innovation [79,80]. CEIC is the carrier of a national and regional innovation strategy. The cooperation among university, industry, and society, together with the alliance of capital, market demands and human resource (HR) pools for business innovation, are key to complying with CEIC [81,82,83,84].
(C) Progressive innovation activities. CEIC is important to the foundation of the entire innovation in an economic society. It also contributes to product innovation, process innovation, marketing innovation and organizational innovation. Resources, technology, and knowledge (tangible and intangible) are bundled, linked and incorporated for innovation activities, which then would be converted and organized into routines and systems to formalize innovation capabilities and lead to production competencies and performance [85,86]. In order to strengthen innovation activities, construction enterprises should actively and continuously promote the innovation investments in human and financial resources, pay good attention to integration and absorption of external technologies, and sustain the creation and ownership of intellectual properties.
(D) Emerging innovation output. As a measurement of the CEIC levels, innovation output includes the number of patents registered, technical trading expansion, and brand building promotion efforts [2,66,87]. Innovation in the area of high-tech and knowledge-intensive service helps the optimization of production and service structure at the industrial level; meanwhile, the new production or service methods enable enterprises to further optimize the product structure. This reciprocal process is an important aspect of innovation outputs [88,89,90,91].
(E) Improved economic efficiency. The economic efficiency of CEIC includes the efficiencies of labor input, capital investment, and energy investment, which contribute to sustainable development of business environments [92,93,94,95]. The construction enterprises with strong dynamic capabilities are highly entrepreneurial, with innovation-capability uncertainty, and are highly vulnerable to innovation environments. From a system uncertainty perspective, this uncertainty or dynamic feature is mainly due to the sensitivity of CEIC to internal and external system disturbances. In addition, the lack of responsiveness of CEIC hinders the sustainable development of those companies. The theoretical framework in this research quantitatively evaluated the vulnerability of CEIC to improve innovation capability. The analysis of the vulnerability or uncertainty of CEIC helps to promote the sustainability of innovation capability.

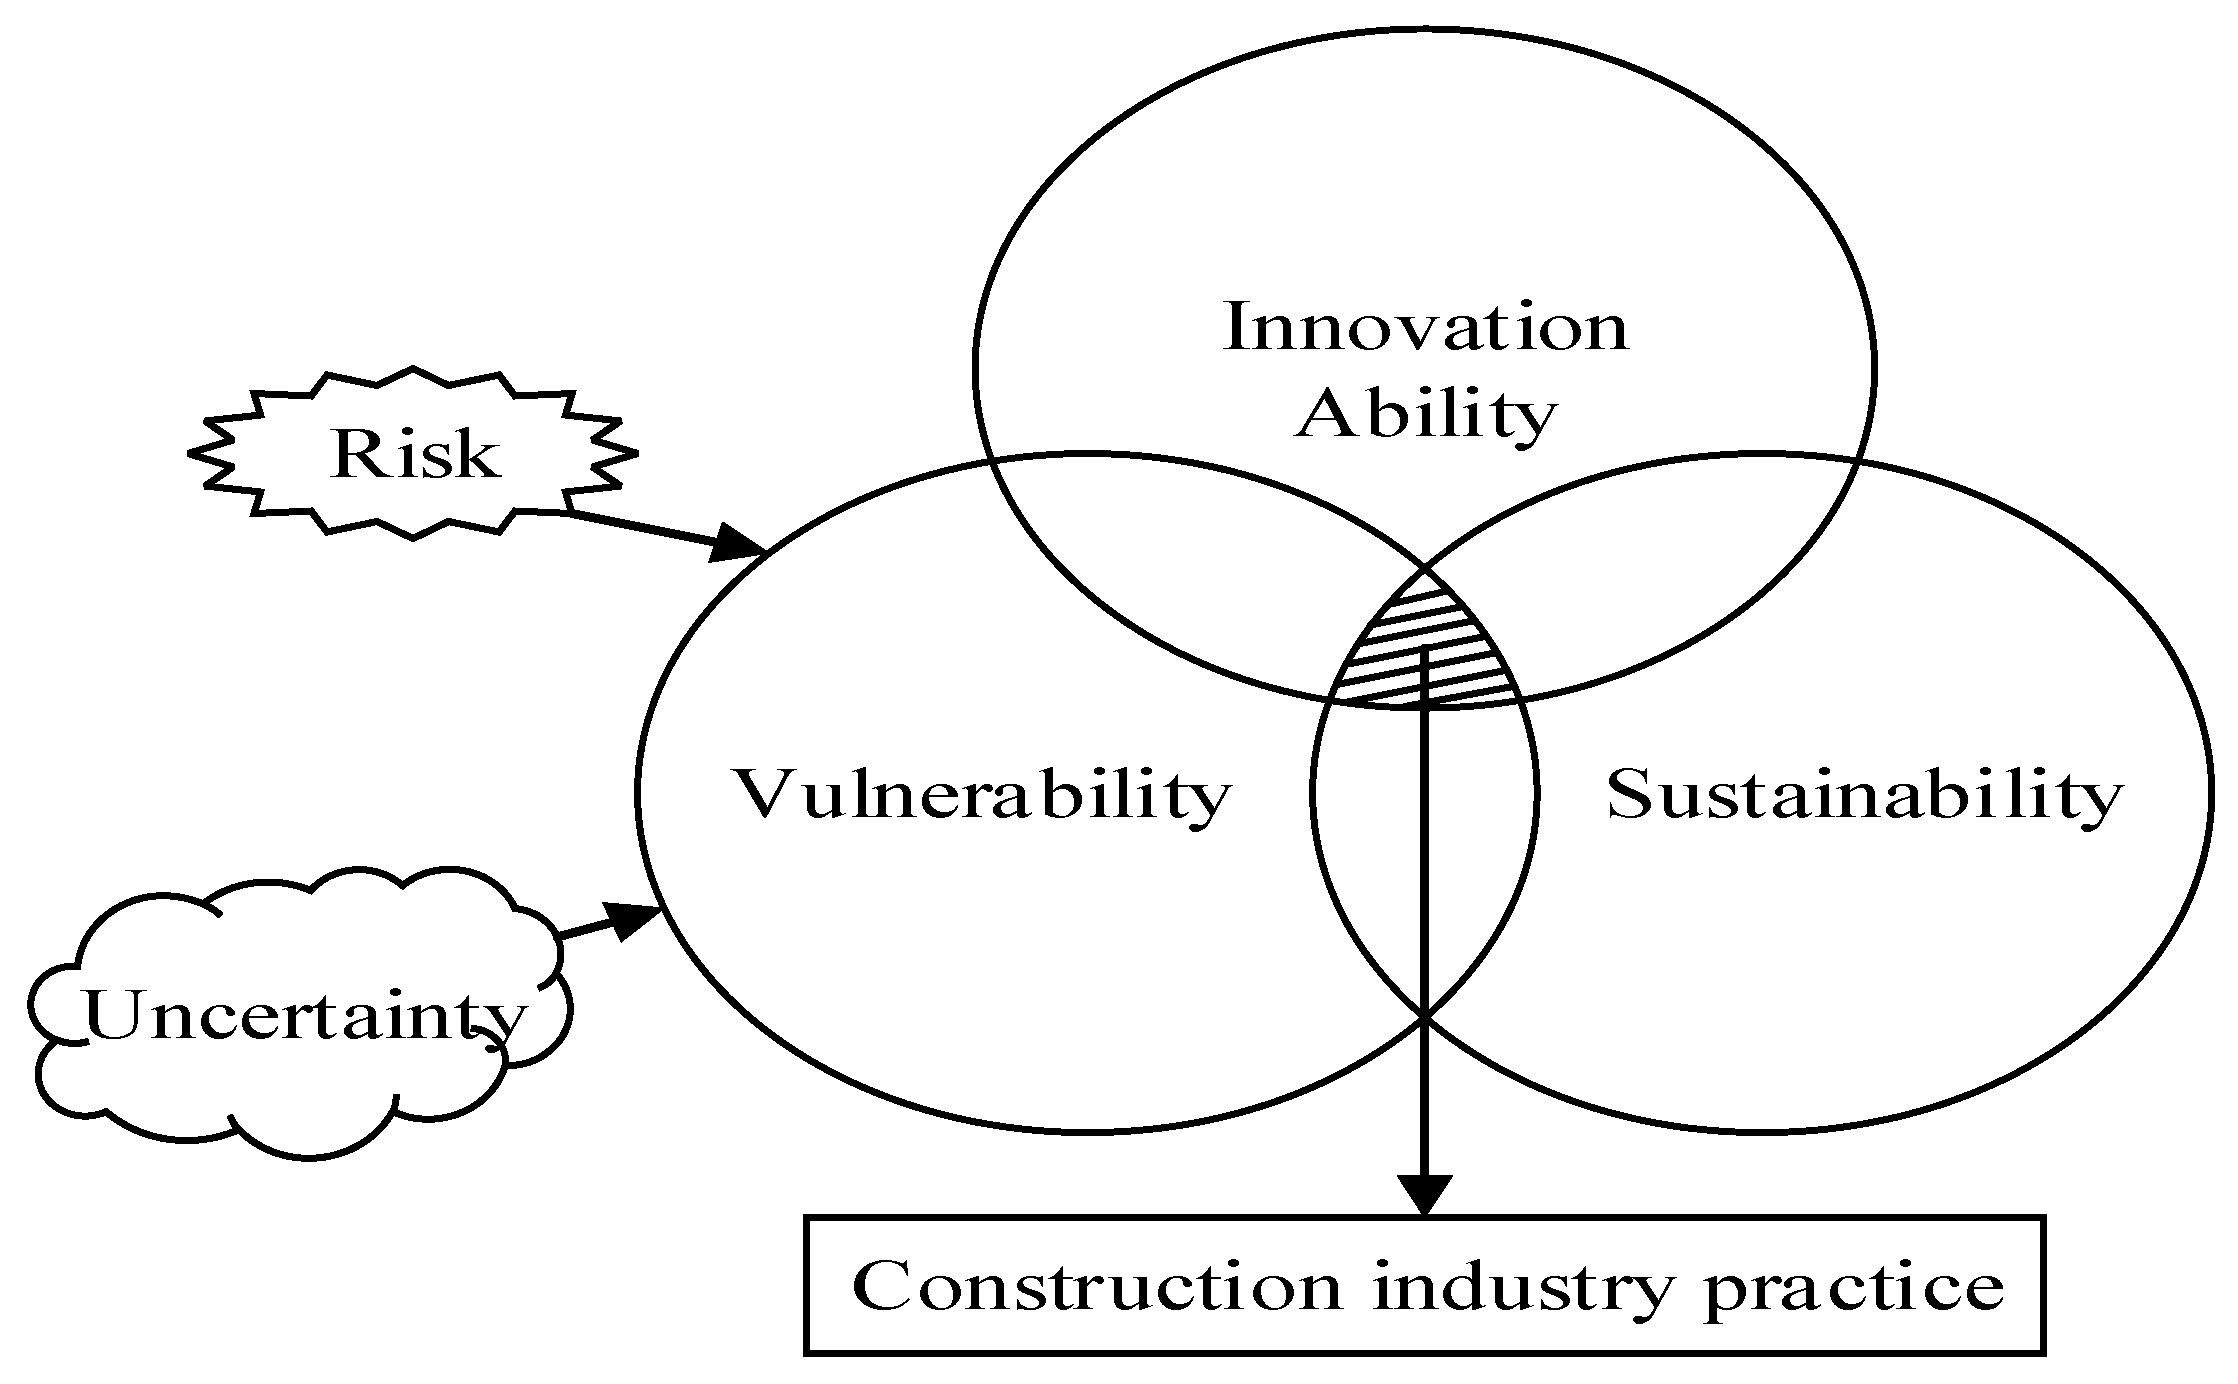
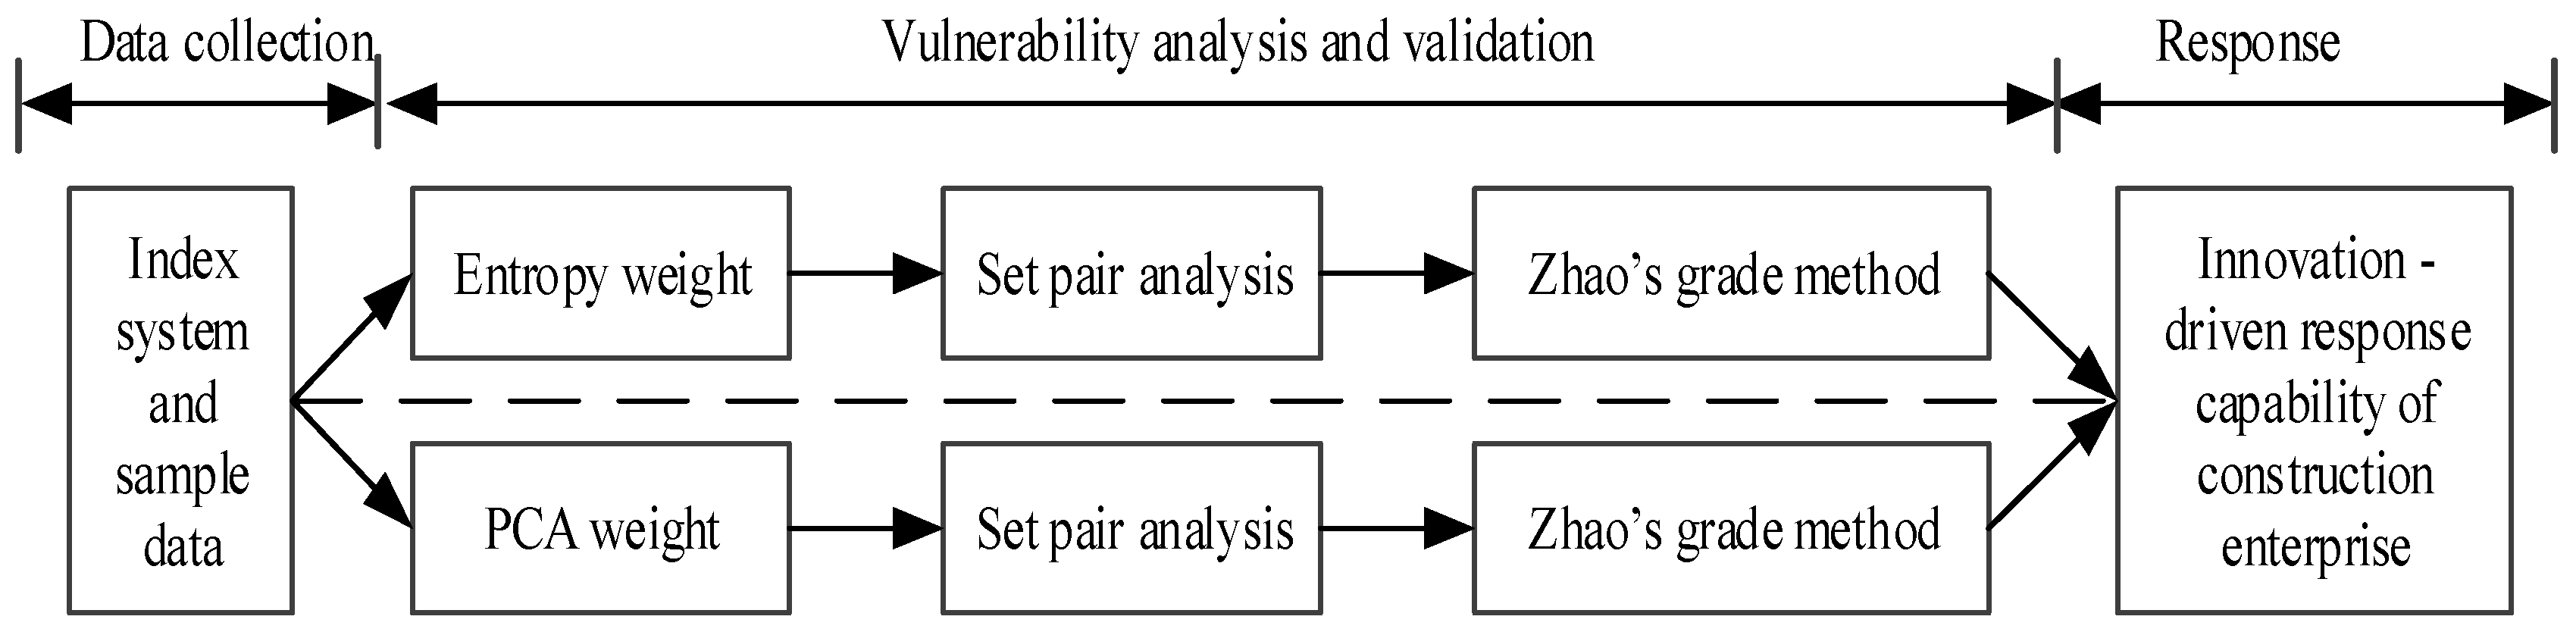
2.4. Analysis Level and Framework

Items A to E in the aforementioned framework of CEIC can be summarized in the following Table 1. Table 1 shows that there are three implications for CEIC. The implications are reflected in the following aspects. (a) Innovation capability is inherently unstable. (b) Innovation capability is sensitive to the interferences and changes from the outside world. (c) CEIC is vulnerable to risk. Thus, the vulnerability of CEIC is a comprehensive system affected by sensitivity and adaptability. Sensitivity is the degree of susceptibility to external shocks, or ability to deal with innovation uncertainty and risk [77,83,84,85,86]. If a system has weak sensitivity, it would be less susceptible and demonstrate stronger resistance than one with strong sensitivity. Adaptability is the ability to quickly adjust from a risky or uncertain situation to a stable or sustainable situation. It also demonstrates the ability of a system to maintain itself. Adaptability has a direct relationship with the innovation self-maintenance capability of a system.
Table 1. Analysis level.
TopicInnovation and uncertaintyInnovation capabilityVulnerability
Literature summaryManaging uncertainty is absolutely necessary from the perspective of construction innovation. There will always be something unforeseeable. Flexibility and creativity are important features of a successful innovation strategy.System dynamics and uncertainty are likely affected by product, technology, organization, and people. The current influence factors and measurement methods are not industry specific.Uncertainty threats are studied using system sensitivity and adaptability to analysis the vulnerability in political, social, economic fields.
Comprehensive methods or mixed method such as E-SPA, PCA, and SPA were used to assess economic vulnerability.
Major trends in researchSystematical description or linkage to deal with uncertainty with quantitative methods to promote innovation process.Uncertainty measurement of CEIC with generic influence factorsExploratory implementation of the measurements and verification of innovation vulnerability.
Research FocusThis research constructed the vulnerability-assessment framework, implemented the corresponding indices, and verified CEIC using common comprehensive methods from economic vulnerability areas.
In summary, the vulnerability indicator ( X ) of CEIC could be expressed in Equation (1).
X = f ( S , A )
Letter S represents sensitivity. Letter A represents adaptability. Large value of X indicates the tendency towards exposure to risk and uncertainty. It also means that CEIC will be slowed down to return to a sustainable state. Thus, the framework of Equation (1) is used to analyze vulnerability from two aspects, namely system sensitivity and adaptability. This research extracted data from 2013 National Innovation Index Reprot [96] to build the vulnerability indices in Table 2. In Table 2, the target layers include Innovation Input Capability (IIC), Cooperative Innovation Capability of Enterprise (CICE), Intellectual Property Capability (IPC), Change Innovation Capability (CIC), and Innovation Environment (IE). Each target layer is further divided into sensitivity indices and adaptability indices. The explanations of both sensitivity and adaptability indices in Table 2 include their indicators, measurement units, descriptions, and tropisms. For sensitive and adaptive indicators, a positive tropism (+) indicates a direct relationship between the index and the sensitivity or adaptability; a negative tropism (−) indicates an inverse relationship between the index and the sensitivity or adaptability.
Table 2. Vulnerability-assessment framework and indices of construction enterprise’s innovation capability (CEIC).
Target layerSensitivity (S) IndicatorsSensitive indicator description and its tropismAdaptability (A)IndicatorsAdaptive indicator description and its tropism
Innovation Input Capability (IIC)IICS1Innovative funding accounted for the main business revenue/%It reflects the strength of innovation funding (−)IICA1R&D expenditure accounts for the main business revenueIt reflects R & D expenditure intensity (+)
IICS2The proportion of R & D types of HR employed/%It reflects the intensity of R & D personnel investment (−)IICA2The proportion of PhD graduates in HR of a corporate It reflects the structure of highly educated personnel in an enterprise (+)
IICS3The funding of R & D specific sector accounted for corporate R & D expenditure/%It reflects the state of the R & D funding of a specific sector (−)IICA3The personnel R & D investment of a specific sector accounted for that of corporate R & D /%It reflects the manpower situation of R & D institutions (+)
Cooperative Innovation Capability of Enterprise (CICE)CICES1Cooperation Project accounted for the whole research project/%It reflects the cooperative scope of the enterprise (+)CICEA1The R & D expenditure proportion of universities and research institutions in whole corporate R&D expenditures/%It reflect R & D cooperation with universities and research institutions (+)
CICES2The ratio of technology import expenditure accounted for the whole R & D fundingIt reflects the introduction status of technology with respect to independent research (+)CICEA2The ratio of digestion and absorption funds accounted for technology import fundsIt reflects the absorption and re-innovation status for the introduction technology (−)
CICES3The proportion of cooperation innovative project accounted for the whole enterprise project/%It reflects the innovation state of the business cooperation with external institutions (−)CICEA3The proportion of cooperation patent accounted the total patent application/%It reflects the cooperation scale of technological inventions (+)
Intellectual Property Capability (IPC)IPCS1The percent of enterprise invention patent applications accounted for the whole patent applications/%It reflects patent application levels. (−)IPCA1100,000 RMB R & D funding per invention patent applications/(No./100,000 RMB)It reflects the patents output efficiency (+)
IPCS2The patent-owned project accounted for the whole enterprises’ projects/%It reflects the patent protection awareness of enterprises (−)IPCA210,000 patents-owned of enterprise employees/(piece /10,000 employees)It reflects the size of enterprise patent pool (+)
IPCS3# of implementations of invention patents accounted for overall implemented patents/%It reflects the transformation and application status of invention patents (−)IPCA3The ratio of patent licensing and transfer income accounted for new product sales revenueIt reflects the ratio of patent assets income and new product sales revenue (+)
Change Innovation Capability (CIC) CICS1New product marketing expenses accounted for all marketing costs/%It reflects the marketing strength of new-investment products (−)CICA1New product sales revenue accounted for the main business revenue/%Reflects the impact of business activities on the entire production of innovative activities(+)
CICS2PCT applications accounted for the whole patent applications/%It reflects the potential technology inventions an enterprise in the international market (−)CICA2Income from patented project accounted for the entire project income of an enterprise/%It reflects the corporate innovation competitiveness (+)
CICS3Labor productivity/(RMB/person)It reflects the innovation impact on labor productivity (−)CICA3Comprehensive energy output/%It reflects social performance of corporate energy consuming (−)
Innovation Environment (IE)IEGS1Direct government support (GS)extent/% The ratio of direct government support accounted for the whole R & D expenses (+)IEGS2Indirect government support(GS) extent/%The ratio of indirect government support accounted for the whole R & D expenses (−)
IESS1The extent of Social capital to support (SS) R&D/%The ratio of financial institutions support R&D accounted for the whole R & D expenses (+)IESS2The extent Social capital to support (SS) project development/%The ratio of social-capital development projects accounted for the total capital of enterprises (−)
Note 1: Indices from 2013 National Innovation Index Report [96]; Note 2: For sensitive and adaptive indicators, a positive tropism (+) indicates a direct relationship between the index and the sensitivity or adaptability; a negative tropism (−) indicates an inverse relationship between the index and the sensitivity or adaptability.
The authors designed the research steps and framework as per Figure 2. This research used the common mixed methods of E-SPA and P-SPA to analyze the vulnerability of CEIC. Particularly, Zhao’s grade standards [97] were used as SPA method of the inventor to grade the vulnerabilities of selected cases. In addition, the major influencing factors of response capability were ranked to manage the vulnerability of CEIC.
Figure 2. Research steps and framework.
Sustainability 08 00017 g002

3. Research Method

3.1. Entropy and SPA (E-SPA) Method

3.1.1. Entropy Weight

Many generic evaluation models rely on subjective weighting methods to determine the weights of indices in their evaluations. Entropy method [41] is an objective empowerment approach used to reflect the disorder degree of information in information theories, which now has been expanded to social and economic areas [40,41,47,98,99]. The weights of individual indicators are determined by calculating the entropy and entropy weight of each of them. The greater the entropy is, the smaller the corresponding entropy weight will be for any indicator. If an entropy weight is zero, the indicator provides no useful information to decision-makers. That indicator may be removed in the evaluation process. The amount of useful information that an indicator provides to a decision-maker is objective. So, using the entropy method to determine index weights could provide realistic and objective insight into the CEIC vulnerability system. The four main steps [41,44] taken are as follows.
Step 1: The formation of the evaluation matrix (Table S1).
Suppose there are m units and n indicators to be evaluated to establish the original data matrix in Equation (2).
R = ( r s t ) m × n ( s = 1 , 2 , ... , m ; t = 1 , 2 , ... , n )
where rst represents the actual value of the tth index of sth unit.
Step 2: The standardization of the evaluation matrix.
The following equation is used to normalize the matrix B,
B = ( b s t ) m × n ( s = 1 , 2 , ... , m ; t = 1 , 2 , ... , n ) with b s t = r s t r min r max r min
where rmax and rmin represent the maximum and minimum values, respectively, for the evaluation unit.
If indicator is the positive tropism (+)
b s t = r s t r min r max r min
If indicator is the negative tropism (−)
b s t = r max r s t r max r min
Step 3: The calculation of the entropy
The entropy of the system can be defined by using the following calculations:
H t = ( s = 1 m f s t ln f s t ) / ln m ( s = 1 , 2 , ... , m ; t = 1 , 2 , ... , n )
where f s t = b s t / s = 1 m b s t ; if f s t = 0 , redefine the f s t as
f s t = ( 1 + b s t ) / s = 1 m ( 1 + b s t )
Step 4: The calculation of the entropy weight
w = ( ω t ) 1 × n , ω t = ( 1 H t ) / ( n t = 1 n H t ) with t = 1 n ω t = 1

3.1.2. Set Pair Analysis (SPA)

Given two sets v and u , the set pair is expressed as H = ( v , u ) . Equation (7) calculates the connection degree of the two sets:
μ = S N + F N i + P N j = a + b i + c j , where a + b + c = 1
In Equation (7), N is the total number of characteristics of a set pair; S is the number of characteristics of two sets; P is the number of opposite characteristics of two sets; F is the number of characteristics of two sets, which are independent to each other. The ratio S N is the similarity degree of two sets; F N is the difference degree of two sets; P N is the opposite degree of two sets.
In summary, a in Equation (7) is the coefficient of similarity degree; c is the coefficient of opposite degree. i and j are the coefficients of the difference and the opposite degrees. i takes the uncertain value in the section [−1, 1] according to different situations; j takes the value of −1 in general situations to indicate that P N is the opposite to the similarity degree S N .

3.1.3. E-SPA Vulnerability Method

(1) The formation of vulnerability evaluation matrix of CEIC
Given that vulnerability system of CEIC is Q = { E , G , W , D } , the m evaluation unit is E = { e 1 , e 2 e m } , the n indices of each unit is G = { g 1 , g 2 g n } , the index weight is W = { w 1 , w 2 w n } (see also Equation (6)), the index evaluation is d k p ( k = 1 , 2 , , m ; p = 1 , 2 , , n ) , then the evaluation matrix D of vulnerability system of CEIC is shown in Equation (8).
D = [ d 11 d 12 d 1 n d 21 d 22 d 2 n d m 1 d m 2 d m n ]
(2) Identification of similarity and opposite degree
Identify the maximum index set U = { u 1 , u 2 , u n } and the minimum index set V = { v 1 , v 2 , v n } in the evaluation unit to generate the similarity degree a k p and opposite degree c k p of d k p in the evaluation matrix D on basis of the set { v p , u p } .
If d k p is a positive tropism (+),
{ a k p = d k p u p + v p c k p = u p v p d k p ( u p + v p )
If d k p is a negative tropism (−),
{ a k p = u p v p d k p ( u p + v p ) c k p = d k p u p + v p
(3) The connection degree of vulnerability
The connection degree μ of set pairs { E k , U } in [ V , U ] is shown in Equation (10).
{ μ ( E k , U ) = a k + b k i + c k j a k = ω p a k p c k = ω p c k p
(4) The vulnerability indicator X of CEIC
Given x k represents the connection degree between evaluation unit E k and the max index set U = { u 1 , u 2 , u n } for the Kth construction enterprise, which is shown in Equation (10), the larger x k is or the closer vulnerability to the max value, the more vulnerable and uncertain the CEIC, and vice versa.
x k = a k a k + c k

3.2. PCA and SPA (P-SPA) Method

The PCA Score process is shown in the following seven steps [100,101].
Step 1: Using SPSS 22 software to implement the factor analysis to extract the principal component F 1 , F 2 , , F n .
Step 2: Calculating the loading of F1 score. Factor scores were generated and standardized through loadings. The F1 loading was divided by the square root of the corresponding eigenvalues of F 1 , to generate its orthogonal eigenvectors. N indicators were given as a 1 , a 2 , , a N .
Step 3: Calculating F1 score (f1) with Equation (12). In Equation (12), x 1 , x 2 , ... , x N were the standardized data of N items with the first sample.
f 1 = a 1 × x 1 + a 2 × x 2 a N × x N
Step 4: Repeating the steps to calculate F 2 , F 3 and F n scores ( f 2 , f 3 , , f N ) in the first sample.
Step 5: According to the variance % ( v 1 , v 2 , v 3 , v n %) and cumulative variance % ( c v %) of Initial eigenvalues, the weighted sum score Fs was calculated by Equation (13) in the first sample.
Fs = ( v 1 f 1 + v 2 f 2 + v 3 f 3 + + v n f n ) / c v
Step 6: Repeating the process on other samples. Then, N indicators were normalized score to calculate the weight, and the weight set WP,
W P = [ w p 1 , w p 2 , , w p n ]
Step 7: Constructing the P-SPA Vulnerability method. After using Equations (8) and (14) to alternate the entropy weight, the authors followed the analogy steps of E-SPA method to analysis the vulnerability of CEIC.

4. Empirical Analysis

4.1. Data Collection

In order to verify the vulnerability method of CEIC, comprehensive, accurate, and representative data were retrieved from the “E01Civil Construction Industry Classification Guideline of the Chinese Securities Regulatory Commission (CSRC)”, which included a total of 51 public construction companies (E01 and E05 Building Decoration Classification Guideline) in the Shanghai stock exchange and the Shenzhen stock exchange, P.R. China in 2014. A set of these enterprises was identified and used to test the vulnerability framework. Enterprises from the CSRC list are usually large-scale, global competitors and ideal for CEIC analysis. The annual reports of the CSRC provide the enterprise specific information. The authors carefully cleansed the data using the following criteria. (1) The company is listed in the CSRC list for at least eight consecutive years; and (2) there must be an accurate business description. After data cleansing, there were eight enterprises that fit the criteria and were used in the model construction.
On average, researchers used between five and 25 companies with time durations of one to four consecutive years for validation or verification in research projects [92,93,94,95,96,97,98]. Additional data were collected from internal sources such as HR, intellectual property, government support, enterprise, innovation investment, management reports, secretarial files, and electronic records. All of the selected companies produced and maintained such information for their day-to-day managerial and operational use. In other words, these data were secondary in nature and were readily available within the business organizations.
The selected companies are listed in Table 3, and the corresponding data are listed in Table 4a,b. The eight companies included in Table 3 are large construction enterprises. The following framework does not contain any parameters that would be affected by the company size of a sample. In addition, the assessment method and framework are applicable to small and medium enterprises (SMEs).
Table 3. Selected samples of the eight construction enterprises.
IDThe Listed TimeDomain Business AreaResearch Time SpanThe Code
A2007Construction of structural steel, Industrial construction2007–20141
B2001Railway Engineering and other engineering construction, real estate projects, sales2007–20142
C1994Industrial construction, commercial construction, real estate, food service, design and consulting, and facility rental (since 2008)2007–20143
D2004Road and bridge construction, asphalt concrete sales, environmental protection business 2005–20144
E1997Project contracting, cement production and sales, civil explosive, hydroelectric power construction, management of expressways, real estate2004–20145
F2006Construction, real estate development2006–20146
G2005Installation of cement production lines, manufacturing of machinery and equipment, design and technology transfer, supervision2007–20147
H2005Civil construction, Industrial construction, public facilities construction, building decoration, sales of building materials2005–20148
Table 4. Sensitivity data of vulnerability of CEIC.
Innovation Input capabilityCooperation Innovation CapabilityIntellectual Property CapabilityInnovation Change CapabilityInnovation Environment
IICS1IICS2IICS3CICES1CICES2CICES3IPCS1IPCS2IPCS3CICS1CICS2CICS3IEGS1IESS1
A9.15%30.8%40.98%0.9%1.69224.2%12.37%9.89%40.0%4.0%12.95%26787921.57%3.41%
B8.78%30.5%37.29%1.17%1.1224.4%12.49%10.59%38.7%5.8%10.54%25439626.62%4.05%
C9.17%28.9%44.22%0.97%1.4325.7%11.92%13.66%42.9%3.9%12.62%26690219.89%3.92%
D7.98%30.9%39.89%1.50%0.9922.8%12.51%10.79%32.6%3.3%14.55%26798323.09%2.97%
E8.46%27.3%42.25%1.32%1.0123.9%13.05%14.82%45.5%4.9%13.21%25998720.99%3.38%
F9.22%28.4%43.77%0.73%1.7323.1%13.58%13.37%36.1%3.1%12.74%26980819.72%3.02%
G9.01%29.1%39.83%0.68%1.6625.5%11.47%9.52%39.9%2.9%13.09%27000221.03%3.96%
H8.69%31.0%40.17%1.01%1.5924.9%12.06%12.22%40.8%3.7%13.11%26814720.76%3.55%

4.2. E-SPA Result

4.2.1. Entropy Weight of Indices

The authors constructed the evaluation matrix and matrix standardization with Equations (2) and (3). They then used Equations (4)–(6) to deal with the standardization data in Table 4 and Table 5. The results of entropy weights of indices are shown in Table 6. The corresponding calculation process in this research could be seen in the Supplementary Materials.
Table 5. Adaptability data of vulnerability of CEIC.
Innovation Input capabilityCooperation Innovation CapabilityIntellectual Property CapabilityInnovation Change CapabilityInnovation Environment
IICA1IICA2IICA3CICEA1CICEA2CICEA3IPCA1IPCA2IPCA3CICA1CICA2CICA3IEGS2IESS2
A9.15%3.31%11.35%44.19%0.13921.84%0.23199313.9%52.99%10%27.0%36.9%6.8%
B10.27%1.49%10.98%42.97%0.15221.55%0.30189915.3%53.73%9.77%26.3%40.3%10.7%
C8.96%2.99%11.77%43.58%0.14424.31%0.24096715.1%52.92%9.31%27.9%39.6%8.9%
D9.39%4.01%11.09%45.76%0.09817.67%0.22995214.7%53.88%10.34%25.4%43.3%9.7%
E7.29%4.21%12.03%44.62%0.10118.23%0.206100713.6%51.64%9.69%25.9%39.8%9.5%
F8.98%3.13%10.84%40.88%0.12719.71%0.20098114.2%53.01%10.51%27.3%38.1%8.4%
G9.37%3.47%9.96%41.47%0.13016.89%0.236101713.7%52.68%9.98%28.5%39.9%10.6%
H9.59%3.00%10.38%43.51%0.13619.01%0.21997715.0%53.03%10.01%27.2%40.4%10.9%

4.2.2. Identification of Vulnerability

The author constructed the assessment matrix using Equation (8) with indices data to generate the similarity and opposition degrees. In step 1, the authors identified the maximum data set U and minimum data set V as shown in Table 7.
In step 2, the authors used the Equations (9a) and (9b) to generate the similarity a k p and opposition degree c k p in the d k p of Equation (8).
In step 3, the authors used Equation (10) to deal with index weight, the similarity a k p , and opposition degree c k p . The calculations generated the similarity a and opposition degree c of vulnerability of enterprise innovation capability in Table 8. The authors used Equation (11), the similarity a , and opposition degree c to calculate the vulnerability indicator X in Table 8.
In step 4, the authors used the analogy process to deal with sensitivity and adaptability data respectively, the similarity a, opposition degree c , and vulnerability indicator X of enterprise’ sensitivity. The data of adaptability of innovation capability were also generated as shown in Table 8.
Table 6. Entropy weight and PCA weight of indices.
IndexIICS1IICS2IICS3CICES1CICES2CICES3IPCS1IPCS2IPCS3CICS1CICS2CICS3IEGS1IESS1
Entropy Weig0.04320380.0490670480.0352481560.038770840.0532061640.0405323660.0288196820.0388674650.0297265850.0306313360.0246603970.0474924910.0395191580.04478313
PCA Weig0.1068235710.014618210.0278868060.0472625620.0031701260.2652836250.1859395360.0149471610.1636103760.1258051230.1850060110.1087801120.0481226220.278513069
IndexIICA1IICA2IICA3CICEA1CICEA2CICEA3IPCA1IPCA2IPCA3CICA1CICA2CICA3IEGS2IESS2
Entropy Weig0.023011680.0253651340.0323593830.0330757120.0412659510.0379078170.0337853780.0266617270.0482863380.0260450510.0288069430.0334789110.0247996680.04062169
PCA Weig0.0907823320.1852677330.0144515840.0360462660.2194498050.1853639840.1850203890.0996164930.1741764120.0057602010.2615741650.1362899930.0053621250.110553235
Table 7. The max data set U and min data set V.
V0.09220.310.44220.00680.990.2570.13580.14820.4550.0580.14552700020.19720.0297
U0.07980.2730.37290.0151.730.2280.11470.09520.3260.0290.10542543960.26620.0405
Sign.−1−1−111−1−1−1−1−1−1−111
V0.07290.01490.09960.40880.1520.16890.28990.1360.51640.09310.2850.4330.109
U0.10270.04210.12030.45760.0980.24310.30110170.1530.53880.10510.2540.3690.068
Sign.1111-1111111−1−1−1
Table 8. a, c and X of vulnerability framework of CEIC.
SensitivityAdaptabilityVulnerability
a s c s X s a a c a X a a v c v X V
AE-SPA0.4981559540.892064030.504532050.5123656050.4774394070.5176429690.5046280.48384690.5105117
P-SPA0.4912357130.4926011560.4993060620.454089150.5566272690.4492745360.4714001520.5267898970.47225491
BE-SPA0.5032313660.4871237780.5081322280.4824504010.5151589260.4836065460.49376620.4998930.4969171
P-SPA0.4592893560.5414364980.4589562210.5951916450.399448440.5983990130.5318586190.4656175550.533204334
CE-SPA0.4816935520.5037983430.4887848940.4997366770.4880920230.5058940660.48991170.49664460.4965877
P-SPA0.4873139810.5045769760.4912979370.492951450.5251357070.4841937610.4903242860.5155549540.487458401
DE-SPA0.5037131350.4916825090.5060431380.5126866890.4811305670.515876220.50780030.48687640.510518
P-SPA0.5466447120.4438425880.5518947210.4248356830.5680835830.4278652840.481600990.510184940.485589657
EE-SPA0.4715340320.5200725640.4755253080.5033903540.4922862340.5055761680.48604370.50741670.4892431
P-SPA0.4415404150.5474333880.4464632070.3727004970.6152438490.3772484740.4047811990.58364290.409521783
FE-SPA0.4870242560.5072392440.489834190.4910559360.4961072880.4974414810.48886060.5021690.4932856
P-SPA0.5443613070.4511371580.5468228490.4090526740.6018142280.4046553240.472109050.5315958760.470366378
GE-SPA0.5110317930.4853675780.5128784790.4771646520.5137686970.4815305210.49560630.49830350.4986431
P-SPA0.5720031640.4247030540.5738934440.3647235940.6428512290.3619816470.4613197840.541190070.460164838
HE-SPA0.4938452360.4911140370.5013864520.4803875080.5083839740.4858428030.48771560.498980.4942919
P-SPA0.4939411320.4912111710.5013855530.4136057430.6051421910.4059941910.4510435520.5520481910.449653339
Note: (a) a s , c s and X s refer to the similarity, opposition and vulnerability in the single sensitivity system of CEIC. (b) a a , c a and X a refer to the similarity, opposition and vulnerability in the single adaptability system of CEIC. (c) a v , c v and X V refer to the similarity, opposition and vulnerability in the whole vulnerability system of CEIC.
According to Table 9, the comparison of Xv indicates that companies A and D had the most vulnerability and company F had the least vulnerability of CEIC. At the same time, the ranking of vulnerabilities of CEIC in the eight companies was E, F, H, C, B, G, A and D, in an ascending order. By comparing the Xs of sensitivity, it was found that G, B, D are the three most sensitive companies. E is the least sensitive. By comparing the Xa of adaptability, it was found that A, D and C are the three most adaptable companies. E is the least adaptable.
Therefore, the less sensitive a company is, the better the vulnerability of their CEIC is managed. The more sensitive and adaptable they are, the more likely it is that vulnerability of their CEIC is increased. For the sustainable development of CEIC, it is a pertinent practical solution to manage and reduce sensitivity and promote adaptability. Not only should attention be given to adaptability, sensitivity is important to address in examining the linkage between innovation capability and vulnerability factors.

4.3. P-SPA Result and Validation

Using Equation (14), the weights of indices of the PCA method were generated as shown in Table 6. Further, the authors used the weight indices of PCA method to alternate the entropy weight in Equation (8) in order to calculate the vulnerability of CEIC. The results are shown in Table 8.
Following the steps in Section 3.2, the authors extracted the six principal components from F1 to F6 and their variances (%) in Table 9 to build Equation (15). The weighted sum scores of Fs are shown in Equation (15).
Fs   = ( 0.30251 f 1 + 0.25894 f 2 + 0.18625 f 3 + 0.10871 f 4 + 0.07236 f 5 + 0.05256 f 6 ) / 0.98133
Table 9. Total variance explained of original questionnaire.
ComponentInitial EigenvaluesExtraction Sums of Squared Loadings
Total% of VarianceCumulative %Total% of Variancetotal %
18.47030.25130.2518.47030.25130.251
27.25025.89456.1457.25025.89456.145
35.21518.62574.7705.21518.62574.770
43.04410.87185.6413.04410.87185.641
52.0267.23692.8772.0267.23692.877
61.4725.25698.1331.4725.25698.133
70.5231.867100.000
Extraction Method: Principal Component Analysis.
Using PCA and SPA (P-SPA) methods, the authors found that company B had the greatest vulnerability X v and company E had the least vulnerability X v of CEIC. At the same time, the companies with the ascending vulnerability X v of CEIC were E, H, G, F, A, D, C and B.
With the results of P-SPA method in Table 7 and Table 8, through comparing the X s and X a of sensitivity and adaptability, the authors found that companies E and F both had lower vulnerability X v , lower sensitivity, and higher adaptability correspondingly. The calculation results of P-SPA validate the vulnerability system discussed in Section 4.2. While companies A and D both had higher vulnerability X v , the higher sensitivity X s and lower adaptability X a correspondingly. The findings help to develop CEIC by promoting adaptability and managing sensitivity simultaneously.

4.4. Vulnerability Grade

The authors used Zhao’s grade standard [97] to calculate indicators for the SPA method. The calculation of the SPA classic grade method is shown in the following three evaluation conditions.
If max [ a , b , c ] = b , it is grade 2; If max [ a , b , c ] = a , and a + b 0.7 , it is grade 1, otherwise it is grade 2; If max [ a , b , c ] = c , and b + c 0.7 , it is grade 3, otherwise it is grade 2.
Grade 1 indicates that the vulnerability of innovation capability is high. A company needs to reduce risk in the system and manage its CEIC. Grade 2 indicates that the vulnerability is satisfactory. A company needs to be more active in managing the uncertainty of its innovation capability. Grade 3 indicates that the vulnerability is low. It is recommended to continue current operations to maintain innovation capability.
The calculations of the vulnerability grades of both the E-SPA and P-SPA methods are based on Equation (7) and Table 8, with further comparison shown in Table 10. The samples are at level 2 from the calculations of both the E-SPA method and P-SPA method. These companies were in a good position to manage risk or uncertainty of innovation capability. The results show that the P-SPA method effectively validates the E-SPA method to assess the vulnerability and its grade of CEIC.
Table 10. The vulnerability grade of innovation capability.
CodeABCDEFGH
E-SPA method22222222
P-SPA validation22222222

4.5. Response with Major Influencing Factors

The vulnerability Xv of CEIC comes from the combined effects of sensitivity and adaptability. The authors constructed a vulnerability matrix of CEIC using the horizontal axis with low and high sensitivity and the vertical axis with low and high adaptability. The high sensitivity and low adaptability interval is an ideal area for CEIC. It shows an effective path to improve the adaptability and management or to reduce sensitivity. With low sensitivity and high adaptability, it helps to reduce the vulnerability of CEIC. Thus, an innovation strategy might look for the major influencing factors and compose a targeted solution to improve the adaptability of CEIC to maintain this sustainable path. This research used the major impact index formula [14,20,102] to generate and compare the impact extent of the adaptable indices, which are shown in Equation (16) and Table 11.
A i = ω i d i / i = 1 n ω i d i × 100 %
A i represents the impact extents of indices. ω i represents the entropy weight of an index. d i represents the standardization value of an index. n represents the index number in the adaptability system of CEIC. This research used Ai ≥ 5% [14,20,102] to evaluate the extent of impacts of indices and compared their frequencies. The indices were then placed in descending order of their frequencies. The top frequencies were the major influencing factors of the adaptability system in the vulnerability of CEIC.
Table 11. Major influence factors in the adaptability system.
IICA1IICA2IICA3CICEA1CICEA2CICEA3IPCA1IPCA2IPCA3CICA1CICA2CICA3IEGS2IESS2
A5.42546.41118.2088.47443.75269.55263.91718.02283.21875.92936.25686.11929.367815.344
B9.931206.88156.1135010.27414.580020.839110.4874.765710.2535.0170.8552
C5.27735.724311.5787.48882.501815.5125.47556.287417.4356.090402.65175.86718.1089
D5.69468.25246.203211.61514.4911.39943.40664.205310.9719.14618.682911.75604.1751
E011.53214.71311.52517.7203.11270.912611.095004.147712.7666.16656.3067
F6.1047.15346.434408.93596.738608.6667.97127.450713.4746.06169.424711.585
G11.37413.07602.83211.90608.528318.8812.01158.563711.39009.33032.105
H8.82396.9963.2628.85626.07465.3813.15768.755919.7568.02968.34866.97525.5830
Freq.77665536575674
Freq.%0.8750.8750.750.750.6250.6250.3750.750.6250.8750.6250.750.8750.5
The largest frequency (0.875%) indices in the adaptability system of CEIC were IICA1, IICA2, CICA1 and IEGS2. Table 11 also shows that the major influencing factors (0.875%) for CEIC mainly focus on (a) investment, especially R&D expenditure and the proportion of highly educated employees [103]; (b) innovation and change, especially the impact of new service or innovation activities on the market [78]; (c) government support, for example, large program support and taxation exemptions for application of certain innovation technologies [3,56,60,104,105,106].
The second-tier factors (0.75%) are IICA3, CICEA1, IPCA2 and CICA3. They emphasize the key roles of HR investment and innovation in change, referring to the amount of HR of R&D institutions and the management of corporate energy consumption. In addition, cooperative innovation of enterprise and IP capability played major roles in sustainable CEIC, such as the enterprise investment in university–industry cooperative innovation and the size of enterprise patent pools [69,84,107].
However, much attention should be given to output performance of IP capability (IPCA1, 0.375%) to promote IP marketing and to solve IP transformation problems [108,109]. The lack of social capital [3,110] support given to corporate total capital (IESS2, 0.5%) also leads to inadequate investment in CEIC.

4.6. Discussion

As discussed in this paper, CEIC is vulnerable, and this vulnerability can be measured. The researchers applied and confirmed a quantitative system approach to address the vulnerability of an enterprise’s innovation efforts. Vulnerability research, as a new paradigm of sustainable development, uncertainty and risk, sheds light on how to best analyze the uncertainty of innovation capability. As an innovative method, SPA focuses on uncertainty and is widely applied in the economic and social fields [11,12,18,26,111,112,113,114], and is combined with some common comprehensive methods, such as E-SPA and P-SPA [44,100,101,102]. Innovation capability is an important driver of economic development and is closely linked to uncertainty and risk. However, within the new paradigm of reducing uncertainty, very little research exists to develop a systematic approach to assessing the vulnerability of innovation capability [22,23].
In order to extend a generic model of construction innovation [71,76], this new vulnerability framework of CEIC focuses on the extent of innovation investment, IP capability, cooperative innovation, change innovation and the overall environment to foster companies’ innovation. Further, this research used the corresponding index in the 2013 National Innovation Survey System of MOST, China to match and test the proposed framework (see also Section 2.4) of the vulnerability system of CEIC, which contained two subsystems referred to as the sensitivity and adaptability of a systematic approach and includes the above five criteria and 28 indicators.
Meanwhile, this paper applied the E-SPA as the main method to analyze the case data to evaluate levels of vulnerability, comparing the results of P-SPA to confirm the empirical results. The authors used the E-SPA and P-SPA measurements regarding the vulnerability and uncertainty of innovation capability and quantitatively bridged the gap in system assessments of vulnerability of CEIC. More importantly, this research justified the necessity for a new approach to examining construction innovation uncertainty and built a foundation for overcoming construction innovation uncertainty, with a view to provide a basis for further research on this topic.
For two subsystems of CEIC, sensitivity referred to the ability of the system to withstand external or internal interferences or pressures. The less the sensitivity, the greater a system’s resilience, and vice versa. Adaptability refers to the ability to respond to change which embodies an uncertain state or crisis situations. In other words, the greater the adaptability of a company, the stronger will be the ability of a company to respond to those challenges, and vice versa.
In this research, case studies showed that the sustainable CEIC needed to increase the innovation investment capability such as to enhance HR funding for highly skilled or talented individuals and R&D expenditure for individuals that show the greatest potential for innovation. Much attention seems to be given to the collaboration innovation between universities and research institutions, with the objective to impact business and marketing strategies that already demonstrate a high level performance of intellectual property, which could increase social recognition and capital support, in order to obtain more government assistance [104,115,116,117,118]. Thus, at the policy planning or strategic levels, positive industrial and corporate environments may lead to an optimization of an enterprise’s innovation efforts and may attract sustainable government support. Furthermore, well established policy and strategic planning may encourage investment in corporate innovation. Topics for further research may include how to implement a practical strategy and operation of a market-oriented university–industry cooperative innovation approach, and how to strengthen and improve the innovation performance of intellectual property capabilities.

5. Conclusions

This study discussed the vulnerability framework of CEIC, and attempts to quantify an evaluation system for CEIC. It opened doors to future research in the theory and application areas in this field. This study proposed a new systematic approach to supplement the quantitative framework and methods in examining the uncertainty regarding a company’s ability to innovate applied to the case of construction enterprises. Uncertainty regarding CEIC should not simply be ignored. Rather, it should be managed intelligently and, in an ideal world, help to develop an environment conducive to ongoing innovation. Vulnerability, and the management thereof, is a new domain in the large field of socioeconomic research. This research built a vulnerability framework for CEIC, which examines the subsystems of sensitivity and adaptability and a number of factors including innovation investment capability, cooperation innovation capability, intellectual property capability, change innovation capability, and innovation environment. Further, this research assessed the vulnerability of CEIC, using the comparative results of E-SPA and P-SPA methods for confirmation. It analyzed the major influencing factors in promoting sustainable CEIC.
Case studies showed that the two comparative methods confirm the same grade level of vulnerability of CEIC. We identified a stronger practical approach to reduce the vulnerability of CEIC by managing or reducing sensitivity and strengthening adaptability to respond to new economic environments. The major influencing factors of CEIC are focused on (a) the highly educated HR innovation team, (b) R&D investment intensity, (c) substantial market-led corporate–university–industry cooperation on intellectual property performance, (d) government support and social capital support, and (e) change innovation in construction energy consumption.
In summary, this research provided a theoretical framework and an application method to assess and evaluate both the vulnerability and uncertainty involved in innovation. This research can be implemented to evaluate and grade the vulnerability of CEIC at national, industrial or enterprise levels with the corresponding sequential data and indices. A limitation of this research may result due to the sequential data boundary, i.e., at industrial or national levels, in conducting a systematic analysis to conceptualize innovation capability. A possible future research project may be to expand the dynamic data collection to analyze the vulnerability of construction innovation at both the macro and industrial levels.

Supplementary Materials

Supplementary can be found at www.mdpi.com/2071-1050/8/1/17/s1.

Acknowledgments

This research is supported by the National Nature Science Foundation of China (NO.71301013), Humanity and Social Science Program Foundation of Ministry of Education of China (NO.13YJA790150), China ASC Fund (NO. asc-kt2014022 and asc-kt2014023), China scholarship council, Shaanxi Nature Science Fund (NO.2014JM2-7140), Shaanxi Social Science Fund (NO.2014HQ10, NO. 2015Z071 and NO. 2015Z075), Xi'an Science Technology Burea Fund(NO.CXY1512(2)), and Special Fund for Basic Scientific Research of Central College (Humanities and Social Sciences), Chang’an University (NO.0009-2014 G 6285048 and NO. 310828155031).

Author Contributions

Prof. Zhang and Prof. Li analyzed the data and contributed to drafting the paper. Prof. Zhang and Prof. Li contributed to the concept and design of the paper. Prof. Xie and Prof. Schmidt contributed useful advice and modified the paper. Prof. Zhang is in charge of the final version of the paper.

Conflicts of Interest

The authors declare no conflict of interest.

Abbreviations

The following abbreviations are used in this manuscript:
CEIC
Construction enterprises’ innovation capabilities
E-SPA
The entropy and set pair analysis method
P-SPA
The principle cluster analysis and SPA method
R&D
Research and development
UNCTAD
United Nations Conference on Trade and Development
UNDP
United Nations Development Programme
OECD
Organization for Economic Co-operation and Development
OECD STI
OECD Science, Technology and Innovation
MOST, China
Ministry of Science and Technology of the People´s Republic of China

References

  1. Akintoye, A.; Goulding, J.; Zawdie, G. Construction Innovation and Process Improvement; Wiley-Blackwell: Hoboken, NJ, USA, 2012. [Google Scholar]
  2. Brochner, J. Construction contractors as service innovators. Build. Res. Inf. 2010, 38, 235–246. [Google Scholar] [CrossRef]
  3. Castro-Lacouture, D.; Irizarry, J.; Ashuri, B.; American Society of Civil Engineers; Construction Institute. Construction research congress 2014 construction in a global network. In Proceedings of the 2014 Construction Research Congress, Atlanta, GA, USA, 19–21 May 2014; American Society of Civil Engineers: Reston, VA, USA, 2014. [Google Scholar]
  4. Forbes, L.H.; Ahmed, S.M.; Ebooks Corporation. Modern construction lean project delivery and integrated practices. In Industrial Innovation Series; CRC Press: Boca Raton, FL, USA, 2011. [Google Scholar]
  5. Goh, B.; Tjoa, A.; Xu, L.; Chaudhry, S. Intelligent enterprises for construction: Bridging the technology and knowledge gaps through innovation and education. Res. Pract. Issues Enterp. Inf. Syst. 2006, 205, 119–131. [Google Scholar]
  6. Blayse, A.M.; Manley, K. Key influences on construction innovation. Constr. Innov. 2004, 4, 143–154. [Google Scholar] [CrossRef]
  7. Suprun, E.V.; Stewart, R.A. Construction innovation diffusion in the Russian Federation. Constr. Innov. 2015, 3, 278–312. [Google Scholar] [CrossRef]
  8. Kulatunga, U.; Amaratunga, R.; Haigh, R. Construction Innovation: A Literature Review on Current Research. 2006. Available online: http://usir.salford.ac.uk/9886/1/205_Kulatunga_KJ_et_al_CONSTRUCTION_INNOVATION_A_LITERATURE_REVIEW_ON_CURRENT_RESEARCH_2006.pdf (accessed on 21 December 2015).
  9. Hultgren, A.; Tantawi, A. Front-End Idea Screening of Potential Radical Innovation in Large Firms: A Holistic Framework for the Volvo Group; Chalmers University of Technology: Göteborg, Sweden, 2014. [Google Scholar]
  10. Baker, S.M. Vulnerability and resilience in natural disasters: A marketing and public policy perspective. J. Public Policy Mark. 2009, 28, 114–123. [Google Scholar] [CrossRef]
  11. Le Breton-Miller, I.; Miller, D. The paradox of resource vulnerability: Considerations for organizational curatorship. Strat. Manag. J. 2015, 36, 397–415. [Google Scholar] [CrossRef]
  12. Dabla-Norris, E.; Gündüz, B.Y. Exogenous shocks and growth crises in low-income countries: A vulnerability index. World Dev. 2014, 59, 360–378. [Google Scholar] [CrossRef]
  13. Dass, M.; Kumar, P.; Peev, P.P. Brand vulnerability to product assortments and prices. J. Mark. Manag. 2013, 29, 735–754. [Google Scholar] [CrossRef]
  14. Li, F.; Wan, N.Q.; Shi, B.L.; Liu, X.M.; Guo, Z.J. The vulnerability measure of tourism industry based on the perspective of “environment-structure” integration a case study of 31 provinces in mainland China. Geogr. Res. 2014, 33, 569–581. [Google Scholar]
  15. Herceg, I.; Nesti, D. A new cluster-based financial vulnerability indicator and its application to household stress testing in Croatia. Emerg. Markets Finance Trade 2014, 50, 60–77. [Google Scholar]
  16. Holand, I.S.; Lujala, P.; Rød, J.K. Social vulnerability assessment for Norway: A quantitative approach. Nor. J. Geogr. 2011, 65, 1–17. [Google Scholar] [CrossRef]
  17. Rodríguez-Núñez, E.; García-Palomares, J.C. Measuring the vulnerability of public transport networks. J. Transp. Geogr. 2014, 35, 50–63. [Google Scholar] [CrossRef]
  18. Rossignol, N.; Delvenne, P.; Turcanu, C. Rethinking vulnerability analysis and governance with emphasis on a participatory approach. Risk Anal. Int. J. 2015, 35, 129–141. [Google Scholar] [CrossRef] [PubMed]
  19. Springer, N.P.; Garbach, K.; Guillozet, K.; Haden, V.R.; Hedao, P.; Hollander, A.D.; Huber, P.R.; Ingersoll, C.; Langner, M.; Lipari, G.; et al. Sustainable sourcing of global agricultural raw materials: Assessing gaps in key impact and vulnerability issues and indicators. PLoS ONE 2015, 10, 1–22. [Google Scholar] [CrossRef] [PubMed]
  20. Hong, T.; Jian, Z. Regional vulnerability evaluation index system of environmental emergencies in petrochemical industry. Adv. Mater. Res. 2014, 1073–1076, 400–404. [Google Scholar]
  21. Turner, B.L.; Kasperson, R.E.; Matson, P.A.; McCarthy, J.J.; Corell, R.W.; Christensen, L.; Eckley, N.; Kasperson, J.X.; Luers, A.; Martello, M.L.; et al. A framework for vulnerability analysis in sustainability science. PNAS 2003, 100, 8074–8079. [Google Scholar] [CrossRef] [PubMed]
  22. Dassen-Housen, P. Management of uncertainty—A contradiction in itself? In Enabling Innovation: Innovative Capability—German and International Views; Jeschke, S., Isenhardt, I., Hees, F., Trantow, S., Eds.; Springer-Verlag: Berlin, Germany, 2011; pp. 30–33. [Google Scholar]
  23. Trantow, S.; Hees, F.; Jeschke, S. Innovative capability. In Enabling Innovation: Innovative Capability —German and International Views; Jeschke, S., Isenhardt, I., Hees, F., Trantow, S., Eds.; Springer-Verlag: Berlin, Germany, 2011; pp. 1–13. [Google Scholar]
  24. Costanza, R.; d’Arge, R.; Groot, R.D.; Farber, S.; Grasso, M.; Hannon, B.; Limburg, K.; Naeem, S.; O’Neill, R.V.; Paruelo, J.; et al. The value of ecosystem services: putting the issues in perspective. Ecol. Econ. 1998, 25, 67–72. [Google Scholar] [CrossRef]
  25. Gnangnon, S.K. Does structural economic vulnerability matter for public indebtedness in developing countries? J. Econ. Stud. 2014, 41, 644–671. [Google Scholar] [CrossRef]
  26. Pérez Agúndez, J.A.; Yimam, E.; Raux, P.; Rey-Valette, H.; Girard, S. Modeling economic vulnerability: As applied to microbiological contamination on the Thau Lagoon shellfish farming industry. Mar. Policy 2014, 46, 143–151. [Google Scholar] [CrossRef]
  27. Ransbotham, S.; Mitra, S.; Ramsey, J. Are markets for vulnerabilities effective? MIS Q. 2012, 36, 43–64. [Google Scholar]
  28. Bell, M.; Pavitt, K. Technological accumulation and industrial growth: Contrasts between developed and developing countries. Ind. Corp. Change 1993, 2, 157. [Google Scholar] [CrossRef]
  29. Pavitt, K. What we know about the strategic management of technology. Calif. Manag. Rev. 1990, 32, 17–26. [Google Scholar] [CrossRef]
  30. Freeman, C. The 'national system of innovation' in historical perspective. Camb. J. Econ. 1995, 19, 5–24. [Google Scholar]
  31. OECD. Proposed Guidelines for Collecting and Interpreting Technological Innovation Data: Oslo Manual; OECD Publication Services: Paris, France, 1997. [Google Scholar]
  32. Böhle, F. Management of uncertainty–A blind spot in the promotion of innovations. In Enabling Innovation–German and International Views, 1st ed.; Al, S.J.E., Ed.; Springer-Verlag: Berlin, Germany, 2011; pp. 17–29. [Google Scholar]
  33. Dominitz, J.; Manski, C.F. Perceptions of Economic Vulnerability: First Evidence from the Survey of Economic Expectations/Jeff Dominitz and Charles f. Manski; Institute for Research on Poverty, University of Wisconsin-Madison: Madison, WI, USA, 1995. [Google Scholar]
  34. Berry, P.M.; Rounsevell, M.D.A.; Harrison, P.A.; Audsley, E. Assessing the vulnerability of agricultural land use and species to climate change and the role of policy in facilitating adaptation. Environ. Sci. Policy 2006, 9, 189–204. [Google Scholar] [CrossRef]
  35. UNDP. Human Development Report 1999; Oxford University Press: Oxford, UK, 1999. [Google Scholar]
  36. Erol, O.; Sauser, B.; Mansouri, M. A framework for investigation into extended enterprise resilience. Enterp. Inf. Syst. 2010, 4, 111–136. [Google Scholar] [CrossRef]
  37. Prewitt, K. The federal statistical system: Its vulnerability matters more than you think—Section four: Strengthening the statistical system: Future of innovation in the federal statistical system. 2010. Available online: https://us.sagepub.com/en-us/nam/the-federal-statistical-system-its-vulnerability-matters-more-than-you-think/book235999 (accessed on 22 December 2015).
  38. Han, R.; Tong, L.; Tong, W.; Yu, J. Research on vulnerability assessment of human-land system of Anshan city based on set pair analysis. Progr. Geogr. 2012, 31, 344–351. [Google Scholar]
  39. Reed, M.S.; Podesta, G.; Fazey, I.; Geeson, N.; Hessel, R.; Hubacek, K.; Letson, D.; Nainggolan, D.; Prell, C.; Rickenbach, M.G.; et al. Surveys: Combining analytical frameworks to assess livelihood vulnerability to climate change and analyse adaptation options. Ecol. Econ. 2013, 94, 66–77. [Google Scholar] [CrossRef] [PubMed] [Green Version]
  40. Aldana-Bobadilla, E.; Kuri-Morales, A. A clustering method based on the maximum entropy principle. Entropy 2015, 17, 151–180. [Google Scholar] [CrossRef]
  41. Benedetto, F.; Giunta, G.; Mastroeni, L. A maximum entropy method to assess the predictability of financial and commodity prices. Dig. Signal Process. 2015, 46, 19–31. [Google Scholar] [CrossRef]
  42. Zou, Q.; Zhou, J.Z.; Zhou, C.; Song, L.X.; Guo, J. Comprehensive flood risk assessment based on set pair analysis-variable fuzzy sets model and fuzzy AHP. Stochast. Environ. Res. Risk Assess. 2013, 27, 525–546. [Google Scholar] [CrossRef]
  43. Xia, C.; Yi, M.; Wei, W.; Yu, Z. Discussion of annual runoff dry-wet classification based on set pair analysis. Yangze River 2015, 46, 21–24. [Google Scholar]
  44. Su, M.R.; Yang, Z.F.; Chen, B. Set pair analysis for urban ecosystem health assessment based on emergy-vitality index. China Environ. Sci. 2009, 29, 892–896. [Google Scholar]
  45. Meng, X.M.; Hu, H.P. Application of set pair analysis model based on entropy weight to comprehensive evaluation of water quality. J. Hydraul. Eng. 2009, 40, 257–262. [Google Scholar]
  46. Sun, B.; Wang, H. Inventory Evaluation Model and Application of Shipbuilding Enterprise Based on the Method of Optimal Combination. Int. J. U- E-Serv. Sci. Technol. 2015, 8, 175–184. [Google Scholar] [CrossRef]
  47. Li, B.; Yang, Z.; Su, F. Measurement of vulnerability in human-sea economic system based on set pair analysis: A case study of Dalian city. Geogr. Res. 2015, 34, 967–976. [Google Scholar]
  48. Gobble, M.M. The 2009 European innovation scoreboard: EU lags us & Japan while China closing gap with EU. Res. Technol. Manag. 2010, 53, 2–4. [Google Scholar]
  49. OECD. OECD Science, Technology and Industry Outlook 2014. Available online: http://dx.doi.org.libproxy.lib.ilstu.edu/10.1787/sti_outlook-2014-en (accessed on 21 December 2015).
  50. Gupta, P.; Trusko, B.E. The Innovation Radar and enterprise Business System: Innovation in Five Nordic Countries and Beyond; McGraw-Hill Professional: New York, NY, USA, 2014. [Google Scholar]
  51. UNCTAD. UNCTAD at 50: A short History. 2014. Available online: http://unctad.org/en/PublicationsLibrary/osg2014d1_en.pdf (accessed on 23 December 2015).
  52. Bank, W. World Development Indicators 2010; World Bank: Washington, DC, USA, 2010; p. xxiii. [Google Scholar]
  53. Azubuike, V.M.U. Technological innovation capability and firm's performance in new product development. Commun. IIMA 2013, 13, 43–55. [Google Scholar]
  54. Carcary, M.; Doherty, E.; Thornley, C. Business innovation and differentiation: Maturing the IT capability. IT Prof. 2015, 17, 46–53. [Google Scholar] [CrossRef]
  55. Daqi, X.U. Research on improving the technological innovation capability of SMEs by university-industry collaboration. J. Eng. Sci. Technol. Rev. 2013, 6, 100–104. [Google Scholar]
  56. Fagerberg, J.; Feldmany, M.P.; Srholec, M. Technological dynamics and social capability: US states and European Nations. J. Econ. Geogr. 2014, 14, 313–337. [Google Scholar] [CrossRef]
  57. Hansen, U.E.; Ockwell, D. Learning and technological capability building in emerging economies: The case of the biomass power equipment industry in Malaysia. Technovation 2014, 34, 617–630. [Google Scholar] [CrossRef]
  58. Tseng, C.-Y. Technological innovation capability, knowledge sourcing and collaborative innovation in Gulf Cooperation Council countries. Innov. Manag. Policy Pract. 2014, 16, 212–223. [Google Scholar]
  59. Raymond, L.; St-Pierre, J.; Uwizeyemungu, S.; Dinh, T. Internationalization capabilities of SMEs: A comparative study of the manufacturing and industrial service sectors. J. Int. Entrep. 2014, 12, 230–253. [Google Scholar] [CrossRef]
  60. Manseau, A.; Seaden, G. Innovation in Construction: An International Review of Public Policies; Spon Press: London, UK; New York, NY, USA, 2001. [Google Scholar]
  61. Brooker, P.; Wilkinson, S. Mediation in the Construction Industry: An International Review; Routledge: London, UK, 2010. [Google Scholar]
  62. Altenburger, R. Green product innovation: Values and networks in open innovation processes. In Proceedings of ISPIM Conferences, Dublin, Ireland, 8–11 June 2014.
  63. Bindroo, V.; Mariadoss, B.J.; Pillai, R.G. Customer clusters as sources of innovation-based competitive advantage. J. Int. Mark. 2012, 20, 17–33. [Google Scholar] [CrossRef]
  64. Chan, I.; Liu, A.; Fellows, R. Role of leadership in fostering an innovation climate in construction firms. J. Manag. Eng. 2014. [Google Scholar] [CrossRef]
  65. Elmualim, A.; Gilder, J. Bim: Innovation in design management, influence and challenges of implementation. Archit. Eng. Design Manag. 2014, 10, 183–199. [Google Scholar] [CrossRef]
  66. Blindenbach-Driessen, F.; van den Ende, J. Innovation in project-based firms: The context dependency of success factors. Res. Policy 2006, 35, 545–561. [Google Scholar] [CrossRef]
  67. Chen, L.; Marsden, J.R.; Zhang, Z. Theory and analysis of company-sponsored value co-creation. J. Manag. Inf. Syst. 2012, 29, 141–172. [Google Scholar] [CrossRef]
  68. Gann, D.; Salter, A. Innovation in project-based, service-enhanced firms: The construction of complex products and systems. Res. Policy 2000, 29, 955–972. [Google Scholar] [CrossRef]
  69. Iammarino, S.; Piva, M.; Vivarelli, M.; von Tunzelmann, N. Technological capabilities and patterns of innovative cooperation of firms in the UK regions. Reg. Stud. 2012, 46, 1283–1301. [Google Scholar] [CrossRef]
  70. Leiringer, R.; Schweber, L. Managing multiple markets: Big firms and PFI. Build. Res. Inf. 2010, 38, 131–143. [Google Scholar] [CrossRef] [Green Version]
  71. Sexton, M.; Barrett, P. Appropriate innovation in small construction firms. Constr. Manag. Econ. 2003, 21, 623–633. [Google Scholar] [CrossRef]
  72. Kuo, Y. Technology readiness as moderator for construction company performance. Ind. Manag. Data Syst. 2013, 113, 558–572. [Google Scholar] [CrossRef]
  73. Ruwanpura, J.; Mohamed, Y.; Lee, S. Construction research congress 2010: Innovation for reshaping construction practice. In Proceedings of the 2010 Construction Research Congress, Banff, AL, Canada, 8–10 May 2010.
  74. Pellicer, E.; Correa, C.L.; Yepes, V.; Alarcón, L.F. Organizational improvement through standardization of the innovation process in construction firms. Eng. Manag. J. 2012, 24, 40–53. [Google Scholar] [CrossRef]
  75. Pryke, S.; Ebooks Corporation. Construction supply chain management concepts and case studies. In Innovation in the Built Environment; Wiley-Blackwell: Chichester, UK; Malden, MA, USA, 2009. [Google Scholar]
  76. Barrett, P.; Sexton, M.; Lee, A. Innovation in small Construction Firms; Taylor & Francis: London, UK; New York, NY, USA, 2008; p. 107. [Google Scholar]
  77. Patanakul, P.; Pinto, J.K. Examining the roles of government policy on innovation. High Technol. Manag. Res. 2014, 25, 97–107. [Google Scholar] [CrossRef]
  78. Chesbrough, H.W.; Appleyard, M.M. Open innovation and strategy. Calif. Manag. Rev. 2007, 50, 57–76. [Google Scholar] [CrossRef]
  79. Wu, I.-L.; Chiu, M.-L. Organizational applications of it innovation and firm's competitive performance: A resource-based view and the innovation diffusion approach. J. Eng. Technol. Manag. 2015, 35, 25–44. [Google Scholar] [CrossRef]
  80. Kamasak, R. Determinants of innovation performance: A resource-based study. Procedia-Soc. Behav. Sci. 2015, 195, 1330–1337. [Google Scholar] [CrossRef]
  81. Han, J.-W.; Lim, H.-S. Strategic analysis and success factors of the enterprises through the convergence. Int. J. Appl. Eng. Res. 2014, 9, 15715–15726. [Google Scholar]
  82. Lusch, R.F.; Nambisan, S. Service innovation: A service-dominant logic perspective. MIS Q. 2015, 39, 155–176. [Google Scholar]
  83. Palm, K. Understanding innovation as an approach to increasing customer value in the context of the public sector. 2014. Available online: https://www.diva-portal.org/smash/get/diva2:773180/FULLTEXT01.pdf (accessed on 21 December 2015).
  84. Wu, J. Cooperation with competitors and product innovation: Moderating effects of technological capability and alliances with universities. Ind. Mark. Manag. 2014, 43, 199–209. [Google Scholar] [CrossRef]
  85. Aalbers, R.; Dolfsma, W. Innovation Networks: Managing the Networked Organization/Rick Aalbers and Wilfred Dolfsma; Routledge: London, UK, 2015. [Google Scholar]
  86. Cabanelas, P.; Omil, J.C.; Vázquez, X.H. A methodology for the construction of dynamic capabilities in industrial networks: The role of border agents. Ind. Mark. Manag. 2013, 42, 992–1003. [Google Scholar] [CrossRef]
  87. Macaulay, L.A.; Miles, I.; Wilby, J.; Tan, Y.L.; Zhao, L.; Theodoulidis, B. Case Studies in Service Innovation; Springer: Berlin, Germany, 2012. [Google Scholar]
  88. Anumba, C.J.; Egbu, C.O.; Carrillo, P.M. Knowledge Management in Construction; Blackwell Pub.: Oxford UK; Malden, MA, USA, 2005; xiv; p. 226. [Google Scholar]
  89. Connaughton, J.; Meikle, J. The changing nature of UK construction professional service firms. Build. Res. Inf. 2013, 41, 95–109. [Google Scholar] [CrossRef]
  90. Gabbott, M.; Hogg, G. Consumer involvement in services: A replication and extension. J. Bus. Res. 1999, 46, 159–166. [Google Scholar] [CrossRef]
  91. Halpin, D.W.; Senior, B.A. Construction Management, 4th ed.; Wiley: Hoboken, NJ, USA, 2011; p. 448. [Google Scholar]
  92. Giang, D.T.H.; Pheng, L.S. Role of construction in economic development: Review of key concepts in the past 40 years. Habitat Int. 2011, 35, 118–125. [Google Scholar] [CrossRef]
  93. Kazi, A.S. Knowledge Management in the Construction Industry: A Socio-Technical Perspective; Idea Group Pub.: Hershey, PA, USA, 2005; p. 384. [Google Scholar]
  94. Korman, T.M.; Huey-King, L. Industry input for construction engineering and management courses: Development of a building systems coordination exercise for construction engineering and management students. Pract. Period. Struct. Design Constr. 2014, 19, 68–72. [Google Scholar] [CrossRef]
  95. McCarthy, J.F. Construction Project Management; Pareto–Building Improvement: Westchester, IL, USA, 2010; p. 432. [Google Scholar]
  96. Chinese Academy of Science and Technology for Development. China National Innovation Index Report 2013. Available online: http://www.most.gov.cn/kjtj/201511/P020151117383919061369.pdf (accessed on 21 December 2015).
  97. Zhao, K.; Xuan, A. Set pair theory-a new theory method of non-define and its applications. Syst. Eng. 1996, 14, 14–26. [Google Scholar]
  98. Xing, W.; Ye, X.; Kui, L. Measuring convergence of China's ICT industry: An input–output analysis. Telecommun. Policy 2011, 35, 301–313. [Google Scholar] [CrossRef]
  99. Bereziński, P.; Jasiul, B.; Szpyrka, M. An entropy-based network anomaly detection method. Entropy 2015, 17, 2367–2408. [Google Scholar] [CrossRef]
  100. Faed, A.; Chang, E.; Saberi, M.; Hussain, O.K.; Azadeh, A. Intelligent customer complaint handling utilising principal component and data envelopment analysis (PDA). Appl. Soft Comput. J. 2015. [Google Scholar] [CrossRef]
  101. Dong, X.; Guo, J.; Höök, M.; Pi, G. Sustainability assessment of the natural gas industry in China using principal component analysis. Sustainability 2015, 7, 6102–6118. [Google Scholar] [CrossRef]
  102. Chen, J.; Yang, X.; Wang, Z.; Zhang, L. Vulnerability and influence mechanisms of rural tourism socio-ecological systems: A household survey in China‘s Qinling mountain area. Tour. Trib. 2015, 30, 64–75. [Google Scholar]
  103. Likar, B.; Kopa, J.; Fatur, P. Innovation investment and economic performance in transition economies: Evidence from Slovenia. Innov. Manag. Policy Pract. 2014, 16, 53–66. [Google Scholar] [CrossRef]
  104. Hemphill, T.A. Policy debate: The US advanced manufacturing initiative: Will it be implemented as an innovation—Or industrial—Policy? Innov. Manag. Policy Pract. 2014, 16, 67–70. [Google Scholar] [CrossRef]
  105. Cabrilo, S.; Grubic-Nesic, L. Ic-Based Innovation Gap Assessment: A Support Tool for the Creation of Effective Innovation Strategies in the Knowledge Era. In Proceedings of the 4th European Conference on Intellectual Capital, Helsinki, Finland, 23–24 April 2012.
  106. Martinez, M.G. Co-creation of value by open innovation: Unlocking new sources of competitive advantage. Agribusiness 2014, 30, 132–147. [Google Scholar] [CrossRef]
  107. Hsieh, M.; Wu, C.; Ting, P.; Lin, T. A study on project partner's alignment process and value innovation. Mark. Rev. 2013, 10, 345–370. [Google Scholar]
  108. Reitzig, M.; Puranam, P. Value appropriation as an organizational capability: The case of IP protection through patents. Strat. Manag. J. 2009, 30, 765–789. [Google Scholar] [CrossRef]
  109. Giannopoulou, E.; YstrÖM, A.; Ollila, S. Turning open innovation into practice: Open innovation research through the lens of managers. Int. J. Innov. Manag. 2011, 15, 505–524. [Google Scholar] [CrossRef]
  110. Roy, M.; Donaldson, C.; Baker, R.; Kerr, S. The potential of social enterprise to enhance health and well-being: A model and systematic review. Soc. Sci. Med. 2014, 123, 182–193. [Google Scholar] [CrossRef] [PubMed]
  111. Bolanos, A.B. External Vulnerabilities and Economic Integration: Is the Union of South American Nations a Promising Project? J. Econ. Dev. 2014, 39, 97–131. [Google Scholar]
  112. Culpepper, P.D.; Reinke, R. Structural power and bank bailouts in the United Kingdom and the United States. Polit. Soc. 2014, 42, 427–454. [Google Scholar] [CrossRef] [Green Version]
  113. Murphy, E.; Scott, M. Household vulnerability in rural areas: Results of an index applied during a housing crash, economic crisis and under austerity conditions. Geoforum 2014, 51, 75–86. [Google Scholar] [CrossRef]
  114. Ala, M.U. A firm-level analysis of the vulnerability of the Bangladeshi pharmaceutical industry to the trips agreement: Implications for R&D capability and technology transfer. Proced. Econ. Finance 2013, 5, 30–39. [Google Scholar]
  115. Tomes, A. UK government science policy: The 'enterprise deficit' fallacy. Technovation 2003, 23, 785–792. [Google Scholar] [CrossRef]
  116. Al-Sudairi, M.; Bakry, S.H. Knowledge issues in the global innovation index: Assessment of the State of Saudi Arabia versus countries with distinct development. Innov. Manag. Policy Pract. 2014, 16, 176–183. [Google Scholar] [CrossRef]
  117. Kiskiene, A. Scientific knowledge and technology transfer policy in the EU. Econ. Bus. 2014, 26, 36–43. [Google Scholar] [CrossRef]
  118. Ljungquist, U. Unbalanced dynamic capabilities as obstacles of organizational efficiency: Implementation issues in innovative technology adoption. Innov. Manag. Policy Pract. 2014, 16, 82–95. [Google Scholar] [CrossRef]

