1. Introduction
The existing international cooperation in the energy domain concentrates its efforts on accelerating access to clean energy by promoting renewable energy sources (RES), energy efficiency and supporting schemes for investment in energy infrastructure and sustainable energy technologies. The present paper focuses on the third measure: applying sustainable energy technologies in an island state setting. The United Nations (UN) identifies sustainable development as a simultaneous enhancement of three interconnected goals: economic development, social development and environmental protection [
1].
Island states are generally more vulnerable than continental regions in all three aspects due to the adverse effects of global climate change. Many of island states are low-lying coastal countries and have dominant part of their population living on these coasts with limited means to adapt to changes in climate conditions. The predicted climate change effects and sea-level rise, as projected by the Intergovernmental Panel on Climate Change (IPCC) [
2] in the business-as-usual scenario, implies more severe consequences on the island states than the comparable mainland countries in terms of human, social and economic well-being.
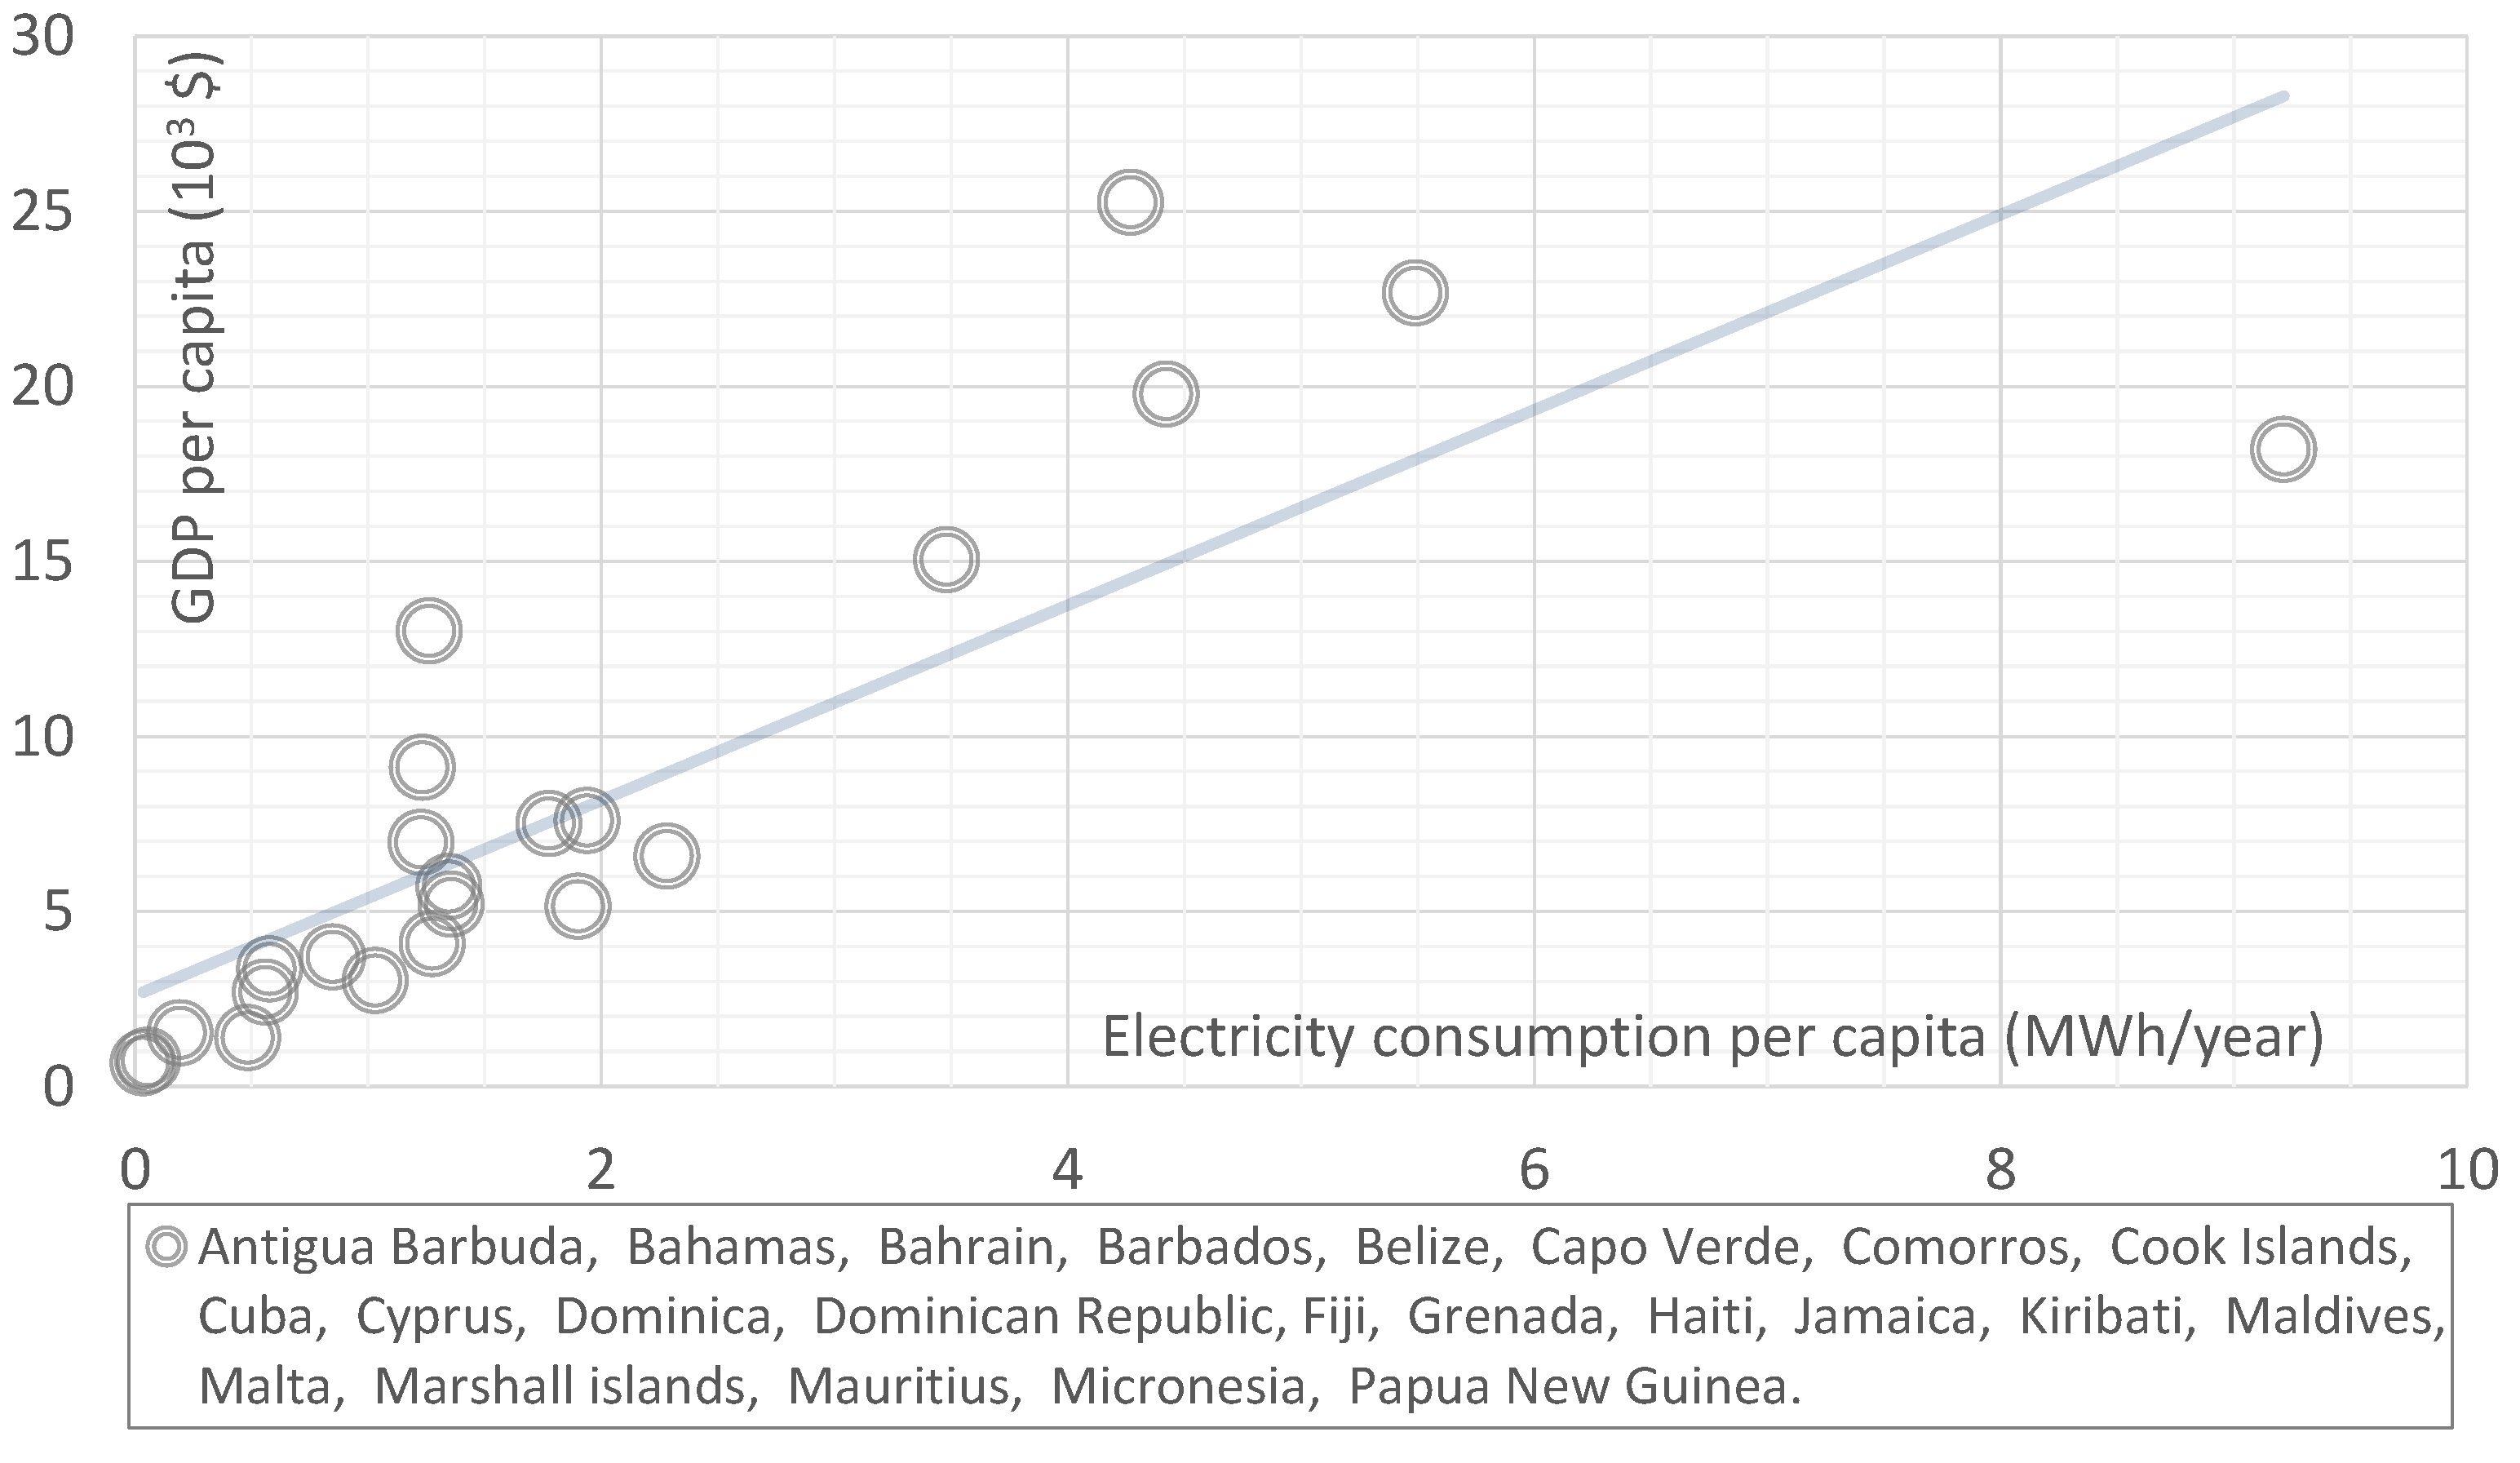
As far as socio-economic development is concerned, the lack of adaptation capabilities is not the only and most imminent exposure of these islands to the risks caused by global economic trends. The universal development tendency that per capita electricity consumption progresses proportionally with the GDP, applies likewise to island states. Data in consistent time series is not always available for island states. Therefore, the present study analyzed only countries where at least basic energy-related data could be derived from the often fragmented and inconsistent information for islands.
Figure 1 and
Figure 4 illustrate processed information for 22 small island states, that has been collected from three different sources: [
3,
4,
5]. The selected 22 islands are currently at different development stages. Thus, any analysis of the GDP-consumption on an individual-island basis, would produce non-comparable results. For this reason
Figure 1 depicts a snapshot of the current GDP-consumption status of the selected island states, where the above mentioned tendency is clearly traceable. And since most of the islands rely heavily on fossil fuel sources, their dependence on foreign energy resources would increase with the GDP growth unless this underlying tendency changes.
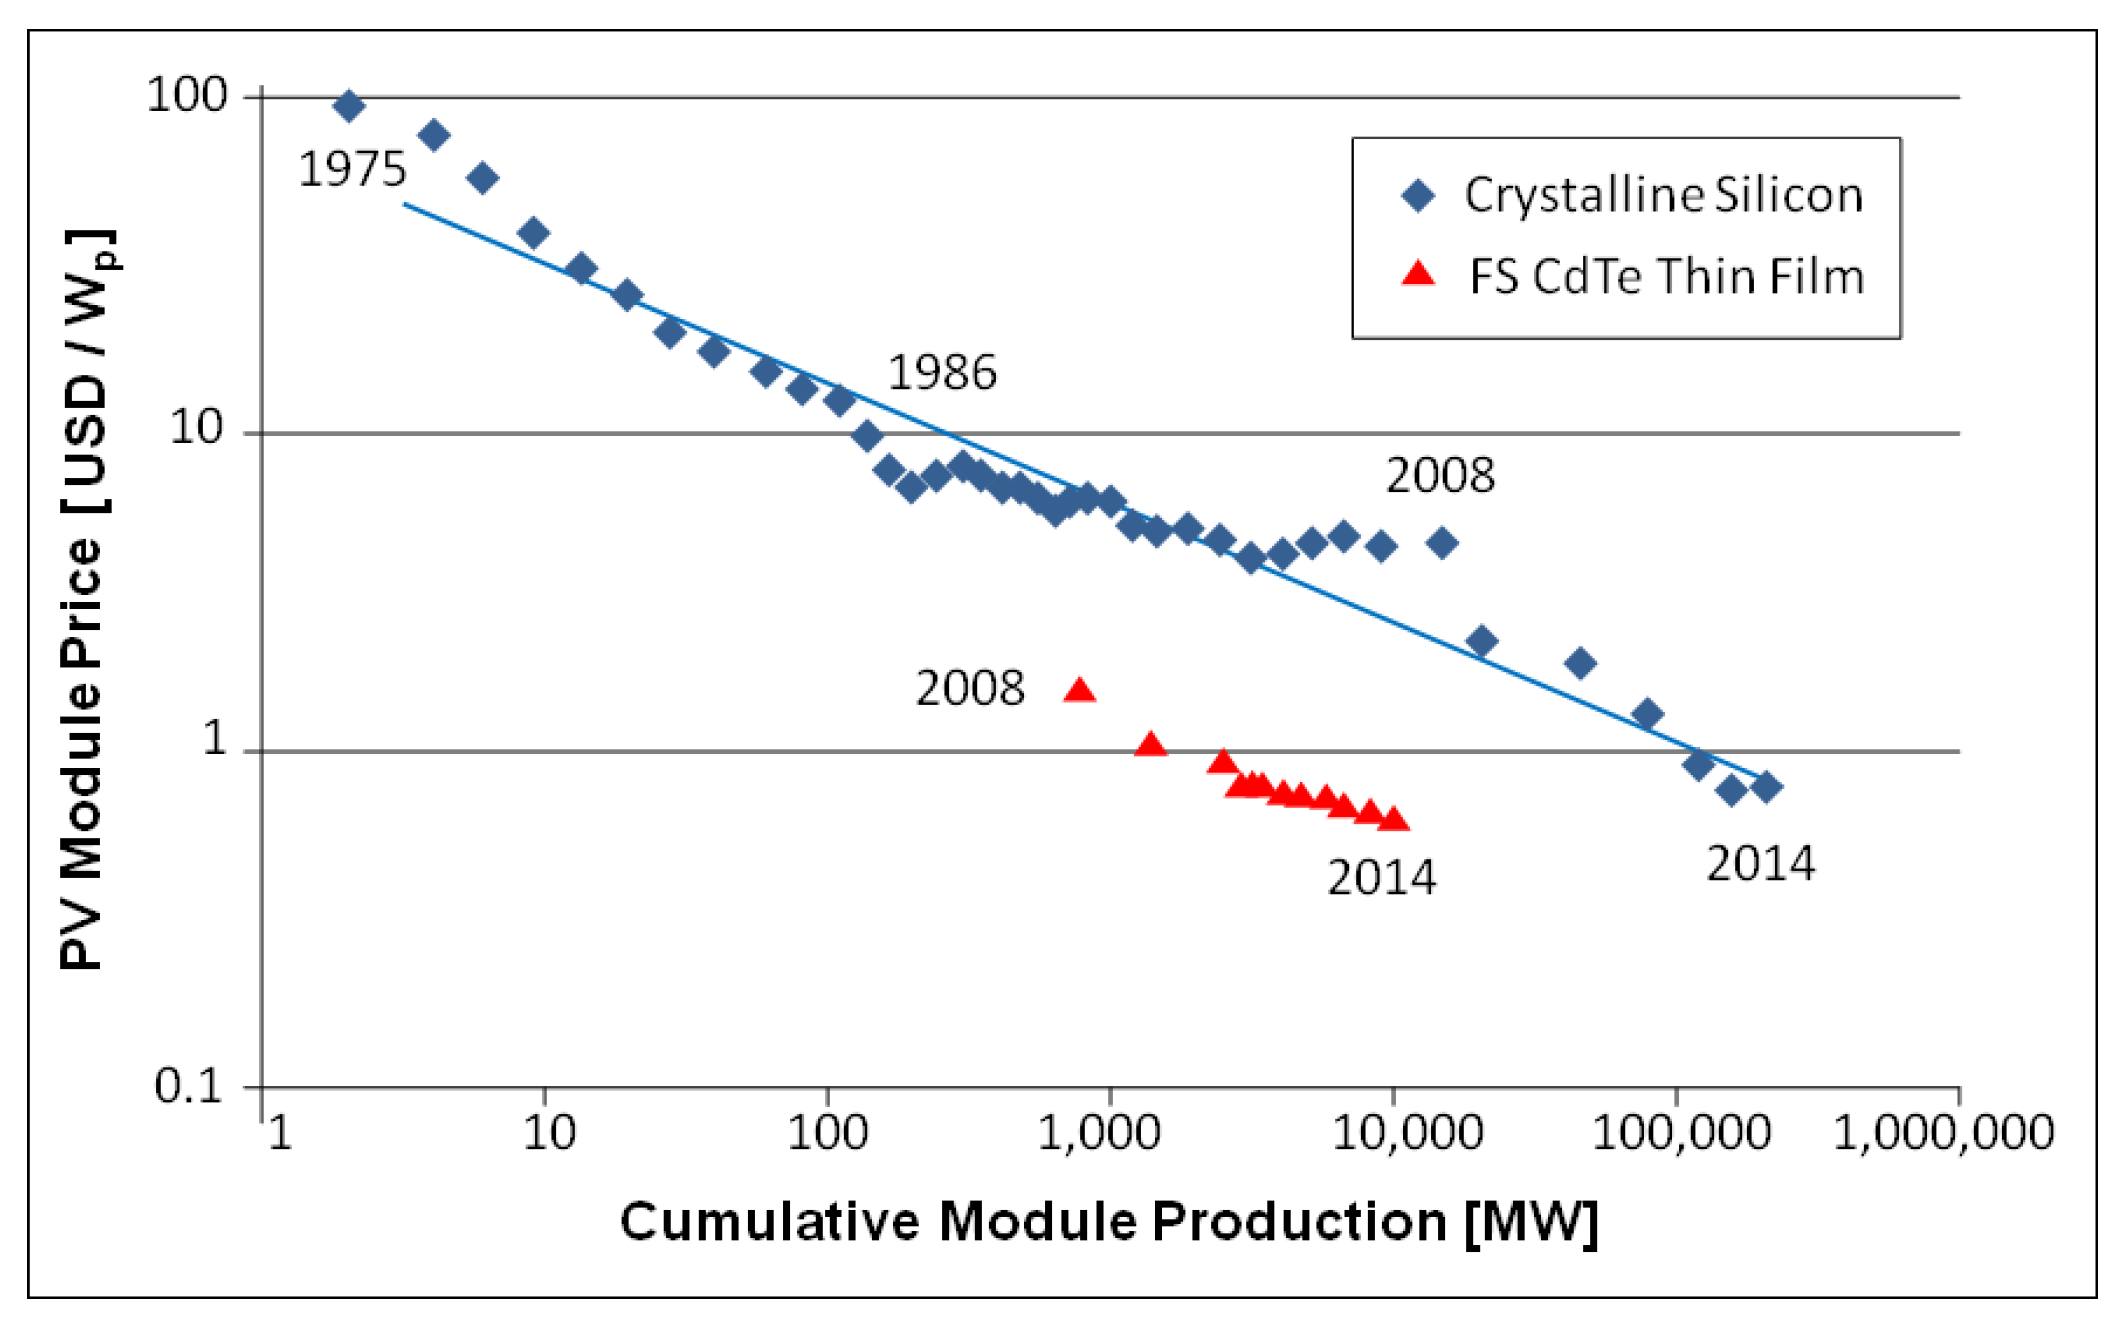
The major driver behind the present study is the opportunities created by the unprecedented price decrease in the RES technologies in the last 15 years. Energy technologies considered unaffordable, have experienced so drastic price decrease that can become the prime choice in sustainable energy development. However, pipeline projects in island countries do not reflect this shift: the electricity master plans for the islands still dominantly involve fuel generation units. Amongst RES technologies PV has become an option applicable on islands with continuously decreasing price (
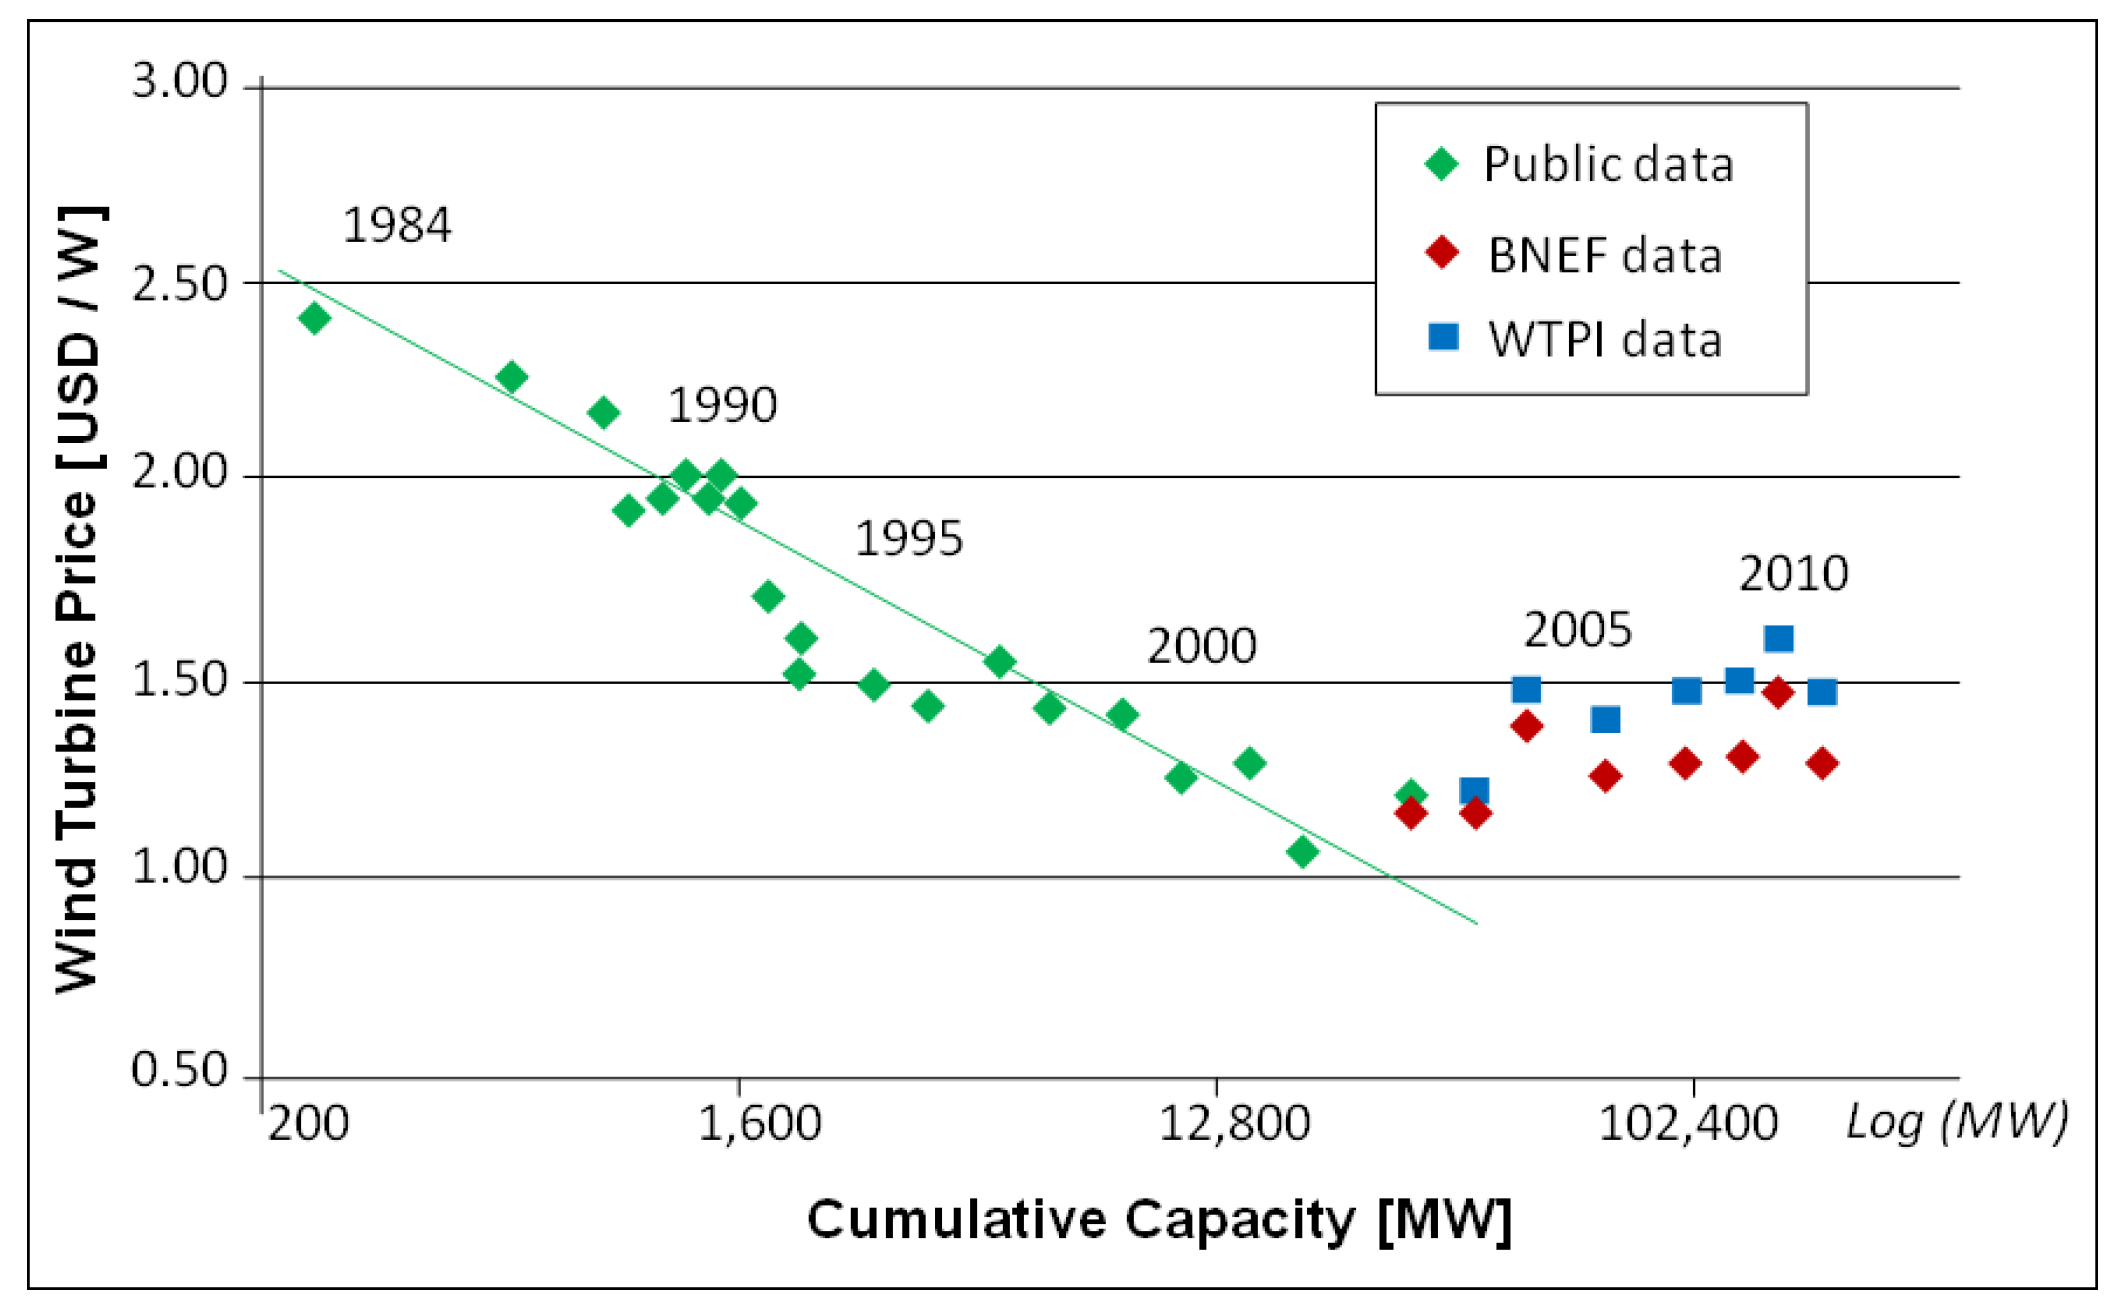
Figure 2). The other RES option, wind turbines, have also showed impressive price development, but their price have stabilized at a higher level (
Figure 3). Siting wind power also requires more localized information ([
4]). Therefore, the present study focuses on modeling the potential role of PV technology. In this analysis we could rely on an internationally recognized continental level resource mapping tool (PVGIS) and a similar methodology that was used for rural electrification in Africa [
6,
7].
Figure 1.
Electricity consumption and GDP per capita for the studied island states.
Figure 1.
Electricity consumption and GDP per capita for the studied island states.
Figure 2.
Global PV module price learning curve (1975–2014) [
8].
Figure 2.
Global PV module price learning curve (1975–2014) [
8].
Figure 3.
Global wind turbine price learning curve (1984–2010) [
9].
Figure 3.
Global wind turbine price learning curve (1984–2010) [
9].
1.1. Current Energy Status of Island States
Various Greek islands can be referred as a profound example on how the subsidies on heavy oil electricity production could lead to an unsustainable energy mix. In many cases, the annual cost of fuel shipped to the Greek islands exceeds €2,250/inhabitant [
10]. However, consumers in these islands do not pay the full costs, as the Greek government covers most of the expenses from taxation. Independent island states do not have this privilege of “energy bills’ dilution”. Besides, even if they could use such mechanisms, they would not afford the additional cost from their own budgets.
The underlying drive behind the present analysis is that while many island states announce ambitious sustainable energy targets and pathways, the available data sources on the pipeline projects still show the dominance of the fossil fuel based technologies [
3,
4].
Figure 1 indicates the correlation between per capita electricity consumption and the corresponding GDP levels in the islands.
The aim of the present analysis is to investigate how this worldwide tendency relates to economic sustainability. There is a wide choice of technologies that can meet the increasing electricity needs, ranging from high environmental footprint technologies to entirely sustainable solutions.
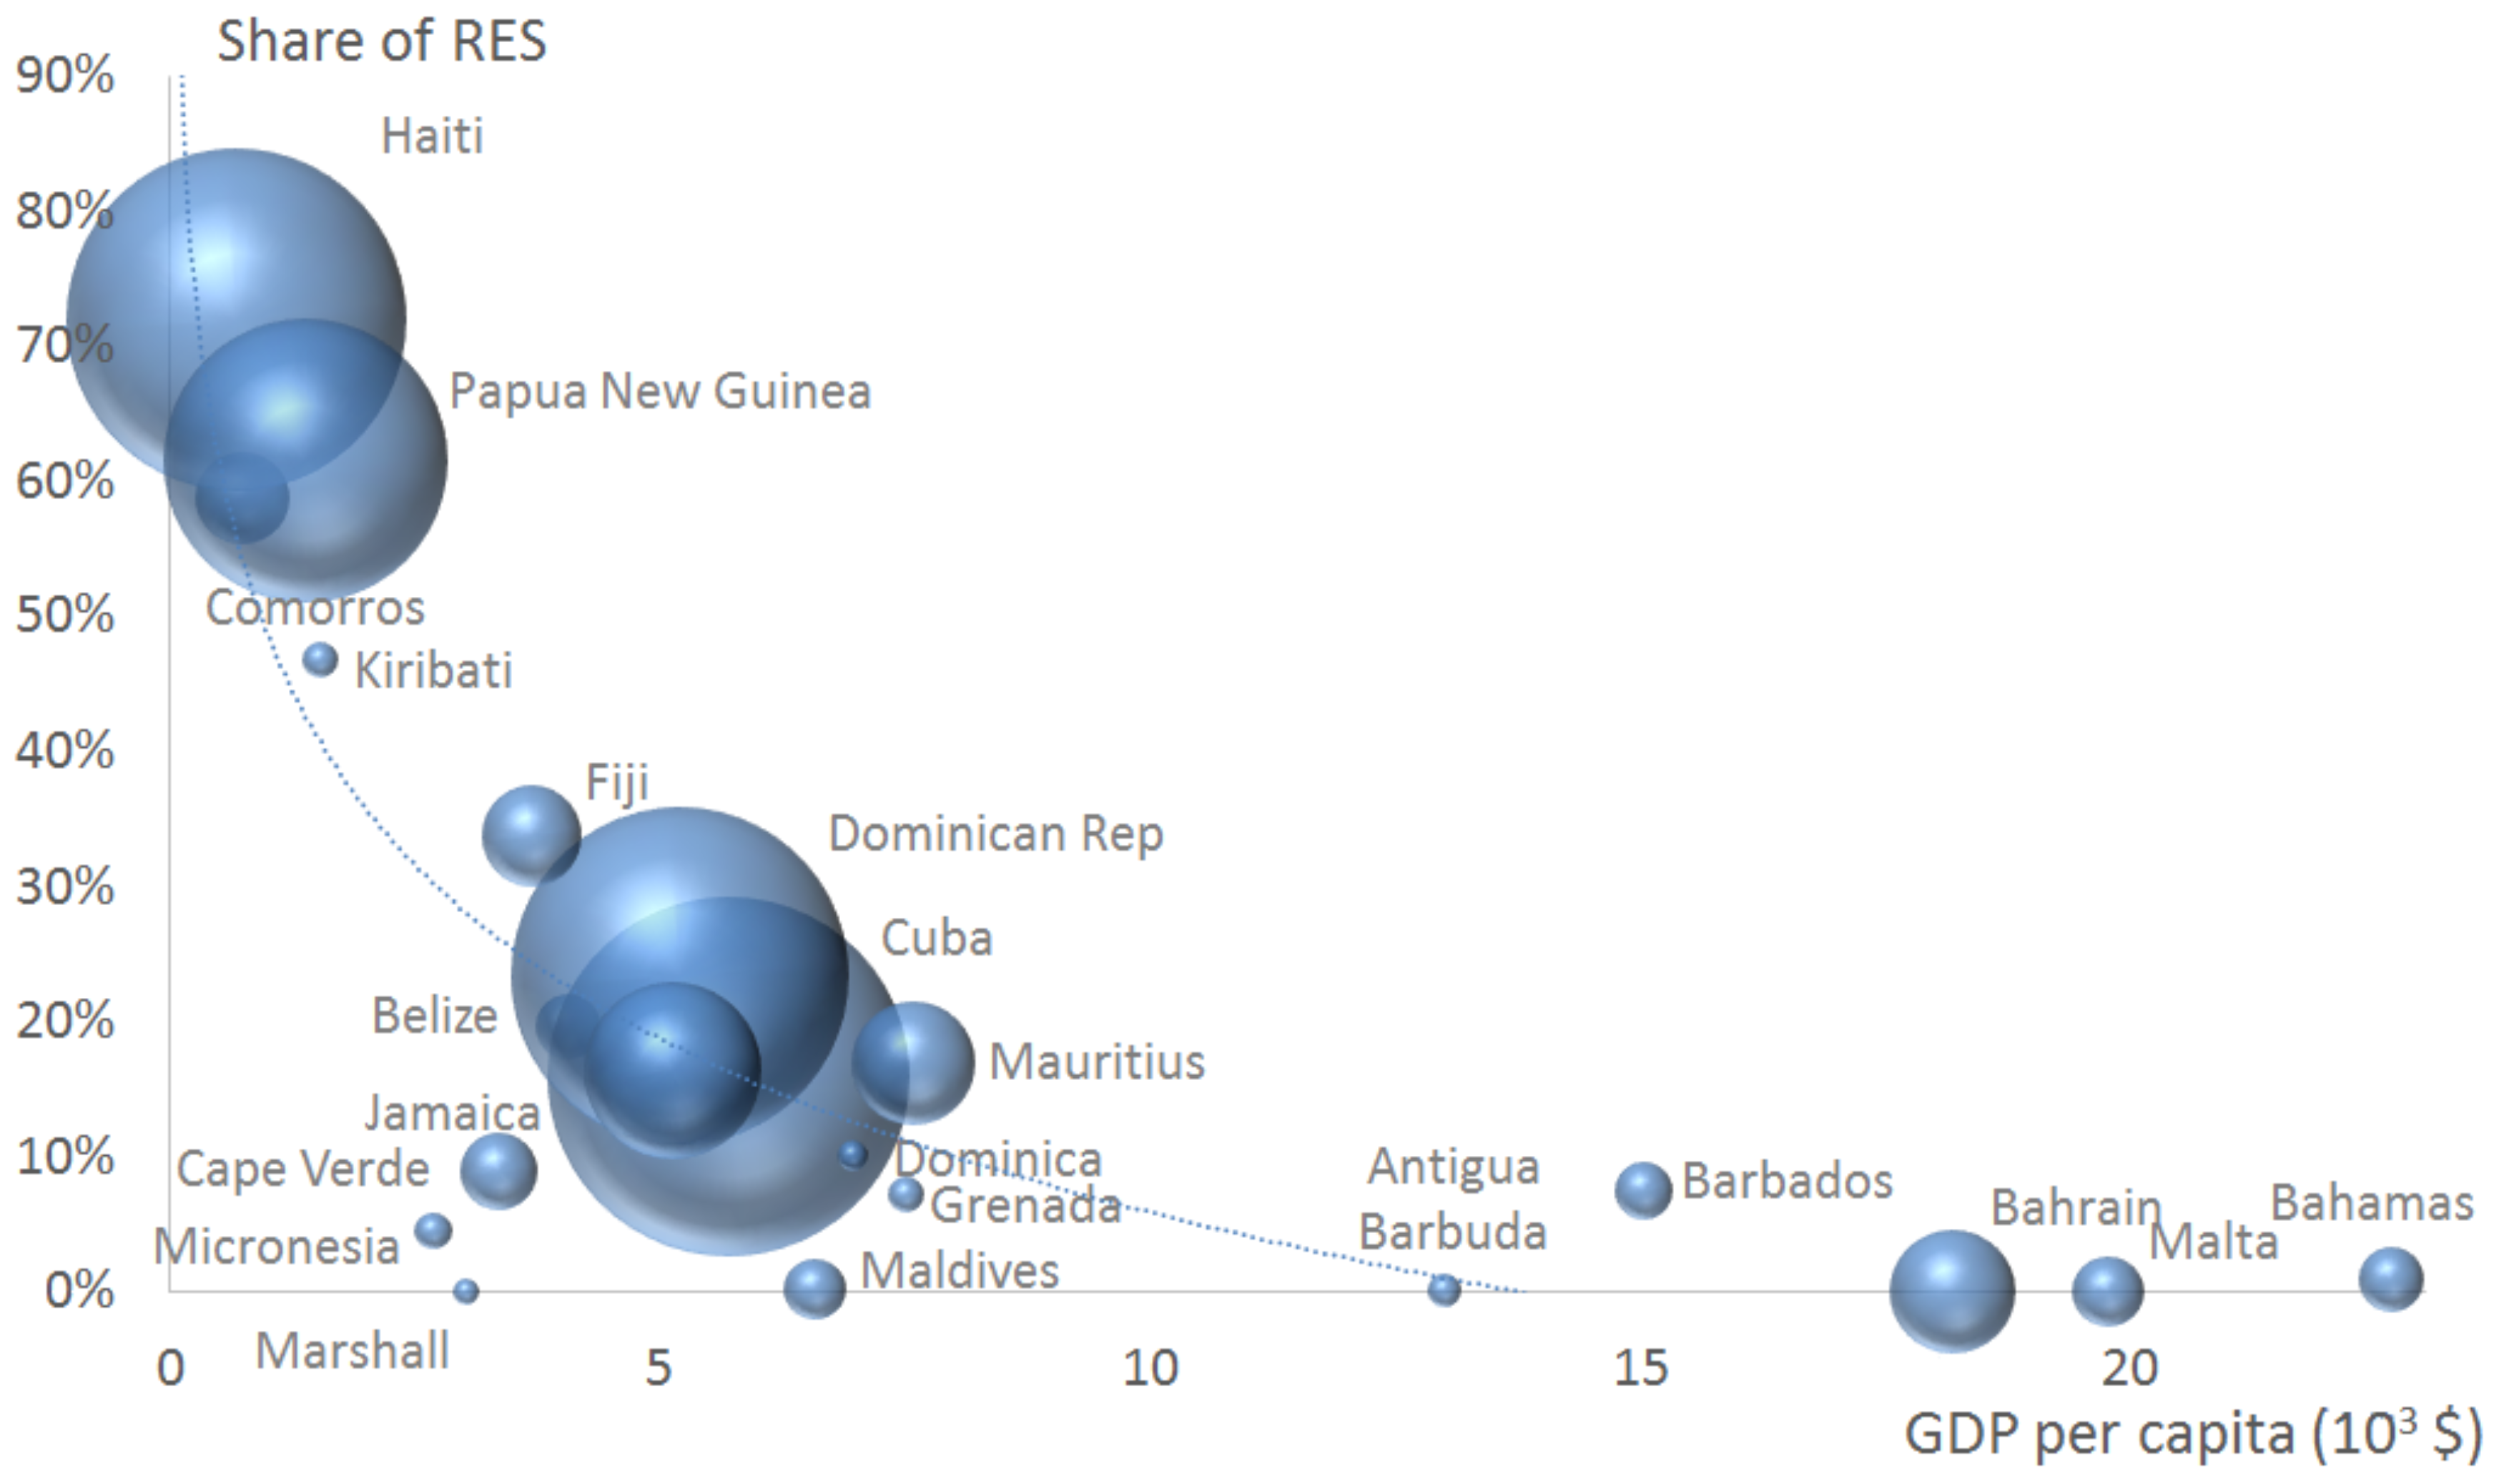
In
Figure 4 it appears that as prosperity grows the islands tend to rely more on imported fossil fuels for electricity production (mostly heavy oil) instead of relying on renewable energy sources to meet their energy needs. The size of the bubbles indicates population.
Figure 4.
Share of RES and GDP per capita at the selected island states.
Figure 4.
Share of RES and GDP per capita at the selected island states.
However, evidence is growing in the literature [
11,
12] that distributed generation options represent cost optimal solutions for many rural areas in Sub-Saharan Africa as the grid extension options represent more expensive electricity provision for places far away from the existing power grids [
6,
7]. This could especially appear to be the case for the island states which are even more distant from fuel supply sources than most of the rural African communities.
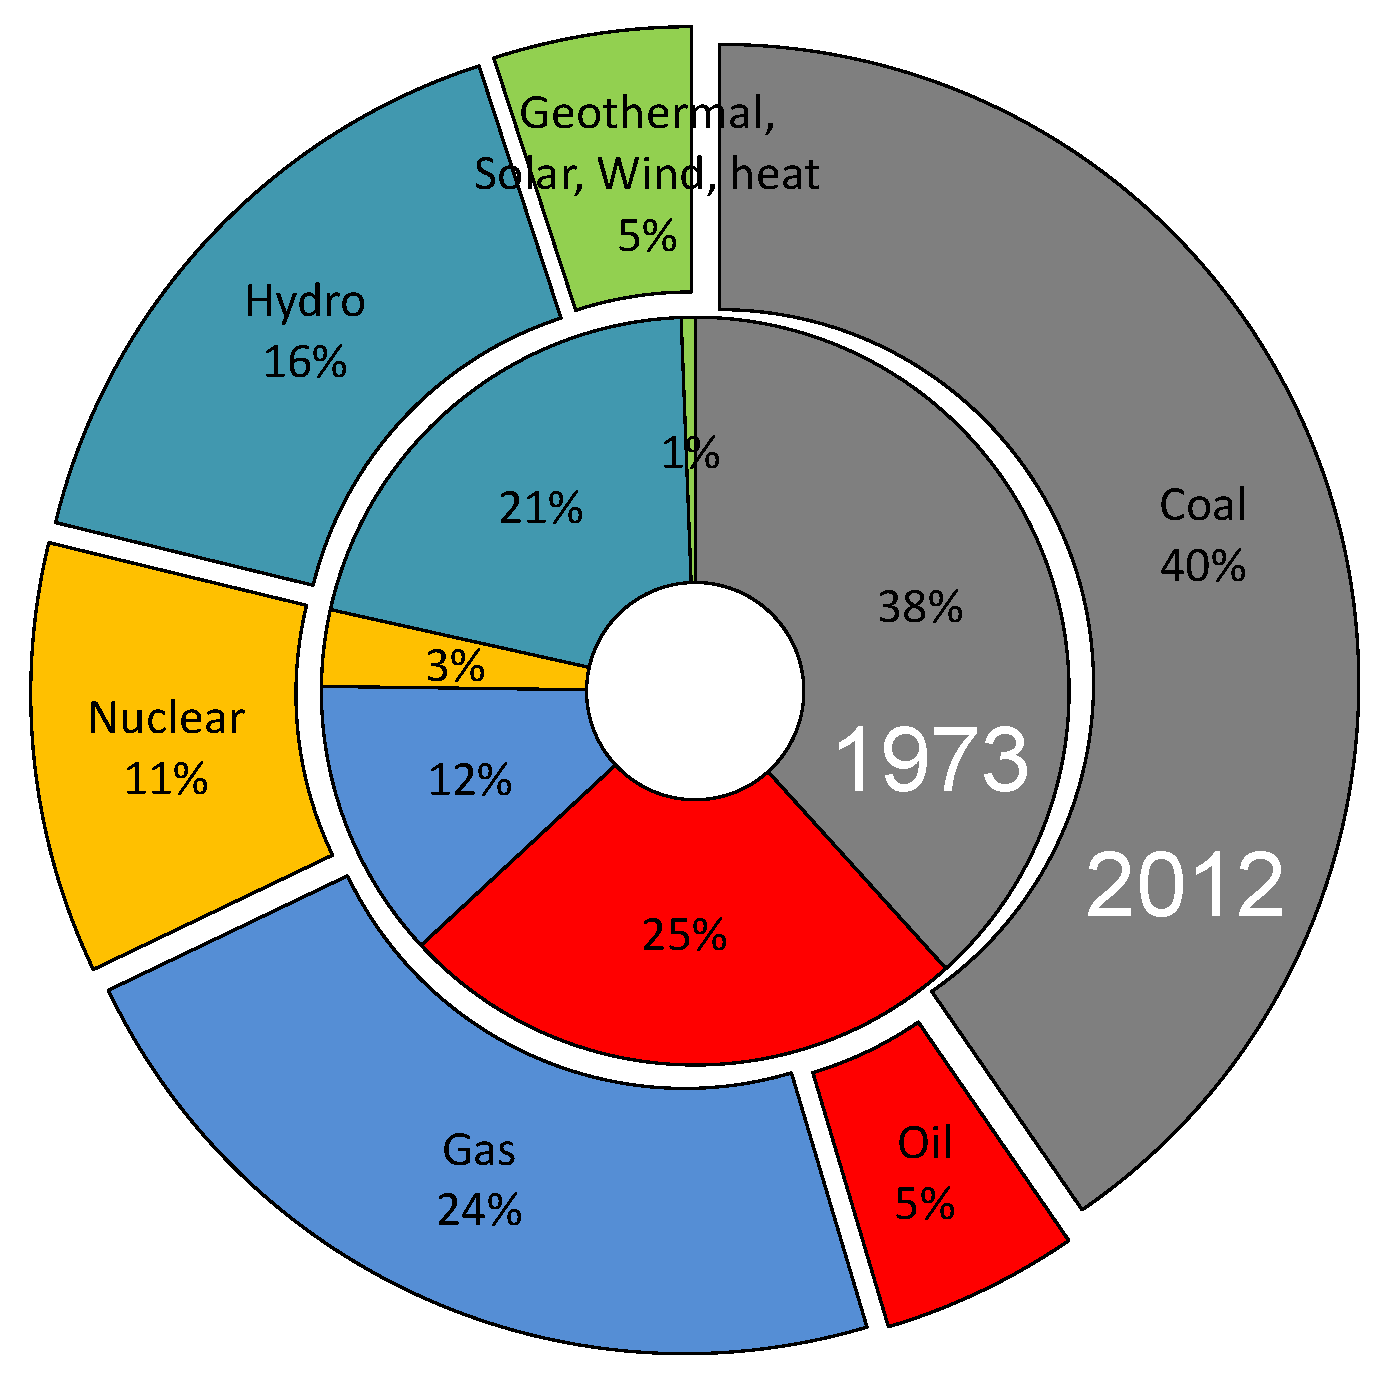
The central question of the sustainable energy provision on islands is whether the least-cost electricity for the consumers can be delivered by the currently dominant fossil fuel electricity generation technologies or by cost-effective renewable energy solutions. The economic vulnerability and dependence of these states are shown by the fact that while electricity production moves globally away from oil for environmental protection and economic reasons, in most cases islands’ production still depends mainly on it. EIA [
13] and IEA [
14] statistics indicate that, on a global scale, the share of oil is 5% (2012), decreasing from the previous 25% in 1973 (
Figure 5). Contrary to that, oil electricity production represents >90% in Cyprus, 99% in Channel island and 81% in Malta. These countries have not managed to substitute oil with a lower-cost or lower-emission source during the last four decades and are exposed to the price fluctuation of a resource that is imported from distant sources.
Figure 5.
Electricity generation share on a global scale (1973 vs. 2012).
Figure 5.
Electricity generation share on a global scale (1973 vs. 2012).
In [
15] the authors have made an optimisation exercise for the European countries to see the optimal level of RE shares in the national portfolio. Moreover, they have compared the outcome of various models with the National Renewable Energy Plans (NREPs) [
16], showing the strong interaction between RE shares and policy support tools. However, the used models required a level of detail on input parameters that is not easily available for island states. Therefore, in the present analysis a new streamlined optimization tool has been developed that is described in detail in
Section 2.3.
1.2. Alternative Development Pathways: Capo Verde, Cyprus and “Barbados Declaration” Islands
The islands that signed the UN on the Small Island Developing States
Barbados Declaration [
17] have ambitious renewable energy targets, aiming to generate a significant share (ranging from 15% up to 100%) of their energy needs using renewables, by 2030. Mauritius committed to increase the share of RES at least to the level of 35% by 2025, developing solar, wind, hydropower, bagasse and landfill gas resources. Seychelles committed to produce 15% of the total electricity from RES by 2030. Amongst the other islands, it is interesting to note that Maldives committed to achieve carbon neutrality in the energy sector and the Marshall Islands plans to electrify all urban households and 95% of rural households using RES by 2015.
Capo Verde has made strong commitments under various schemes, aiming at 100% electricity production from RES [
18]. In its NREP, Capo Verde sets the targets to promote the development of renewable energy projects: 25% renewable energy penetration by 2012 and 50% in 2020. It is important that in one of Capo Verde’s islands (Brava) the 2020 target predicts 100% electricity production from renewables.
Cyprus also intends to move from the heavy oil and diesel dominance to a sustainable electricity generation portfolio, by boosting energy efficiency and promoting distributed solar energy supply.
2. Island States’ Energy Portfolios: Sustainability Assessment
The typical strategies that have been used to electrify island states are questionable from sustainability point of view. These strategies often include the installation of a small number of fossil fuel based electricity generation units with the islands’ households connected to a centralised grid. Such a scheme has disproportional setbacks in the islands’ setting. The fuel has to be transported to the island and stored, therefore, most often they rely on heavy oil and/or coal; the two most carbon emitting energy sources. Long-haul transport makes the fuel more expensive than on continental areas and islands’ energy production is very vulnerable and dependant on external resources and higher environmental risk due to oil spill impacts. Oil spillages cause serious harm because of the way they spread [
19].
The present study assesses the sustainability of islands’ energy systems. This involves a portfolio-optimisation process that aims at analyzing the cost of the long-term operation of the energy system on islands. We have considered an electricity generation portfolio consisting of heavy-oil/diesel fuelled power plants and solar PV systems that can be combined with battery systems to manage the solar electricity between day and night. The indicated battery capacity will be divided between the de-centralised grids, and in the central grid the battery capacities will be distributed to the lowest sub-station levels enabling grid operators to balance between the end-consumers. The selection of these energy sources has been based on the fact that heavy-oil/diesel is currently the most dominant fuel in most islands. At the same time the PV-battery combination has been selected based on the suggestions of the current literature [
4], indicating that this combination can be economically advantageous in the concerned islands. Besides, the selected island states have an excellent solar-PV potential (1500–1700 kWh/kWp [
20]) which is still untapped (
Table 1). Obviously, there are additional options, especially for RES (e.g. wind, hydro, biomass, geothermal). The authors plan to investigate resources of other RES in their future research taking also into account possible synergies through sophisticated system design and hybrid operations [
21,
22,
23].
2.1. Anticipated Evolution in the Electric Power Consumption of the Island States
The developed model in the present study simulates the future electricity demand in island states. Among the model’s input parameters are the current installed energy capacity, population, per capita consumption and trends on the consumption increase. Six islands have been selected as case studies of the developed methodology (Papua New Guinea, Capo Verde, Haiti, Malta, Bahamas and Cuba). These island states represent four different regions: Caribbean, South-Eastern Asia, Africa and the Mediterranean and information about them has been included in
Table 1.
Table 1.
Information of the state islands included in the analysis.
Table 1.
Information of the state islands included in the analysis.
| Island State | Population | GDP | Consumption | Trend | Fossil | Solar | Batt. Storage |
|---|
| ($ p.c.) | (kWh p.c.) | (MW) | (MW) | (MWh) |
|---|
| Bahamas | 343,000 | 22,312 | 5493 | +0.5% | 493 | 0 | 0 |
| Malta | 413,000 | 22,775 | 4423 | +0.5% | 572 | 2 | 0 |
| Cuba | 11,300,000 | 6100 | 1348 | +3.0% | 5500 | 65 | 0 |
| Capo Verde | 496,000 | 3767 | 580 | +5.0% | 111 | 34 | 0 |
| Papua N.Guinea | 6,900,000 | 2103 | 486 | +5.0% | 722 | 294 | 0 |
| Haiti | 10,000,000 | 819 | 36 | +5.0% | 240 | 62 | 0 |
The island states of
Table 1 can be distinguished in three categories, according to their economic status and GDP. Trend column shows the presumed annual increase of the electricity consumption for each country. In
Section 1.1 it was shown that electricity consumption is highly related to GDP. Therefore, it is expected that electricity demand on each of the island states will evolve in a different manner, according to the current economic status, the energy trends, population growth rates and future developments. The “consumers” numbers are larger than the population number in
Table 1 due to tourism. In the present research the modeling took into account the total consumption (kWh) trends, also including the consumption of the tourism sector.
In the present research we have considered this relation and defined three different scenarios of evolution of the per capita consumption. The first scenario refers to developed island states (in our case Bahamas and Malta) and based on the fact that they are tourist destinations, it predicts a small annual increase of the electricity consumption, equal to 0.5%.
In Cuba the average annual electricity consumption is currently 1348 kWh per person (a low value, especially compared to Bahamas and Malta). Therefore, it is expected that demand will increase in a higher rate, also to respond to the needs of the developing economy. This expectation corresponds to the second scenario with an increase rate equal to 3%.
The current electricity consumption in the remaining islands is extremely low and especially in the case of Haiti is practically zero (36 kWh/capita/year.), indicating the energy poverty of the island. Assuming that the recent economic growth in these island states will continue and will also bring investments on energy infrastructure, a proportionally higher increase on the consumption is expected. For this reason, in the third scenario we have assumed an annual increase of 5% on the annual per capita consumption for Capo Verde, Papua New Guinea and Haiti.
2.2. Optimization Process
The input information of the island states have been utilized by an optimization model that has been developed for the present study. This models builds on a modern metaheuristic algorithm, Harmony Search [
24]. The specific algorithm has been already successfully applied to solve various engineering problems, including application on energy production [
25,
26] and systems’ energy efficiency [
27].
In the present study the developed algorithm performed independent runs for each island state, aiming to estimate the future status of the electricity demand and the required investments on new energy capacity. Following the analysis of the input information for each island and the specific trends on energy consumption and population growth, the developed model performed an optimization on the future additional capacity installations, on a 20-year horizon. This is the core of the present analysis, the model examining the different options in each island state in order to address future (2015–2035) electricity needs, in the most efficient manner. For each island numerous runs have been performed and each run searched the solution-space for the most advantageous (global optimum) solutions. For each island state, the model eventually converged and suggested solutions that correspond to energy investment options with the best value of the objective function (lowest cost) that also satisfies the various constraints.
2.3. Model Formulation: Decision Variables, Objective Function and Constraints
2.3.1. Decision Variables
The model’s decision variables correspond to additional energy capacity that will be required in each island state in the studied time frame (2015–2035). This includes investments in solar PV systems (variable ) and traditional fossil fuel based systems (variable ). Moreover, the model investigates the possibility for battery storage (variable ) as well as the operation hours of fossil systems in an annual basis (variable ). Initial values of the decision variables correspond to the current status, namely the characteristics of existing systems.
2.3.2. Constraints
Obviously, the basic constraint of the model is that the proposed portfolio will manage to cover the electricity demand, throughout the studied period. It is important to note that the electricity production needs also to cover energy losses in the transport and distribution networks as well as losses due to any other reason. Transmission and distribution losses in the selected island states range from
in Malta to
in Papua New Guinea ([
13,
14]). Accordingly, the developed model considered a uniform value of
on top of the consumed electricity, in order to estimate the required electricity production. It is important to underline the large losses of Haiti’s network that reach values as high as
. Haiti is a unique case and as presented in
Section 3.3, energy poverty is a major challenge in this island state.
2.3.3. Objective Function
The objective function of the optimization process calculates the total cost of the suggested energy portfolio (installation and operation cost) for the studied period (2015–2035).
where
j: year under study
: cost of new installed capacity (PV, fossil, battery storage)
: fuel cost, : carbon tax
Incoming and outgoing cash flows of Equation (
1) over the period of time have been transformed into net present values at a discount rate equal to 3%. The efficiency of the different systems, capacity factors as well as the installation costs have been based both on the previous work by the authors [
15] and the recent developments reported in [
3,
4].
Energy Systems’ Capital Cost
In October 2014, the worldwide average price of a residential PV system without tax was given as €1.45/Wp (about 15% higher than in Europe with €1.27/Wp) [
8]. This cost, illustrated in
Figure 2, was used by the model as the systems’ PV cost. The similar input cost figures for the fossil fuel capacities were €0.9 million/MW and for the battery storage €0.12/MWh.
Fossil Fuel Price and Tax
The high price of diesel and heavy oil fuel used for power generation in the island states results in commercial electricity tariffs that are much higher than the global average. In 2012 the average electricity price in Caribbean islands and Mauritius was €0.3/kWh, while in Hawaii it reached €0.395/kWh. Cyprus and Malta have the highest electricity prices (excluding taxes) in the European Union (EU).
The fluctuation of oil and gas prices makes it a complex task to compare the economic sustainability or the cost-effectiveness of the potential electricity generation technologies. From energy management point of view diesel becomes inefficient if not operated at full load. For this reason the developed model also monitors the duration of the fossil fuel systems’ operation for each island state.
The analytical model was executed using two different fuel-price scenarios. The first scenario builds on the 2012 heavy oil/diesel component of the electricity production in Cyprus with a cost of €0.121/kWh. Since 2012 the market has experienced roughly 50% decrease, that considerably affected the energy landscape. For this reason we have added a second scenario where the electricity price is €0.06/kWh and predicts an annual increase of +2.5% (a conservative increase). In order to keep the present paper concise, the results-graphs presented in
Section 3 are limited to the second more up-to-date scenario. Analysis and results of the high fuel-price scenario are available with the online material.
The cost of fossil fuel electricity production was also attributed an additional CO
tax, in order to anticipate the developments of the electricity market in the following decades. The input values for capital and operation costs are presented in detail in
Table A1, in the
Appendix.
Time Horizon of the Simulation
The present analysis has a 20-year horizon and examines the different options for the island states for the period 2015–2035. However, it is important to include costs of the years beyond the studied period in order to take into account the depreciation of investments made near the end of the studied period. In case this particularity is ignored, the optimization process will be biased and converge to large heavy fuel installations for the years just before 2035, since future fuel costs will not be taken into account.
This particularity has also appeared in a previous study by the authors [
15] and was addressed by projecting the optimization process in a longer future time-frame. Similarly, in order to acquire non-biased results and avoid manipulation of the model, the optimization process was set to run for the period 2015–2055, prolonging further in the future for 20 years more. In that way, the results until the year 2035 also consider costs that will appear in the future from investments made before 2035.
In order to take the aging of PV modules also into account, an annual decrease of 0.5% for each year of operation has been introduced for installed solar PV systems. This value has been based from field testing results of last 40 years, as published in the literature [
28].
The analysis also considered the fossil fuel stations’ decommissioning. Most of the islands under study have aged fossil fuel stations that will either be phased out or retrofitted. This will require additional capacity investments that are indicated by “spikes” in electricity production (
Figure 7,
Figure 8,
Figure 9,
Figure 10,
Figure 11).
Battery Storage
The developed optimization model on one hand converges to the best solution that defines values of the required annual additions on the capacity of fossil-fuels and solar-PV. Moreover, it also examines the extent on which battery storage is advantageous. In order to achieve that, it distinguishes day from night electricity consumption. A simple analysis of the studied islands showed that it is relatively accurate to assume 2/3 of the total demand (5840 h/year) corresponding to the day consumption and 1/3 (2920 h/year) to the night consumption. This assumption has been applied in a uniform manner to all islands in order to keep the model as simple and efficient as possible.
Another assumption considers that battery storage and its operation aims to cover exclusively night demand. Thus, batteries will be designed to consume part of the produced solar-PV electricity during the day to recharge and provide the stored electricity at night hours. In that way batteries provide electricity PV systems are out, fossil fuels cover peak-loads and support the night operation, while PV systems minimise or eliminate the oil/diesel consumption. Battery systems can also provide flexibility to the system’s operation during the day, through temporal electricity storage, provided that they will be fully charged before their night operation starts. Islands with bigger reservoirs could also include pumping-storage for balancing reasons (however the present analysis does not cover this aspect). This service has an indirect value and might be very important in some cases. However, the present analysis considers it as a technical advantage and has not assigned an economic value to it that should be included in the cost function.
3. Results
In the present section the results for the six island states are presented (Papua New Guinea, Capo Verde, Haiti, Malta, Bahamas and Cuba). As explained in
Section 2.3 the optimization algorithm performed independent runs for each country. Initially information on production/consumption patterns of each island state was fed into the algorithm. Then, the metaheuristic algorithm performed the iterative optimization process aiming to minimize the objective function (Equation (
1)) for the system’s overall operation period. Thus, the algorithm explored different combinations of capacity additions, energy storage and fossil fuel consumption that constitute the optimum option. The algorithm also considered aging and phase out of the energy systems.
Eventually the algorithm converged for each island state to the annual values of the four variables (a set of 20 values of
for the period 2015–2035) that minimize the total cost. These values are illustrated in
Figure 6,
Figure 7,
Figure 8,
Figure 9,
Figure 10,
Figure 11 and represent the low-cost option for the island states under study.
As explained in
Section 2.3.2, the optimization model aimed at an electricity production that also covers the various electricity losses and it is higher from the consumption. This additional electricity production is conspicuous in some of the graphs (
Figure 8 and
Figure 11), but less visible in others (
Figure 8 and
Figure 11). Indeed for several years the optimal system configuration predicts a production equal to the consumption where the two lines production-consumption coincide (e.g., Haiti between the years 2020–2024).
In the output figures there is an unanticipated peak of production at the midperiod for all islands. The reason behind this is that model assumed 10 years of remaining lifetime for the existing fossil capacities. That appeared to be the case for at least one of few units for the islands and causes an overcapacity accumulation just before the replacement.
As described in
Section 2.3.3 the model optimizes the values of capacity additions for energy systems that will cover the future demand. As a result the spike in
Figure 6,
Figure 7,
Figure 8,
Figure 9,
Figure 10,
Figure 11 indicates a hypothetical electricity production that would appear only if old and new capacities continued to produce electricity in the same manner. Electricity production line is a projection of the optimal capacity additions. Obviously, in real world this production spike would involve large, unreasonable energy waste. Therefore it is expected that capacities that will have the higher electricity production cost will remain idle in the year of the spike until older units will be decommissioned.
3.1. Model Results for Papua New Guinea
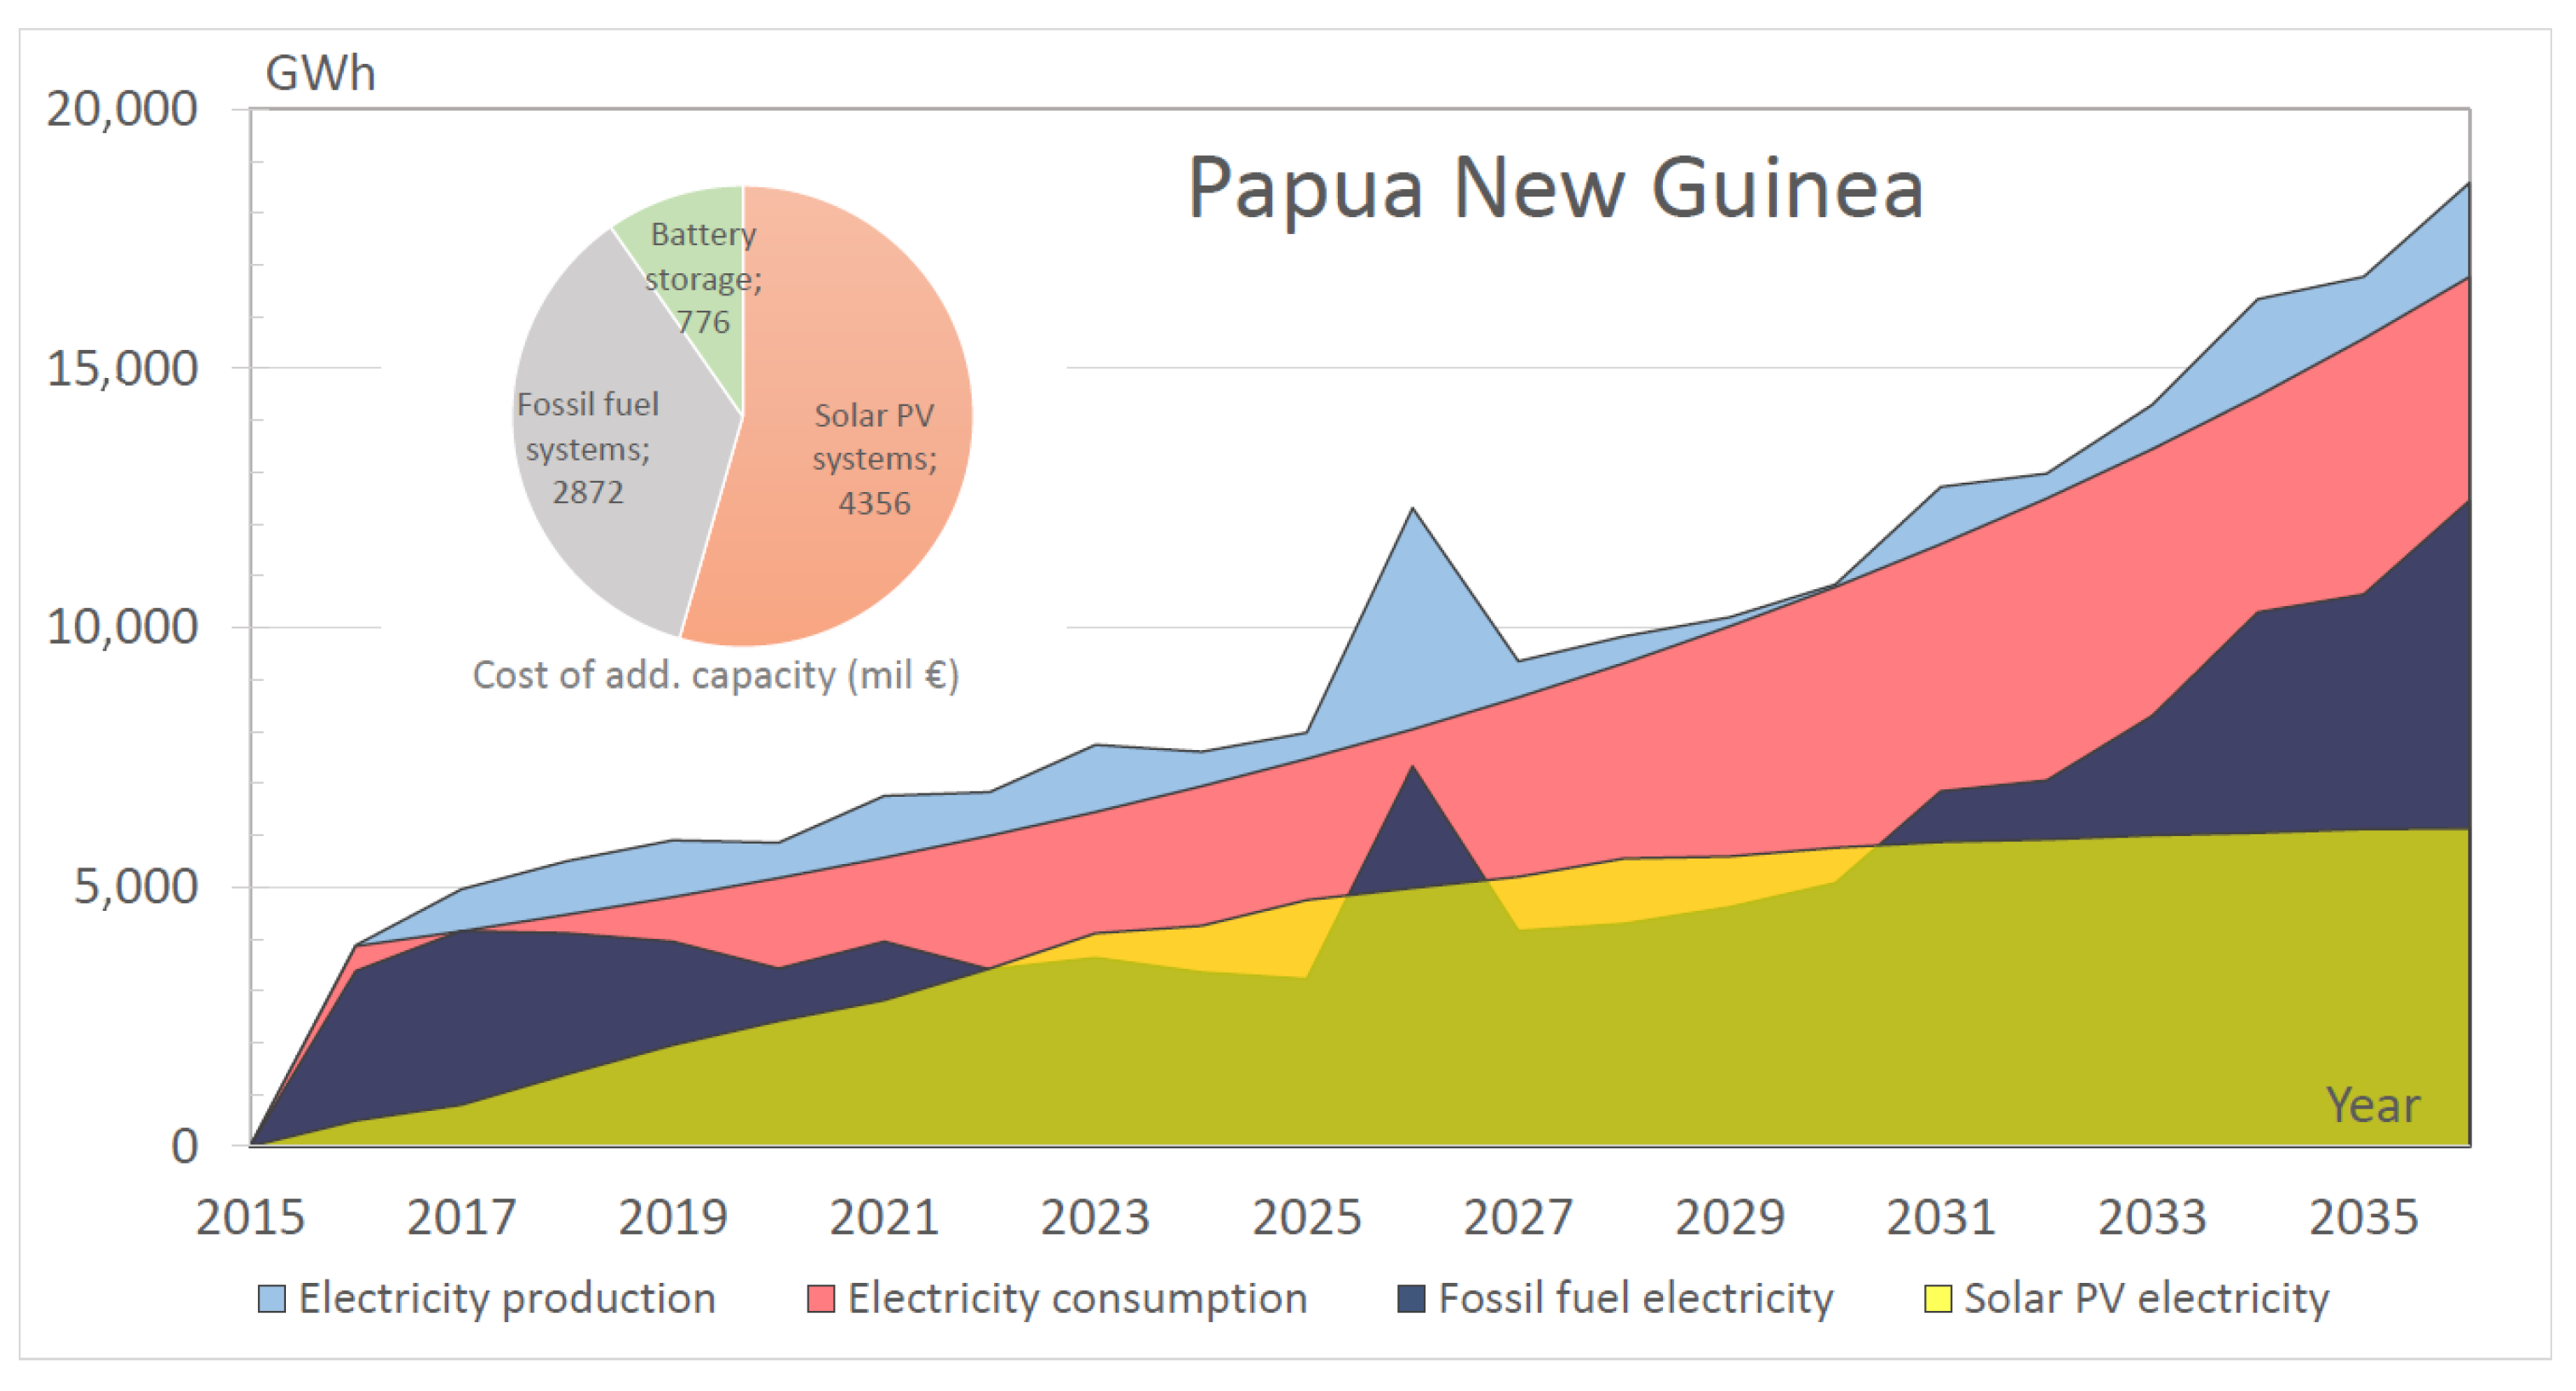
Papua New Guinea represents the Pacific islands, where 70% of households do not have access to electricity. In fact, Papua New Guinea together with the Solomon Islands and Vanuatu have electrification rates that are among the lowest in the world (<20%). Such values can only be compared to the poorest African countries. In the projected 10 year period, the island’s predicted electricity consumption (
Figure 6) shows a threefold increase due to its very low starting point (extremely small per capita consumption) and also due to the dynamic population increase. Among the islands studied in the present research Papua New Guinea is a medium populated but the population is increasing rapidly.
The results of the simulation showed that the best energy strategies for 2015–2035 suggest a dynamic PV installation in the beginning of the period with increase in the battery capacity. Heavy oil capacities are increased towards the end of the 20-year period, following their increased operations in both the daytime and night. With the (assumed) phase out of the original oil capacity the nominal PV capacities exceed the fossil capacities by 50%.
Figure 6.
Papua New Guinea: Additional electricity production (optimal proj.: 2015–2035).
Figure 6.
Papua New Guinea: Additional electricity production (optimal proj.: 2015–2035).
3.2. Model Results for Capo Verde
The West African island state has a small population compared to the other islands included in the analysis. It also has a very low per capita (p.c.) electricity consumption. It is part of the Economic Community of West African States (ECOWAS) and hosts the headquarters of the ECOWAS Regional Centre for Renewable Energy and Energy Efficiency (ECREEE). Though Capo Verde islands are characterised by low electrification rates, the national government has set ambitious energy plans with the support of the ECOWAS-ECREEE, aiming at an eventual 100% RES electricity production. Accordingly, several renewable energy projects that rely on solar and wind distributed generation are already on the construction/operation phase.
The optimization model supports the adequacy of the local RES potential and the soundness of the government’s plans to rely on renewables (
Figure 7). It projects that even in a low oil-price scenario the PV capacity should represent almost 75% of the energy portfolio with the fossil fuel capacities hardly contributing to the daytime load of the islands.
Figure 7.
Capo Verde: Additional electricity production (optimal projection: 2015–2035).
Figure 7.
Capo Verde: Additional electricity production (optimal projection: 2015–2035).
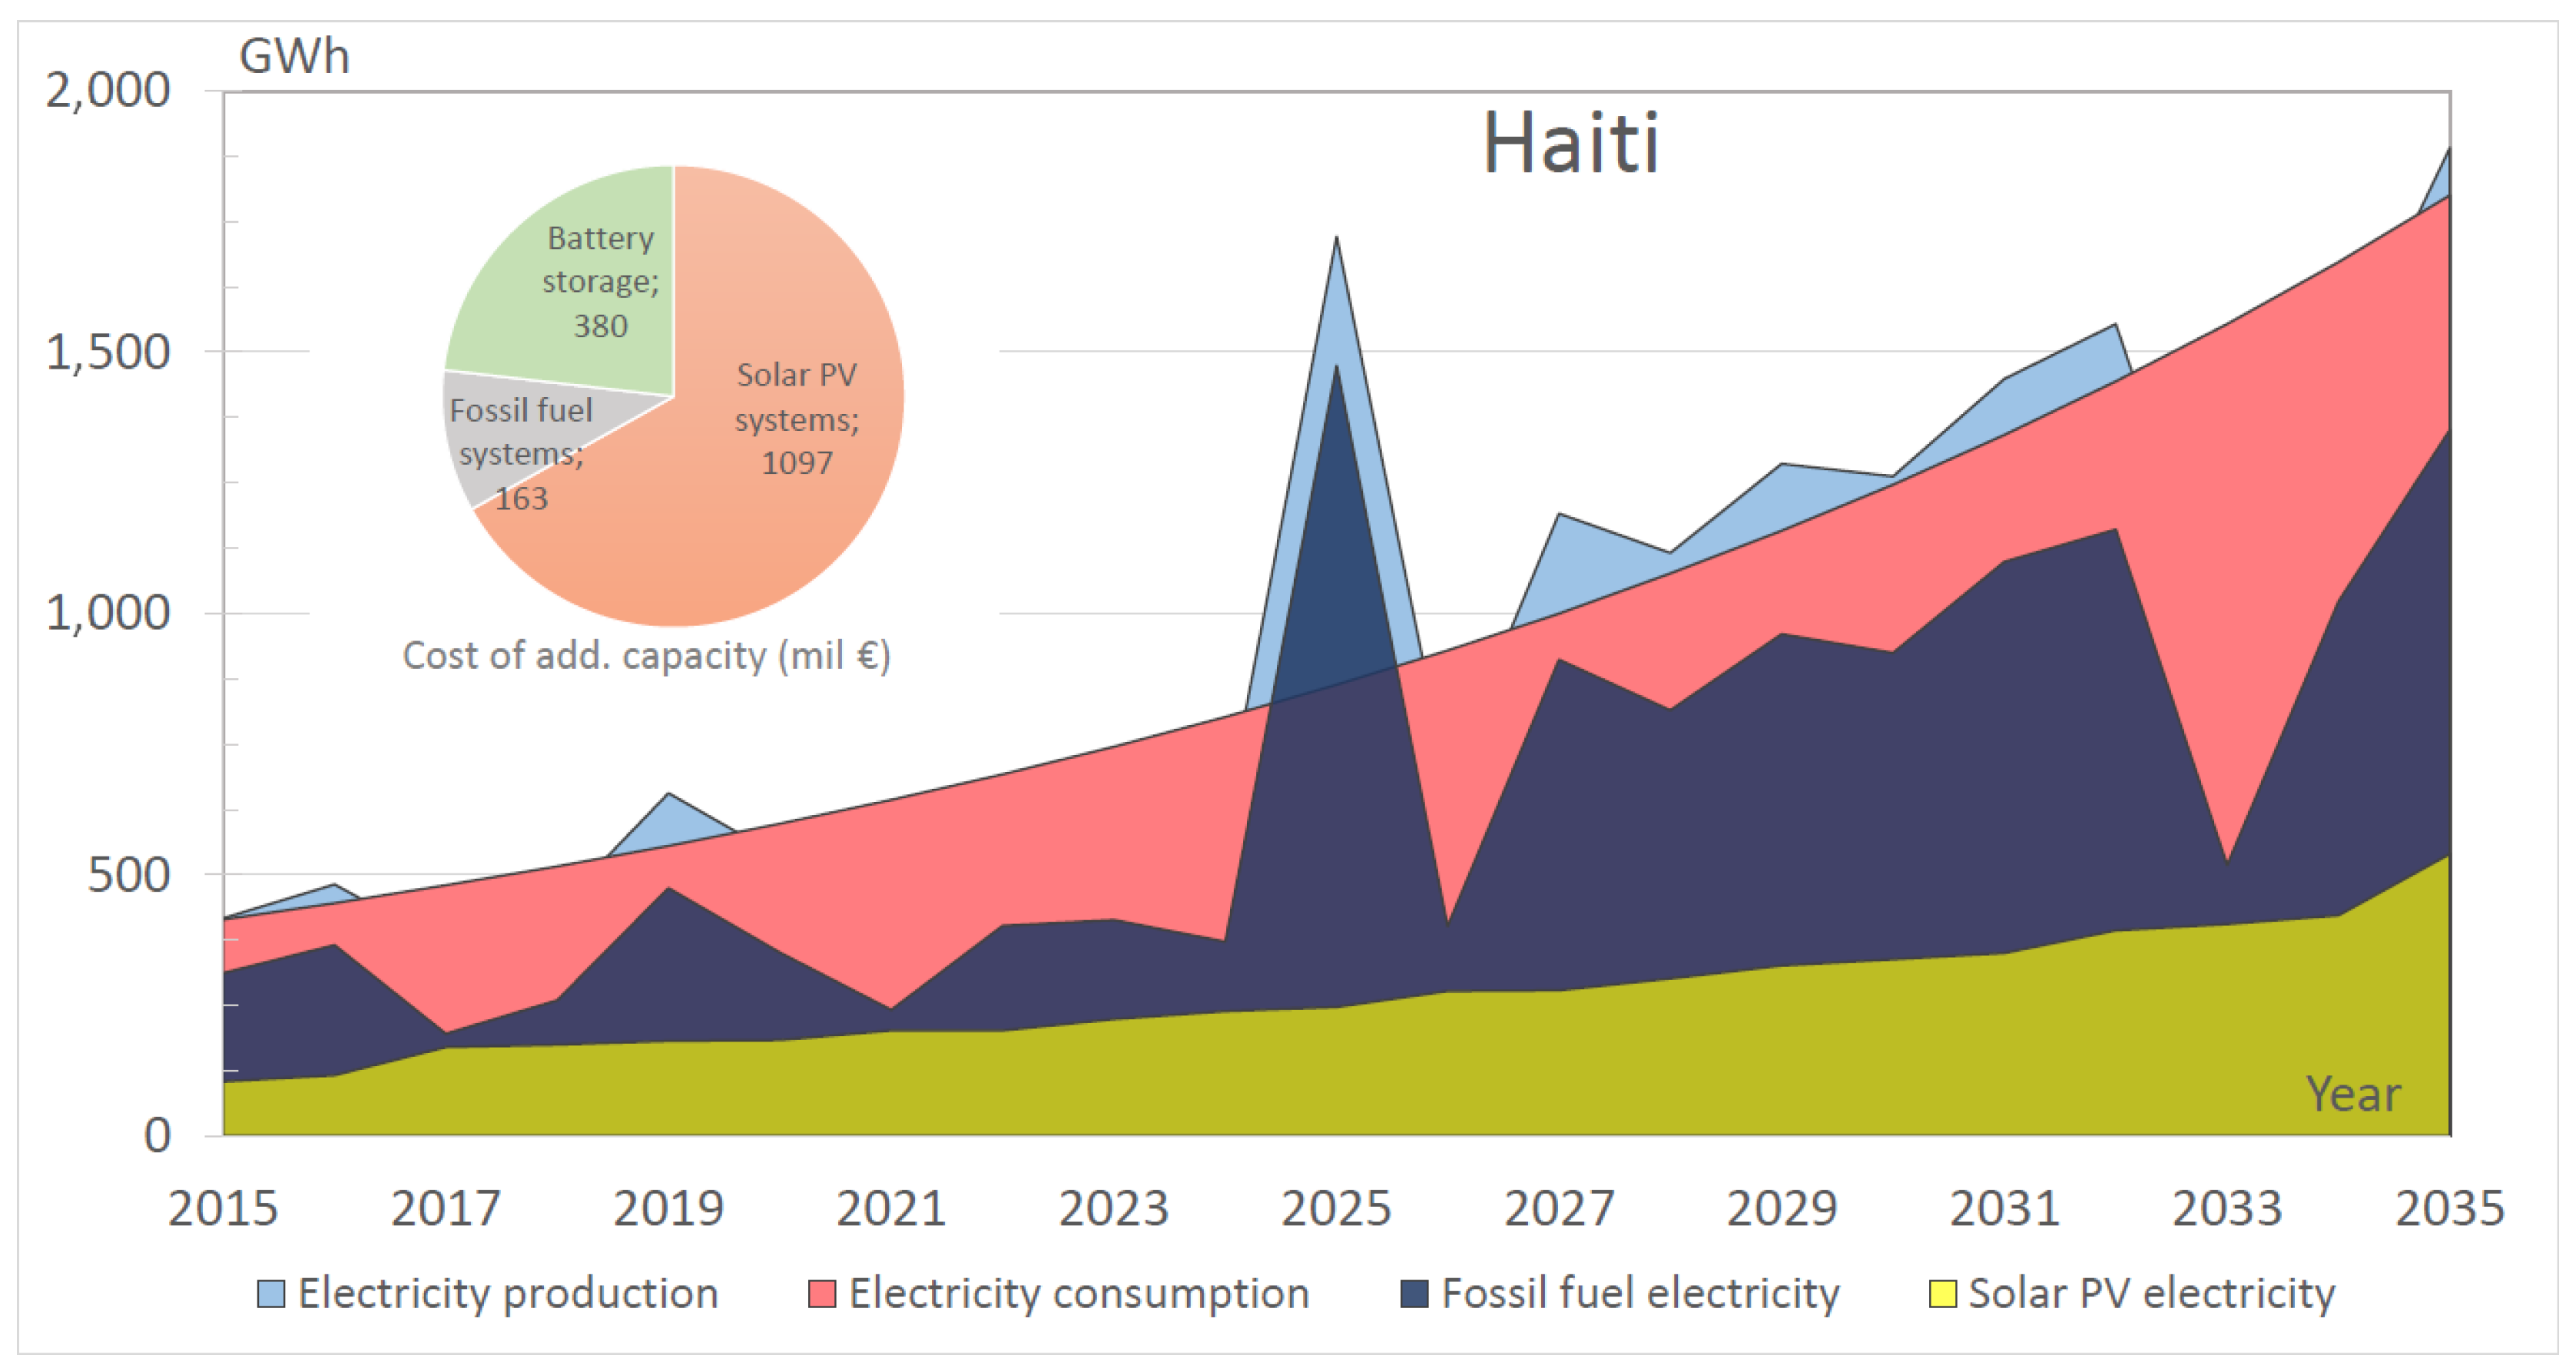
3.3. Model Results for Haiti
Haiti, together with Cuba represent the largest islands selected for the present analysis and also the poorest in the group (
Figure 8). Despite being a large island, its electricity consumption is more similar with the smallest islands discussed here. Thus, the electrification and consumption rates are amongst the lowest in the world. Energy poverty will need to be mitigated under any future sustainable development scenario. Accordingly, the model assumed the highest increase on the electricity consumption for Haiti.
Figure 8.
Haiti: Additional electricity production (optimal projection: 2015–2035).
Figure 8.
Haiti: Additional electricity production (optimal projection: 2015–2035).
In order to address this dynamic consumption increase, the optimization model’s output suggested the highest annual fossil fuel capacity additions among the analyzed islands. The present situation justifies an accelerated capacity installation pathway, which renders as secondary the technology choice. Nevertheless, the balance PV and oil capacity shares in the first 10 years will provide time and experience to examine whether a more sustainable pathway could be feasible in the second half of the period, perhaps taking advantage of the financial and fiscal instruments highlighted in the conclusions.
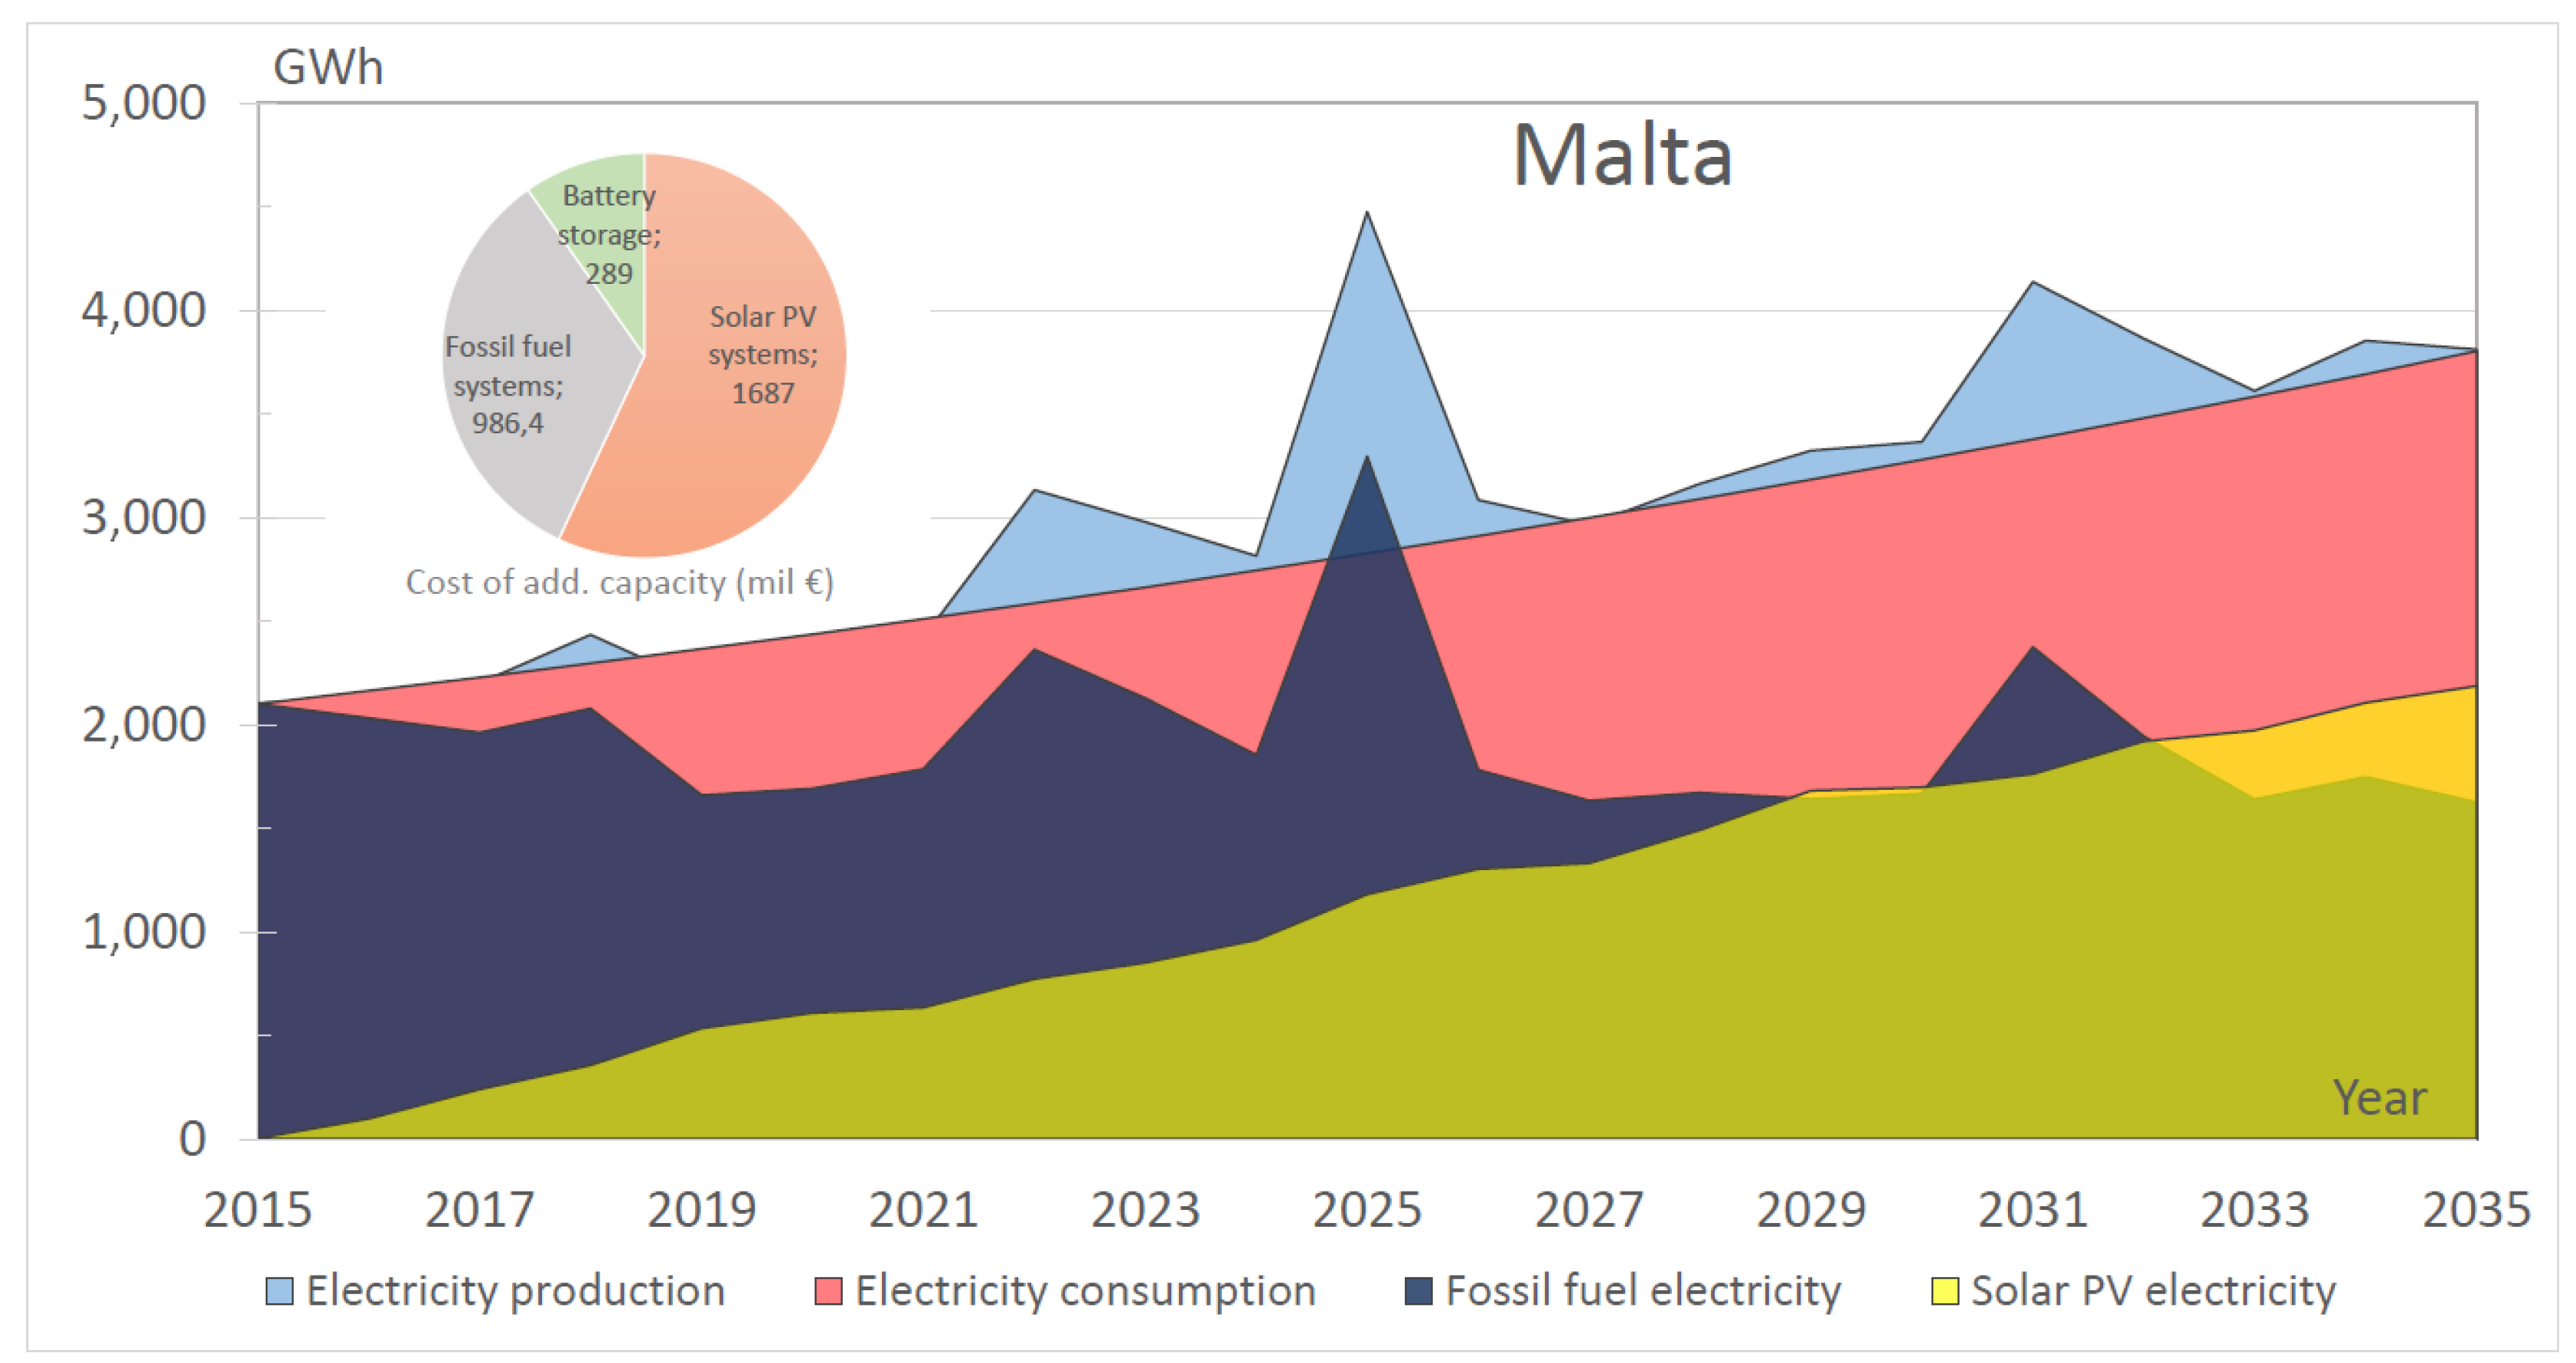
3.4. Model Results for Malta
Malta represents a small island that is part of the European Union, with high values both of GDP and electricity consumption per capita. At the same time, Malta has a very low share of RES. For the reasons discussed in
Section 2.1, a more moderate consumption and population increase is foreseen for Malta. A 100 km interconnector power line with Sicily is planned and is expected to be operational by the end of 2015. The interconnector power line will increase the available capacity by 200 MW. The optimization model converges to high PV penetration for Malta, although the initial consumption is high and as a result the expected capacity installations are more moderate (
Figure 9). Fossil fuel based generation stays at a near constant level (with the exception of the assumed phase-out year) since the total production is expected to remain at a quite high level. The dynamic PV additions show that the PV option offers a cost-effective way to diversify the electricity generation from one dominant resource to a developed island state. This could help to achieve not only a more sustainable energy mix, but move the country towards energy security.
Figure 9.
Malta: Additional electricity production (optimal projection: 2015–2035).
Figure 9.
Malta: Additional electricity production (optimal projection: 2015–2035).
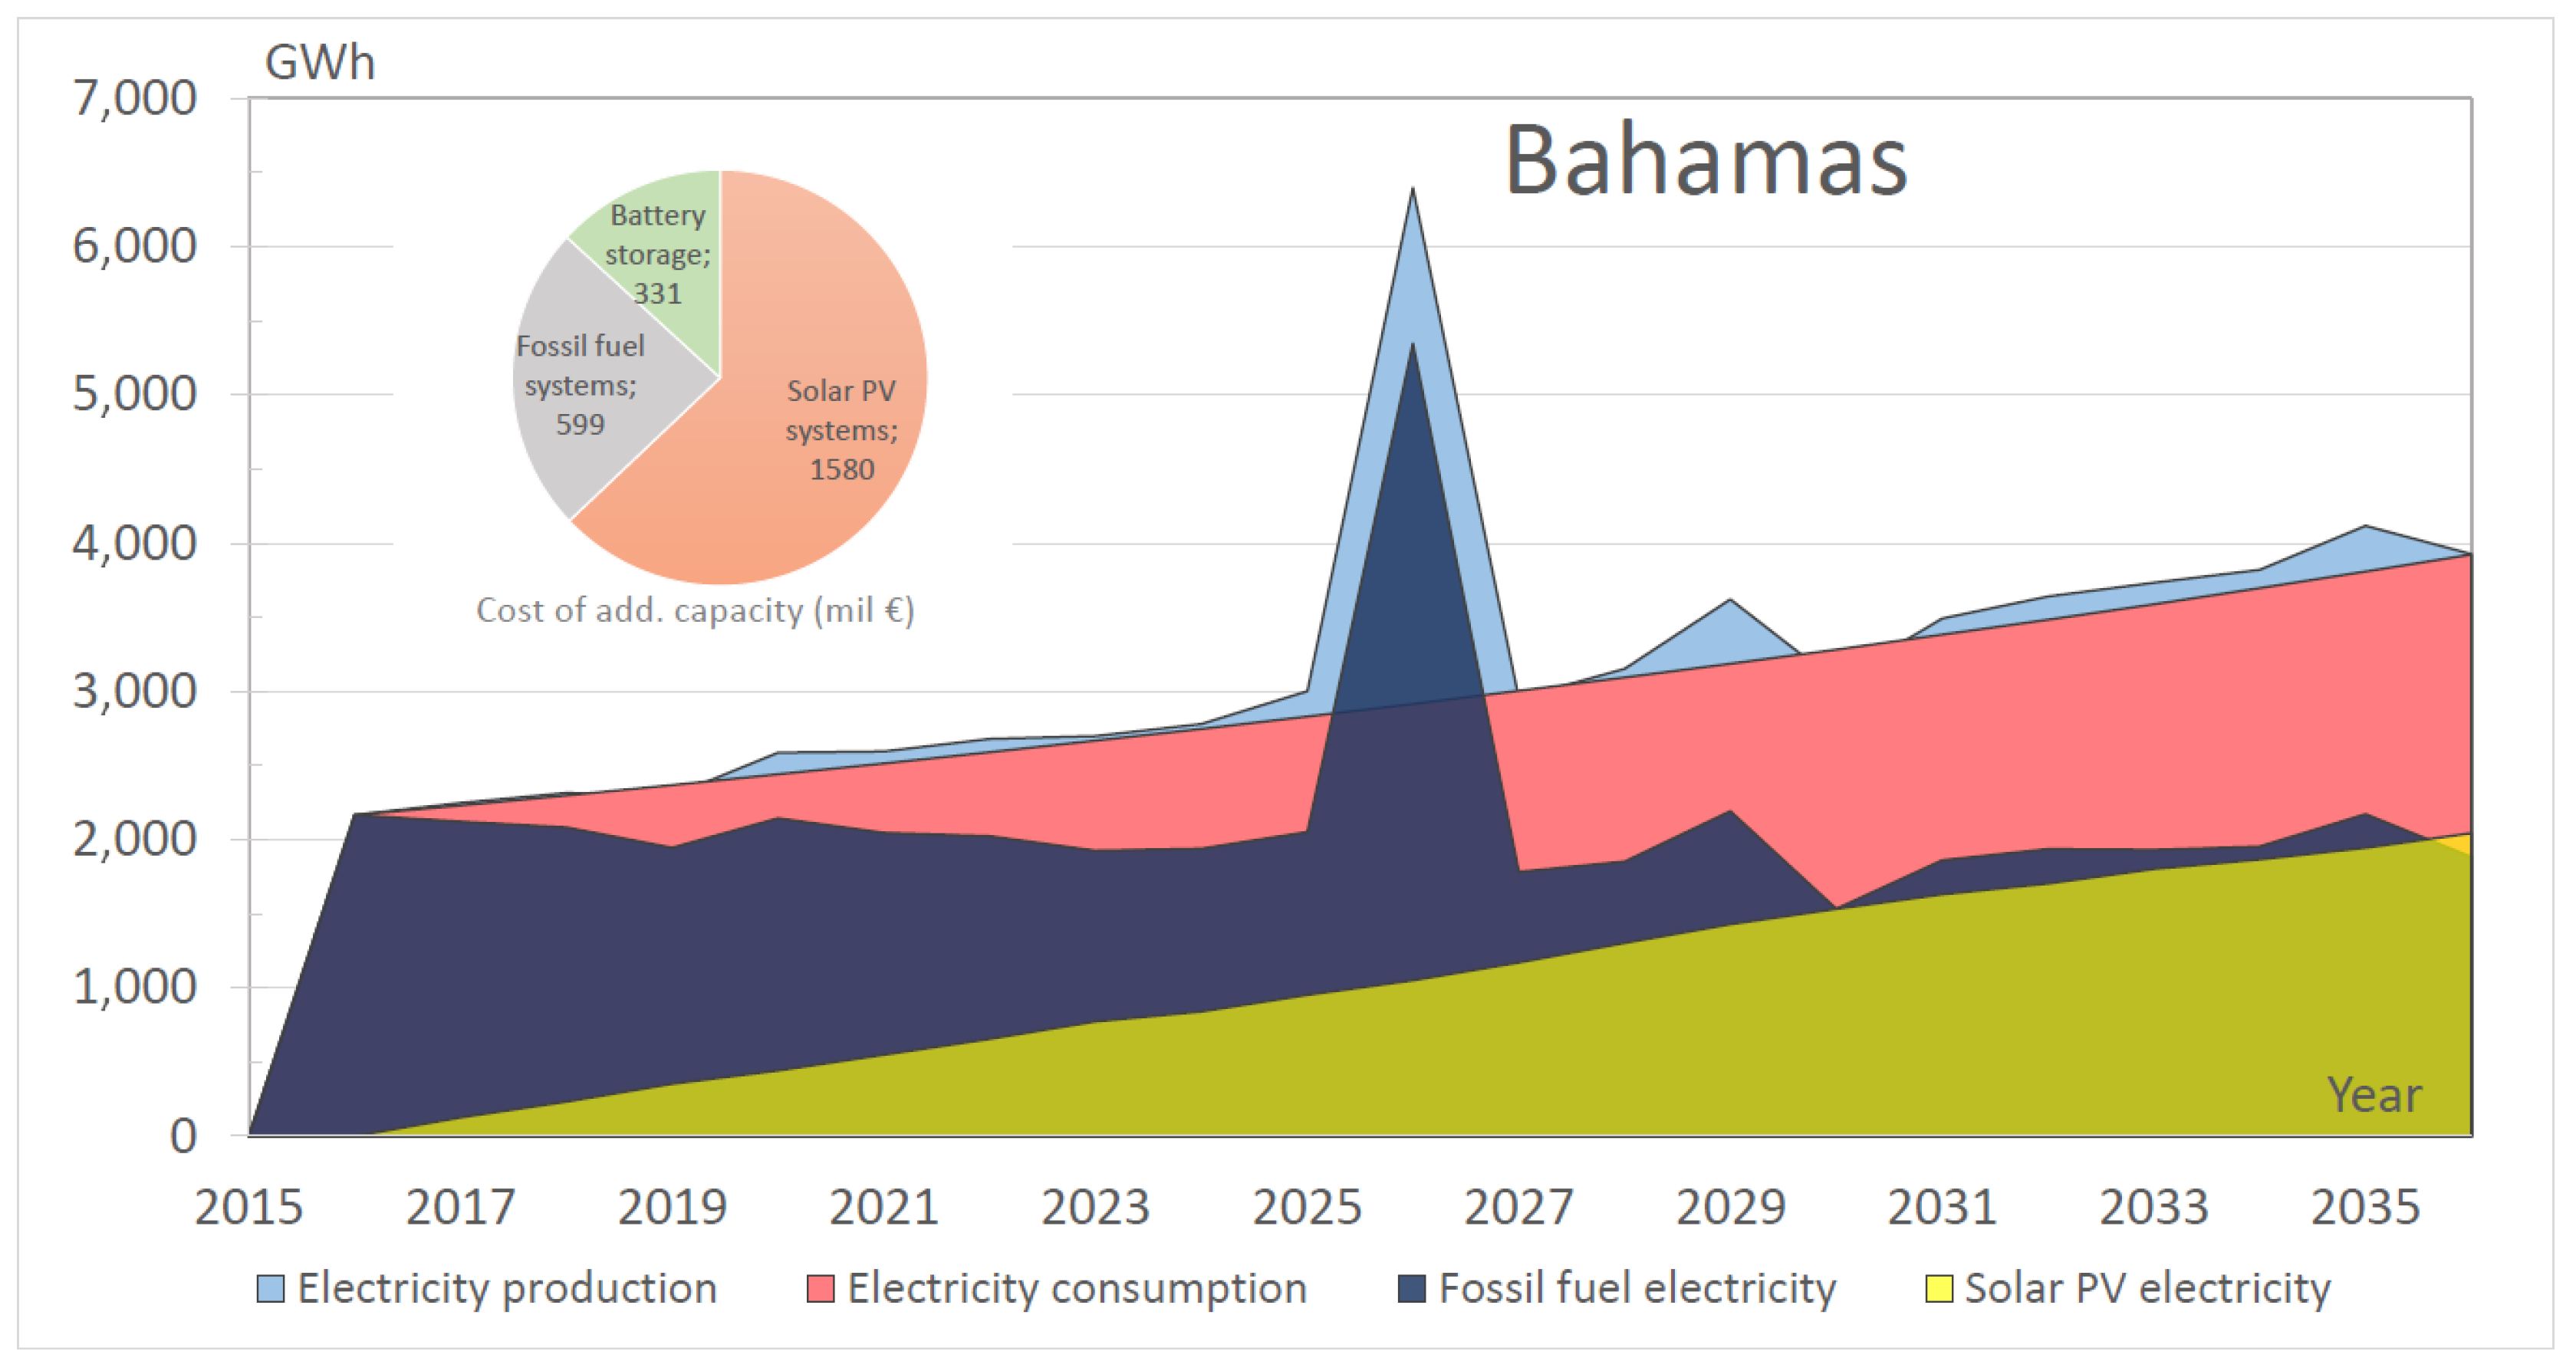
3.5. Model Results for Bahamas
Bahamas is the richest amongst the six islands, having the highest electricity consumption level. The optimization resulted in the highest fossil plant utilization, but towards the end of the studied period a convergence to nearly equal share between PV and fossil based capacities was observed (
Figure 10). This clearly shows the potential of PV capacities to support additional electricity demands caused by the expansion of tourism, even in island countries that already have a well-developed power portfolio.
Figure 10.
Bahamas: Additional electricity production (optimal projection: 2015–2035).
Figure 10.
Bahamas: Additional electricity production (optimal projection: 2015–2035).
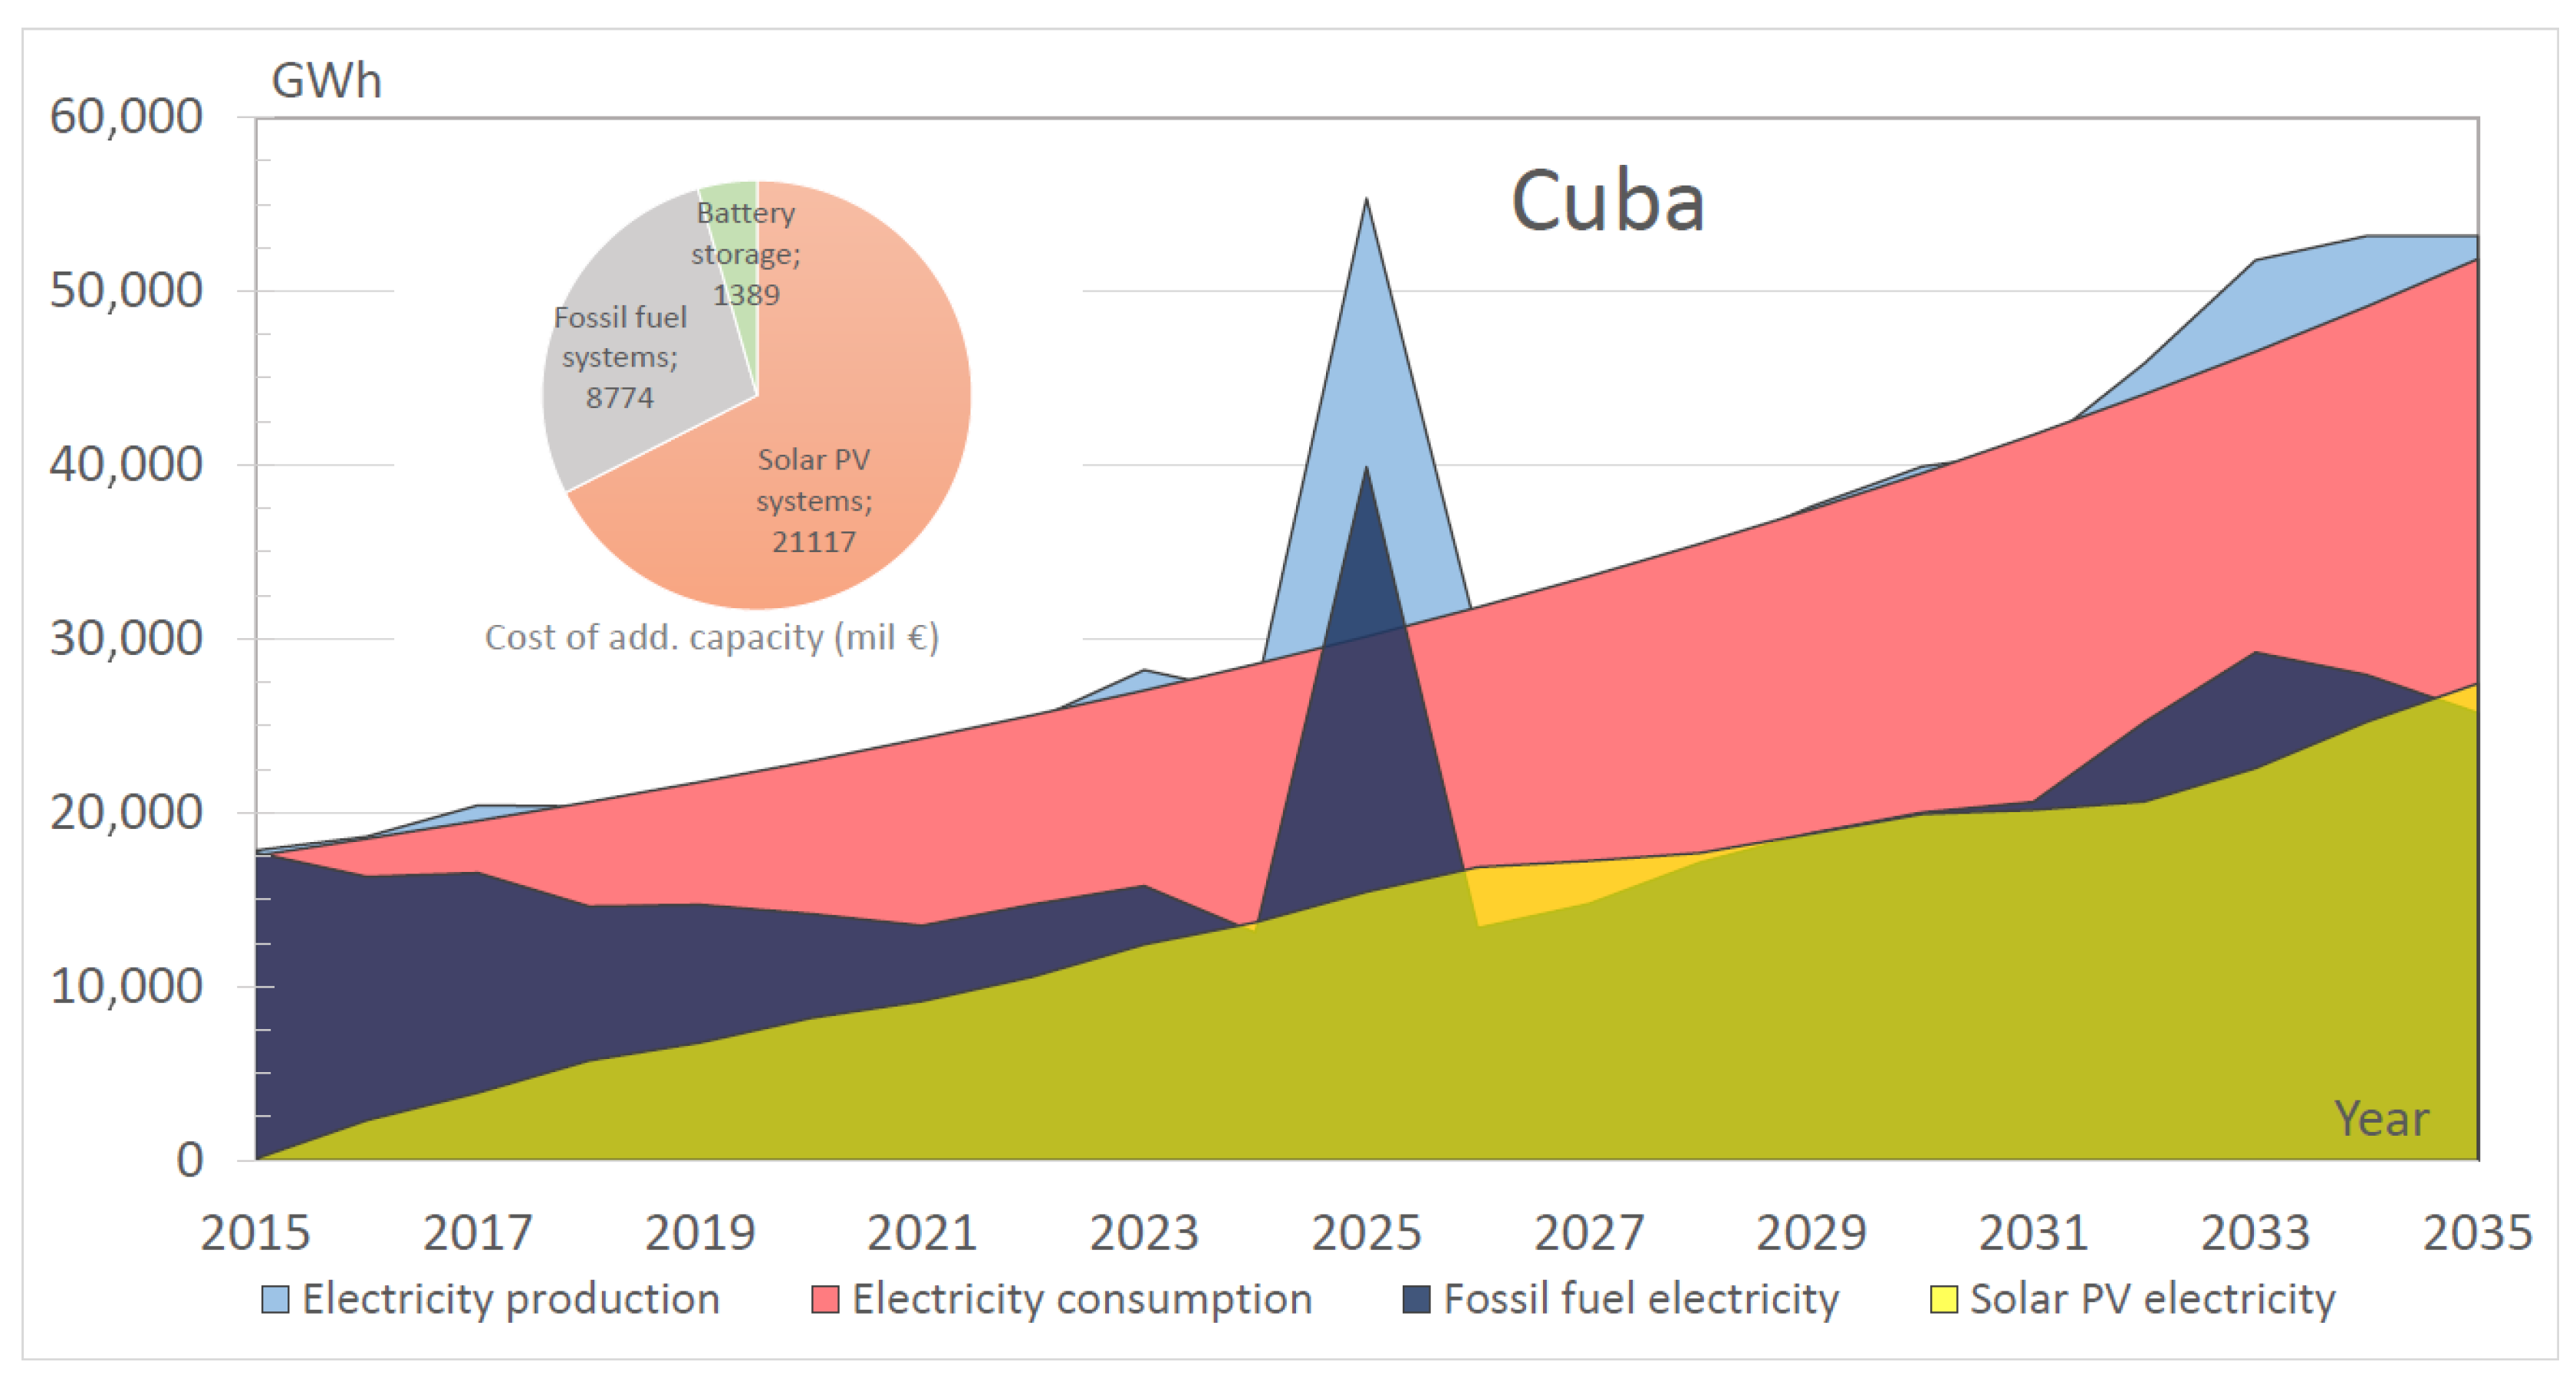
3.6. Model Results for Cuba
Cuba has the biggest population and medium GDP and consumption per capita amongst the selected islands. There are several socio-economic differences to the other five examples that could not have been taken into account in the input parameters. These differences make it difficult to make recommendations on incentive schemes.
However, the optimization exercise was useful to highlight the good potential for this size of islands as well. The model converged to PV and fossil capacities reaching 40%–60% in the electricity production by the end of the study period, according to the fuel-price scenario. The model’s output gives a better insight to the robustness of Cuba’s original electricity mix and highlights the significant huge potential for a RES market penetration in a good geographic location with socio-economic particularities.
There are quite a few factors that could help the Renewable Energy development in Cuba, that are discussed in the following section. In the near future Cuba will need to take significant steps in converting its energy portfolio to a more sustainable one that will rely more heavily on the indigenous energy sources. The rural areas of the country have during the last two decades implemented many projects with international cooperation, that are based on decentralised energy systems. The electricity grid infrastructure in Cuba will require major refurbishments which could also be advantageous for distributed energy options.
Figure 11.
Cuba: Additional electricity production (optimal projection: 2015–2035).
Figure 11.
Cuba: Additional electricity production (optimal projection: 2015–2035).
3.7. Numerical Summary of the Results
The resulting share of PV, battery storage and fossil fuel capacities as well as an estimation of the electricity generation for the studied island states is illustrated in the following
Table 2.
Table 2.
Resulting share of Fossil fuel, PV and battery storage systems.
Table 2.
Resulting share of Fossil fuel, PV and battery storage systems.
| PV, Fossil Fuel: MW | Papua | Capo | Haiti | Malta | Bahamas | Cuba |
|---|
| Battery Storage: MWh | New Guinea | Verde |
|---|
| Fossil Fuel (existing) | 722 | 111 | 240 | 572 | 493 | 5500 |
| PV (existing) | 294 | 34 | 62 | 2 | 0 | 65 |
| Battery storage (existing) | 0 | 0 | 0 | 0 | 0 | 0 |
| PV percentage % (existing) | 41 | 31 | 26 | 0 | 0 | 1 |
| Fossil Fuel (in pipeline) | 530 | 31 | 0 | 0 | 0 | 370 |
| PV (in pipeline) | 0 | 349.8 | 0 | 0 | 0 | 0 |
| Fossil Fuel (modelled–2035) | 226.5 | 272 | 528 | 538 | 568 | 797.1 |
| PV (modelled–2035) | 3273 | 698 | 321 | 1330 | 863 | 1194.3 |
| Battery storage (modelled–2035) | 1458 | 402 | 1162 | 585 | 815 | 2132 |
| PV percentage % (modelled–2035) | 145 | 257 | 61 | 247 | 152 | 150 |
4. Discussion and Conclusions
Optimizing the energy portfolios for the islands to the minimum cost level means a move towards providing electricity by more sustainable resource base. The resulting electricity generation portfolios for all studied islands clearly increased the use of indigenous sources for electricity generation compared to the current production dominated by fossil fuel.
Although in most cases the heavy oil capacities remain in the portfolio at a constant or even increased capacity level, its share and daily utilization decreases as the PV capacities are projected to build up in the cost optimal portfolio. This means that solar resource starts to substitute the heavy oil/diesel use, decreasing the fossil fuel shipment-storage cost, emissions, environmental risks as well as the dependence on imported energy resources. And this movement towards a more sustainable and indigenous resource-use secures at the same time cost savings even at the conservative fossil fuel cost scenario.
A significant tendency, a lock-in mechanism can be observed on the resulting cost optimal power portfolios. Islands that initially have high shares of fossil fuel capacities are expected to keep these higher shares at 2035 (e.g.,
Figure 6). Therefore, it appears the existence of RE systems in the islands facilitates further development and vice versa.
Immediate PV installations of many small capacities at the beginning of the projected period appears as a beneficial feature for further PV additions (modular design). In that way investors instead of funding a single fossil power plant invest small instalments on modular projects. Risk is thus reduced and solar PV portfolio can be gradually developed, when advantageous. This gradual transition has the extra advantage that mitigates the lock-in effect that early installations of large fossil fuel capacities have: price fluctuations might render them idle for long periods, preventing at the same time investments on RE. Recent is the example of the gas turbines in Europe with large capacities remaining idle since 2012.
International donor organisations and agencies specialised in energy sector have to play a more active role in influencing the National Electricity Master-plans of islands. The present plans are dominated by fossil based power generation options that are not optimal: neither from sustainability nor from cost optimal solution point of view. Recent donor supports for island states have to be reviewed and should eliminate subsidies for resources with harmful climate effects.
The gradually increasing development of the PV sites could also delay the decision on the phase out of existing large fossil fuel based capacities. By the time this phase out would take place the other clean technologies based on indigenous resources (like the proposed large-scale hydroelectric projects in Papua New Guinea, Jamaica and Guyana or the wind potential in many islands) would be able to completely substitute the fossil fuel based ones.


