
The Water Footprint of the Wine Industry: Implementation of an Assessment Methodology and Application to a Case Study


Abstract
:1. Introduction

2. The WF Assessment Methodology
2.1. Agricultural Water Footprint
2.2. Winery Water Footprint
3. The Improved WFgrey Assessment Methodology
3.1. The Reference Approach
3.2. The Improved Approach
- (1)
- Accounting for the WFgrey only when cpoll > clim does not allow for proper consideration of the superimposed effect of different processes insisting on the same water reservoir (e.g., two different wineries affecting the same catchment basin) and hence to guarantee completeness on a large scale;
- (2)
- Considering the maximum of the three dilution volumes (Equation (9)) implies that the same water is capable of diluting pollutants present at different locations (e.g., underground and surface). This is in general not true if we want to preserve the water resource quality at any time (i.e., simultaneously dilute any pollutant). As a result, the water volume computed with Equation (8) may result in an underestimate of the volume effectively needed.
- a)
- A lower limit considering the runoff and leaching components as in Equations (7) and (8);
- b)
- An upper limit considering the runoff and leaching components as in Equations (13) and (14):

| Reference Approach | Improved Approach | |||
|---|---|---|---|---|
| Lower Limit | Upper Limit | |||
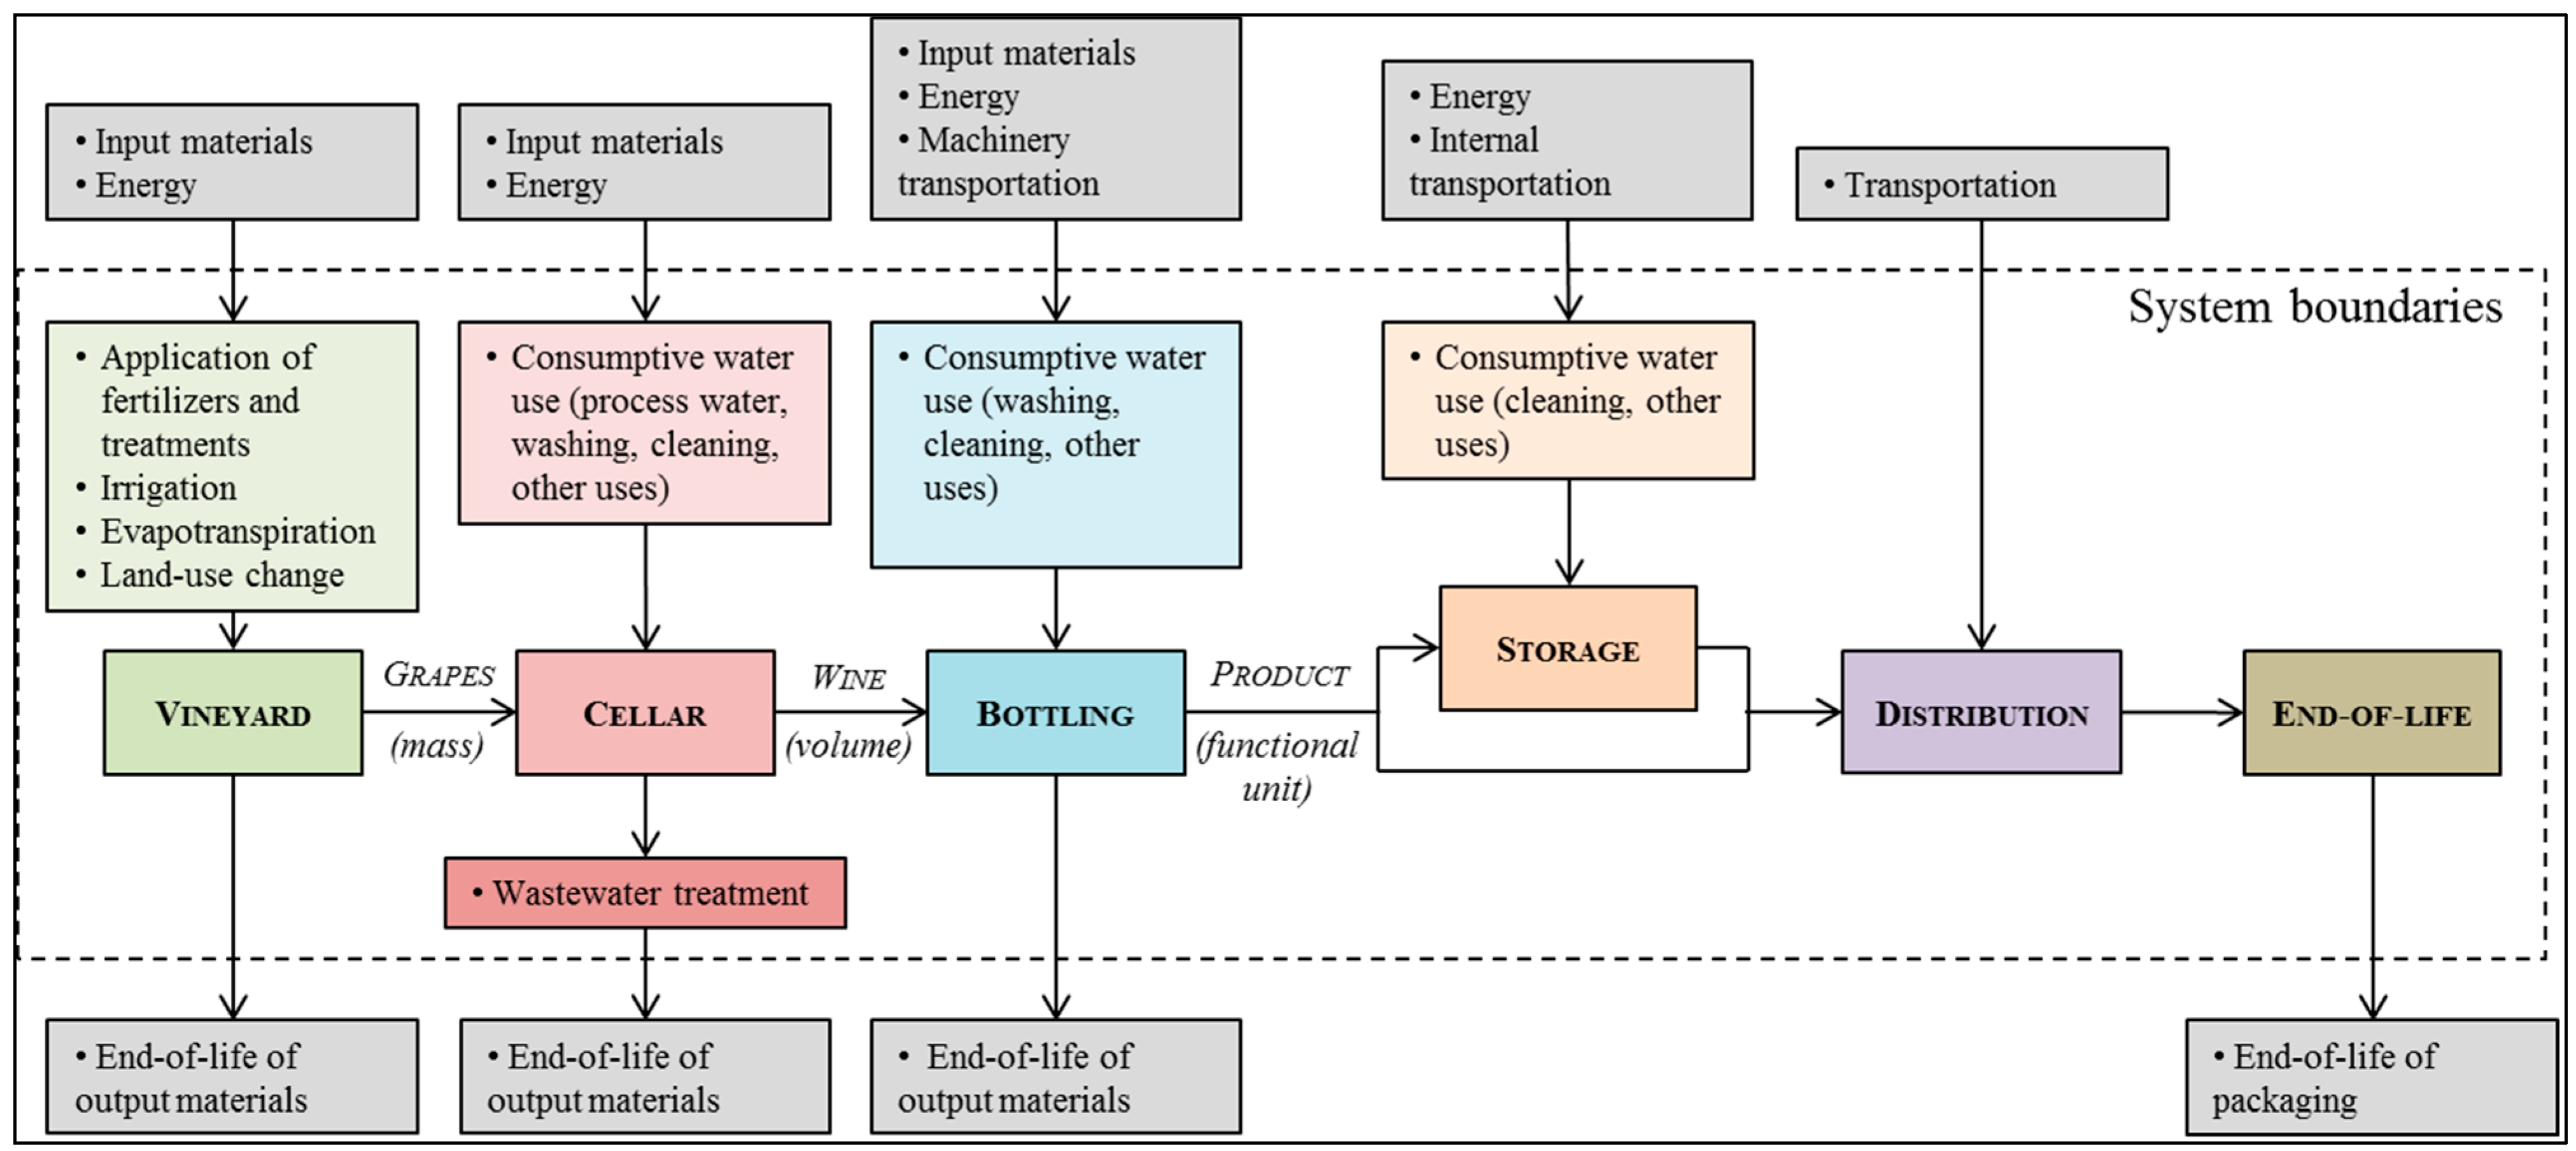
4. System Definition and Data Collection
- (1)
- irrigation;
- (2)
- evapotranspiration;
- (3)
- application of fertilizers;
- (4)
- application of agrochemicals and pesticides;
- (5)
- all vineyard and cellar activities requiring consumptive use of tap and well water;
- (6)
- treatment of wastewater.

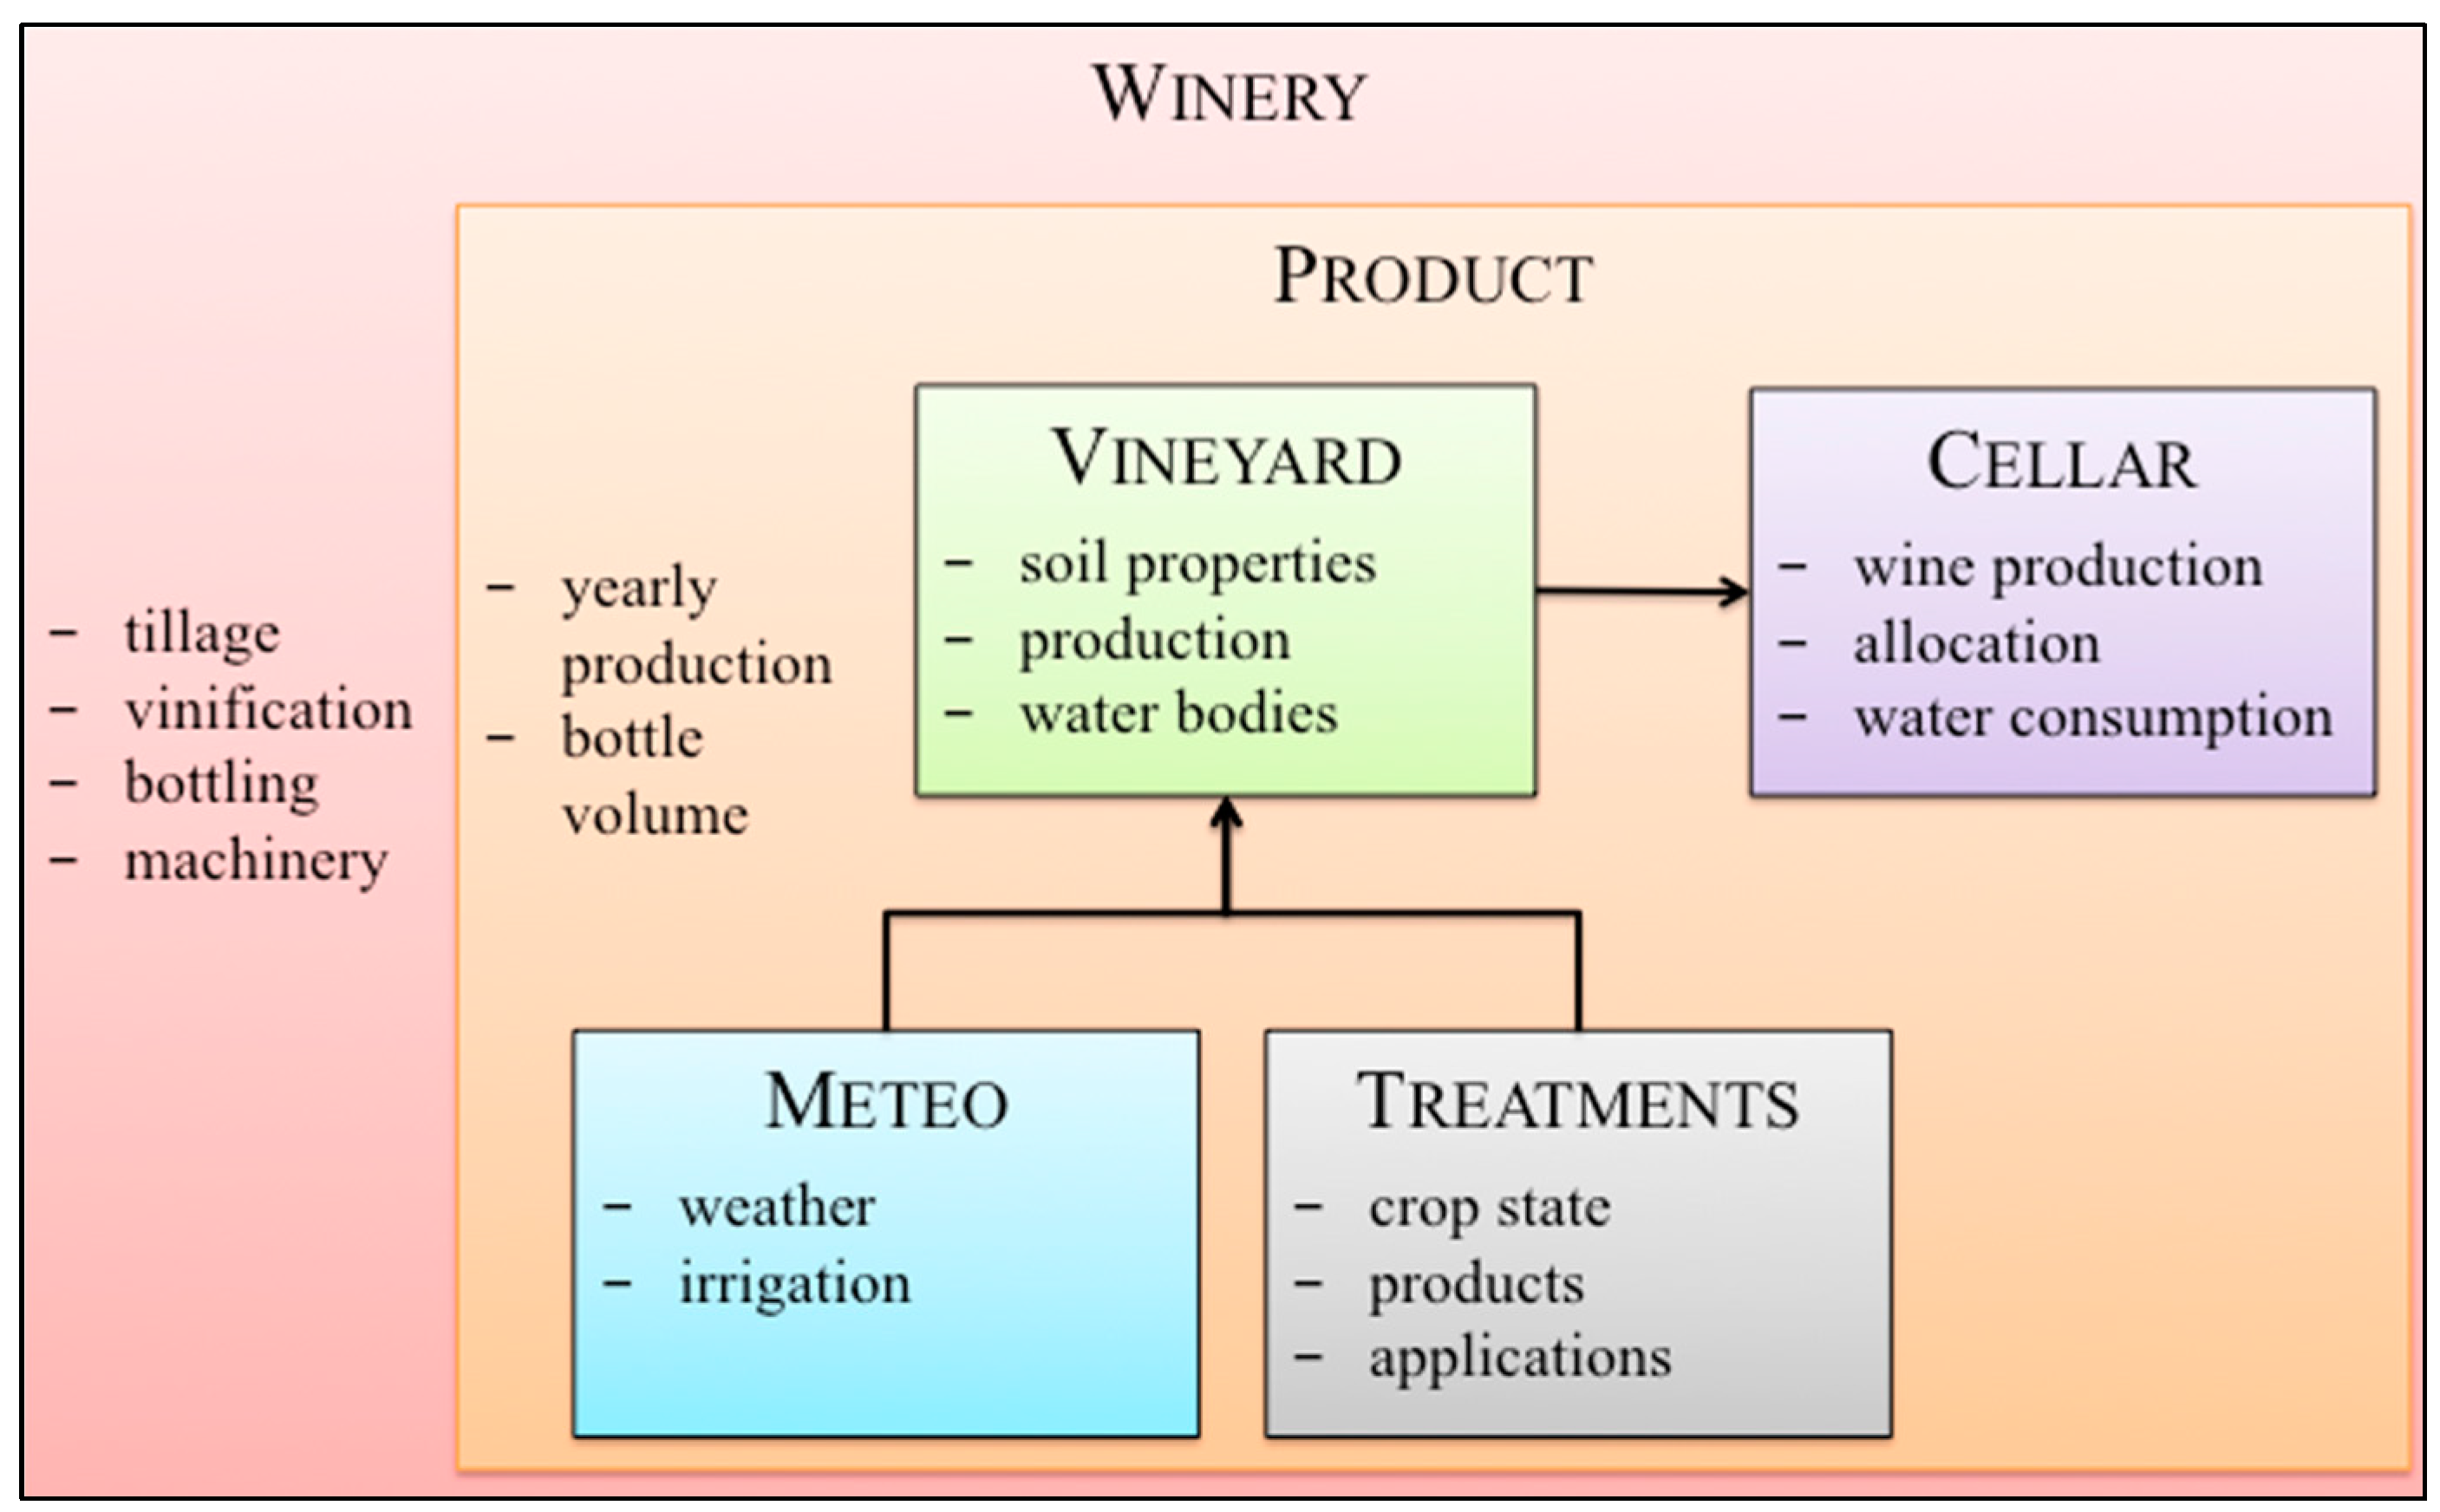
- (1)
- Winery—In this first step, general data about the winery are entered, and, in particular, the activities that are within the company boundaries: grapes production, vinification, bottling, and property of machinery and vineyards. Since the methodology was set up before the release of the Carbon Footprint of Products (CFP) and Water Footprint (WF) international standards [19,30], guidelines for the assessment of carbon footprint of organizations ([42,43,44]) were followed. Nevertheless, the procedure was setup using a product point-of-view, for example requiring the contribution from entities other than the winery (e.g., analogue to the Scope 3 emissions for the carbon footprint of organizations) to be included as mandatory.
- (2)
- Product—In this second step, general data about the product are entered. The required fields are the yearly production and the bottle volume. The former is needed for the allocation procedure, the latter to evaluate the correct water footprint per bottle.
- (3)
- Vineyard—Data entered in the third, fourth, and fifth steps are used to evaluate the WFagr. All the vineyards that have common characteristics, in terms of meteorological conditions, soil properties, grape production, and treatments, are grouped in one territorial unit. If grapes from more than one territorial unit are used in the wine assembly, data from each one have to be entered. The quantities required are:
- −
- percentage of the product obtained from the territorial unit;
- −
- latitude, longitude, altitude;
- −
- grape production, wine yield;
- −
- surface, perimeter, slope, irrigated surface;
- −
- length of side facing the water-body, distance, width, depth of the water body;
- −
- aquifer depth, root depth;
- −
- soil type, sand, clay, and organic content;
- −
- skeleton, bulk density, field capacity, air content, porosity.
- (4)
- Meteo—Daily meteorological and irrigation data are also required to compute evapotranspiration and pollutant spread. The mandatory quantities are:
- −
- precipitation;
- −
- maximum and minimum air temperature;
- −
- maximum and minimum relative humidity;
- −
- mean and maximum wind speed at 2 m height.
- −
- solar radiation;
- −
- mean air temperature;
- −
- mean humidity.
- (5)
- Treatments—Data for the application of fertilizers, pesticides, and agrochemicals are entered in a two layer procedure. An entry is created for each application, containing the following information:
- −
- date, crop phenological state (BBCH);
- −
- water used for dilution, water used to wash the machinery;
- −
- list of territorial units treated.
- -
- dose of the product used in the treatment, nitrate content;
- −
- active ingredient(s) type and quantity;
- −
- runoff and drift reduction (e.g., tunnel sprayers, buffers, etc.).
- (6)
- Cellar—Data from the cellar(s) involved in the product vinification and bottling are finally entered:
- −
- total wine production;
- −
- percentage of the product processed in the cellar;
- −
- tap and well water consumption.

| Product | Vineyard | Cellar | |||||
|---|---|---|---|---|---|---|---|
| grapes | wine | surface | grape yield | wine yield | applications | irrigation | wine processed |
| (102 kg) | (102 L) | (ha) | (102 kg/ha) | (L/102 kg) | (no.) | (mm) | (102 L) |
| 67 | 40.2 | 0.67 | 100 | 60 | 12 | 0 | 1874.6 |
| Compartment | Quantity | Unit | Value |
| Terrain | altitude | (m) | 271 |
| slope | (%) | 5.0 | |
| Water body | distance from vineyard | (m) | 1000 |
| width | (m) | 20 | |
| depth | (m) | 3.0 | |
| vineyard side facing water body | (m/ha) | 328.4 | |
| aquifer depth | (m) | 2.5 | |
| Crop | root depth | (m) | 1.5 |
| Soil | sand content | (%) | 45.0 |
| clay content | (%) | 15.0 | |
| organic content | (%) | 1.5 | |
| skeleton | (%) | 0.0 |
| Date | Type | Phenological State (BBCH) | Dose (kg/ha) |
|---|---|---|---|
| 12 March 2012 | Fertilizer | 0–8 | 2.4 |
| 02 April 2012 | Fung/Pest | 11–19 | 25.4 |
| 23 April 2012 | Fung/Pest | 11–19 | 25.0 |
| 14 May 2012 | Fung/Pest | 53–57 | 3.6 |
| 28 May 2012 | Fung/Pest | 60–69 | 3.5 |
| 18 June 2012 | Fung/Pest | 71–79 | 3.0 |
| 02 July 2012 | Fung/Pest | 71–79 | 3.5 |
| 16 July 2012 | Fung/Pest | 71–79 | 2.5 |
| 13 August 2012 | Fung/Pest | >80 | 3.5 |
| 27 August 2012 | Fung/Pest | >80 | 12.0 |
| 10 September 2012 | Fung/Pest | >80 | 1.5 |
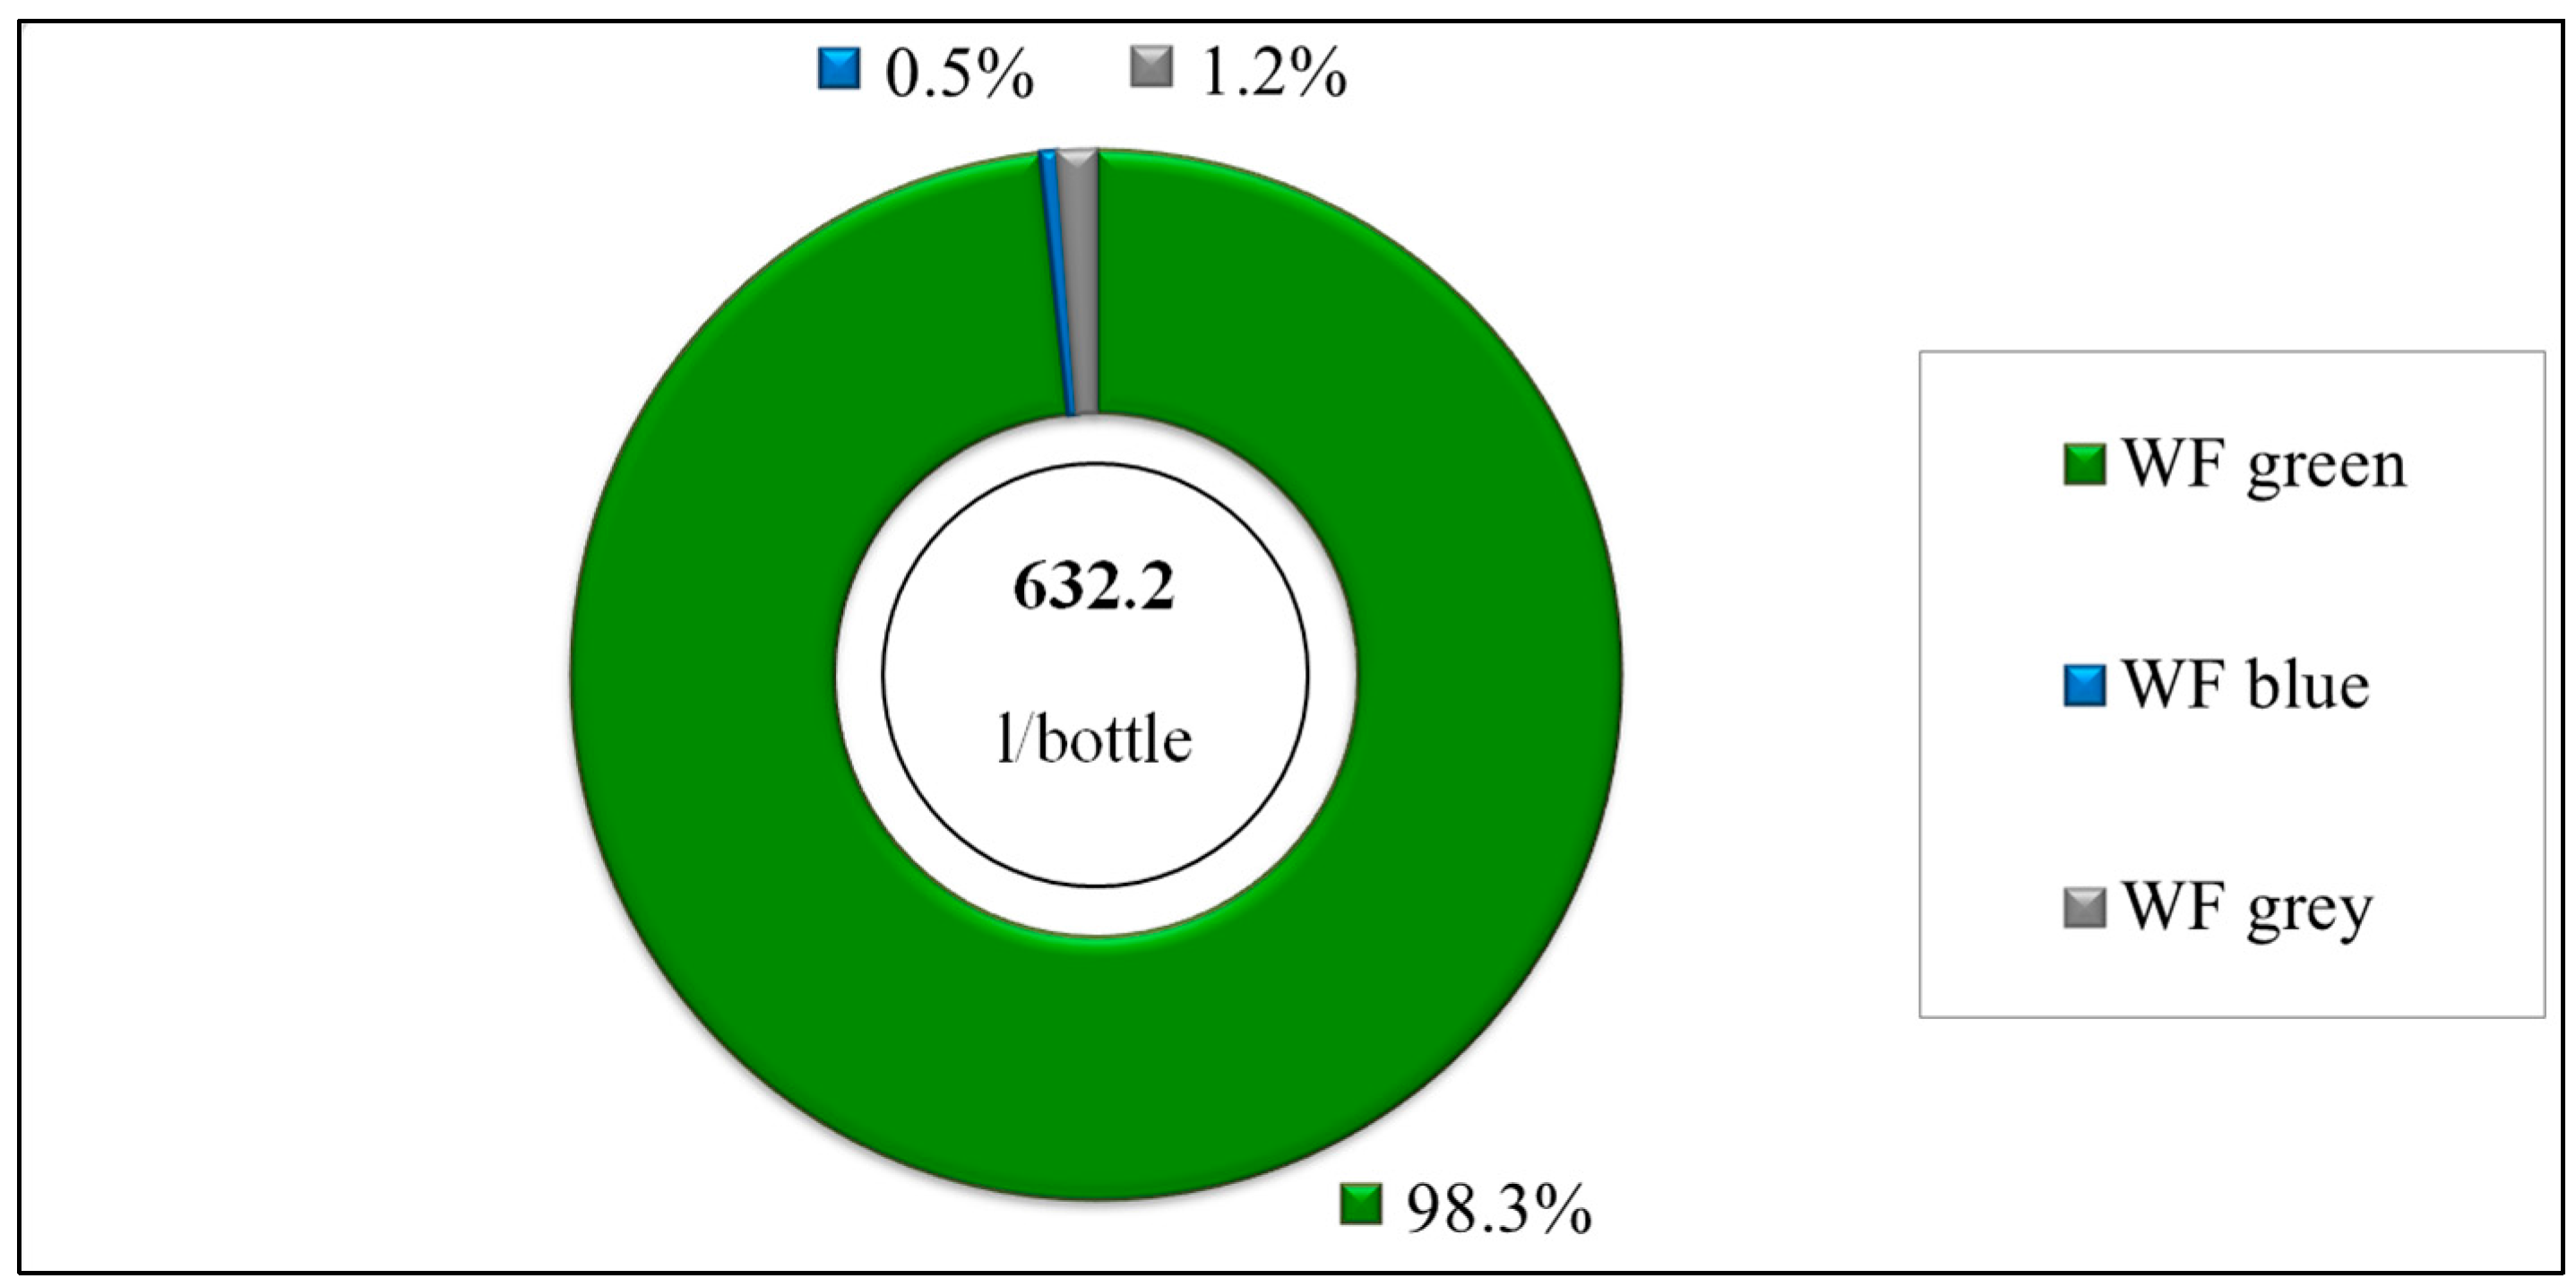
5. Results and Discussion
| L/bottle * | L/glass ** | (%) | |
|---|---|---|---|
| WF green | 621.4 | 178.1 | 98.3 |
| WF blue | 3.425 | 0.982 | 0.5 |
| WF grey | 7.358 | 2.109 | 1.2 |
| WF tot | 632.2 | 181.23 | 100 |


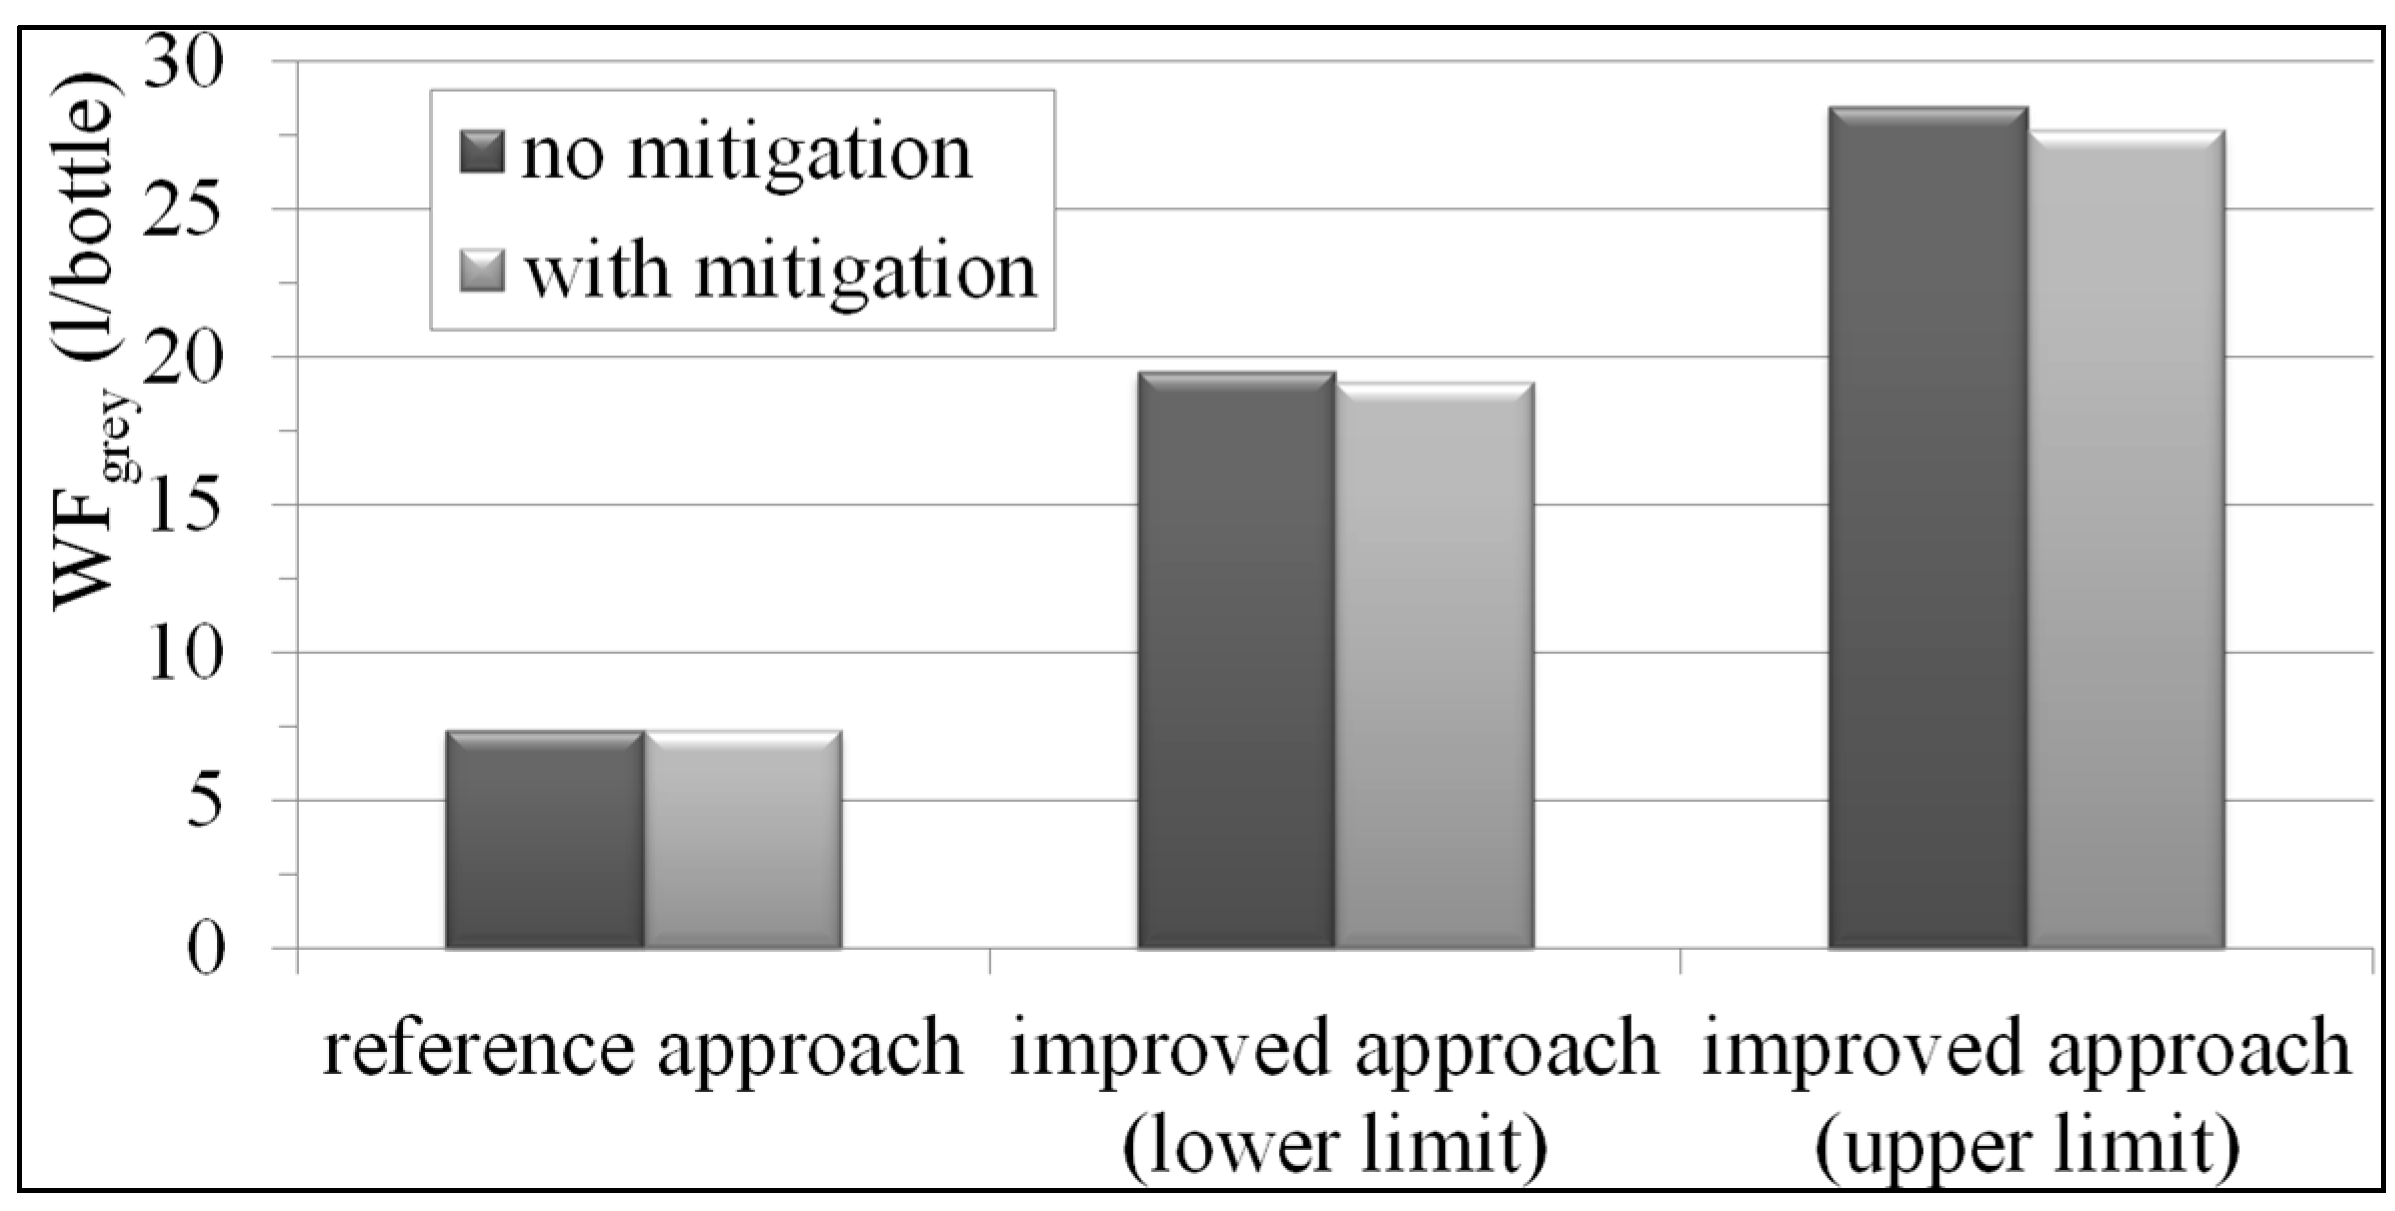
The Grey Water Footprint Component

| Impact | Reference Approach | Improved Approach | ||||||||
|---|---|---|---|---|---|---|---|---|---|---|
| Without Mitigation | With Mitigation | |||||||||
| Lower Limit | Upper Limit | Lower Limit | Upper Limit | |||||||
| WFgrey | 7.36 L/bottle | 1.16% | 19.48 L/bottle | 3.02% | 28.47 L/bottle | 4.36% | 19.15 L/bottle | 2.97% | 27.65 L/bottle | 4.24% |
| WFtot | 632.2 L/bottle | 100% | 644.3 L/bottle | 100% | 653.3 L/bottle | 100% | 644.0 L/bottle | 100% | 652.5 L/bottle | 100% |
6. Conclusions
Acknowledgments
Author Contributions
Conflicts of Interest
References
- The UN World Water Development Report 2015, Water for a Sustainable World. Available online: http://www.unesco.org/new/en/natural-sciences/environment/water/wwap/wwdr/2015-water-for-a-sustainable-world/ (accessed on 18 August 2015).
- United Nations Environment Programme. Vital Water Graphics—An Overview of the State of the World’s Fresh and Marine Waters, 2nd ed.; UNEP: Nairobi, Kenya, 2008. [Google Scholar]
- World Agriculture towards 2030/2050. Available online: http://www.fao.org/docrep/016/ap106e/ap106e.pdf (accessed on 18 August 2015).
- The State of the World’s Land and Water Resources for Food and Agriculture. Available online: http://www.fao.org/nr/solaw/the-book/en/ (accessed on 18 August 2015).
- Asdrubali, F.; Baldinelli, G.; Scrucca, F. Comparative life cycle assessment of an innovative CSP air-cooled system and conventional condensers. Int. J. Life Cycle Assess 2015, 20, 1076–1088. [Google Scholar] [CrossRef]
- Hoekstra, A.Y.; Chapagain, A.K. Water footprints of nations: Water use by people as a function of their consumption pattern. Water Resour. Manag. 2007, 21, 35–48. [Google Scholar] [CrossRef]
- Hoekstra, A.Y.; Chapagain, A.K. Globalization of Water: Sharing the Planet’s Freshwater Resources; Wiley-Blackwell: Oxford, UK, 2008. [Google Scholar]
- Salata, F.; Coppi, M. A first approach study on the desalination of sea water using heat transformers powered by solar ponds. Appl. Energy 2014, 136, 611–618. [Google Scholar] [CrossRef]
- Crop Evapotranspiration—Guidelines for Computing Crop Water Requirements. Available online: https://appgeodb.nancy.inra.fr/biljou/pdf/Allen_FAO1998.pdf (accessed on 18 August 2015).
- Cazcarro, I.; Duarte, R.; Martín-Retortillo, M.; Pinilla, V.; Serrano, A. How sustainable is the increase in the water footprint of the Spanish agricultural sector? A Provincial Analysis between 1955 and 2005–2010. Sustainability 2015, 7, 5094–5119. [Google Scholar] [CrossRef]
- Flores Lopez, L.I.; Bautista-Capetillo, C. Green and blue water footprint accounting for dry beans (Phaseolus vulgaris) in primary region of Mexico. Sustainability 2015, 7, 3001–3016. [Google Scholar]
- Ridoutt, B.G.; Sanguansri, P.; Harper, G.S. Comparing carbon and water footprints for beef cattle production in Southern Australia. Sustainability 2011, 3, 2443–2455. [Google Scholar] [CrossRef]
- Herath, I.; Green, S.; Horne, D.; Singh, R.; McLaren, S.; Clothier, B. Water footprinting of agricultural products: Evaluation of different protocols using a case study of New Zealand wine. J. Clean. Prod. 2013, 44, 159–167. [Google Scholar] [CrossRef]
- Herath, I.; Green, S.; Singh, R.; Horne, D.; van der Zijpp, S.; Clothier, B. Water footprinting of agricultural products: A hydrological assessment for the water footprint of New Zealand’s wines. J. Clean. Prod. 2013, 44, 232–243. [Google Scholar] [CrossRef]
- Quinteiro, P.; Dias, A.C.; Pina, L.; Neto, B.; Ridoutt, B.G.; Arroja, L. Addressing the freshwater use of a Portuguese wine (‘vinho verde’) using different LCA methods. J. Clean. Prod. 2014, 68, 46–55. [Google Scholar] [CrossRef]
- Ene, S.A.; Teodosiu, C.; Robu, B.; Volf, I. Water footprint assessment in the winemaking industry: A case study for a Romanian medium size production plant. J. Clean. Prod. 2013, 43, 122–135. [Google Scholar] [CrossRef]
- Hoekstra, A.Y.; Hung, P.Q. Virtual Water Trade: A Quantification of Virtual Water Flows between Nations in Relation to International Crop Trade; IHE Delft: Delft, The Netherlands, 2002. [Google Scholar]
- Hoekstra, A.Y.; Chapagain, A.K.; Aldaya, M.M.; Mekonnen, M.M. The Water Footprint Assessment Manual: Setting the Global Standard; Earthscan: London, UK, 2011. [Google Scholar]
- Environmental Management—Water Footprint—Principles, Requirements and Guidelines. Available online: http://www.iso.org/iso/catalogue_detail?csnumber=43263 (accessed on 18 August 2015).
- Jeswani, H.K.; Azapagic, A. Water footprint: Methodologies and a case study for assessing the impacts of water use. J. Clean. Prod. 2011, 19, 1288–1299. [Google Scholar] [CrossRef]
- Berger, M.; Finkbeiner, M. Water footprinting: How to address water use in life cycle assessment? Sustainability 2010, 2, 919–944. [Google Scholar] [CrossRef]
- Environmental Management—Life Cycle Assessment—Requirements and Guidelines. Available online: http://www.iso.org/iso/catalogue_detail?csnumber=38498 (accessed on 18 August 2015).
- Meier, M.S.; Stoessel, F.; Jungbluth, N.; Juraske, R.; Schader, C.; Stolze, M. Environmental impacts of organic and conventional agricultural products—Are the differences captured by life cycle assessment? J. Environ. Manag. 2015, 149, 193–208. [Google Scholar] [CrossRef] [PubMed]
- Asdrubali, F.; Baldinelli, G.; D’Alessandro, F.; Scrucca, F. Life cycle assessment of electricity production from renewable energies: Review and results harmonization. Renew. Sustain. Energy Rev. 2015, 42, 1113–1122. [Google Scholar] [CrossRef]
- Asdrubali, F.; Cotana, F.; Rossi, F.; Presciutti, A.; Rotili, A.; Guattari, C. Life cycle assessment of new oxy-fuels from biodiesel-derived glycerol. Energies 2015. [Google Scholar] [CrossRef]
- Bonamente, E.; Merico, M.C.; Rinaldi, S.; Pignatta, G.; Pisello, A.L.; Cotana, F.; Nicolini, A. Environmental impact of industrial prefabricated buildings: Carbon and energy footprint analysis based on an LCA approach. Energy Proced. 2014, 61, 2841–2844. [Google Scholar] [CrossRef]
- Traverso, M.; Asdrubali, F.; Finkbeiner, M.; Francia, A. Towards life cycle sustainability assessment: An implementation to photovoltaic modules. Int. J. Life Cycle Assess 2012, 17, 1068–1079. [Google Scholar] [CrossRef]
- Asdrubali, F.; Presciutti, A.; Scrucca, F. Development of a greenhouse gas accounting GIS-based tool to support local policy making—application to an Italian municipality. Energy Policy 2013, 61, 587–594. [Google Scholar] [CrossRef]
- Massimo, A.; Dell’Isola, M.; Frattolillo, A.; Ficco, G. Development of a Geographical Information System (GIS) for the integration of solar energy in the energy planning of a wide area. Sustainability 2014, 6, 5730–5744. [Google Scholar] [CrossRef]
- Greenhouse Gases—Carbon Footprint of Products—Requirements and Guidelines for Quantification and Communication. Available online: http://www.iso.org/iso/catalogue_detail?csnumber=59521 (accessed on 18 August 2015).
- Rossi, F.; Bonamente, E.; Nicolini, A.; Anderini, E.; Cotana, F. A carbon footprint and energy consumption assessment methodology for UHI-affected lighting systems in built areas. Energy Build. 2015. [Google Scholar] [CrossRef]
- Bonamente, E. Environmental Footprinting Based on LCA Approach: Application to Carbon, Water, Land-use, and Energy Footprint Analyses. Ph.D. Thesis, University of Perugia, Perugia, Italy, February 2015. [Google Scholar]
- Viticoltura sostenibile. Available online: http://www.viva-software.it (accessed on 18 August 2015).
- European Food Safety Authority. Available online: http://www.efsa.europa.eu (accessed on 18 August 2015).
- Council Directive 98/83/EC of 3 November 1998 on the Quality of Water Intended for Human Consumption. Available online: http://www.mattilsynet.no/om_mattilsynet/utkast_til_dwd_annex_iii.11845/binary/Utkast%20til%20DWD_Annex%20III (accessed on 18 August 2015).
- Milà i Canals, L.; Chenoweth, J.; Chapagain, A.; Orr, S.; Antón, A.; Clift, R. Assessing freshwater use impacts in LCA: Part I—Inventory modelling and characterisation factors for the main impact pathways. Int. J. Life Cycle Assess. 2009, 14, 28–42. [Google Scholar] [CrossRef]
- Ridoutt, B.G.; Pfister, S. A revised approach to water footprinting to make transparent the impacts of consumption and production on global freshwater scarcity. Glob. Environ. Change 2010, 20, 113–120. [Google Scholar] [CrossRef]
- Lamastra, L.; Suciu, N.; Novelli, E; Trevisan, M. A new approach to assessing the water footprint of wine: An Italian case study. Sci. Total Environ. 2014, 9, 748–456. [Google Scholar] [CrossRef] [PubMed]
- L’acqua che mangiamo cos è l acqua virtuale e come la consumiamo. Available online: http://docplayer.it/38396-L-acqua-che-mangiamo-cos-e-l-acqua-virtuale-e-come-la-consumiamo.html (accessed on 18 August 2015).
- Ecoinvent Version 3. Available online: http://www.ecoinvent.org/database/ecoinvent-version-3/ecoinvent-version-3.html (accessed on 18 August 2015).
- V.I.V.A. Sustainable Wine. Available online: http://www.minambiente.it/pagina/il-progetto-viva-sustainable-wine (accessed on 18 August 2015).
- Greenhouse Gases—Part 1: Specification with Guidance at the Organization Level for Quantification and Reporting of Greenhouse Gas Emissions and Removals. Available online: http://www.iso.org/iso/catalogue_detail?csnumber=38381 (accessed on 18 August 2015).
- Greenhouse Gases—Part 2: Specification with Guidance at the Project Level for Quantification, Monitoring and Reporting of Greenhouse Gas Emission Reductions or Removal Enhancements. Available online: http://www.iso.org/iso/catalogue_detail?csnumber=38382 (accessed on 18 August 2015).
- Greenhouse Gases—Part 3: Specification with Guidance for the Validation and Verification of Greenhouse Gas Assertions. Available online: http://www.iso.org/iso/catalogue_detail?csnumber=38700 (accessed on 18 August 2015).
- Viticoltura Sostenibile. Available online: http://www.viticolturasostenibile.org (accessed on 18 August 2015).
- Mobile app V.I.V.A. Sustainable Wine. Available online: https://itunes.apple.com/en/app/v.i.v.a./id628066574 (accessed on 18 August 2015).
- Hoekstra, A.Y.; Chapagain, A.K.; Aldaya, M.M.; Mekonnen, M.M. The Water Footprint Assessment Manual: Setting the Global Standard; Earthscan: Washington, DC, USA, 2011. [Google Scholar]
© 2015 by the authors; licensee MDPI, Basel, Switzerland. This article is an open access article distributed under the terms and conditions of the Creative Commons Attribution license (http://creativecommons.org/licenses/by/4.0/).
Share and Cite
Bonamente, E.; Scrucca, F.; Asdrubali, F.; Cotana, F.; Presciutti, A. The Water Footprint of the Wine Industry: Implementation of an Assessment Methodology and Application to a Case Study. Sustainability 2015, 7, 12190-12208. https://doi.org/10.3390/su70912190
Bonamente E, Scrucca F, Asdrubali F, Cotana F, Presciutti A. The Water Footprint of the Wine Industry: Implementation of an Assessment Methodology and Application to a Case Study. Sustainability. 2015; 7(9):12190-12208. https://doi.org/10.3390/su70912190
Chicago/Turabian StyleBonamente, Emanuele, Flavio Scrucca, Francesco Asdrubali, Franco Cotana, and Andrea Presciutti. 2015. "The Water Footprint of the Wine Industry: Implementation of an Assessment Methodology and Application to a Case Study" Sustainability 7, no. 9: 12190-12208. https://doi.org/10.3390/su70912190
APA StyleBonamente, E., Scrucca, F., Asdrubali, F., Cotana, F., & Presciutti, A. (2015). The Water Footprint of the Wine Industry: Implementation of an Assessment Methodology and Application to a Case Study. Sustainability, 7(9), 12190-12208. https://doi.org/10.3390/su70912190