Article

Reforming China’s Pension Scheme for Urban Workers: Liquidity Gap and Policies’ Effects Forecasting

1
Department of Finance, School of Economics and Management, Southeast University, Nanjing 210008, China
2
Carey School of Business, Johns Hopkins University, Baltimore, MD 21202, USA
*
Author to whom correspondence should be addressed.
Sustainability 2015, 7(8), 10876-10894; https://doi.org/10.3390/su70810876
Submission received: 4 May 2015 / Revised: 30 July 2015 / Accepted: 3 August 2015 / Published: 11 August 2015

Abstract

:
This study forecasts the liquidity gap in China’s pension scheme for urban workers in the context of an ageing population and the possible effects of recent governmental policies by constructing a basic pension model, including “old people”, “middle people” and “new people” and a simulation method. We find, firstly, that China’s liquidity gap of pension will reach its peak of approximately 13.11 trillion yuan in 2038. Subsequently, this gap will gradually decrease with growth in the mortality rate. Secondly, reasonable intervals for the replacement and contribution rates should be set at [0.417, 0.604] and [0.189, 0.262], respectively, to sustain China’s pension system. Thirdly, compared to increasing fiscal subsidies, an income doubling plan, raising the contribution rate, lowering the replacement rate and delaying the retirement age can significantly reduce the liquidity gap, although the policy costs are relatively high. A policy permitting families to have two children will increase the rate of reduction of the liquidity gap, but it cannot effectively narrow the gap at the peak moment.

1. Introduction

The ageing population and transformations to the economic structure are considered the two major issues that China is currently facing. However, the social security problems resulting from these issues have created significant concern from individuals and their families. Since the reform and opening of China’s economy, China’s economic growth has benefitted from a sufficient labor force, high savings and investments brought by the “demographic dividend”, i.e., the high labor population ratio. However, a series of problems have gradually emerged with an ageing population, such as an increase in the elderly population, a reduction in the young workforce, and more severe social burdens, which have been reflected intensively in the shortage of liquidity in basic pension.
During past two decades, there has been a drastic change in China’s basic pension system, which consisted of “old people”, “middle people” and “new people” [1] upon whom different pension systems have been adopted with different annuities. In 1997, China has established the basic pension system for urban employees, “An Integrated Account”, the combination of social pooling accounts and individual accounts. The social pooling accounts are generally approximately 20 percent of the total wages, mandating contributions by employers executing “PAYG (pay-as-you-go)”, whereas individual accounts are approximately 8 percent of wages paid by workers, according to the “Cumulative System”. The accounts can only be used for employees’ pensions and are not allowed for pay-in-advance. However, before the 1997 reform, workers hardly needed to pay any insurance premium for pension, viz. there was no individual account. Meanwhile, government should pay pensions to the retired, which results in an imbalance in the pension account in the form of an “overlapping of generations”. Combined with an ageing population, when the social pooling account does not have sufficient funds to pay for a pension, most local governments have to use individual account funds of “new people” to pay the current annuities which directly caused the “empty account”.
It should be noted that the operation and sustainability of a basic pension system reflect the allocation and fairness of one nation’s social welfare. During the past decade, there have been plenty of studies on work-based pensions debt over different income economies, in terms of the liquidity gap [2,3,4], replacement and contribution rates [5,6,7] and the effects of different national policies [8,9,10,11,12]. However, most of preliminary studies have not revealed the actual optimal solution for the liquidity gap and the effect of recent issued policies in China, including delaying the retirement age and a two-child policy. This study attempts to fill this gap by building a basic pension model and conducting empirical research with a simulation method.
This study purposes a discussion of the liquidity gap of pension scheme for urban workers in China and evaluates the possible effects of several recent policies issued by China’s national government. The remainder of this paper is organized as follows. The subsequent section builds a basic pension model and forecasts its liquidity gap. Section 3 discusses the determination of a reasonable interval for the replacement rate and contribution rate of the basic pension system. Section 4 evaluates the effects of various recent national policies on the liquidity gap in China, including delaying the retirement age and two-child policy. The final section presents the paper’s conclusions.

2. A Basic Pension Model and Its Liquidity Gap Forecasting

Given that China’s pension system is very likely to undergo great changes in the future and the population structure and policy may also experience significant changes [13], in this section, we construct a pension model and makes predictions about the liquidity gap.

2.1. The Revenue of Basic Pension System

China currently uses “An Integrated Account” for the pension scheme for urban employees. Pension accounts are composed of a social pooling account and an individual account. In addition, the government provides a certain amount of financial subsidies every year. Thus,
Pension   income = Social   pooling   account + Individual   account + Financial   subsidies
Thus, total pension income R t at time t is as follows:
R t  = (θ 1 W t  + θ 2 W t )N t  + G t
θ 1 refers to the contribution rate of the social pooling account, θ 2 refers to the contribution rate of the individual account, W t refers to the average wage of workers at time t , N t is the number of insured workers at time t , and G t represents government subsidies at time t . We denote the contribution rate refers to the ratio of pension premium to workers’ pre-retirement wage income. It can be regarded as an “inflow” indicator of pension liquidity.
Contribution rate =  Pension premium Pre-retirment wage income
Among them, individual accounts implement the “personal savings” system and are the part that cannot be misappropriated; social pooling accounts for the implementation “PAYG system”, so at time t , the pension income available for expenditures R t ' is as follows:
R t '  = θ 1 W t N t  + G t

2.1.1. The Expenditure of Basic Pension System

Since China implemented pension reform in 1997, the pension policy has changed, distinguishing between “old people”, “middle people” and “new people”, who are suitable for different pension policies. The expenditures of all three categories of “people” are formulated in lump-sum amount.
Pension expenditure = The   expenditure   of old   people + The   expenditure   of middle   people     + The   expenditure   of new   people

2.1.2. The Expenditure of “Old People”

Because the “old people” did not contribute to their pension fund before, there is no individual account. Their entire pension comes from the current social pooling pension accounts. Therefore, the “old people” part of the costs E t o l d is as follows:
E t old  = α 1 W t M t old
α 1 is the “old people” replacement rate, and M t o l d is the number of “old people” retired and insured at time t . We denote that the replacement rate refers to the ratio of the level of pensions when workers are retired to that of their pre-retirement salary income, measuring the level of subsistence of retired workers. The replacement rate can be regarded as an “outflow” indicator of pension liquidity.
Replacement rate =  Pensions obtained after retirement Pre-retirement wage income

2.1.3. The Expenditure of “Middle People”

The “middle people” were paid the distributed basic pension, individual pension account and transitional pension. In China’s current pension system, the pension from individual account is paid at once at the time of retirement. Thus, the pension from individual account is counted as the accumulated amount. In addition, the transitional pension is the same for all the “middle people” no matter how many years they have worked and it adjusts to the price level in each area, here using 1.4 percent of the simplified total contributions of the payment of wages in 1997. Therefore, the “middle people” part of the costs E t m i d is as follows:
E t mid  = α 2 W t M t mid  +  i=1997 t θ 2 W i (1 + r) t-i M t mid + vW 1997 M t mid
α 2 is the “middle people” society pooling replacement rate, M t m i d is the number of insured in the “middle people” at time t , and r is bank deposit rates. The formula α 2 W t M t m i d refers to the distributed basic pension paid by “middle people” retired at time t . The formula i = 1997 t θ 2 W i ( 1 + r ) t i M t m i d represents the present value of the payment amount in the individual account paid by “middle people” retired at time t . The longer an individual lives, the higher the wages and the more payment from the individual pension accounts, the more the payment of pension in the individual accounts. The formula ϖ W 1997 M t m i d is the transitional pension paid by “middle people”.

2.1.4. The Expenditure of “New People”

The “new people” are issued basic pension and individual pension account. In China’s current pension system, the individual pension account of “new people” is paid monthly not in a lump-sum payment, which is different from that of “middle people”. Thus, the accumulated amount of individual pension account of “new people” should be divided by m . Besides, the individual pension account is calculated according to the total amount of individual savings accounts divided by the expected time of issuance. Therefore, the “new people” part of the costs E t n e w is as follows:
E t new  = α 3 W t M t new  +  j=1997 t<2012 θ 2 W j (1 + r) t-j M j new / i=2012 t W i (1 + r) 14 (1 + e) t-i M i new / m
α 3 is the “new people” social pooling replacement rate, M t n e w is the number of retired insured “new people” at time t , T 2 is the retirement time of “new people”, and e is investment returns. The formula α 3 W t M t n e w refers to the distributed basic pension paid by “new people” retired at time t . Because the country relaxed restrictions on the pension market in 2012, the individual account pension received by “new people” retired before 2012 is j = 1997 t < 2012 θ 2 W j ( 1 + r ) t j M j n e w / m ; however, the “new people” individual accounts of those who retired after 2012 can invest in higher-yielding financial products to obtain benefits and increase the value; the pension received is i = 2012 t W i ( 1 + r ) 14 ( 1 + e ) t i M i n e w / m , where m represents the present value of the payment in an individual account after the investment divided by the number of expected years issuing pensions. Similarly, the more that is paid, the longer amount of time spent working, or the higher the investment income, the more the individual account pension payment.
Thus, at time t , the total pension expenditure E t ' is as follows:
E t  = E t old  + E t mid  + E t new

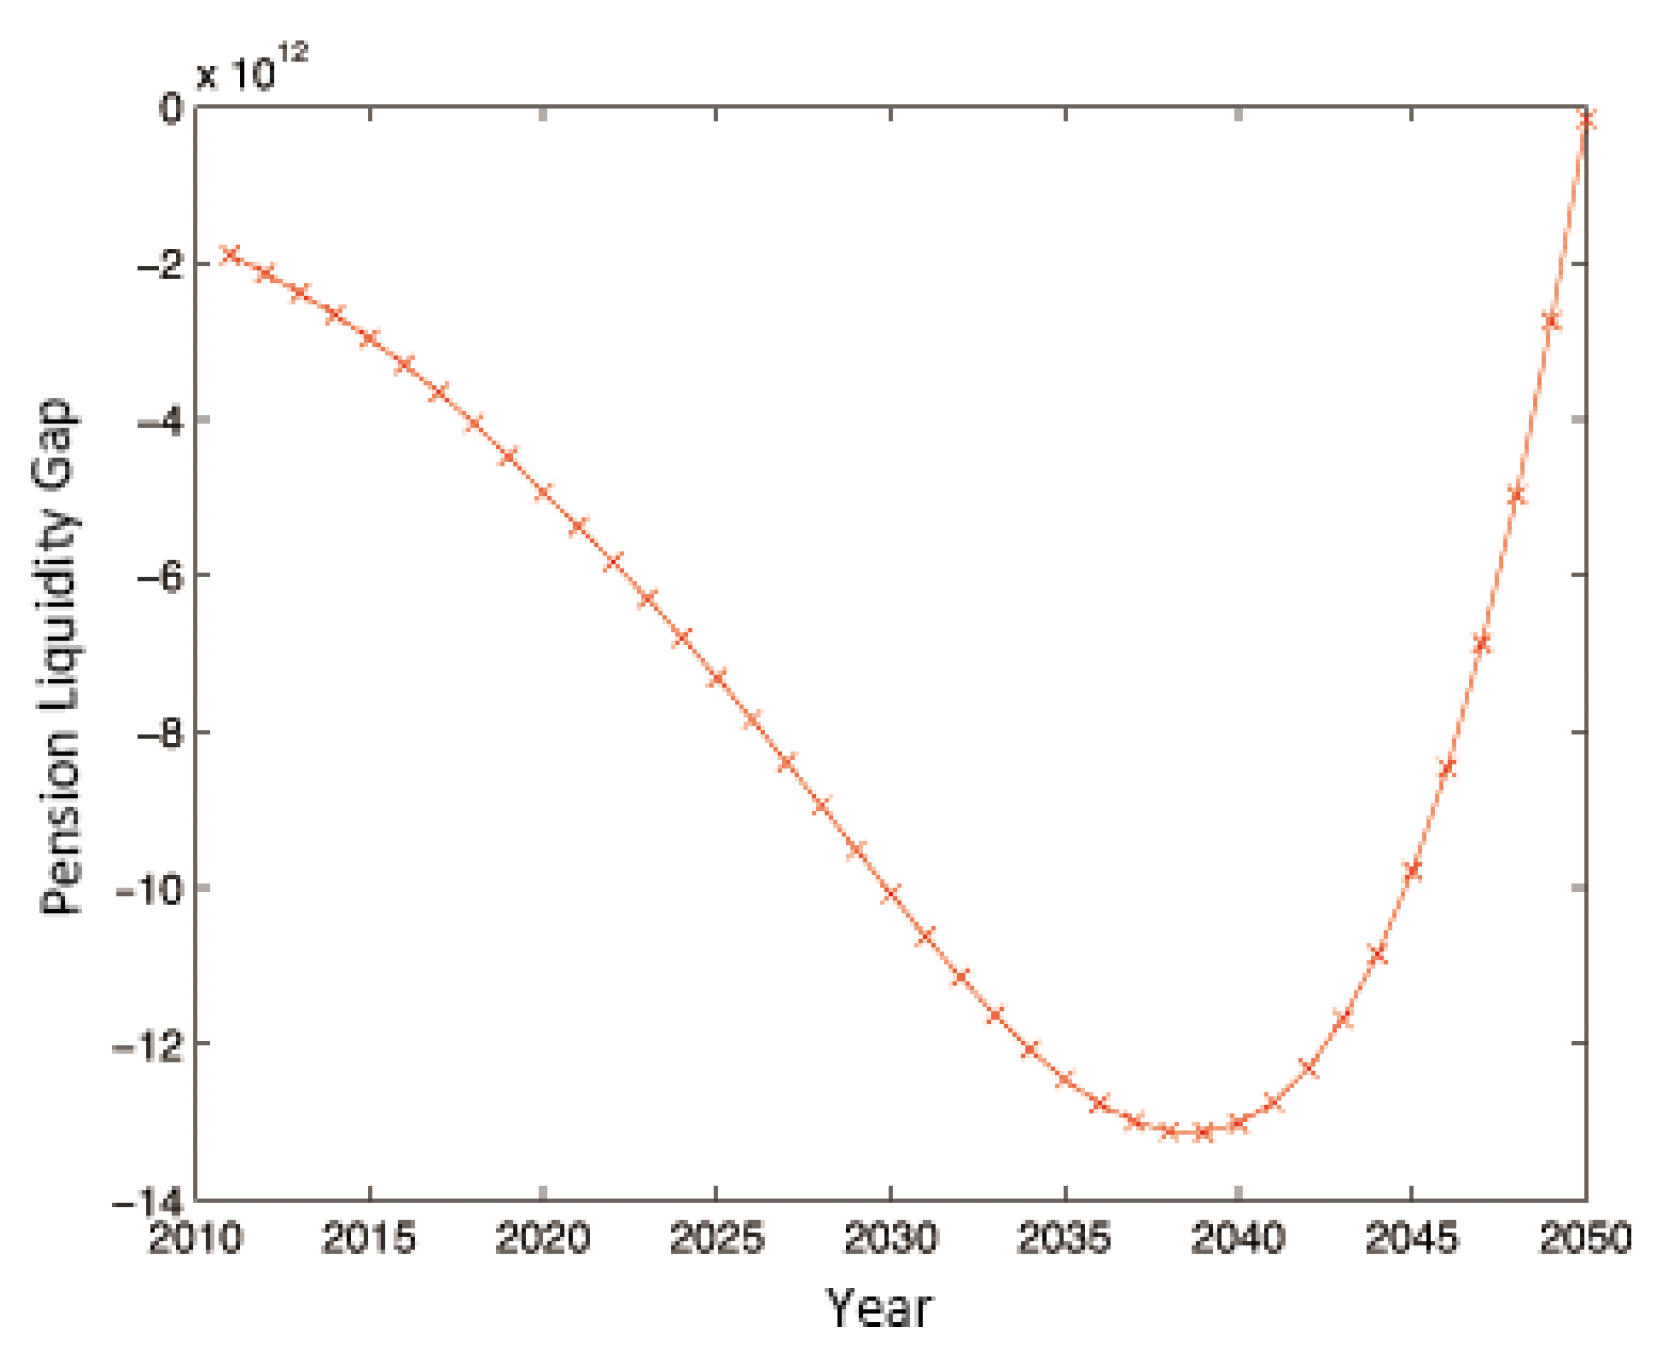
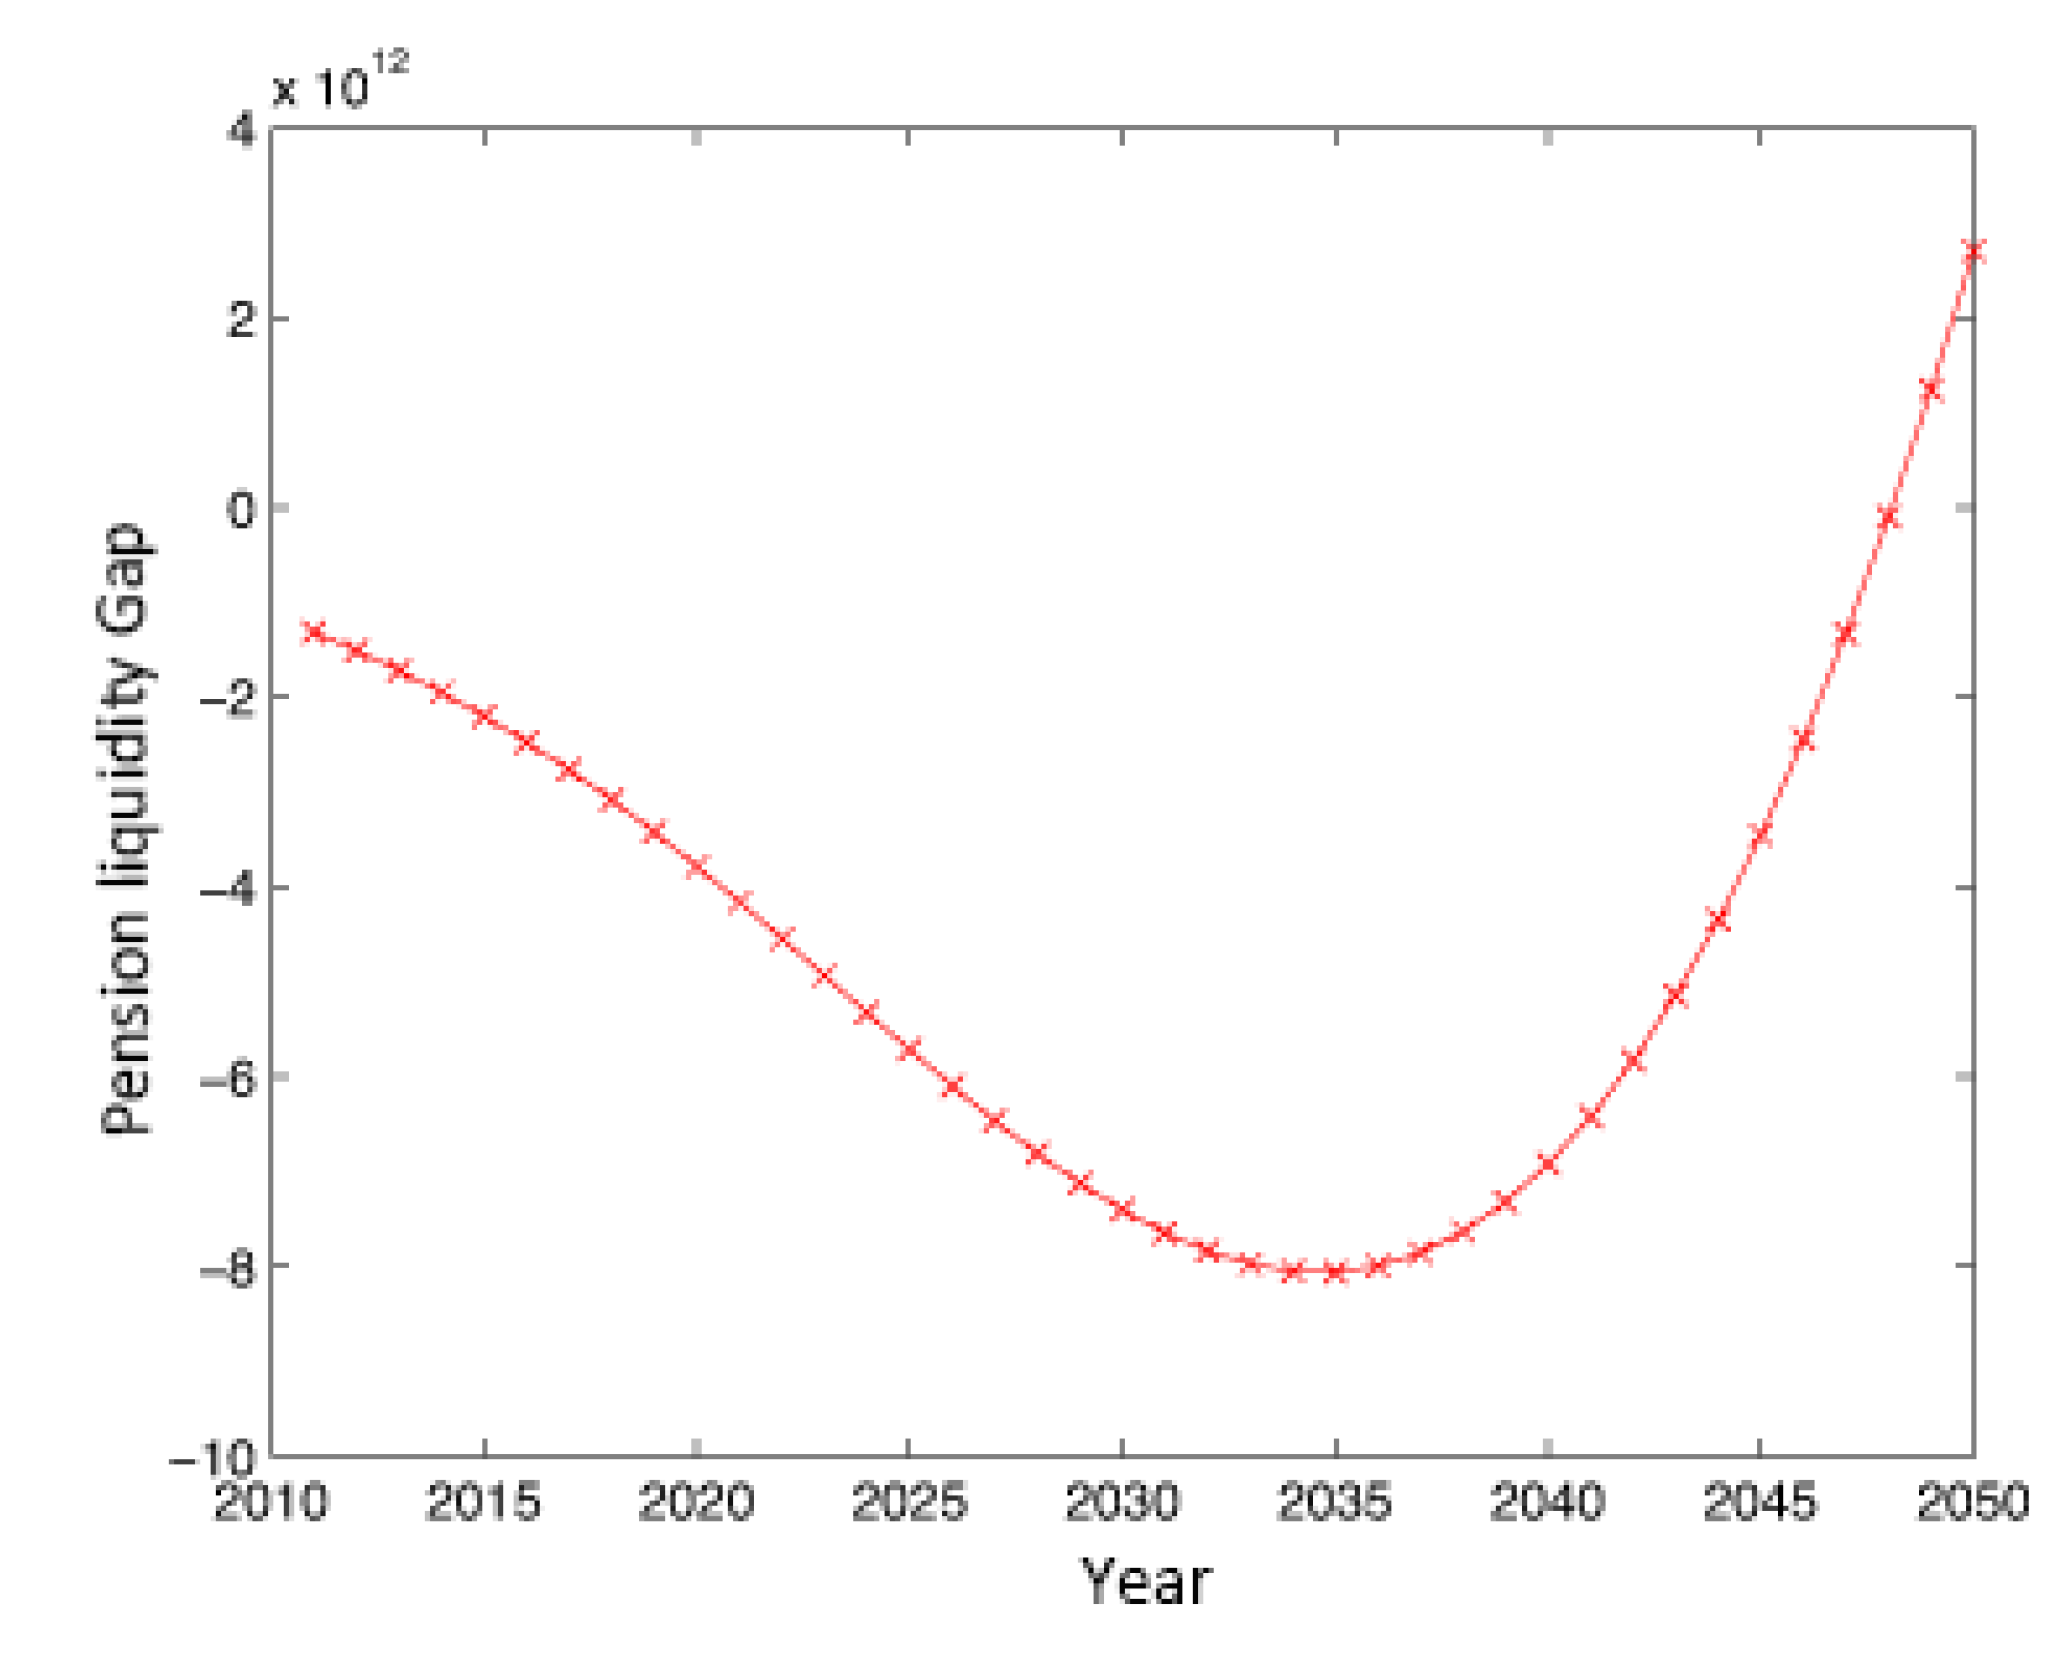
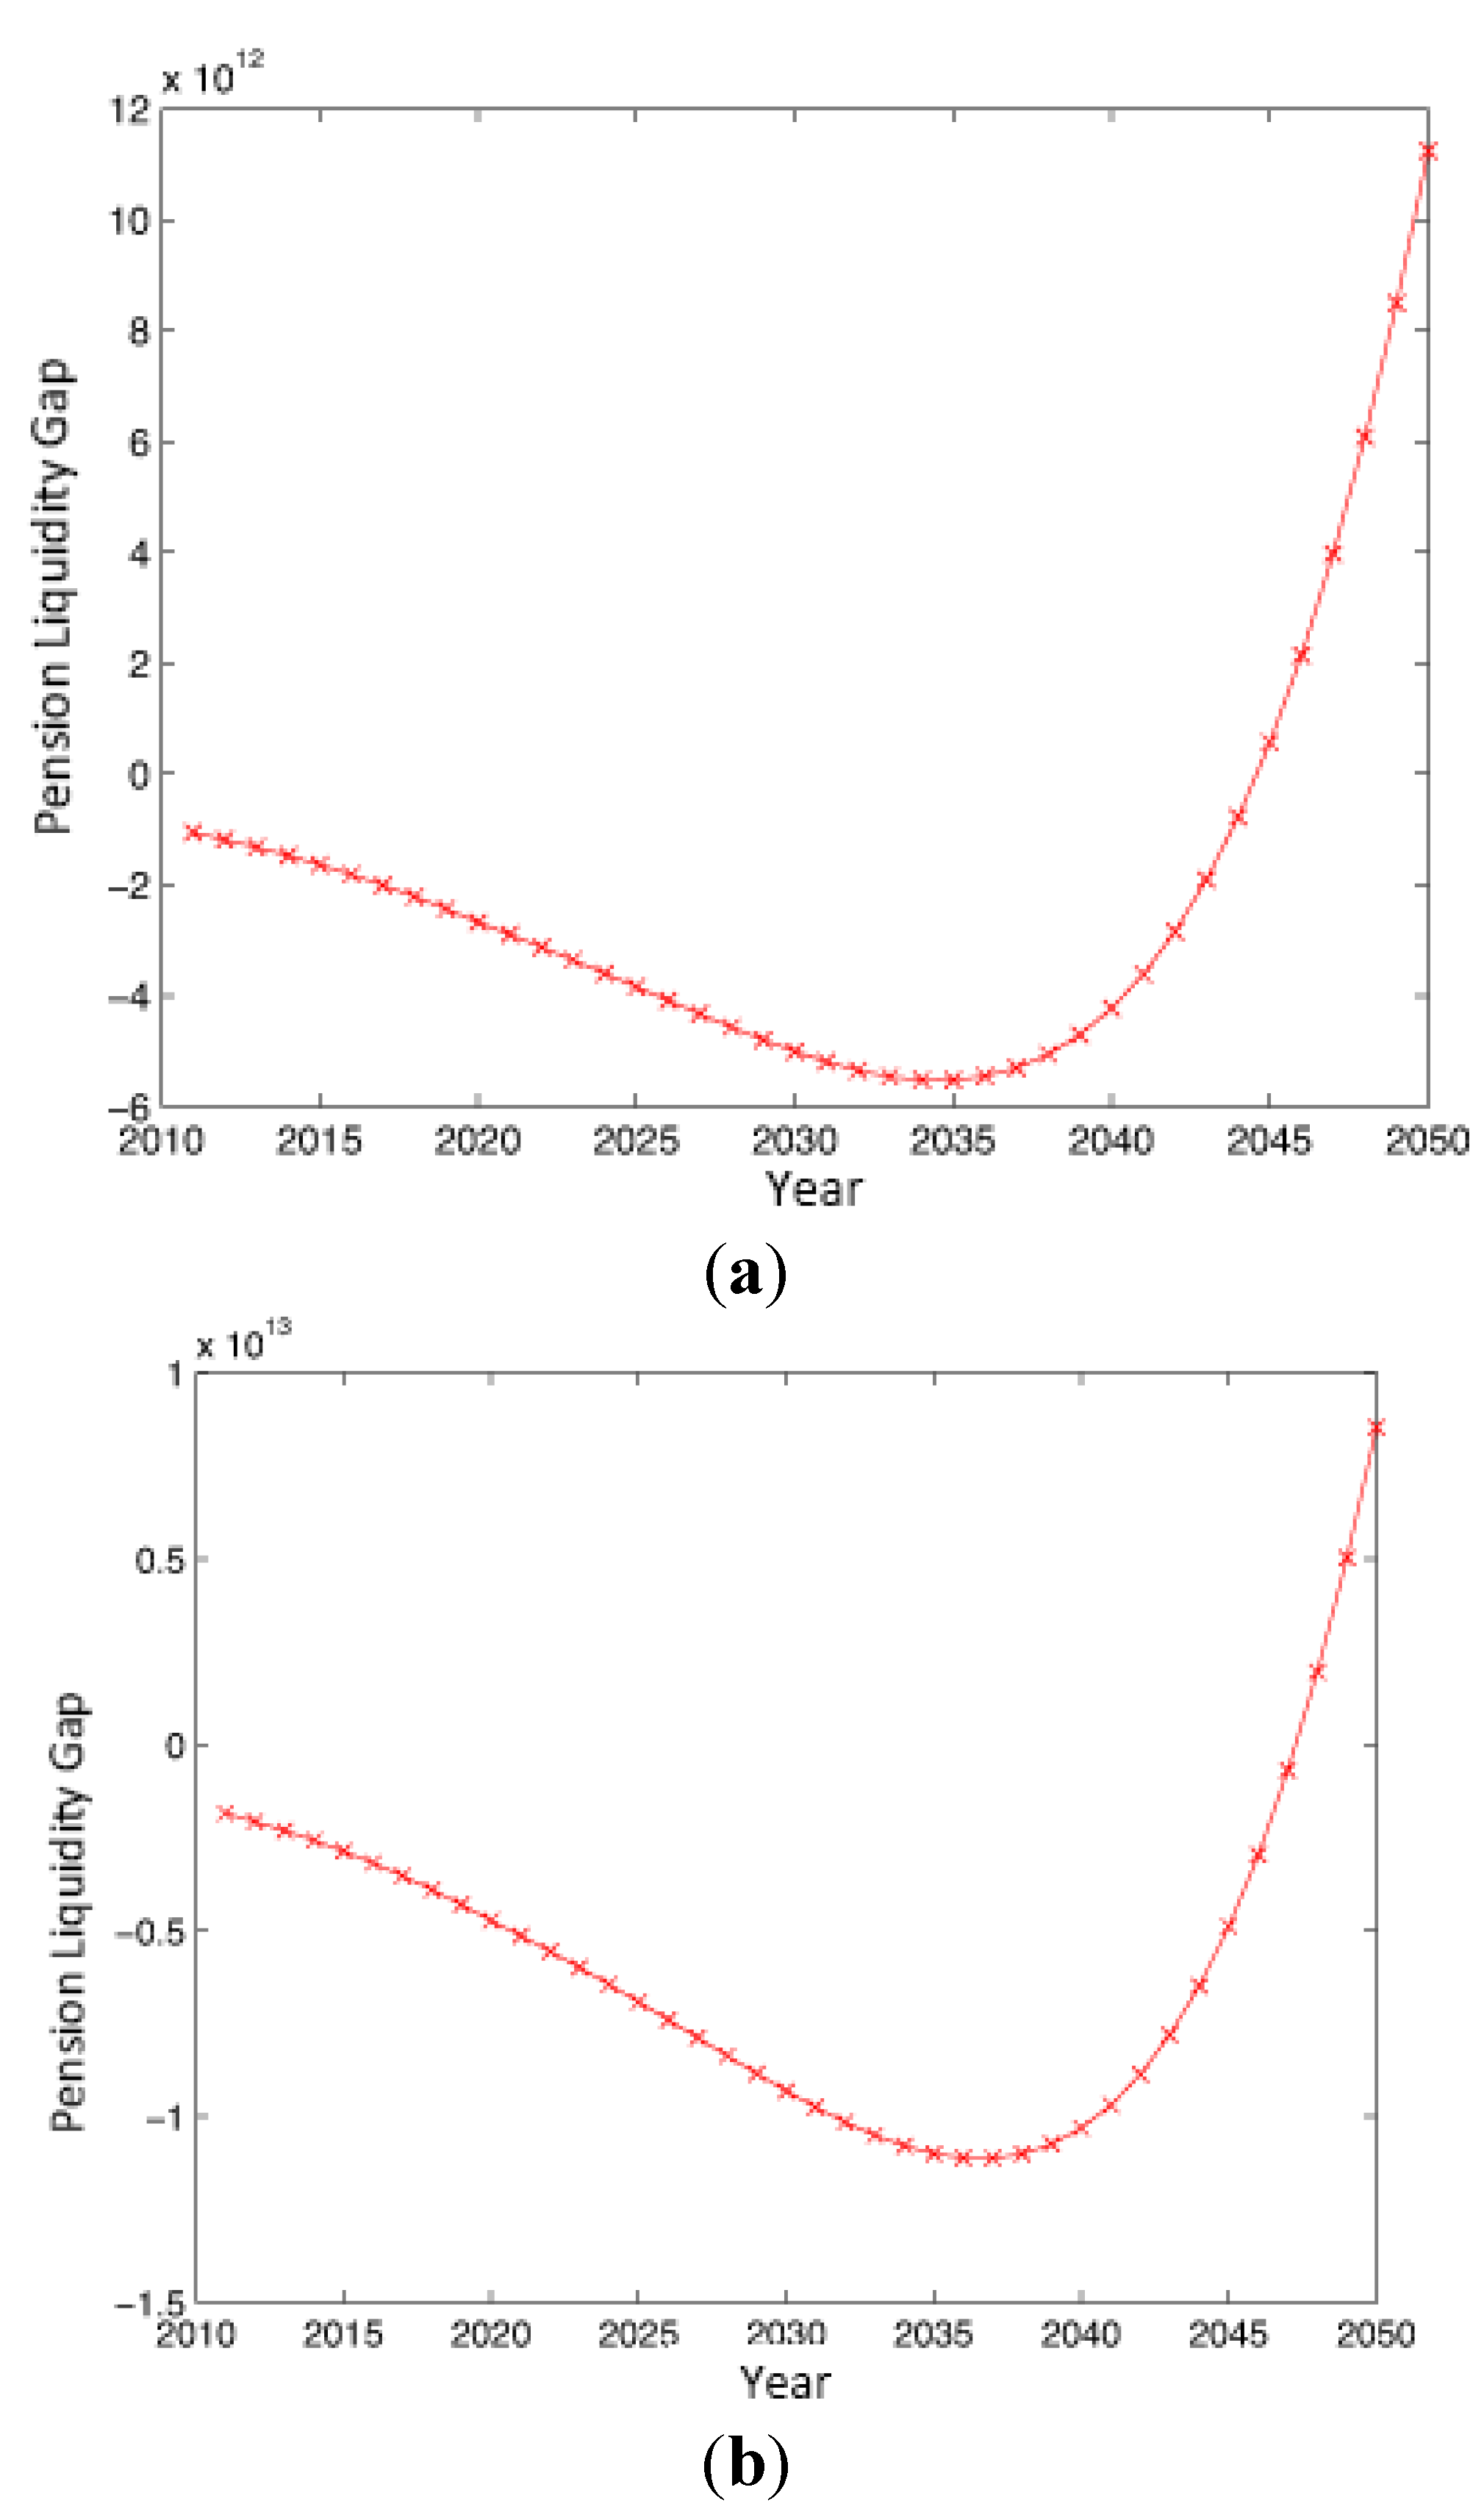
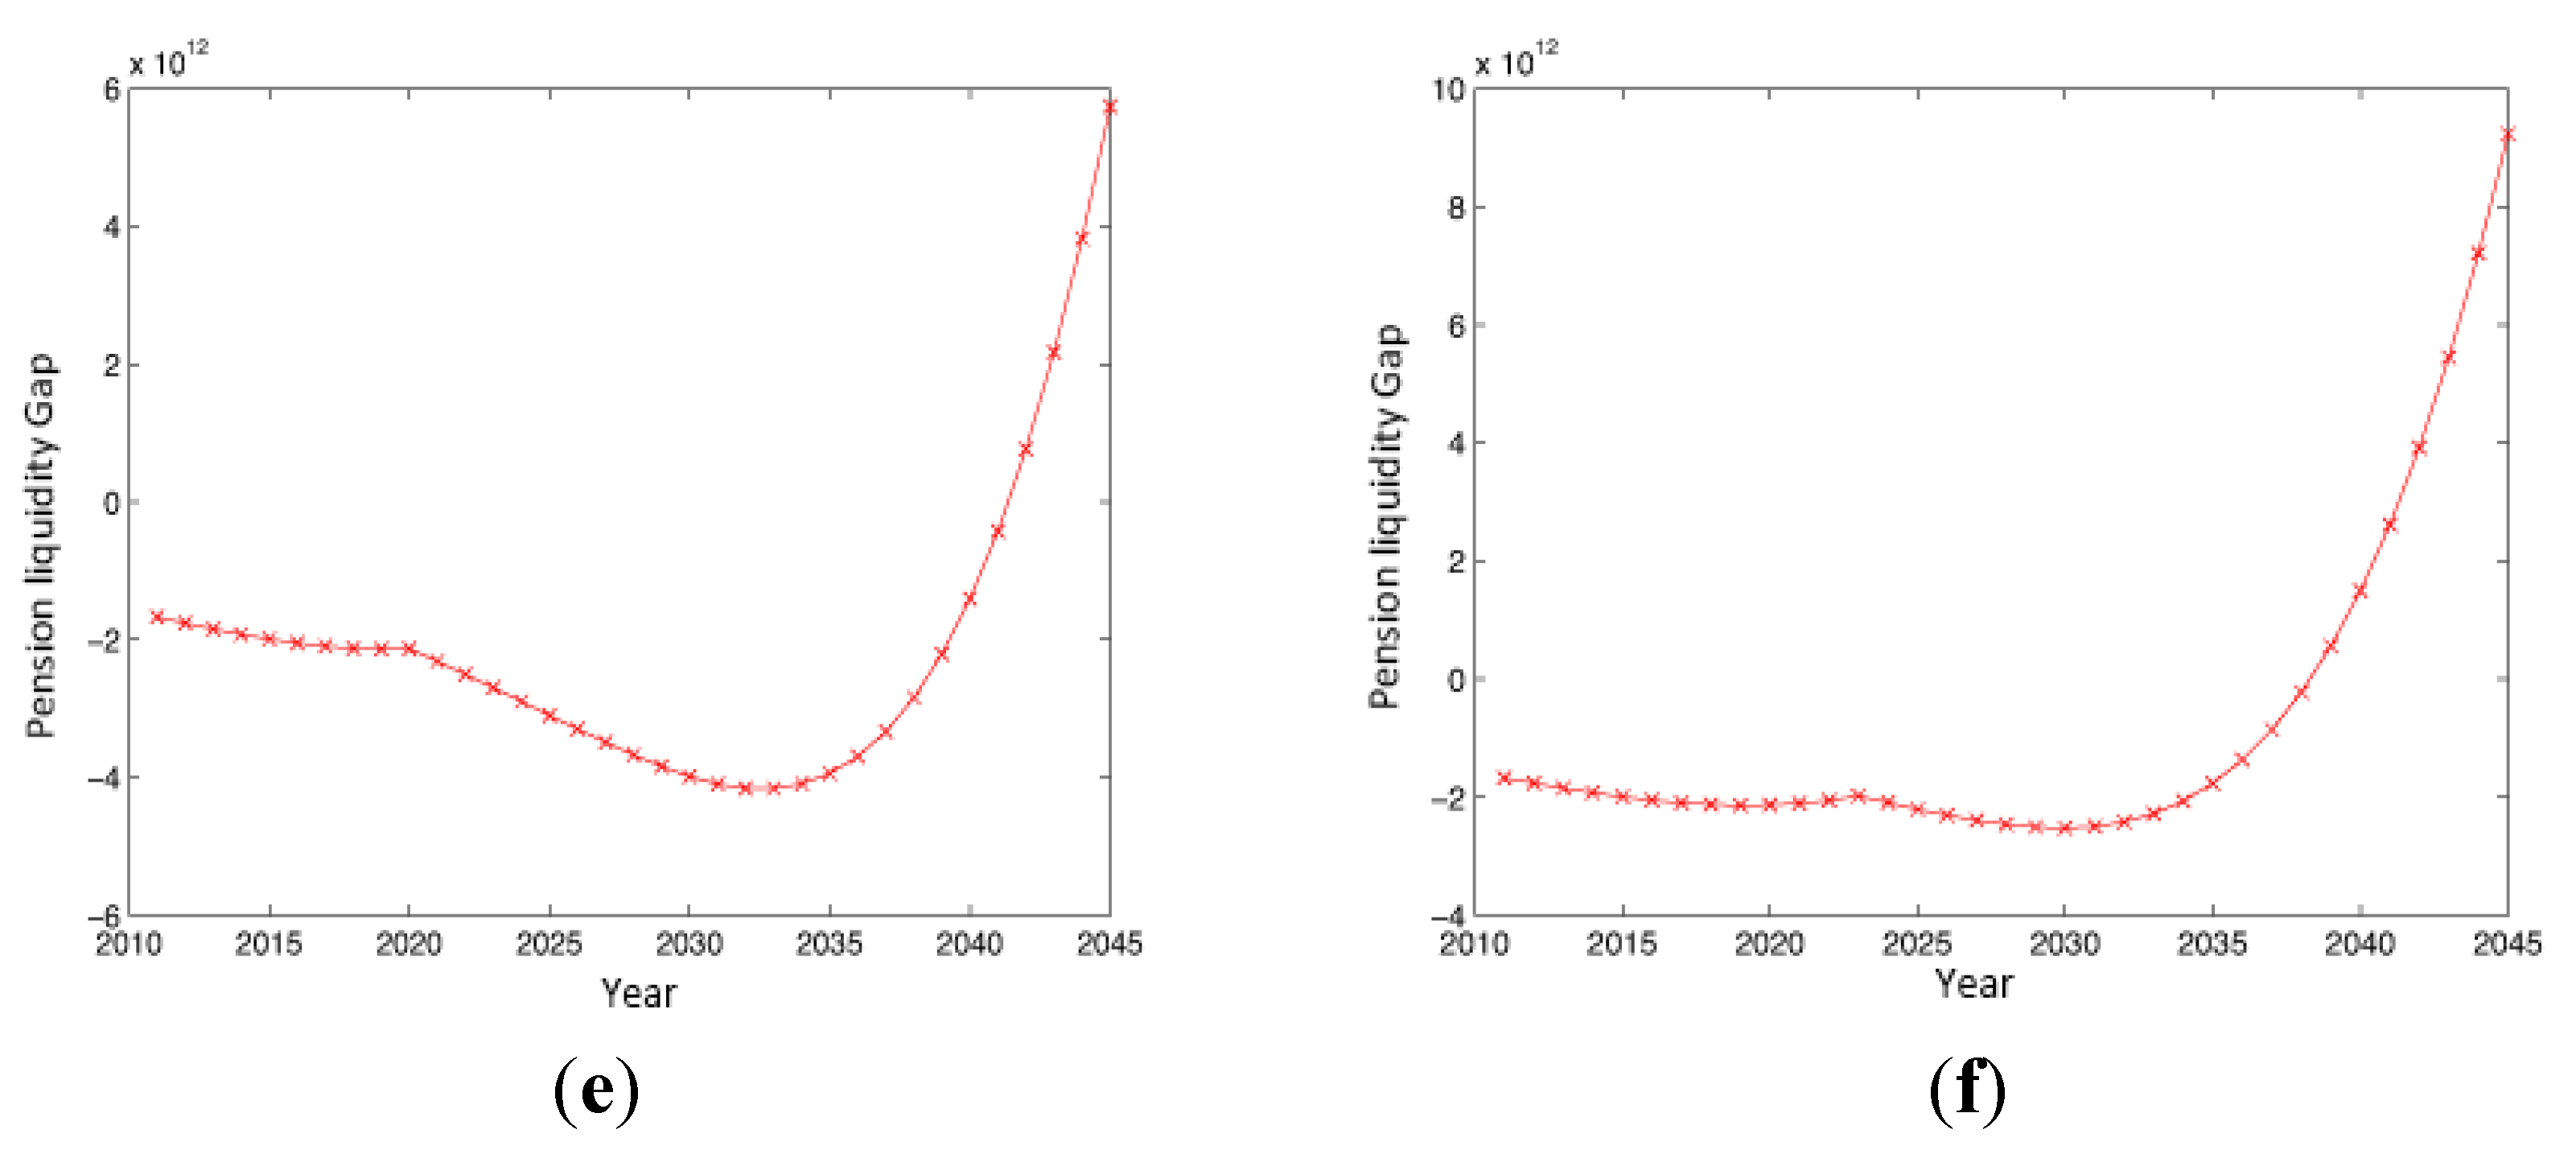
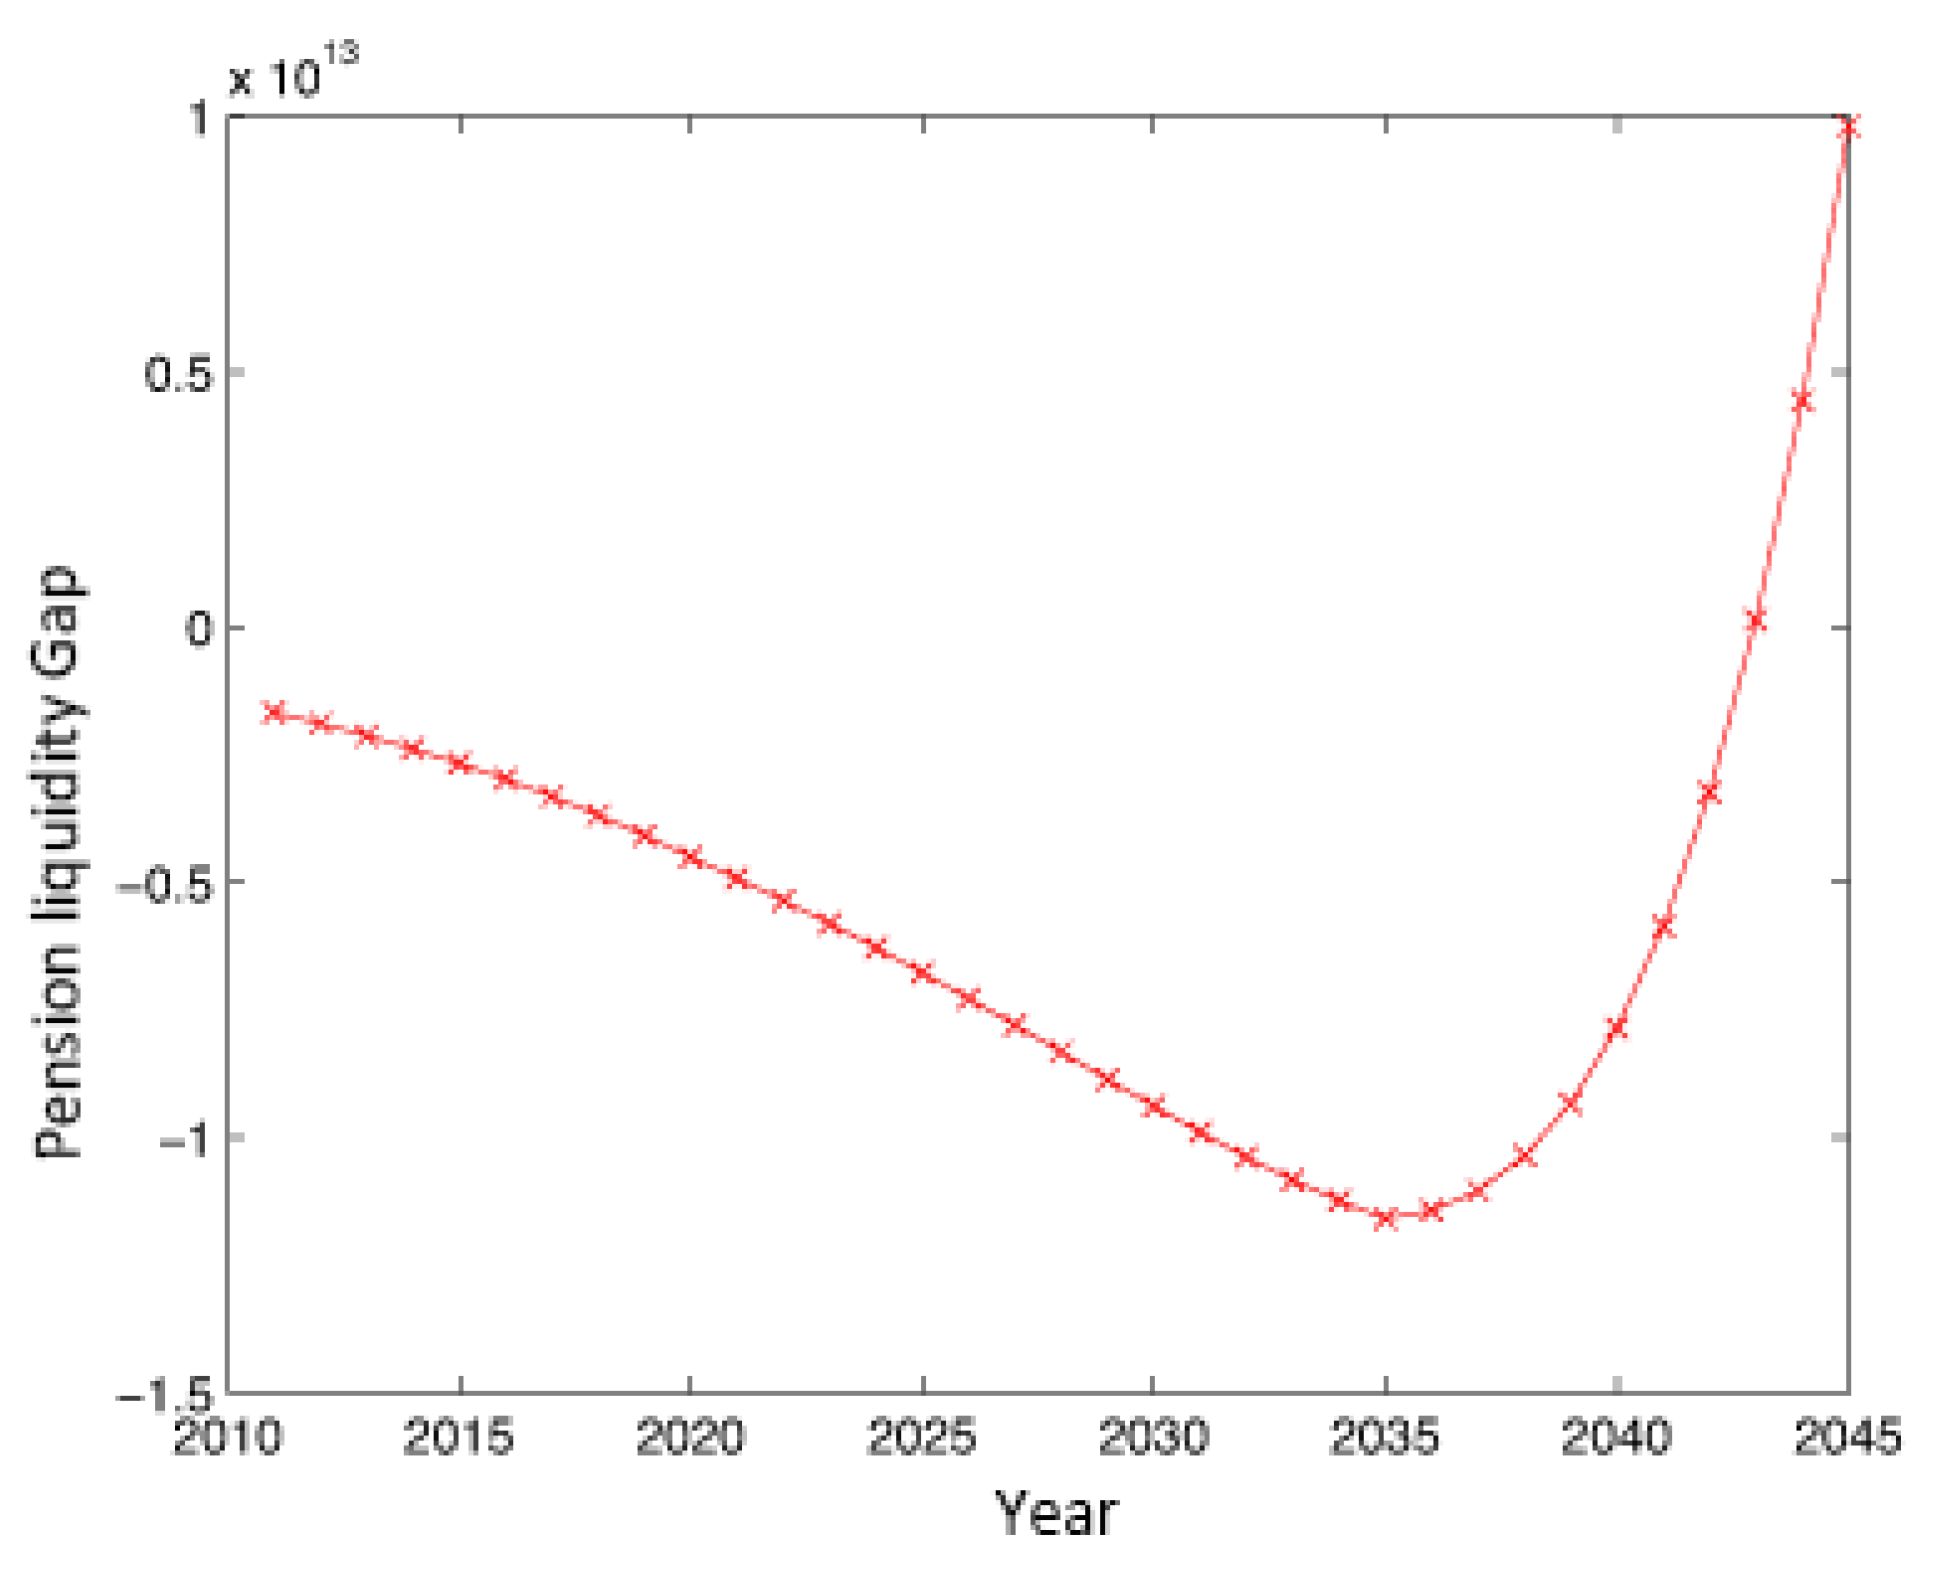
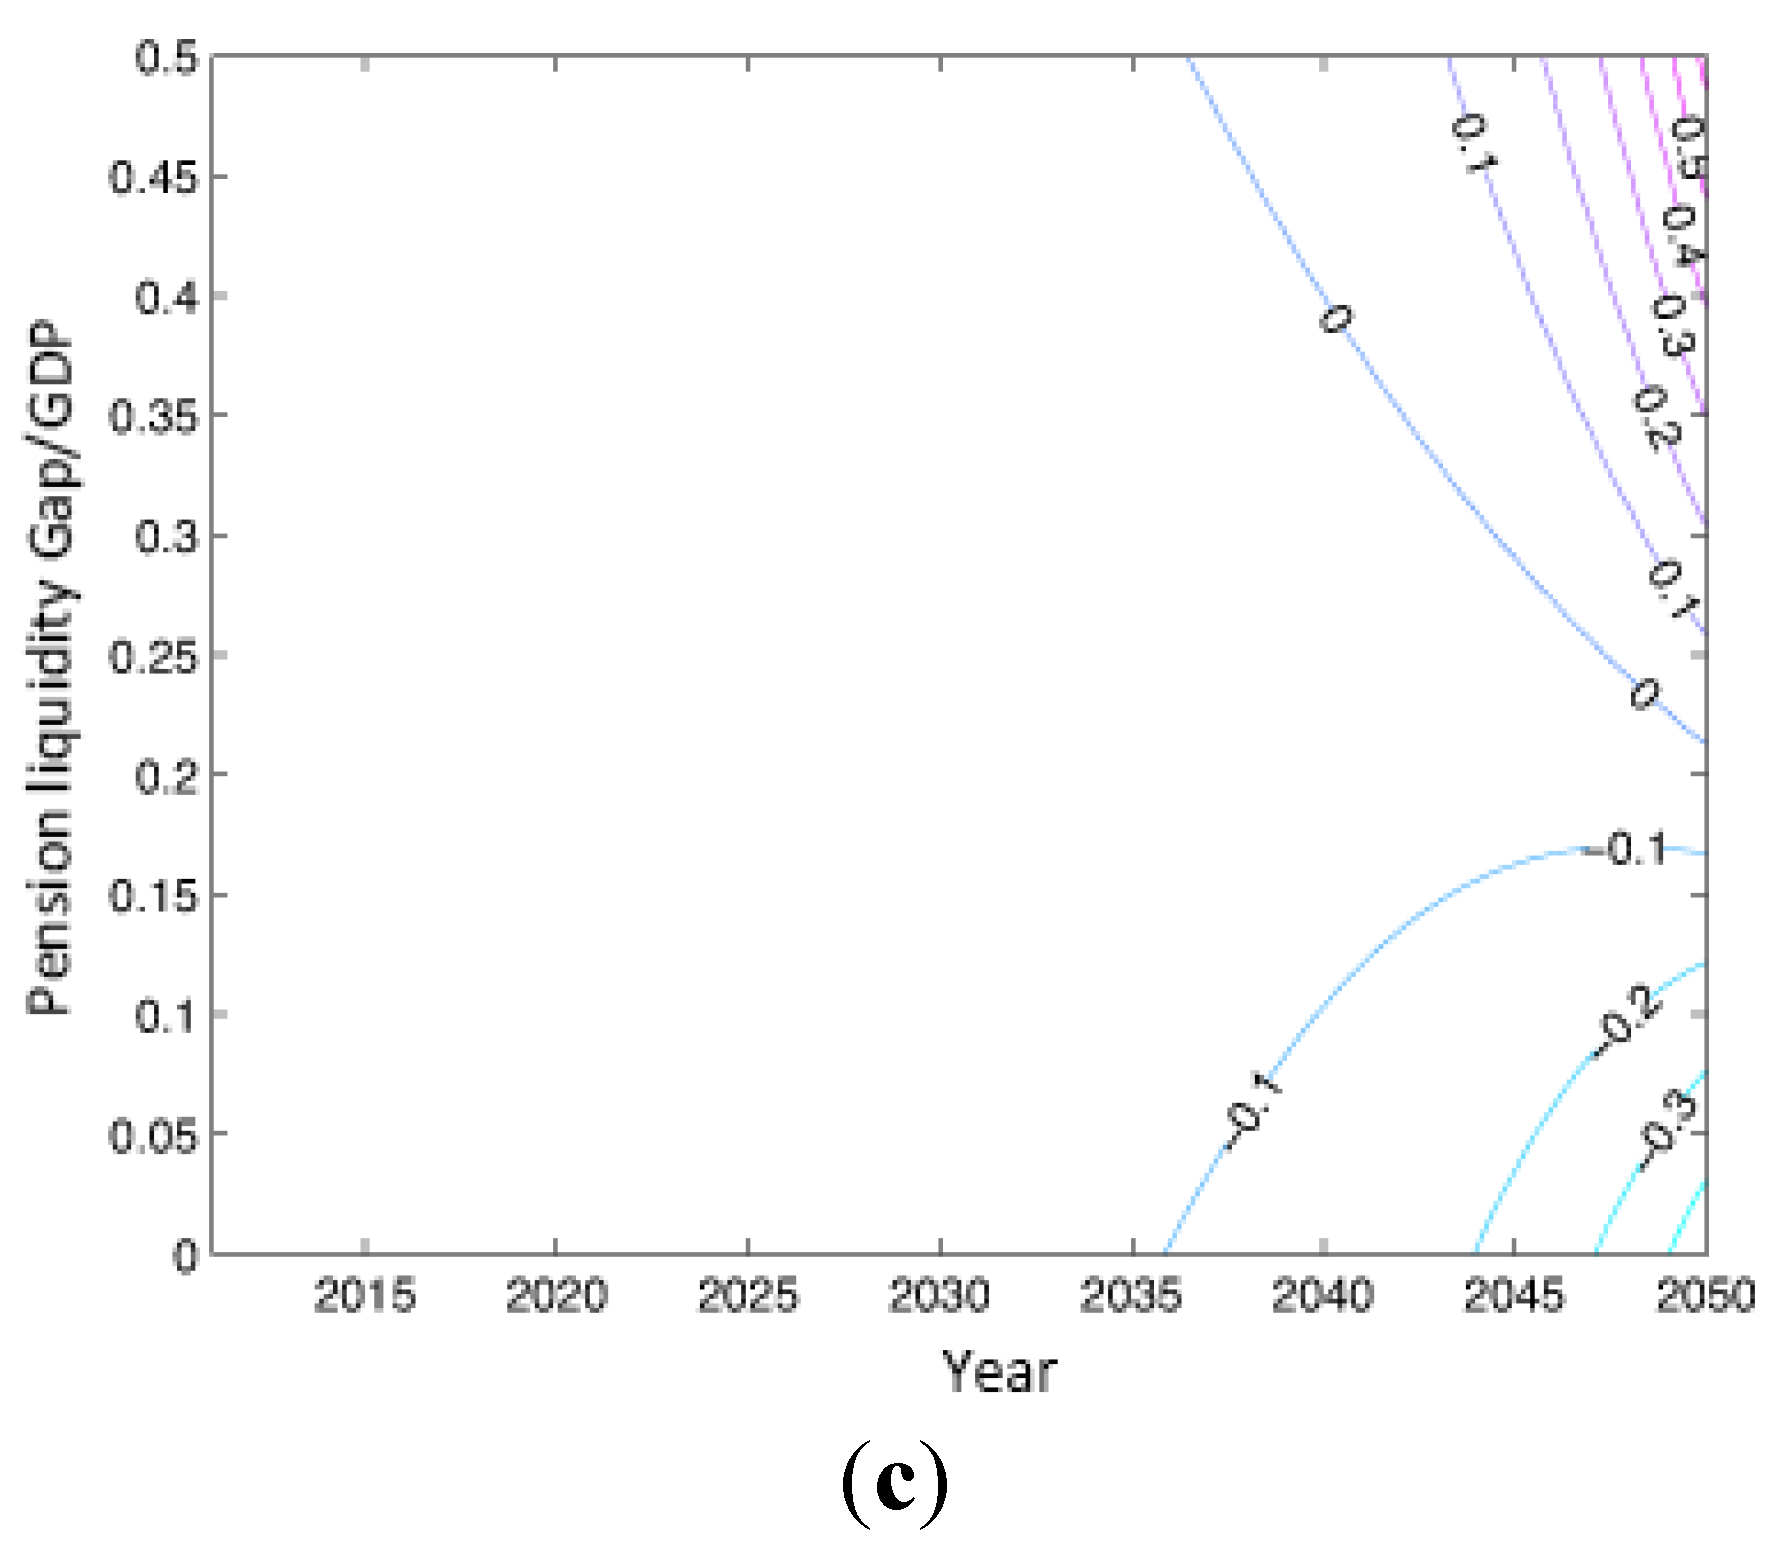
2.2. The Prediction of Liquidity Gap

Here, introduce the liquidity gap L t . Consider the following model,
L t  = θ 1 W t N t  + G t    α 1 W t M t old    α 2 W t M t mid    vW 1997 M t middle    α 3 W t M t new
where θ 1 W t N t + G t is the income of pensions in the social pooling account, and α 1 W t M t o l d + α 2 W t M t m i d + ϖ W 1997 M t m i d d l e + α 3 W t M t n e w is the expenditure of pensions in the social pooling account. Due to the implementation of the saving system for individual pension accounts and it not being used to pay for the current pension, the income of the current social pooling account is only used for the expenditure of the social pooling pension, and the difference between them reflects the part where social pooling pension account income cannot meet expenditures.
After obtaining the initial liquidity gap model and data, we need to upgrade the changes in the liquidity gap between the next phase and the current one. An intergenerational relationship refers to the changes in each parameter in the next phase relative to each parameter in the current phase. Therefore, according to the income and expenditure of the pension model at time t , assume that the changes in updates that occurred in each condition at time t + 1 are as follows:
M t+1 old  = M t old (1   s 1,t )
M t+1 mid  = M t mid (1   s 2,t  + p 2 )
M t+1 new  = M t new (1   s 3,t  + p 3 )
N t+1  = N t (1 + n)
W t+1  = W t (1 + w t )
G t+1  = G t (1 + g t )
Equations (15)–(17) represent the number of insured in the “old people”, “middle people” and “new people” categories at time t + 1 . Mortality rates are classified by the three groups. s 1 , t , s 2 , t , s 3 , t represent the mortality rate of “old people”, “middle people” and “new people” at time respectively. The formula for three groups’ mortality rates are as follows:
s 1,t  =  The number of deaths in ″old people″ the total number of ″old people″
s 2,t  =  The number of deaths in ″middle people″ The total number of ″middle people″
s 3,t  =  The number of deaths in ″new people″ The total number of ″new people″
p 2 , p 3 are the growth rates of the number of insured in the “middle people” and “new people” groups at time t . n is the growth rate in the number of insured employees. w t is the growth rate of wages, which remains unchanged after increasing to a certain level. g t is the economic growth rate, which increases first and then remains stable. Here, we assume that the national financial subsidies to pensions remain consistent with the speed of economic growth.
Therefore, each index is used with a value from 2011, the data of which are from the National Bureau of Statistics Website. Next, intergenerational relationships are used to iterate. Assume that the number of insured persons serving with the average number of workers insured in nearly a decade continues to grow with an annual growth rate of 7.6 percent until 2050; take the growth rate of the number of “middle people” among the retired insured before 2040 as 8 percent, which is the average annual growth rate of retirees from 2006 to 2011, it then decreases to zero because most of the youngest “middle people” will retire before that period. Take the growth rate of the number of retired “new people” as 8.3 percent, which is the growth of retirees in 2011; phased mortality rates continue to increase, and the mortality of “old people” has the fastest growth, reaching a maximum in 2020. The “middle people” growth rate reaches its maximum approximately 2040. The future GDP maintains a growth rate of 7 percent at first until 2020, declines from 2020 to 2030 by 5 percent and then maintains a gradual linear decrease to 3 percent from 2030 to 2050. Take the initial value of the average wage growth rate in 2011 as the real growth rate, 8.9 percent, which is the nominal real wage growth rate of 14.3 percent cut with inflation of 5.4 percent. The average wage is expected to grow at this speed until 2020. The growth rate starts to decrease slightly in a linear fashion after 2020. Changes in the liquidity gap are plotted in Figure 1.
Figure 1. The changing trend of pension liquidity gap.
Sustainability 07 10876 g001
The overall trend in China’s liquidity gap is first increasing sharply and, after reaching the peak, decreasing rapidly. The maximum for the gap occurs in 2038, with an expected liquidity gap of 13.11 trillion yuan, accounting for 13.28 percent of GDP. That is to say, approximately 13 percent of the GDP is needed to compensate for the liquidity gap to maintain the fund balance. However, the current government financial subsidies to the pension only account for 0.42 percent of GDP. It is clear that if the current situation is maintained, the liquidity gap will become a huge burden on national economic development in 2038, and the situation in the following three years is also not optimistic. Beginning with the end of 2042, with the initial ageing population coming to a death peak and the new increasing elderly population reducing, the new labor population will increase, resulting in significant improvements in pension liquidity conditions. A reversal of the overall increasing gap trend and an excess of income over spending appear in the balances. A pension liquidity surplus period quickly arises and is expected to fill the gap completely approximately in 2050.

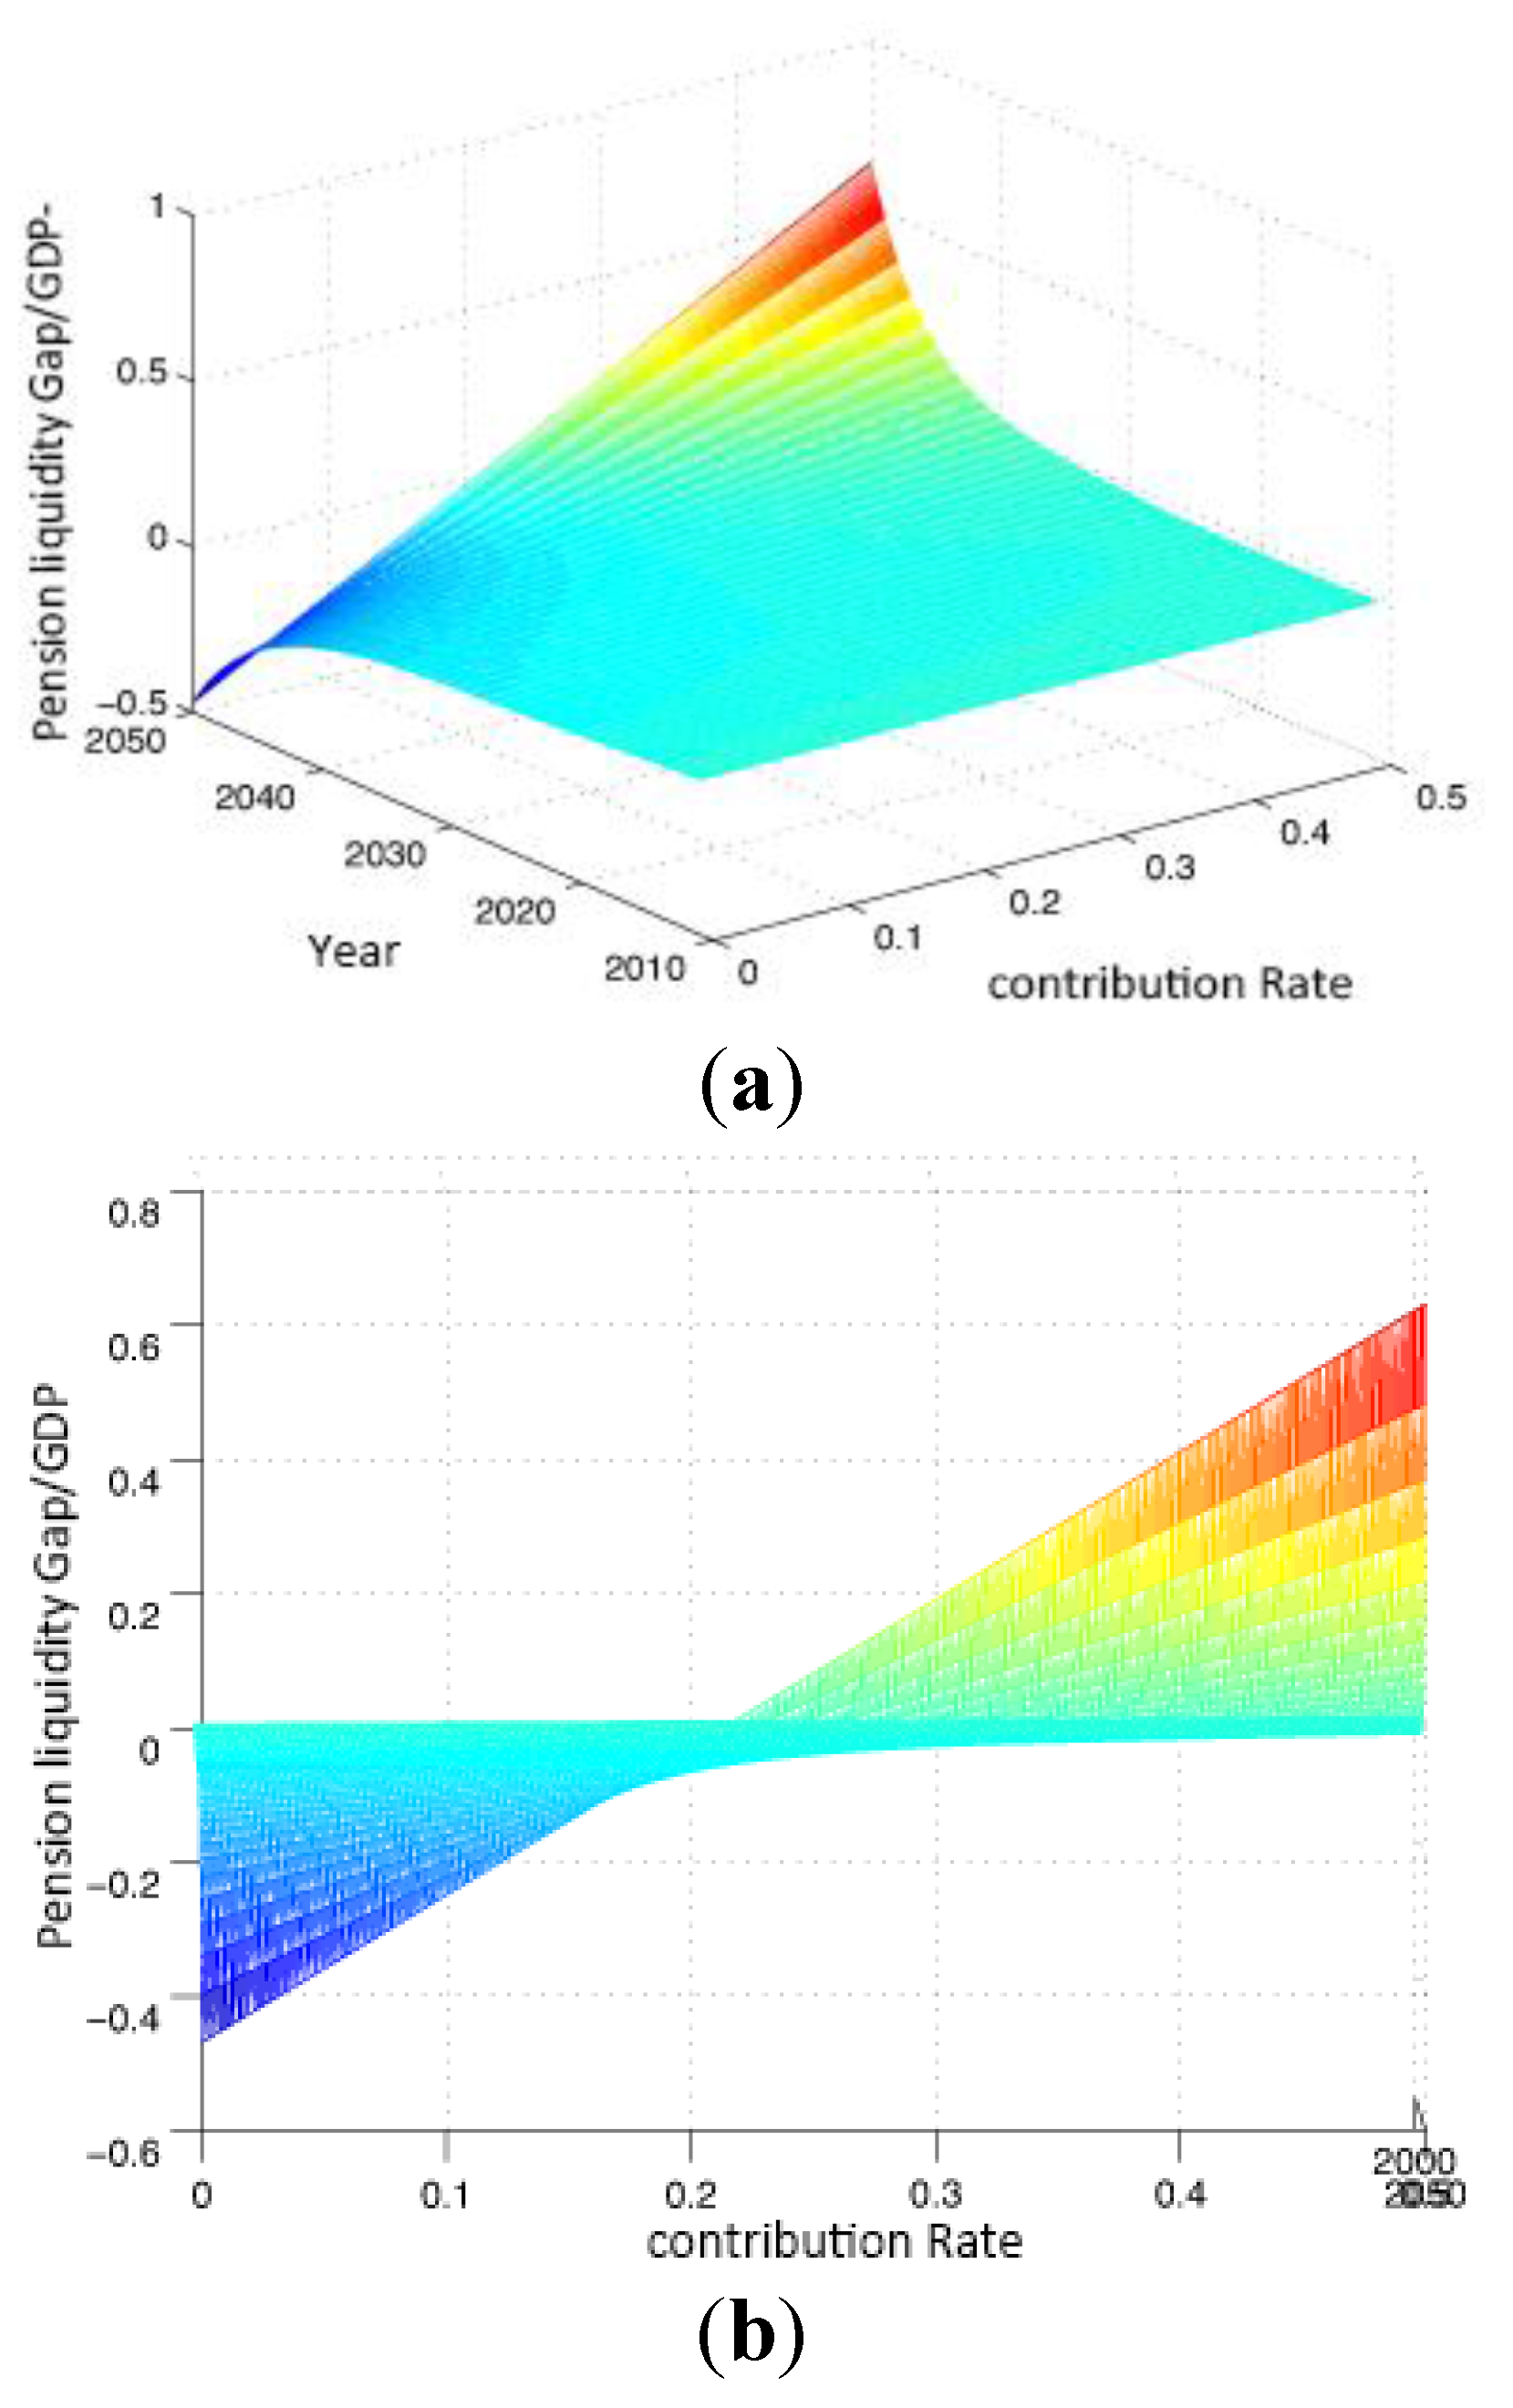
3. Determination of Reasonable Intervals for the Replacement Rate and Contribution Rate

The replacement rate and contribution rate are important components of the national pension system, playing a decisive role in the balance of the pension account. Different modes of the pension system in each country determine different replacement rates and contribution rates [14,15,16]. In 1997, when China established a pension scheme for urban workers, the expected replacement rate was 58.5 percent, whereas the contribution rate was 20 percent. Since 1999, China’s enterprise pension replacement rate has declined year by year. By 2011, the enterprise replacement rate dropped to 42.9 percent. Whether this replacement rate and the contribution rate can ensure the sustainability of the pension system and meet China’s economic and social development are urgent issues that need to be verified. Thus, combined with China’s actual conditions, to ensure the effectiveness and sustainability of China’s pension system, it is essential to determine reasonable intervals for the replacement rate and contribution rate.

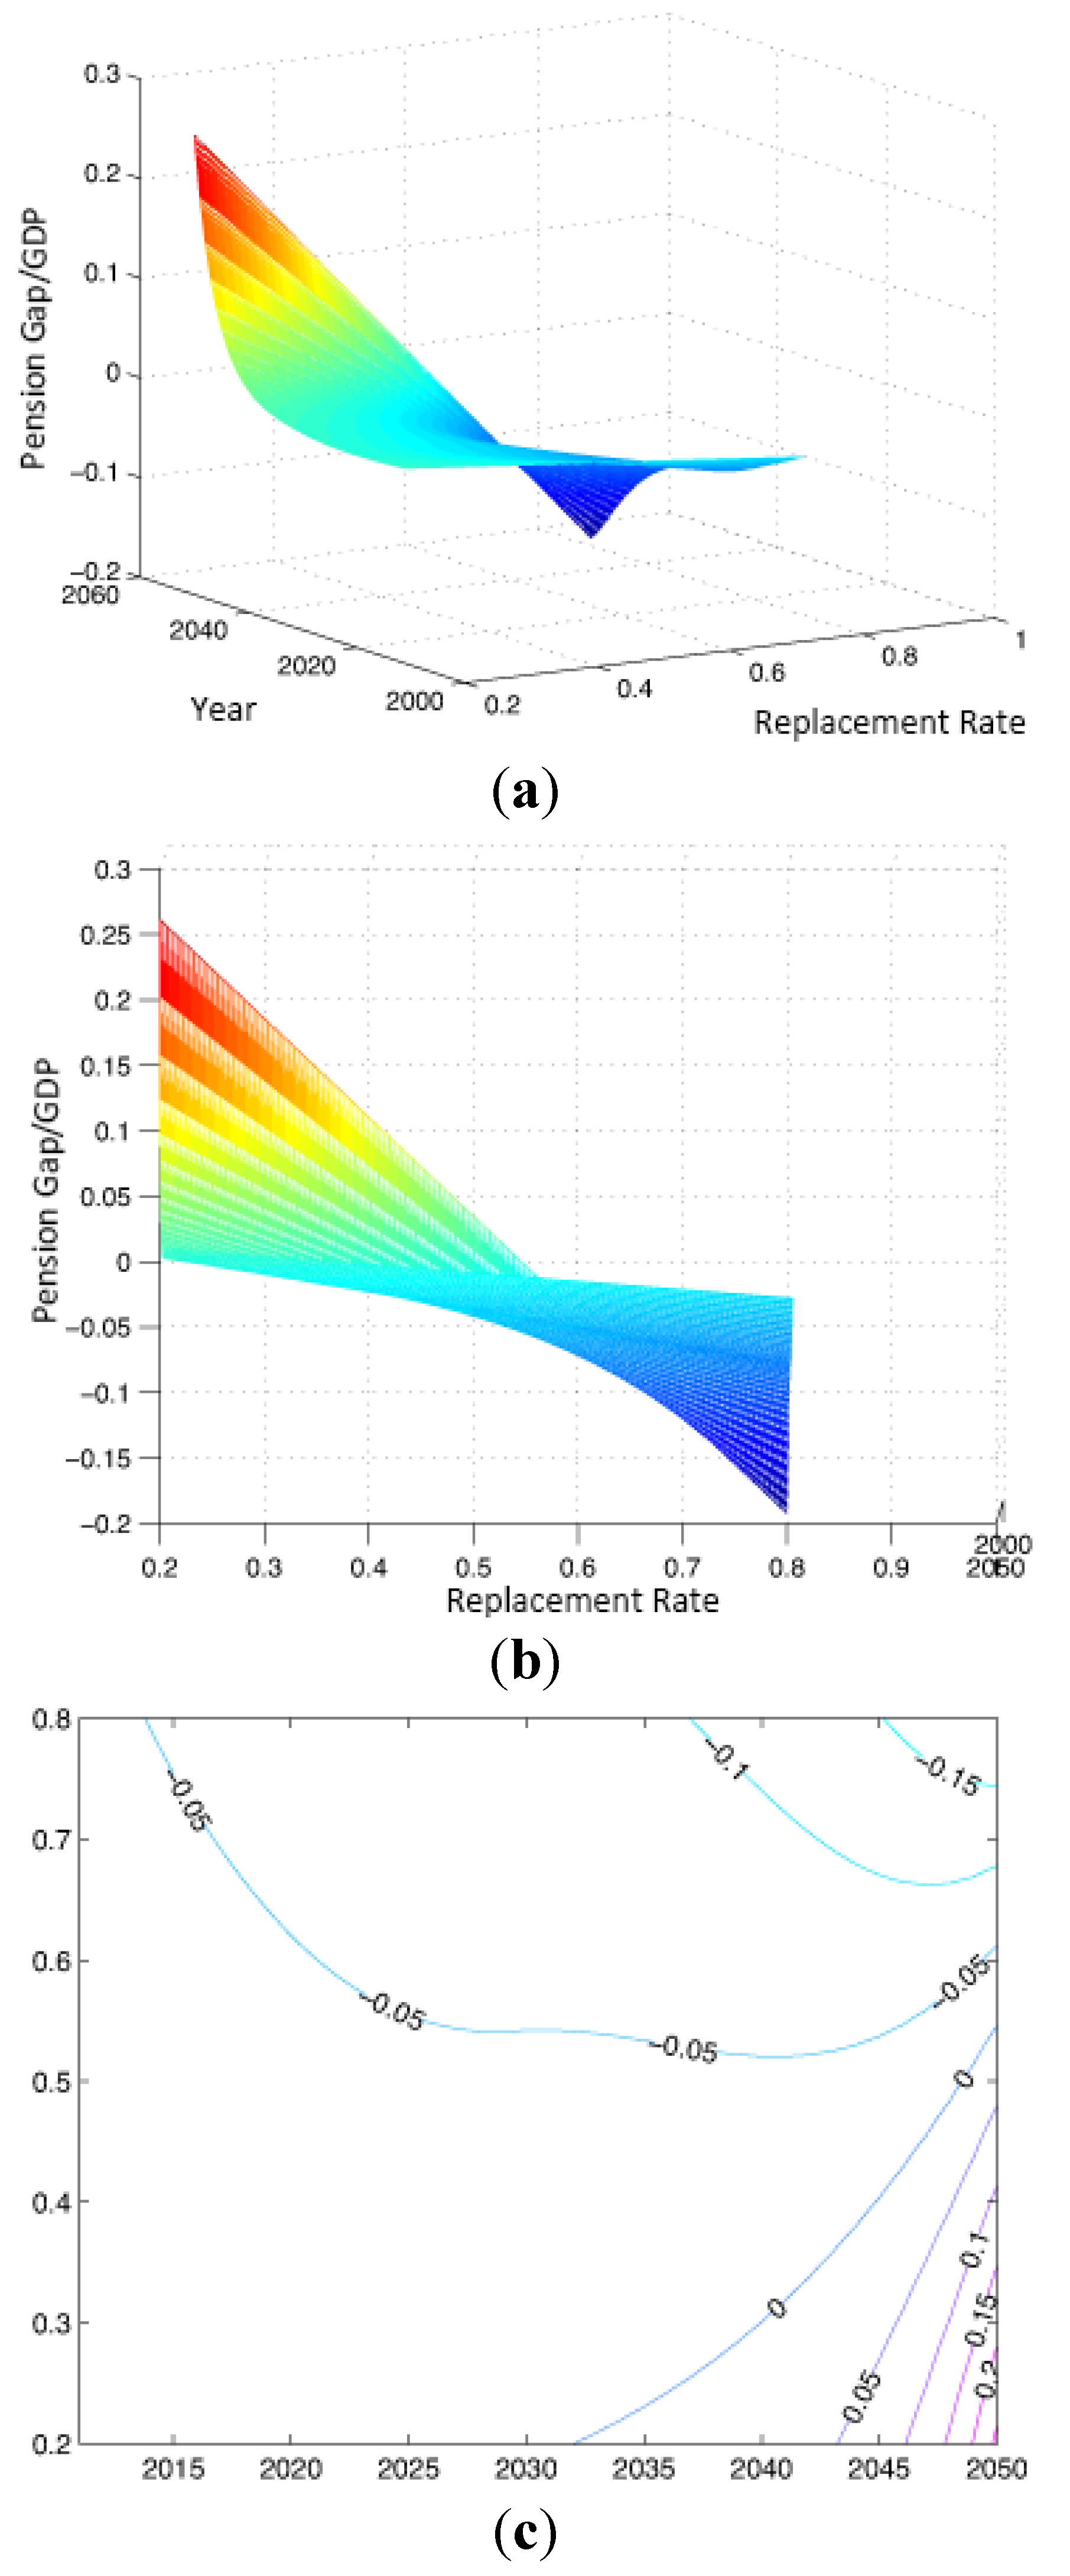
3.1. Reasonable Interval for the Replacement Rate

Because the main factors, such as demographic structure, mortality of different ages, economic growth, and investment returns, can hardly to be changed by humans, here, the original update process is maintained, and only the replacement rate is changed. The dependent variable used here is the ratio of the liquidity gap to GDP, because this index better reflects how serious the liquidity gap is and the impact on the national economy at a certain time. Suppose that the replacement rate changes from 0.2 to 0.8. The resulting pension graphic model of the liquidity gap/GDP, plane figure and contour map are shown in Figure 2.
Figure 2. Changing trend of the replacement rate-time. (a) Changing trend of the replacement rate-time; (b) Changing trend of the replacement rate-time; (c) Changing trend of the replacement rate-time.
Sustainability 07 10876 g002
The pension replacement rate and liquidity gap have a positive correlation: when the replacement rate is small, the pension account has a surplus, with more income than expenses; liquidity is ample, and surpluses in the account increase over time. When the replacement rate is large, the pension account has a deficit; the social pooling account is not enough to cope with the dispensing needs of pension. Hence, liquidity shortage occurs and the gap increases with time. For instance, when the replacement rate is 0.2, a small gap only exists in several of the early years. The situation immediately transforms into a pension surplus over time and increases rapidly based on the density in the contour map. When the replacement rate is 0.8, the initial liquidity gap accounts for nearly 5 percent of the GDP, and the gap grows faster over time, as is the case with the gap size, which accounts for more than 20 percent of the GDP by 2050.
The replacement rate reflects the ratio of pensions that retirees get to the average wage of workers. A comparatively low replacement rate cannot maintain their living standards in retirement, whereas a comparatively high replacement rate will cause a liquidity gap or even a breakdown. Therefore, we believe that it is comparatively reasonable for the fund to be balanced. The surplus ratio should not exceed 10 percent of the GDP. According to Figure 2, the corresponding replacement rate for when the liquidity gap/GDP equals 10 percent is 0.417, so the replacement rate of the lower limit is 0.417, which means that pension retirees should obtain at least 41.7 percent of the average wages of working staff. As for the upper limit of the replacement rate, we believe that the largest liquidity gap/GDP should be less than 5 percent, which will gradually decrease; only in this situation can the sustainability of China’s pension system be ensured. The reasonable upper limit value of the replacement rate is set at 0.604. In other words, when the pension received by retired workers does not exceed 60.4 percent of wages of the on-the-job staff, the national pension system can continue to grow. Thus, the ultimately determined reasonable interval of the replacement rate is [0.417, 0.604].

3.2. Reasonable Interval for the Contribution Rate

For the estimation of a reasonable interval for the contribution rate, taking the index of the liquidity gap to GDP as the dependent variable and assuming that the contribution rate changes from 0 to 0.5, the resulting liquidity gap/GDP graphic model, plane figure and contour map are shown in Figure 3.
Figure 3. Changing trend of the contribution rate-pension liquidity gap/GDP-time. (a) Changing trend of the contribution rate-pension liquidity gap/GDP-time; (b) Changing trend of the contribution rate-pension liquidity gap/GDP-time; (c) Changing trend of the contribution rate-pension liquidity gap/GDP-time.
Sustainability 07 10876 g003aSustainability 07 10876 g003b
The pension contribution rate and liquidity gap are negatively correlated: when the contribution rate is lower, a gap appears in the pension account, the growth becomes faster and the scale becomes larger over time. When the contribution rate is high, a pension surplus occurs and the growth rate increases over time. For instance, when the contribution rate is 0, it means that employees do not need to pay the pension of the social pooling account, and all current pensions are given by national financial subsidies, with the liquidity gap/GDP nearly amounting to 50 percent. When the contribution rate is 0.5, companies need to pay half of the employees’ average wage; a high pension contribution rate leads to a massive accumulation of surplus, accounting for over 60 percent of the GDP. As observed from the contour map, the reversal point is when the contribution rate is equal to 0.2, and no contour line exits at this time, demonstrating that when the contribution rate is 20 percent, the pension account basically maintains a break-even balance condition and changes in the liquidity gap are extremely small. With the contribution rate gradually changing towards two ends, the contour becomes more intensive, and the liquidity gap increases.
The contribution rate here only reflects the social pooling account, which is the proportion of pension paid by enterprises on behalf of employees in the average wage of employees. On one hand, a contribution rate that is too low cannot meet the employees’ life needs after retirement. On the other hand, because the social pooling account is PAYG, a contribution rate that is too low will result in a liquidity gap. On the contrary, a contribution rate that is too high rate will increase the burden on enterprises and a massive accumulation of pension will cause a waste of funds. Therefore, for the lower limit of the contribution rate, we take the critical point where liquidity gap/GDP is less than 5 percent, at 18.9 percent. For the upper limit of the contribution rate, we take the critical point where the liquidity surplus/GDP is less than 10 percent—26.2 percent. The ultimately determined reasonable interval for the contribution rate is [0.189, 0.262].

4. Evaluations of Government Relevant Policies’ Effects

To achieve sustainable performance in China’s pension system, the government should take appropriate action promptly to ease the liquidity shortage and promote a balance in the pension account. The issuing or changing of national policies would have a significant impact on the pension system, and the effects of different policies options on pension are not the same. Therefore, based on the building of a basic pension model and liquidity gap function in the previous section, this paper simulates and evaluates the actual influence of various national policies on the liquidity gap, exploring policy options that are more effective and suitable for the realization of a smooth transition in China’s pension system.

4.1. Policy Effect Forecasting of Income Doubling Plan

The income doubling plan [17] aims to raise the income level of Chinese residents. To achieve this goal, we must ensure that the GDP and average wages should continue to grow at no less than 7.2 percent annually. Therefore, the assumptions in the process should be updated as maintaining a GDP growth rate and wage growth rate equal to 7.2 percent until 2020. After changing the conditions, the liquidity gap is shown as Figure 4.
Figure 4. Changing trend of income doubling plan-pension liquidity gap.
Sustainability 07 10876 g004
If the income doubling plan is implemented smoothly, the increase rate of the gap will slow down significantly, although the overall trend for the liquidity gap in China will not be changed. The most serious liquidity gap occurs in 2034, four years ahead of time. The largest gap is reduced by 4.73 trillion yuan, decreasing to 8.38 trillion yuan, with the proportion of the GDP declining from 13.28 percent to 4.8 percent. Therefore, the income doubling plan can be considered an effective policy for easing the liquidity gap in terms of both volume and the rate of increase.

4.2. Policy Effect Forecasting of Increasing the Contribution Rate and Reducing the Replacement Rate

Changes in the contribution rate and replacement rate will have a significant impact on the pension account. If the government makes the minimum replacement rate as 41.7 percent from 2014, the estimated effect of the policy—changes in the liquidity gap—is shown in Figure 5a. Similarly, if the government raises the contribution rate to its reasonable upper level, 26.2 percent, the effect on the liquidity gap is shown in Figure 5b.
Figure 5. Changing trend of changing replacement rate and contribution rate-pension liquidity gap. (a) Change the replacement rate; (b) Change the contribution rate.
Sustainability 07 10876 g005
As can be observed, either reducing the replacement rate or increasing the contribution rate could reduce the liquidity gap; however, the policy effects of reducing replacement rate are stronger than those of raising the contribution rate. In addition, after lowering the replacement rate, the extent of change in the liquidity gap slows down significantly in the next fifteen years. The peak in the liquidity gap is three years ahead of 2038. The gap decreases to 5.52 trillion yuan, 7.59 trillion yuan less than before. Before 2044, the turnaround of a basic pension account can be achieved, which is six years earlier. Moreover, if the contribution rate increases to 26.2 percent, the maximum liquidity gap will decrease to 11.12 trillion yuan, decreasing approximately 2 trillion yuan. The break-even time is 2047, three years ahead.
As a result, both reducing the replacement rate to the lower limit and raising the contribution rate to the upper limit could significantly narrow the liquidity gap. In the next 15 years, the magnitude of changes in the liquidity gap slows down remarkably, and its peak occurs in 2027, 11 years ahead of time. The gap decreases to 2.49 trillion yuan, 10.62 trillion yuan less than before. In 2037, the turnaround of the basic pension accounts can be achieved, 13 years earlier. Therefore, the effects of raising the contribution rate and reducing the replacement rate are more obvious than those of the income doubling plan, which also depends on the rate setting.

4.3. Policy Effect Forecasting of Delaying the Retirement Age

Disputes over increasing the retirement age have existed in recent years but have not yet been officially confirmed. On 15 November 2013, “Decisions of CPC Central Committee on Deepening Reform of the Overall Major Issues” clearly presented “Studies on Progressively Delaying Retirement Age Policy” ensured that a policy for delaying the retirement age will come soon. Previously, we assumed that workers’ average working duration was 30 years. To clearly understand the effects of delaying the retirement age, assume that from 2013, the government starts to delay the retirement age by one year, two years, three years, five years, seven years and 10 years. The corresponding changes in the liquidity gap are shown as Figure 6.
Figure 6. Changing trend of delaying the retirement age-pension liquidity gap. (a) Delaying 1 year; (b) Delaying 2 years; (c) Delaying 3 years; (d) Delaying 5 years; (e) Delaying 7 years; (f) Delaying 10 years.
Sustainability 07 10876 g006aSustainability 07 10876 g006b
As observed from the figures, delaying the retirement age can effectively alleviate the financial pressure caused by the liquidity gap. When the retirement age is delayed by one year, two years, three years, five years, seven years and 10 years, the maximum liquidity gap is reduced to 10.77 trillion yuan, 9.03 trillion yuan, 7.68 trillion yuan, 5.89 trillion yuan, 4.09 trillion yuan and 2.55 trillion yuan, respectively. The gap peak is gradually moved ahead to approximately 2030, and the break-even point moves from 2050 to 2038. The liquidity gap is no longer a smooth convex curve but two curves forming a turning point. As the delayed years of retirement increases, the trend of change for the liquidity gap around the turning point is more obvious. Meanwhile, it can be seen from the figure that the corresponding year of the turning point equals the sum of years of the delayed retirement age plus the particular year when the policy was enforced. There is a slow increase in the liquidity gap before reaching the turning point, whereas the liquidity gap increases significantly after a turning point. The main reason is that, due to the implementation of a policy on delaying the retirement age, there will be no new retirees in the years before the turning point; thus, the expenditure of the account during this period has been reduced effectively. However, for years after the turning point, former workers who should have retired begin retiring continually, which increases the number of retired workers, thereby increasing the expenditure of the pension account. However, because delaying the retirement age disperses the time of providing pensions for “old people” and “middle people”, overall, the liquidity gap is smaller than the original.

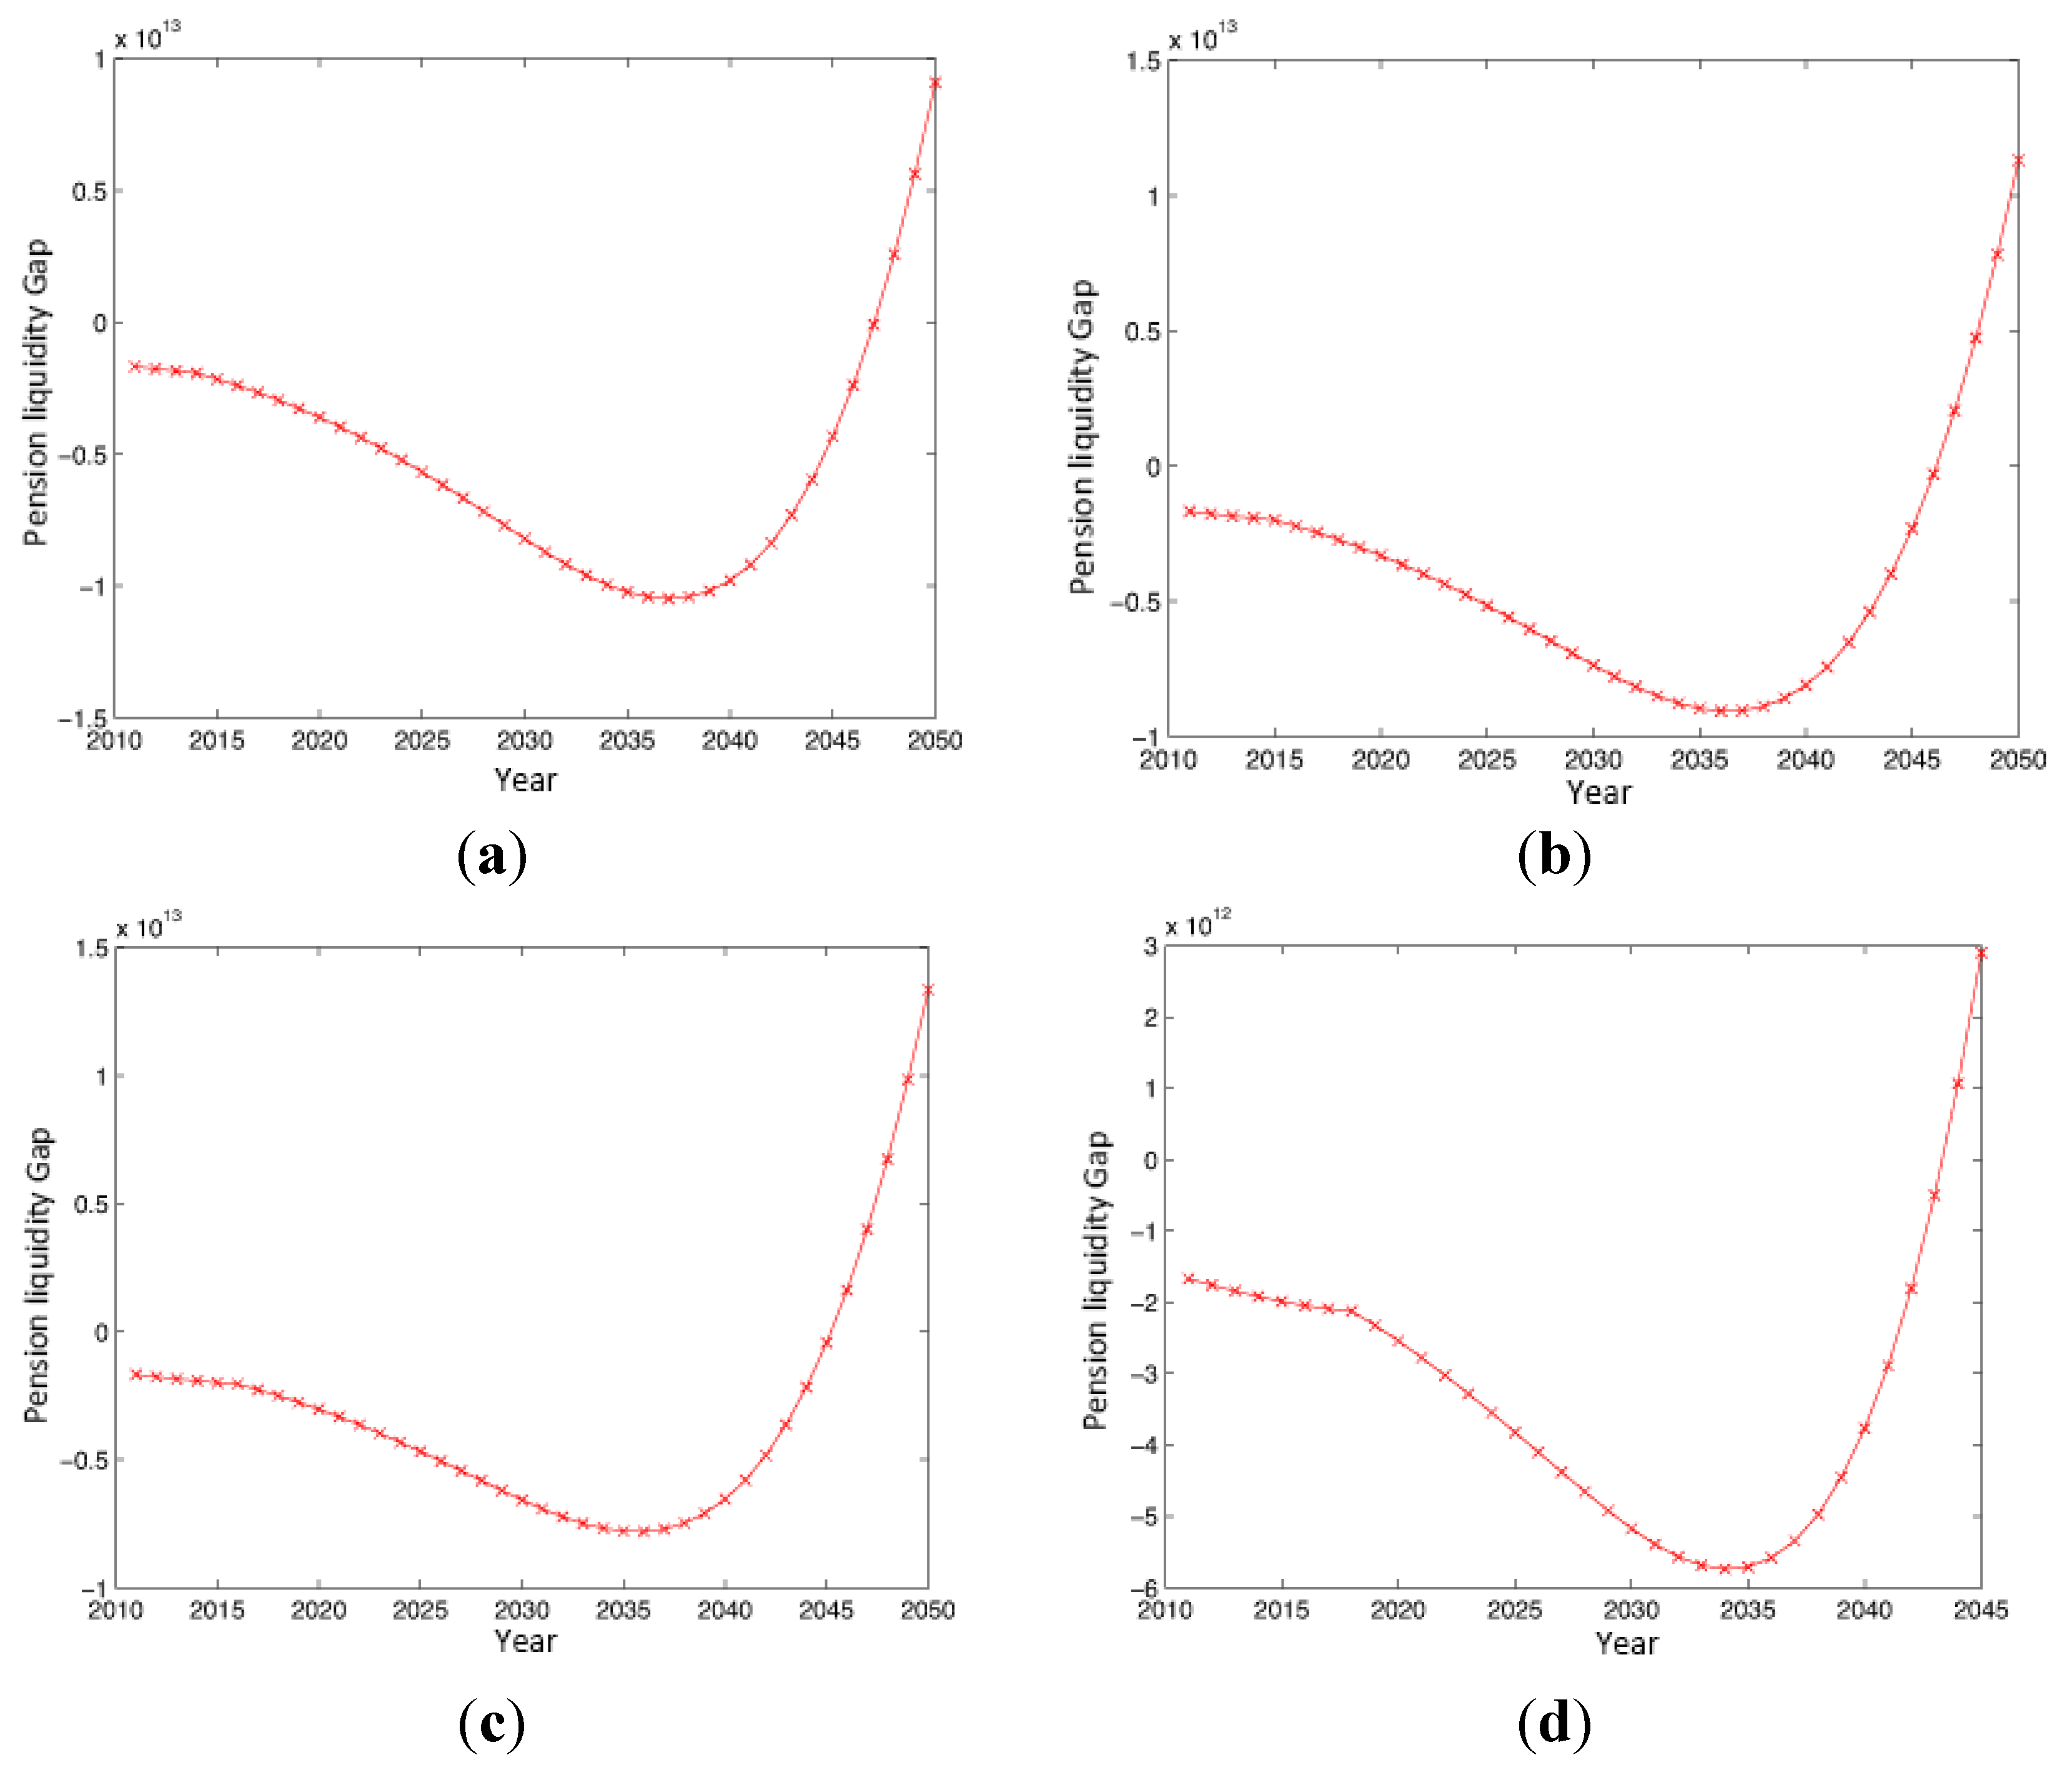
4.4. Policy Effect Forecasting of Having Two Children

A policy of having two children means families that were originally restricted by the “one child policy” could choose to have two children; thus, there would be more young people working in the future, which would increase the amount of pensions contributed to social pooling accounts and narrow the liquidity gap. Assuming that the policy is implemented in 2014 with continuous improvements in national education and people’s living standard, students will obtain university degrees in the future. Thus, supposing that the average employment age is 22, the effect of the expected population policy on the liquidity gap is shown in Figure 7.
Figure 7. Changing trend of population policy-pension liquidity gap.
Sustainability 07 10876 g007
As can be observed, following the implementation of a policy of having children, the liquidity gap trend is a broken line, and the inflection point appears approximately in 2035. The result is consistent with expectations; a two-child policy increases the number of future employees, resulting in a significant increase in pension incomes under the condition that pension expenditures remain unchanged, quickly filling the liquidity gap. Because the average age for employment is 22, the policy effect is evident after 2035. Comparing Figure 7 with Figure 1, it can be seen that before 2035, the liquidity gap is not changed. Beginning with 2035, the gap-expanding condition is restrained, and a recovery phase quickly begins a few years later. Even so, the gap peak still reaches 12.28 trillion yuan, with a difference of only 0.83 trillion yuan compared to the original. This result is mainly due to the lag effect of the two-child policy lasting for 22 years, during which the liquidity gap becomes very serious. From this perspective, the effect of a two-child policy on the liquidity gap is small, or, in other words, does not effectively alleviate the gap at the worst moment.

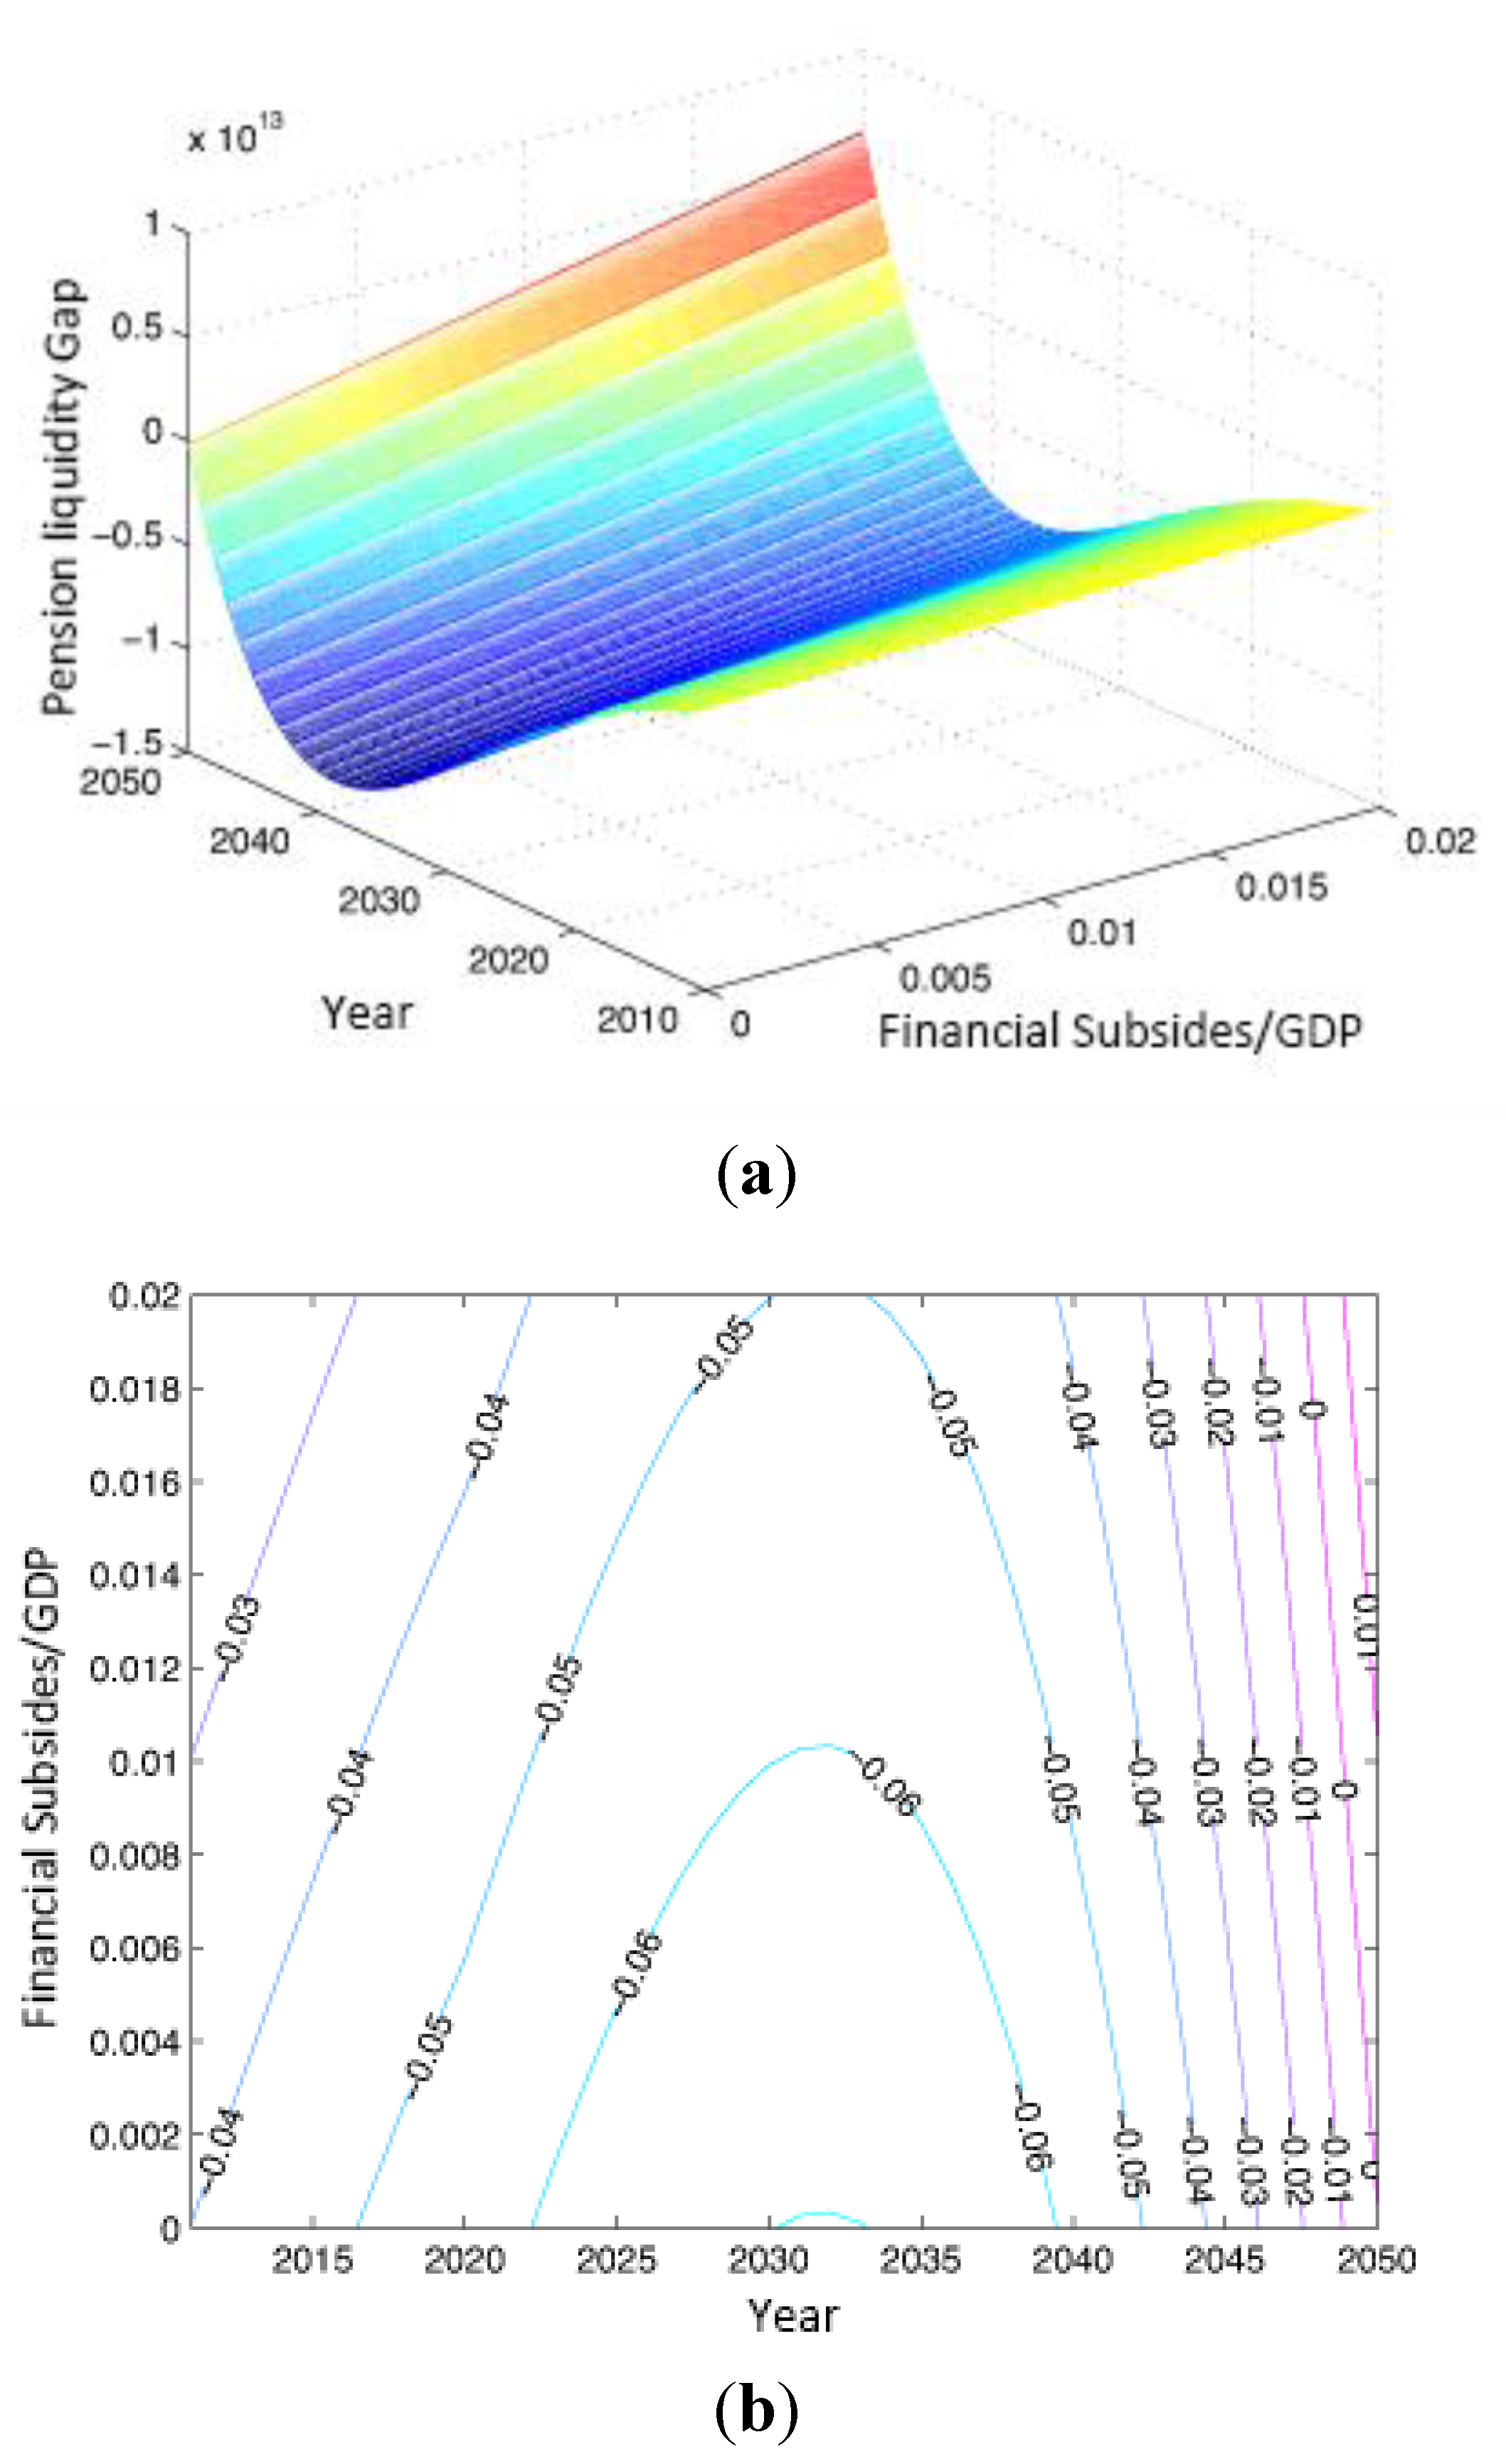
4.5. Policy Effect Forecasting of Fiscal Subsidies Changes

Pension issued by a social pooling account is partly derived from the social pooling pension paid by enterprises at present and partly provided by national financial subsidies. Financial subsidies that are too low would further aggravate the individual “empty account” and increase the liquidity gap; however, financial subsidies that are too high would bring a huge financial burden to the government. Therefore, choosing an appropriate financial subsidy rate is important. In 2011, the number of subsidies given to finance pension by the government was 227.2 billion yuan, accounting for 0.48 percent of the GDP. The ratio is far from that of developed countries. For instance, pension expenditures account for 9.4 percent of the GDP in U.S. and more than 20 percent in Japan. The impact of the government changing its pension subsidies and adjusting the ratio, namely from 0 to 0.02, is shown in Figure 8.
Figure 8. Financial subsidies/GDP-pension liquidity gap. (a) Financial subsidies/GDP-pension liquidity gap; (b) Financial subsidies/GDP-pension liquidity gap.
Sustainability 07 10876 g008
It can be observed that the greater the government subsidies/GDP ratio, the smaller the liquidity gap is. The contour map reflects that from 2011 to 2030, increasing the rate of financial subsidies has a significant impact on the liquidity gap. From 2030, the contours gradually become vertical, reflecting that the effect of changing the ratio of financial subsidies for the liquidity gap/GDP decreases. When there is no financial subsidy, the peak of the liquidity gap is 14.41 trillion yuan; when financial subsidies increase to 1 percent, the maximum liquidity gap is 11.7 trillion yuan; when the financial subsidy ratio increases to 2 percent, the maximum mobility gap is 8.99 trillion yuan. In other words, for every 1 percent increase in the proportion of fiscal expenditures, the liquidity gap is reduced by 2.71 trillion yuan. As observed, although slightly improving financial subsidies could alleviate the liquidity gap, the policy effect is not obvious. A substantial increase in subsidies for pensions can significantly narrow the liquidity gap, but the policy cost is large. Therefore, if the government plans to take the policy of increasing financial subsidies to ease the liquidity gap, other policies should be used in combination to achieve better results without aggravating financial pressure.

5. Concluding Remarks

Currently, the sustainability of China’s pension system has been seriously challenged due to the ageing population, whereas large-scale contradictions over the individual “empty account” leading to the liquidity gap have been revealed. This study first builds a basic pension model by dividing urban workers into three categories, “old people”, “middle people” and “new people”, to distinguish the different pension benefits enjoyed by various groups. In addition, the study calculates the reasonable intervals of the replacement rate and contribution rate for China’s pension scheme for urban workers. Moreover, possible effects of recent government-issued policies on the gap have been fully discussed through a simulation method. Based on the analysis, we draw the following conclusions: Firstly, the liquidity gap will reach its peak of approximately 13.11 trillion yuan in 2038. After that, the gap will gradually decrease with growth in the mortality rate. Secondly, to maintain the sustainability of China’s pension system without affecting the retirees’ life quality, increasing the burden on enterprises and intensifying the liquidity gap, the reasonable replacement rate interval should be set at [0.417, 0.604], whereas the contribution rate interval should be set at [0.189, 0.262]. Thirdly, an income doubling plan, raising the contribution rate, lowering the replacement rate and delaying the retirement age can significantly reduce the liquidity gap, although the policy cost is relatively high, whereas increasing fiscal subsidies may diminish liquidity gap. A population policy allowing two children will increase the reducing rate of the liquidity gap, but it cannot effectively narrow the liquidity gap at the peak moment.
Therefore, it is suggested that China gradually adopt pension system reform together with a variety of policies implemented. Firstly, an income doubling plan should be implemented to seize economic development and improve income level of current workers. Secondly, although the policy effect of delaying the retirement age is very significant and can effectively alleviate the gap in a relatively short period, the approach should be taken gradually because many workers oppose such measures. Meanwhile, the delayed retirement age should be set at 1–3 years. It could be changed according to the actual effect of the policy, or different retirement ages should be used for different occupations. Thirdly, the contribution rate has a direct impact on enterprises, workers and retirees, but, in accordance with the current policy, basic pension only achieves a basic level. Enterprises should make more contributions through the “pension scheme” to further raise protection; therefore, it is difficult to increase the contribution rate in a unified way in a short period. Fourthly, the replacement rate is also an important indicator of sustainable fund performance. The rate should be gradually changed on the basis of sharing the responsibility of employers, workers and government.

Acknowledgments

We gratefully acknowledge the financial support from the National Natural Science Foundation of China (No.71473036,71273048), National Social Science Foundation of China (No.15CGL045), Ministry of Education of the People’s Republic of China (No.14YJC630202), Ministry of Education of Jiangsu Province (2014SJD013) and Social Science Research Grant of Southeast University (No. 2242015S22005). It is our responsibility for all errors.

Author Contributions

Xiaoxing Liu and Ying Zhang conceived and designed the experiments; Lin Fang performed the experiments; yuanxue Li and Wenqing Pan wrote the paper.

Conflicts of Interest

The authors declare no conflict of interest.

References and Notes

  1. “Old people” refers to people who have retired before 2006; “Middle people” refers to insured people who started working before 1997 and retired after 2006; “New people” refers to insured participating in work after 1997.
  2. Laurin, A.; Robson, W.B. Ottawa’s Pension Gap: The Growing and Under-Reported Cost of Federal Employee Pensions; C.D. Howe Institute: Toronto, ON, Canada, 2011. [Google Scholar]
  3. Van Duijn, M.; Lindeboom, M.; Lundborg, P.; Mastrogiacomo, M. Pension plans and retirement replacements rates in the Netherlands. 2009. Available online: http://www.cpb.nl/en/publication/pension-plans-and-retirement-replacement-rates-netherlands (accessed on 5 August 2015).
  4. Verbič, M.; Spruk, R. Aging population and public pensions: Theory and evidence. 2011. Available online: http://mpra.ub.uni-muenchen.de/38914/ (accessed on 5 August 2015).
  5. Antolin, P.; Whitehouse, E. Filling the pension gap: Coverage and value of voluntary retirement savings. Available online: http://www.oecd-ilibrary.org/social-issues-migration-health/filling-the-pension-gap_227200770711?crawler=true (accessed on 5 August 2015).
  6. Elmendorf, D.W.; Sheiner, L.M. Should America save for its old age? Fiscal policy, population aging, and national saving. J. Econ. Pers. 2000, 14, 57–74. [Google Scholar]
  7. Rother, P.C.; Catenaro, M.; Schwab, G. Aging and pensions in the Euro Area Survey and Projection Results; World Bank: Washington, DC, USA, 2003. [Google Scholar]
  8. Alessie, R.; Kapteyn, A. Household saving in the Netherlands. Res. Econ. 2001, 55, 61–82. [Google Scholar] [CrossRef]
  9. Borsch-Supan, A. Mind the Gap: The Effectiveness of Incentives to Boost Retirement Saving in Europe. Available online: https://ub-madoc.bib.uni-mannheim.de/2569/ (accessed on 5 August 2015).
  10. Borsch-Supan, A.H.; Wilke, C.B. Reforming the German Public Pension System. In Proceedings of Annual Meeting of the American Economic Association, Boston, MA, USA, 6 January 2006; pp. 2–3.
  11. Herrera, C. Long-Term Returns and Replacement Rates in Mexico’s Pension System. Available online: https://www.bbvaresearch.com/en/publicaciones/long-term-returns-and-replacement-rates-in-mexicos-pension-system/ (accessed on 5 August 2015).
  12. Kortleve, N.; Ponds, E. How to Close the Funding Gap in Dutch Pension Plans? Impact on Generations; Center for Retirement Research, Boston College: Boston, MA, USA, 2010. [Google Scholar]
  13. Yi, Z. Estimating the Impacts of Demographic and Policy Changes on Pension Deficit a Simple Method and Application to China. Available online: http://www.eaber.org/node/21822 (accessed on 5 August 2015).
  14. Disney, R. Declining public pensions in an era of demographic ageing: Will private provision fill the gap? Eur. Econ. Rev. 2000, 44, 957–973. [Google Scholar] [CrossRef]
  15. Hinz, R.; Holzmann, R.; Tuesta, D.; Takayama, N. Matching Contributions for Pensions: A Review of International Experience; World Bank: Washington, DC, USA, 2012. [Google Scholar]
  16. Willmore, L. Universal pensions for developing countries. World Dev. 2007, 35, 24–51. [Google Scholar] [CrossRef]
  17. The Report to the Eighteenth National Congress of the Communist Party of China’s pointed out, “by 2020, we should double its 2010 GDP and per capita income for both urban and rural residents.”

