
Assessment and Evolution of the Sustainable Development Ability of Human–Ocean Systems in Coastal Regions of China


Abstract
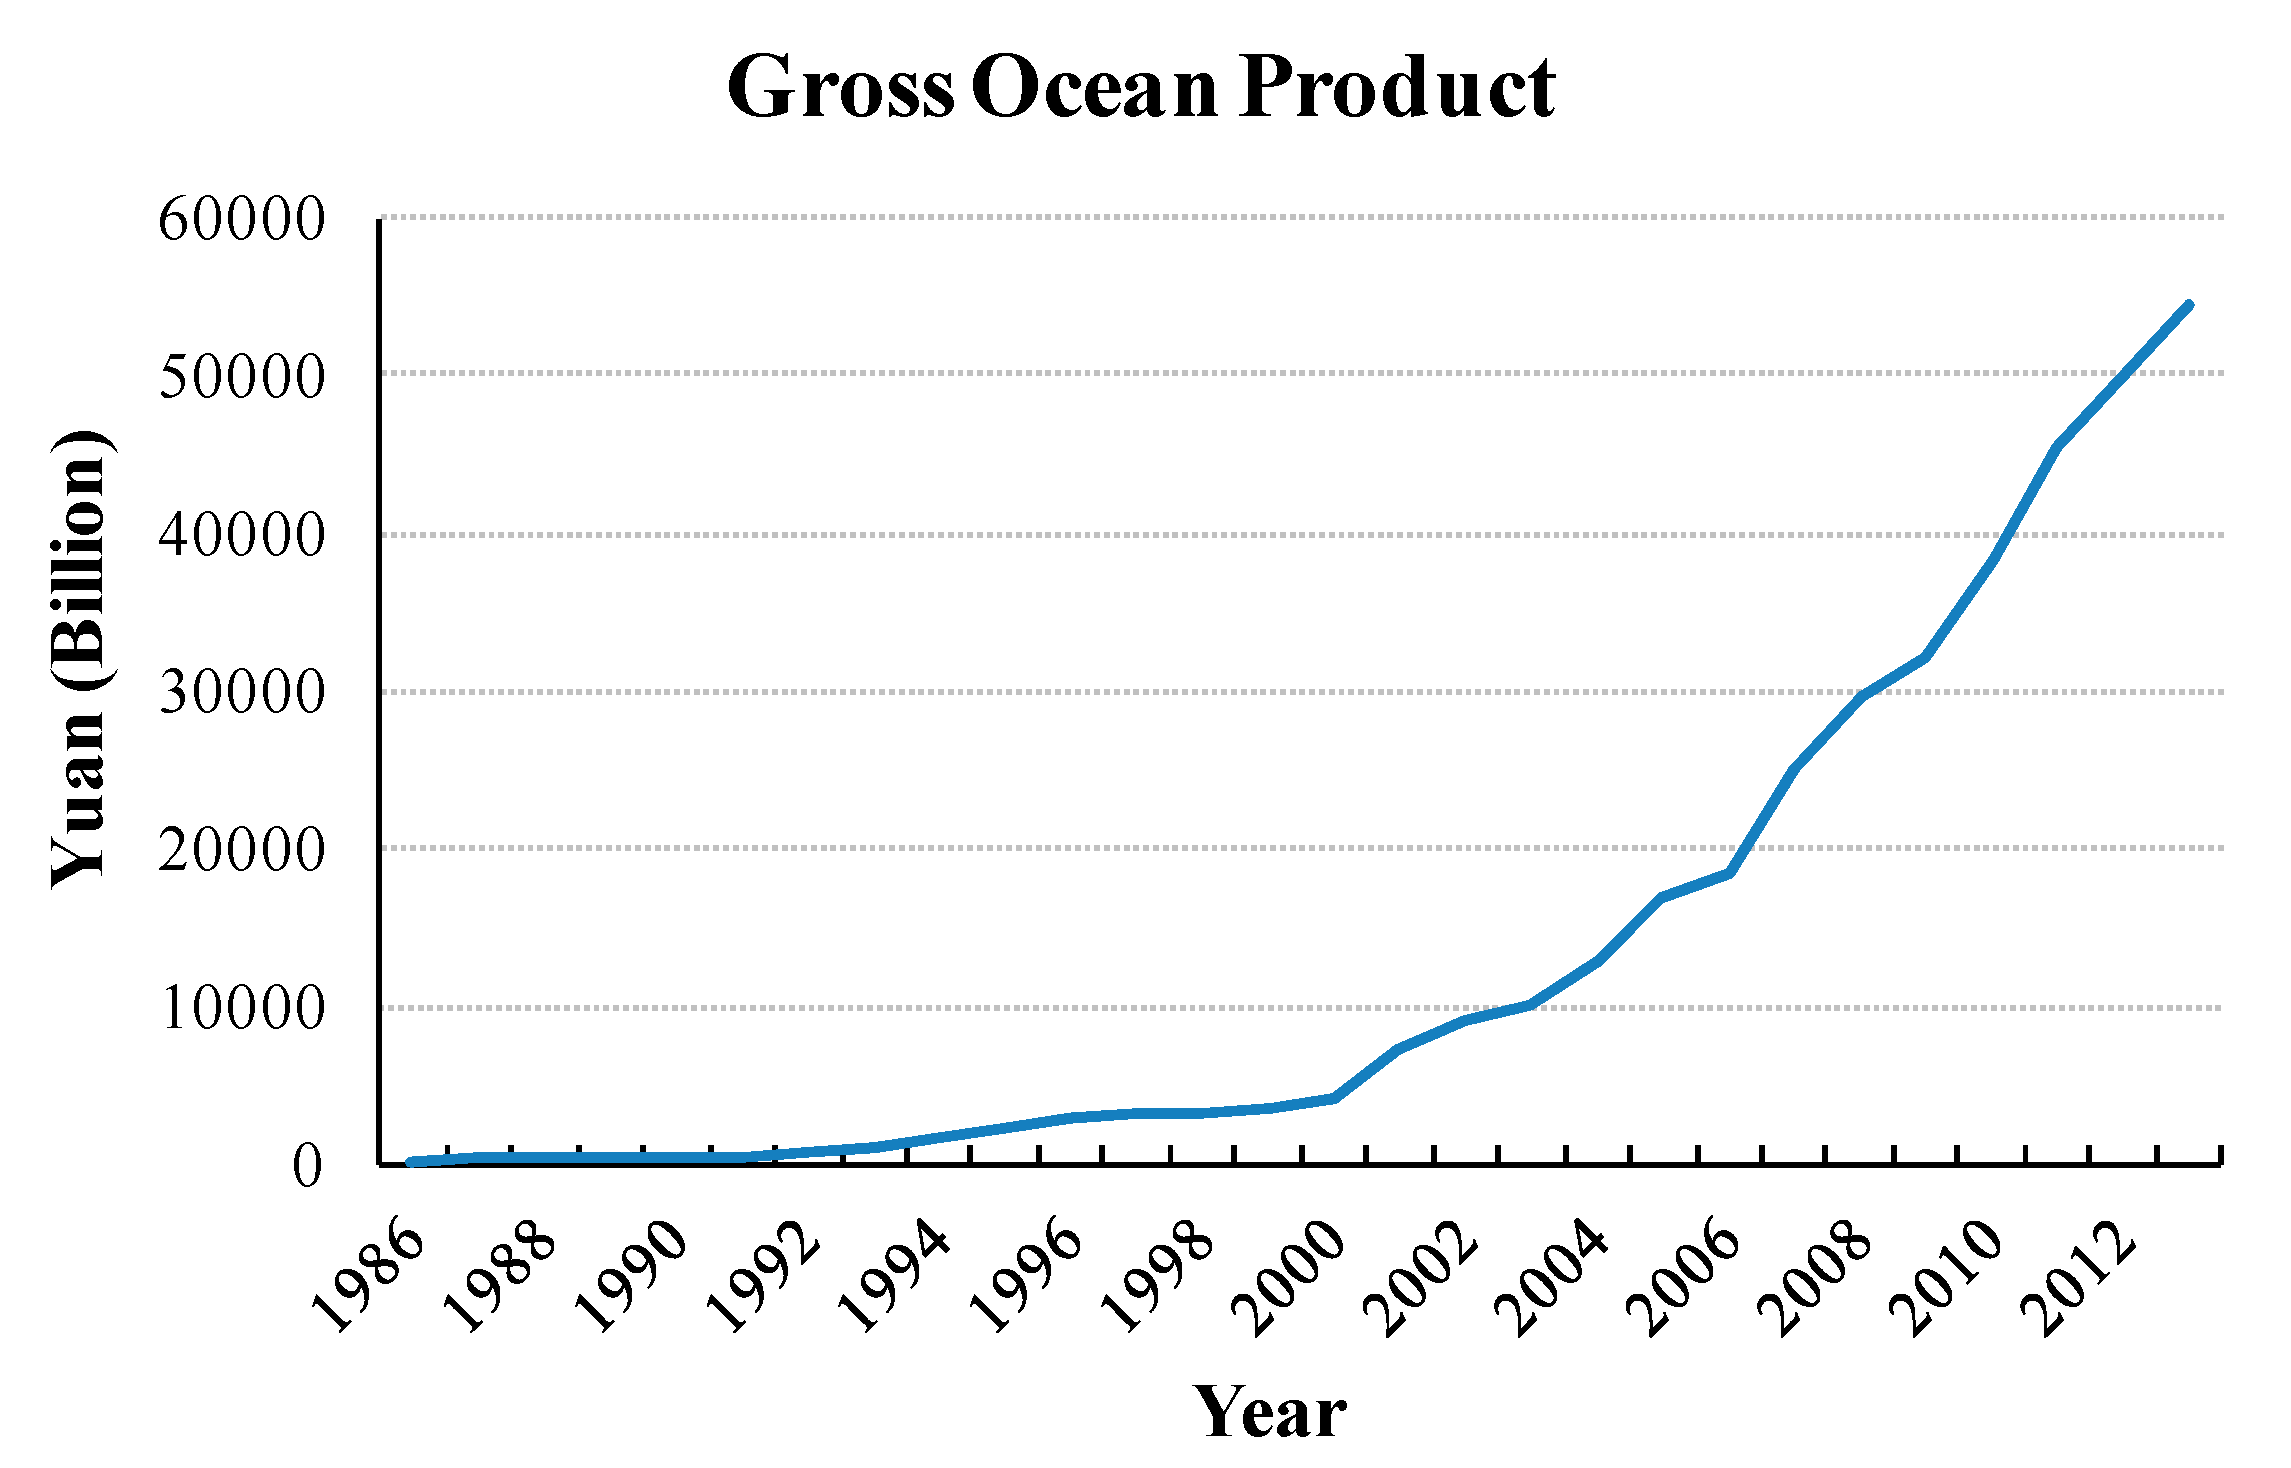
:1. Introduction
2. Research Paradigm
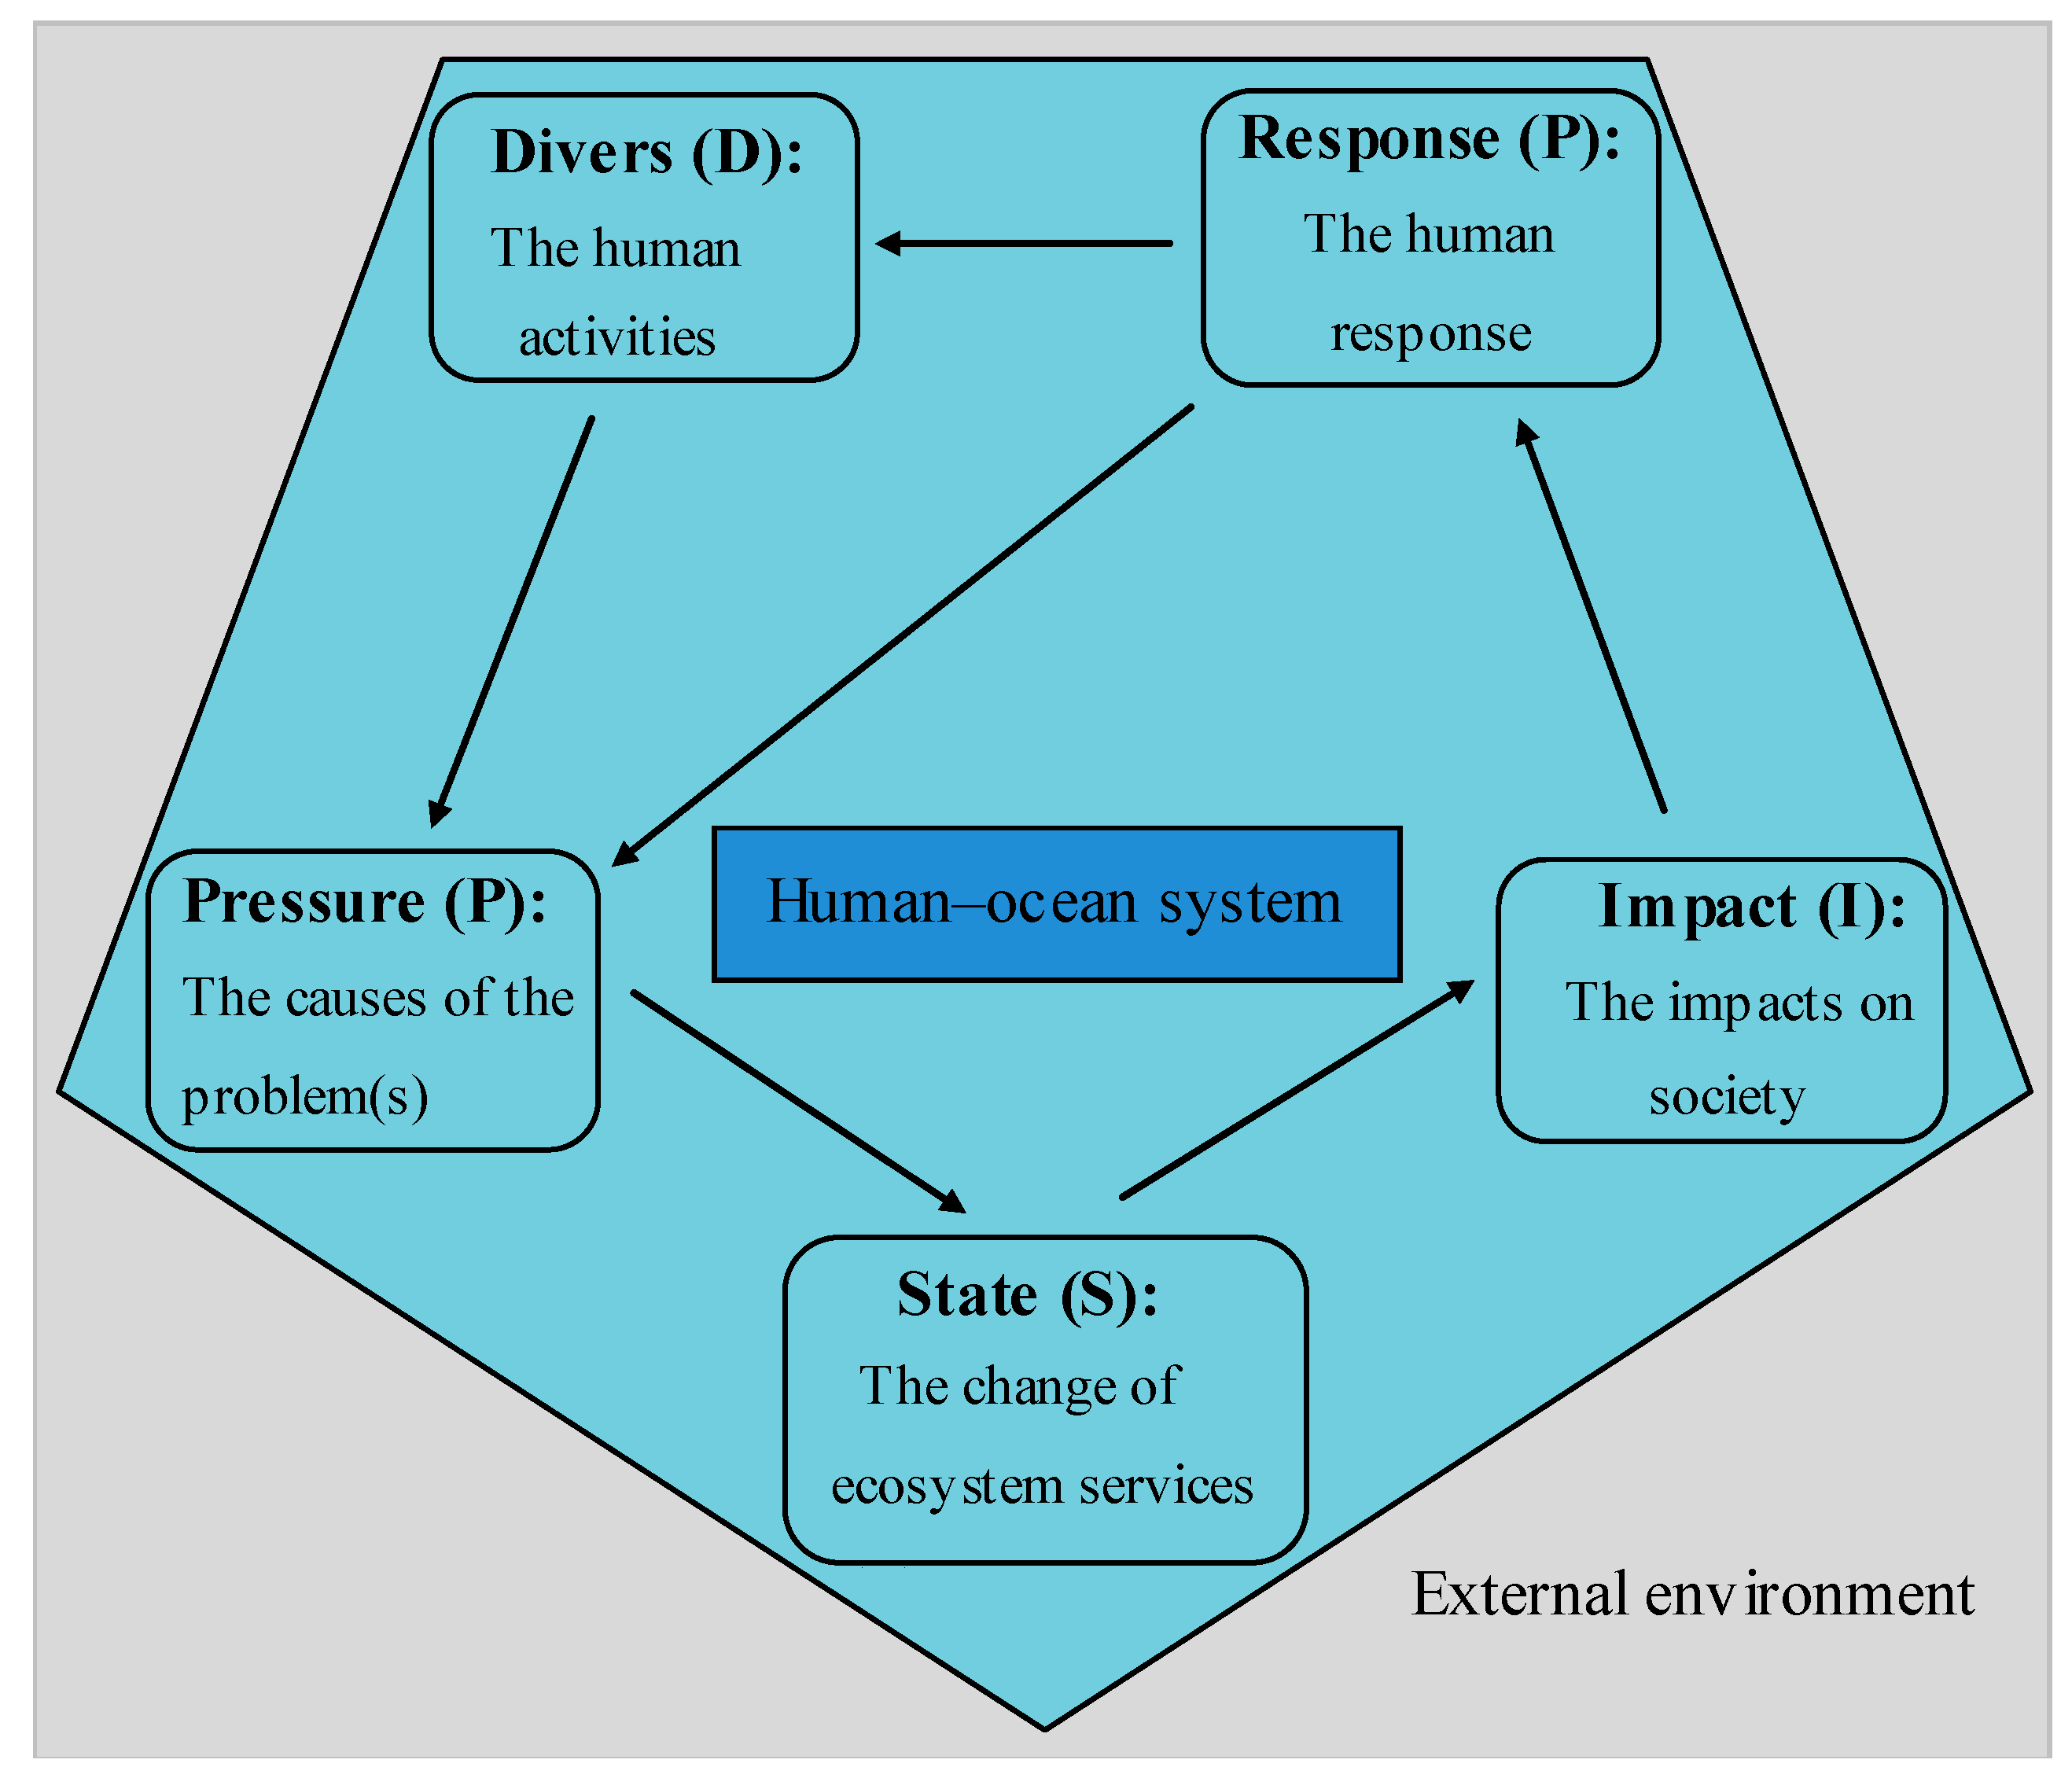
2.1. The Driver-Pressure-State-Impact-Response Framework Analysis of Human–Ocean Systems
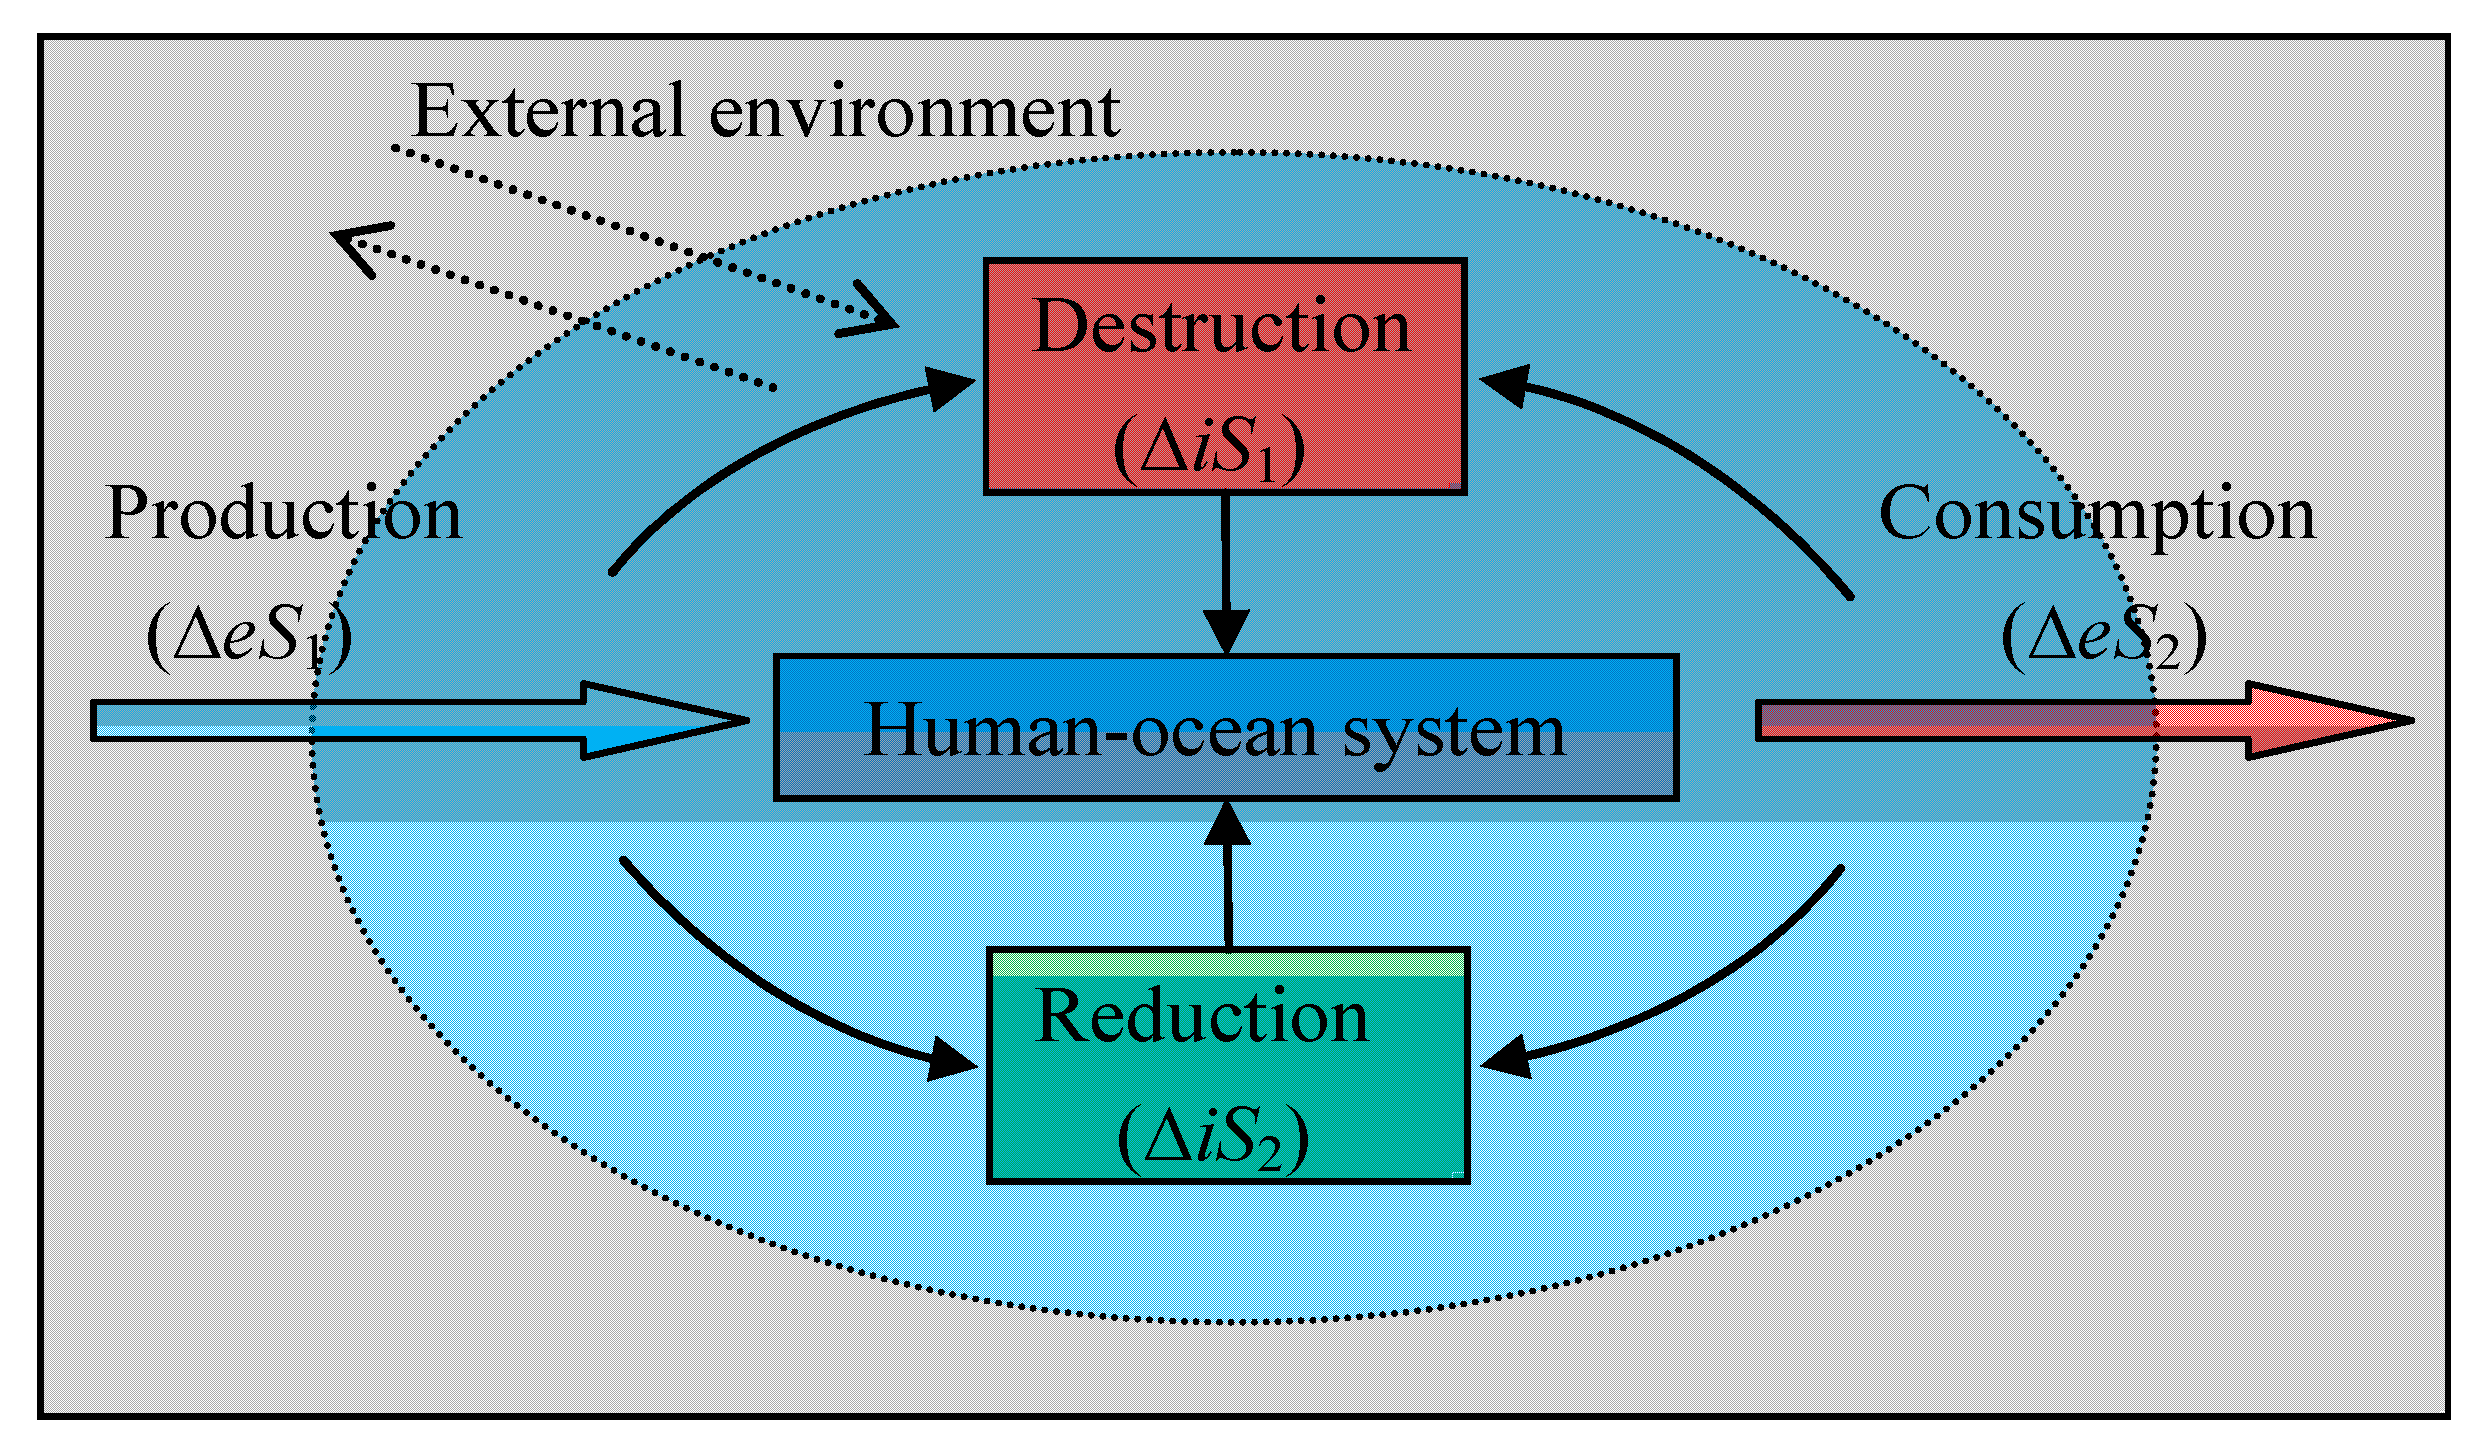
2.2. Entropy-Based Evolution of Human–Ocean Systems
2.3. Human–Ocean System Sustainable Development Ability Assessment and Its Evolution

3. Material and Methods
3.1. Design of the Evaluation Indicator System
3.1.1. Socio-Economic Subsystem

| Criterion | Sub-Criterion | Indicator | Units | Data Sources | Subjective | Objective | Integrated |
|---|---|---|---|---|---|---|---|
| Socio-economic subsystem | Entropy flow (deS): supportive entropy (ΔeS1) | S1 | yuan | [23] | 0.0641 | 0.0371 | 0.0608 |
| S2 | t | [23] | 0.0154 | 0.0227 | 0.0233 | ||
| S3 | t/ha | [23] | 0.0081 | 0.0136 | 0.0131 | ||
| S4 | ×104 t | [23] | 0.0209 | 0.0814 | 0.0514 | ||
| S5 | ×104 m3 | [23] | 0.0100 | 0.0913 | 0.0377 | ||
| S6 | t | [23] | 0.0052 | 0.1312 | 0.0326 | ||
| S7 | m | [23] | 0.0399 | 0.0579 | 0.0600 | ||
| S8 | US$ | [23] | 0.0553 | 0.0406 | 0.0591 | ||
| S9 | US$ | [23,57] | 0.0311 | 0.0441 | 0.0462 | ||
| Entropy flow (deS): consumptive entropy (ΔeS2) | C1 | % | [57] | 0.0061 | 0.0055 | 0.0072 | |
| C2 | person/km2 | [57] | 0.0151 | 0.0435 | 0.0320 | ||
| C3 | yuan | [57] | 0.0355 | 0.0227 | 0.0354 | ||
| C4 (-) | Tec/×104 yuan | [57] | 0.0255 | 0.0023 | 0.0096 | ||
| C5 | ha | [23] | 0.0209 | 0.0299 | 0.0312 | ||
| C6 | ha | [23] | 0.0104 | 0.0371 | 0.0245 | ||
| C7 | ×108 ton-km | [23] | 0.0625 | 0.0422 | 0.0641 | ||
| C8 | ×108 passenger-km | [23] | 0.0436 | 0.0341 | 0.0481 | ||
| C9 | unit | [23] | 0.0304 | 0.0145 | 0.0262 | ||
| Environmental subsystem | Entropy production (diS): destructive entropy (ΔiS2) | D1 (-) | t/×104 | [58] | 0.0752 | 0.0031 | 0.0191 |
| D2(-) | t/person | [58] | 0.0165 | 0.0036 | 0.0096 | ||
| D3(-) | ×104 cu.m | [58] | 0.0577 | 0.0033 | 0.0173 | ||
| D4(-) | t/×104 yuan | [58] | 0.0298 | 0.0025 | 0.0108 | ||
| D5(-) | t/×108 yuan | [58] | 0.0231 | 0.0018 | 0.0080 | ||
| D6(-) | t/×108 yuan | [58] | 0.0398 | 0.0035 | 0.0147 | ||
| D7(-) | ×108 yuan | [23] | 0.0080 | 0.0011 | 0.0038 | ||
| Entropy production (diS): reductive entropy (ΔiS1) | R1 | ×104 yuan | [58] | 0.0780 | 0.0415 | 0.0710 | |
| R2 | ×108 yuan | [58] | 0.0453 | 0.0228 | 0.0401 | ||
| R3 | person | [58] | 0.0311 | 0.0194 | 0.0306 | ||
| R4 | person | [23] | 0.0166 | 0.0171 | 0.0210 | ||
| R5 | unit | [23] | 0.0127 | 0.0139 | 0.0166 | ||
| R6 | km2 | [58] | 0.0077 | 0.0963 | 0.0340 | ||
| R7 | km2 | [23,58] | 0.0585 | 0.0185 | 0.0410 |
3.1.2. Environmental Subsystem
3.2. Assessment of Human–Ocean System Evolution based on the Information Entropy Model
3.3. Integrated Weighting Model of Human–Ocean System Sustainable Development Ability Assessment
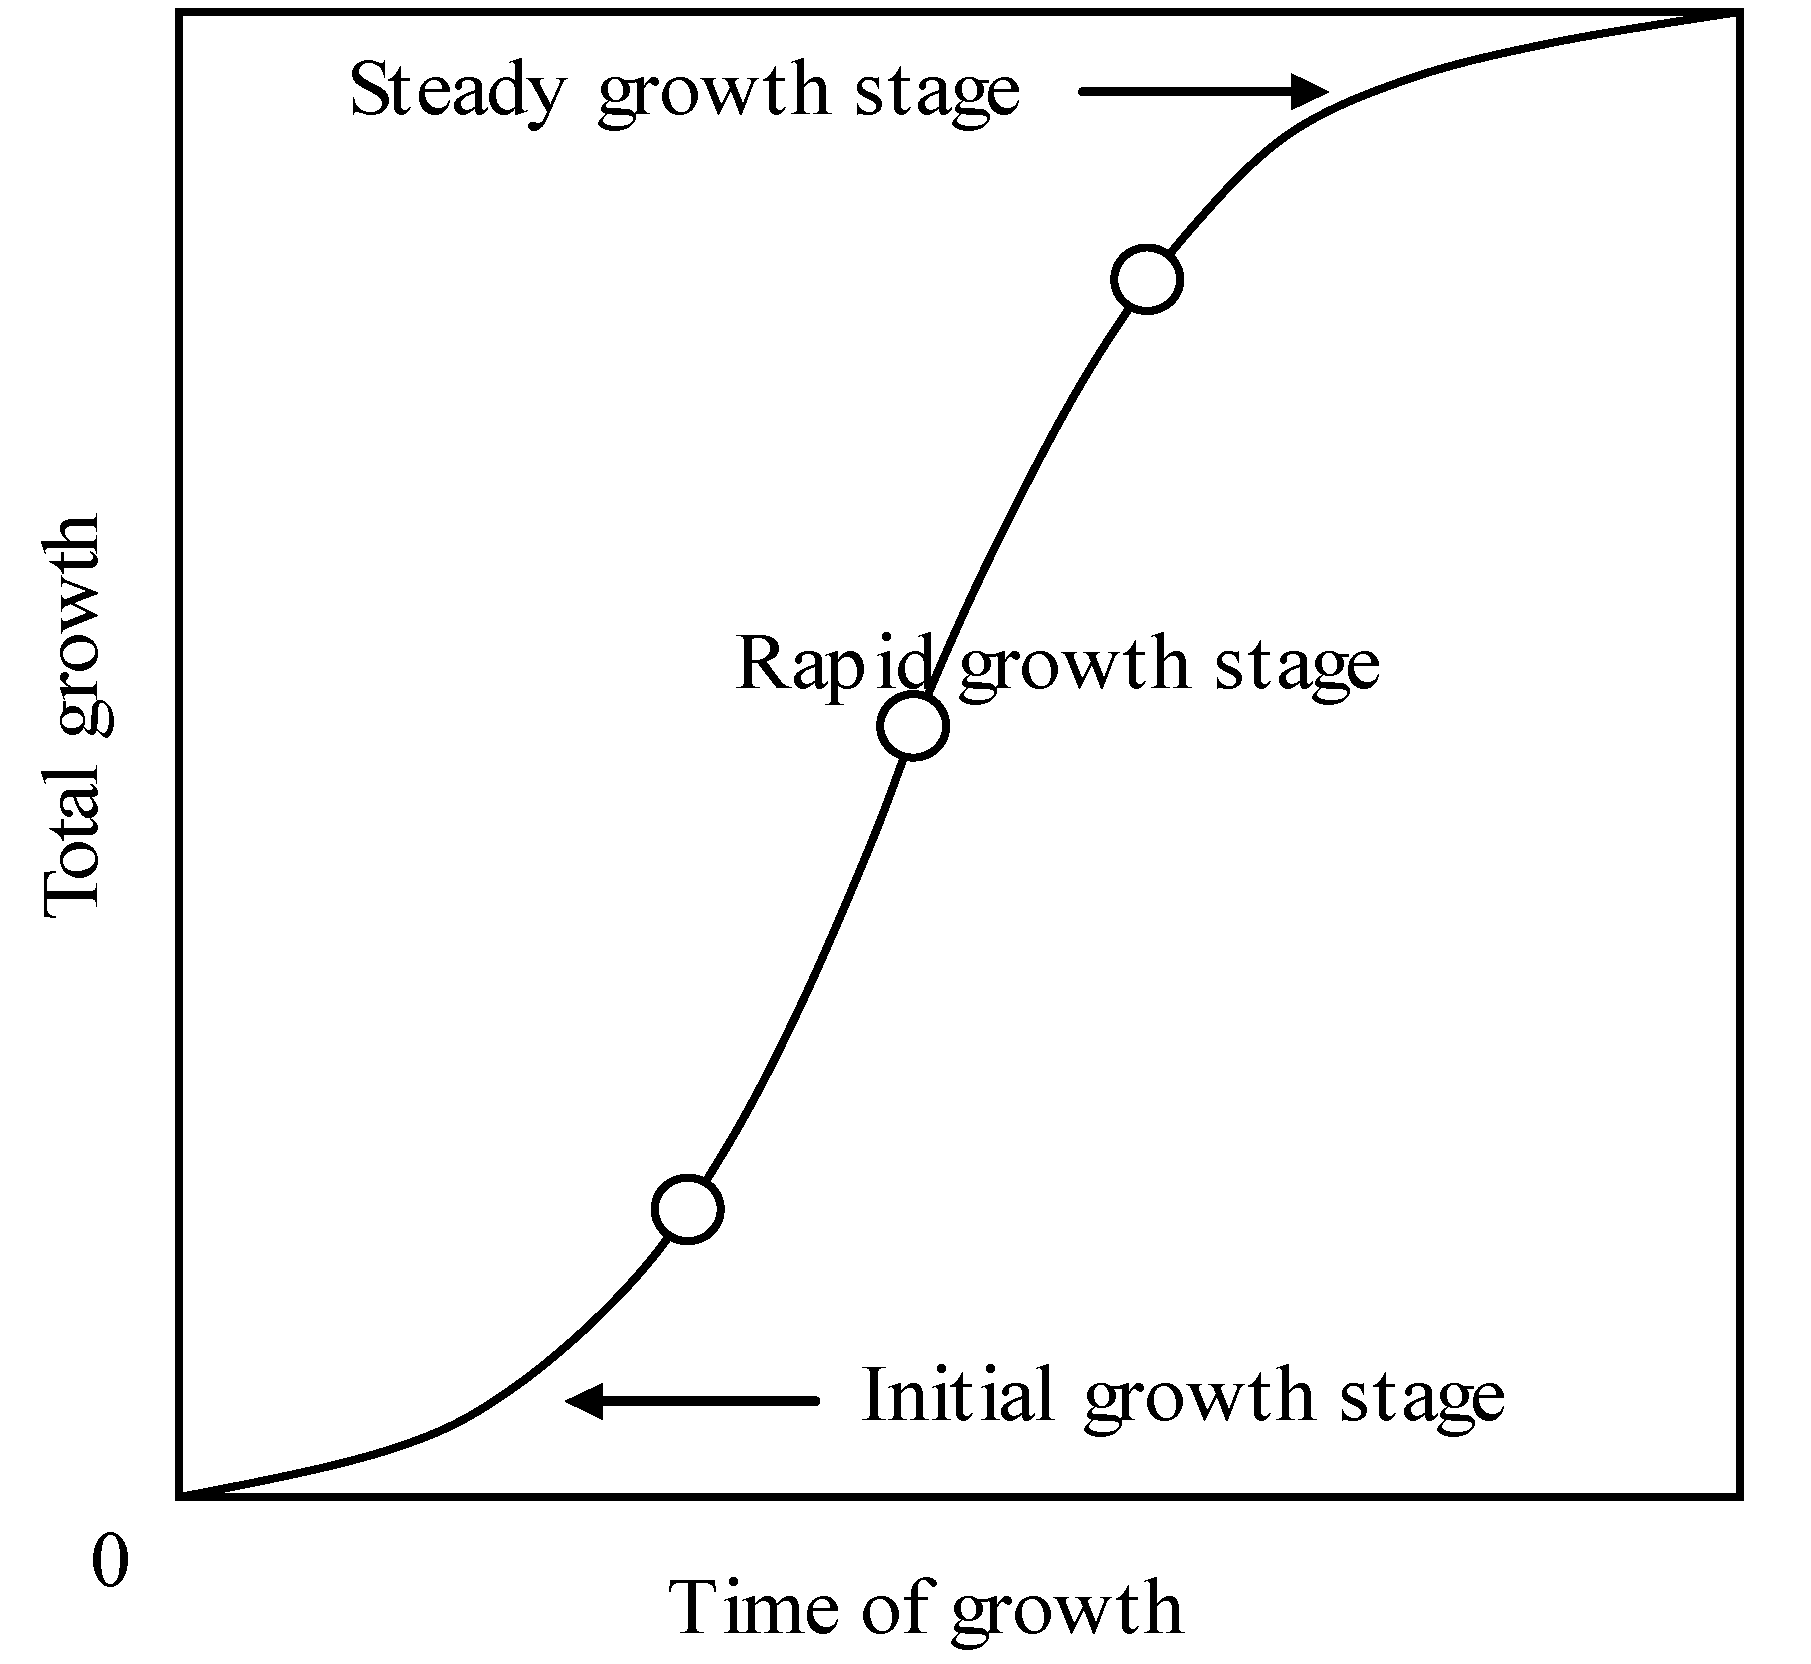
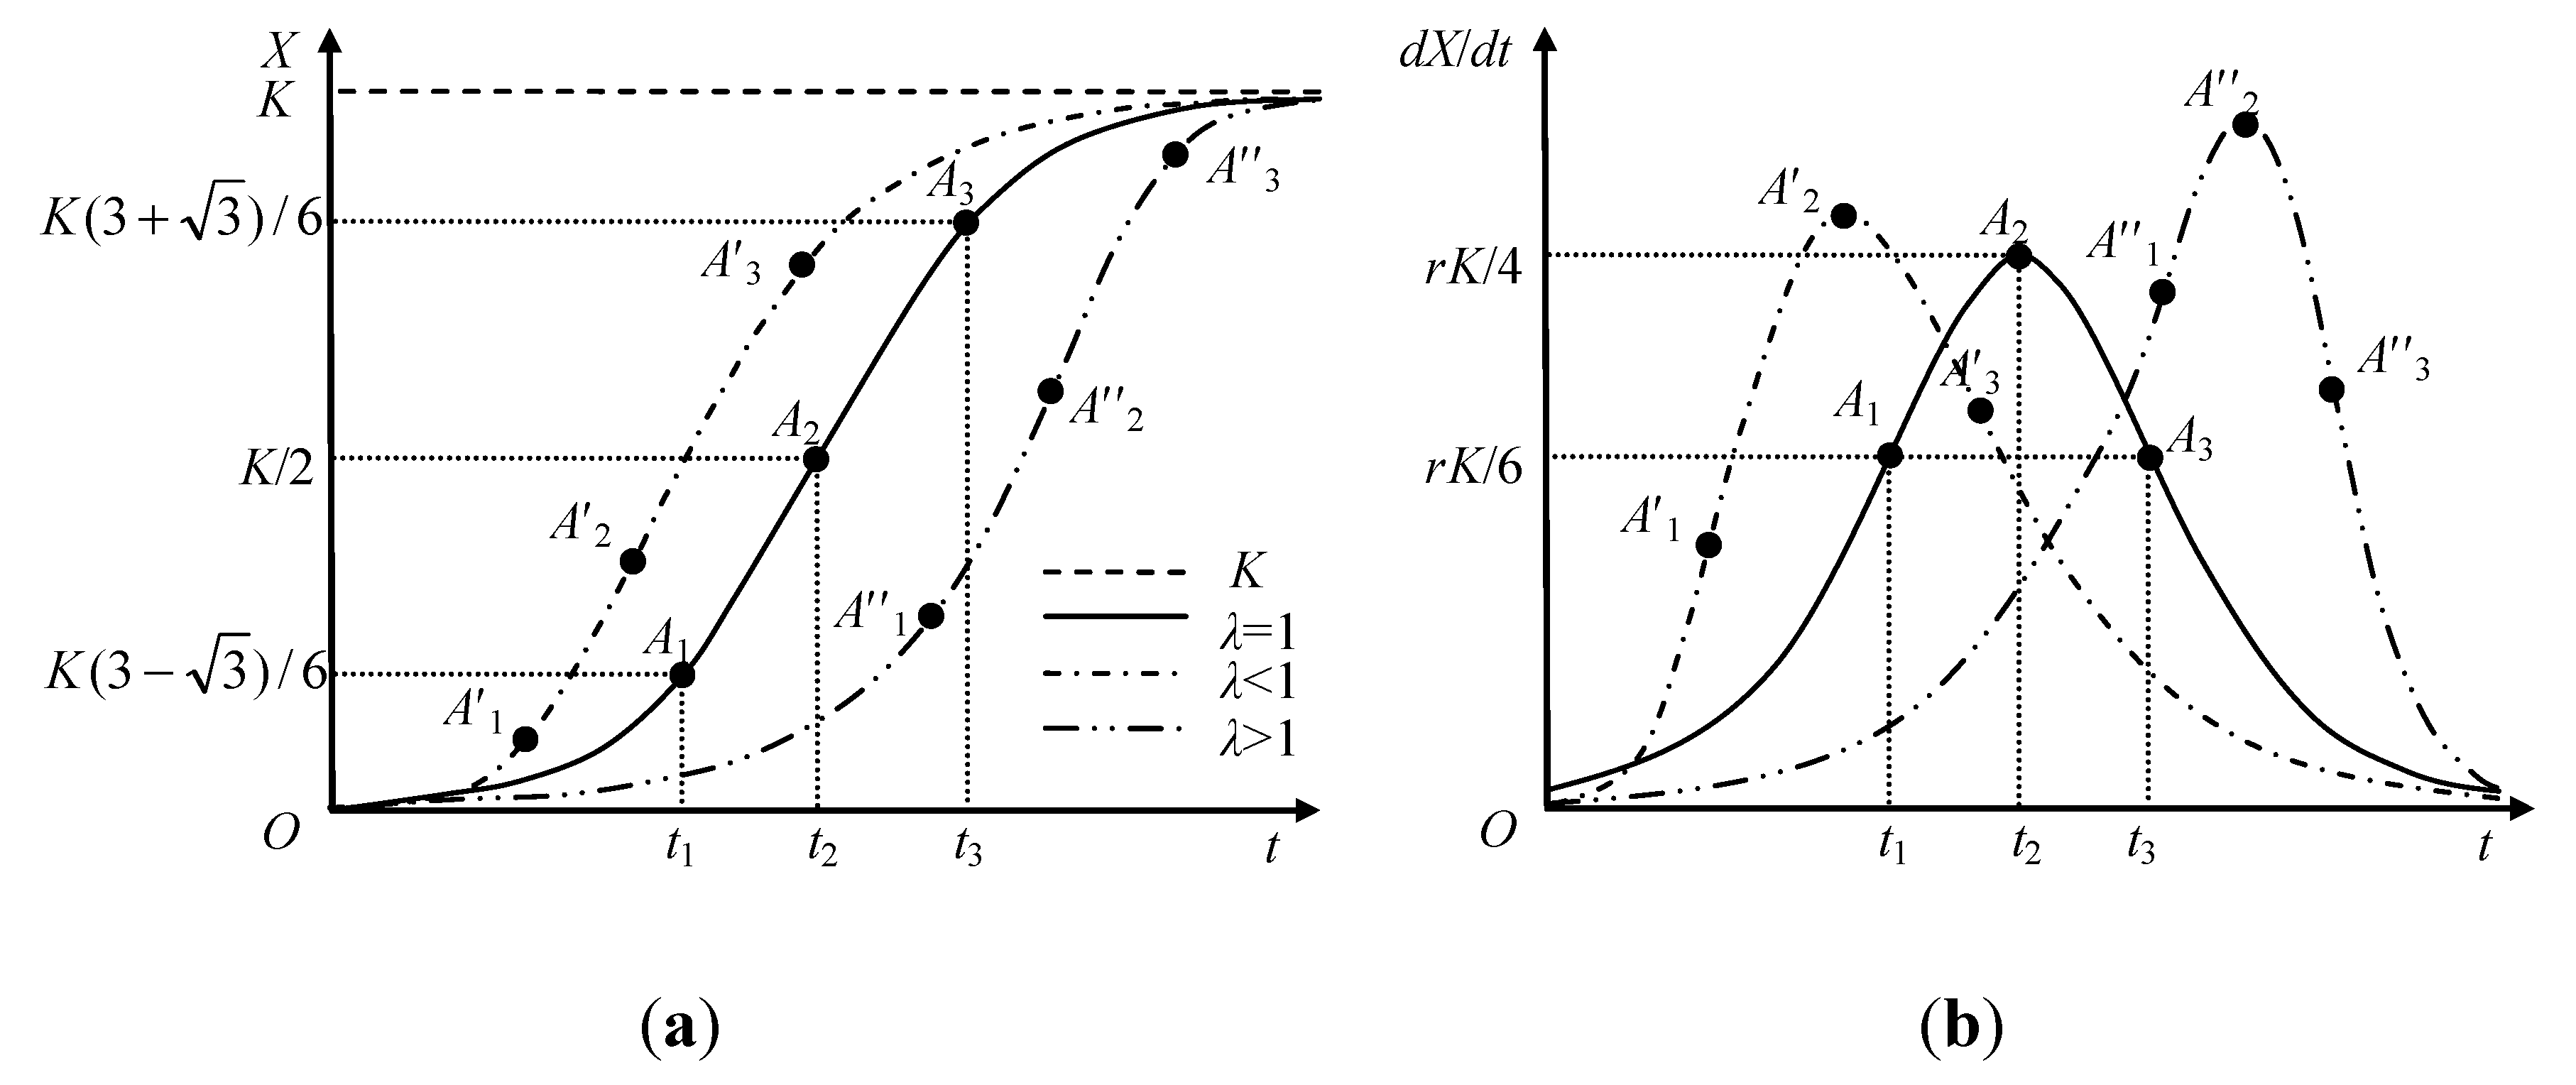
3.4. Analysis of Human–Ocean System Evolution based on the Richards Model

- (1)
- When λ = 1, the Richards curve is a logistic curve. The development index curve is centrosymmetrical, whose center is point A2. The development speed curve is symmetrical, showing that the speed of development is the same in the earlier and later periods. However, the condition of λ = 1 is theoretical and is not observed in practice.
- (2)
- When λ < 1, the speed of system development peaks earlier in the evolutionary process. Development speed is faster in the earlier period than in the later period, whereas the later period is of longer duration. The entire evolutionary process shows an initially quick then slow trend.
- (3)
- When λ > 1, initial development is slow and becomes faster toward the end, peaking relatively late in the evolutionary process, contrary to that observed when λ < 1.
| Point | t | X | dX/dt | Evolutionary Stage |
|---|---|---|---|---|
| (0, t1) | Slow growth | Uptrend | Germination | |
| A1 (A′1, A′′1) | t1 | (turning point) | ||
| (t1, t2) | Rapid growth | Uptrend | Growth | |
| A2 (A′2, A′′2) | t2 | (maximum) | ||
| (t2, t3) | Rapid growth | Downtrend | ||
| A3 (A′3, A′′3) | t3 | (turning point) | Maturity | |
| (t3, +∞) | Slow growth | Downtrend |
3.5. Data Sources and Processing
3.5.1. Data Sources
3.5.2. Data Processing
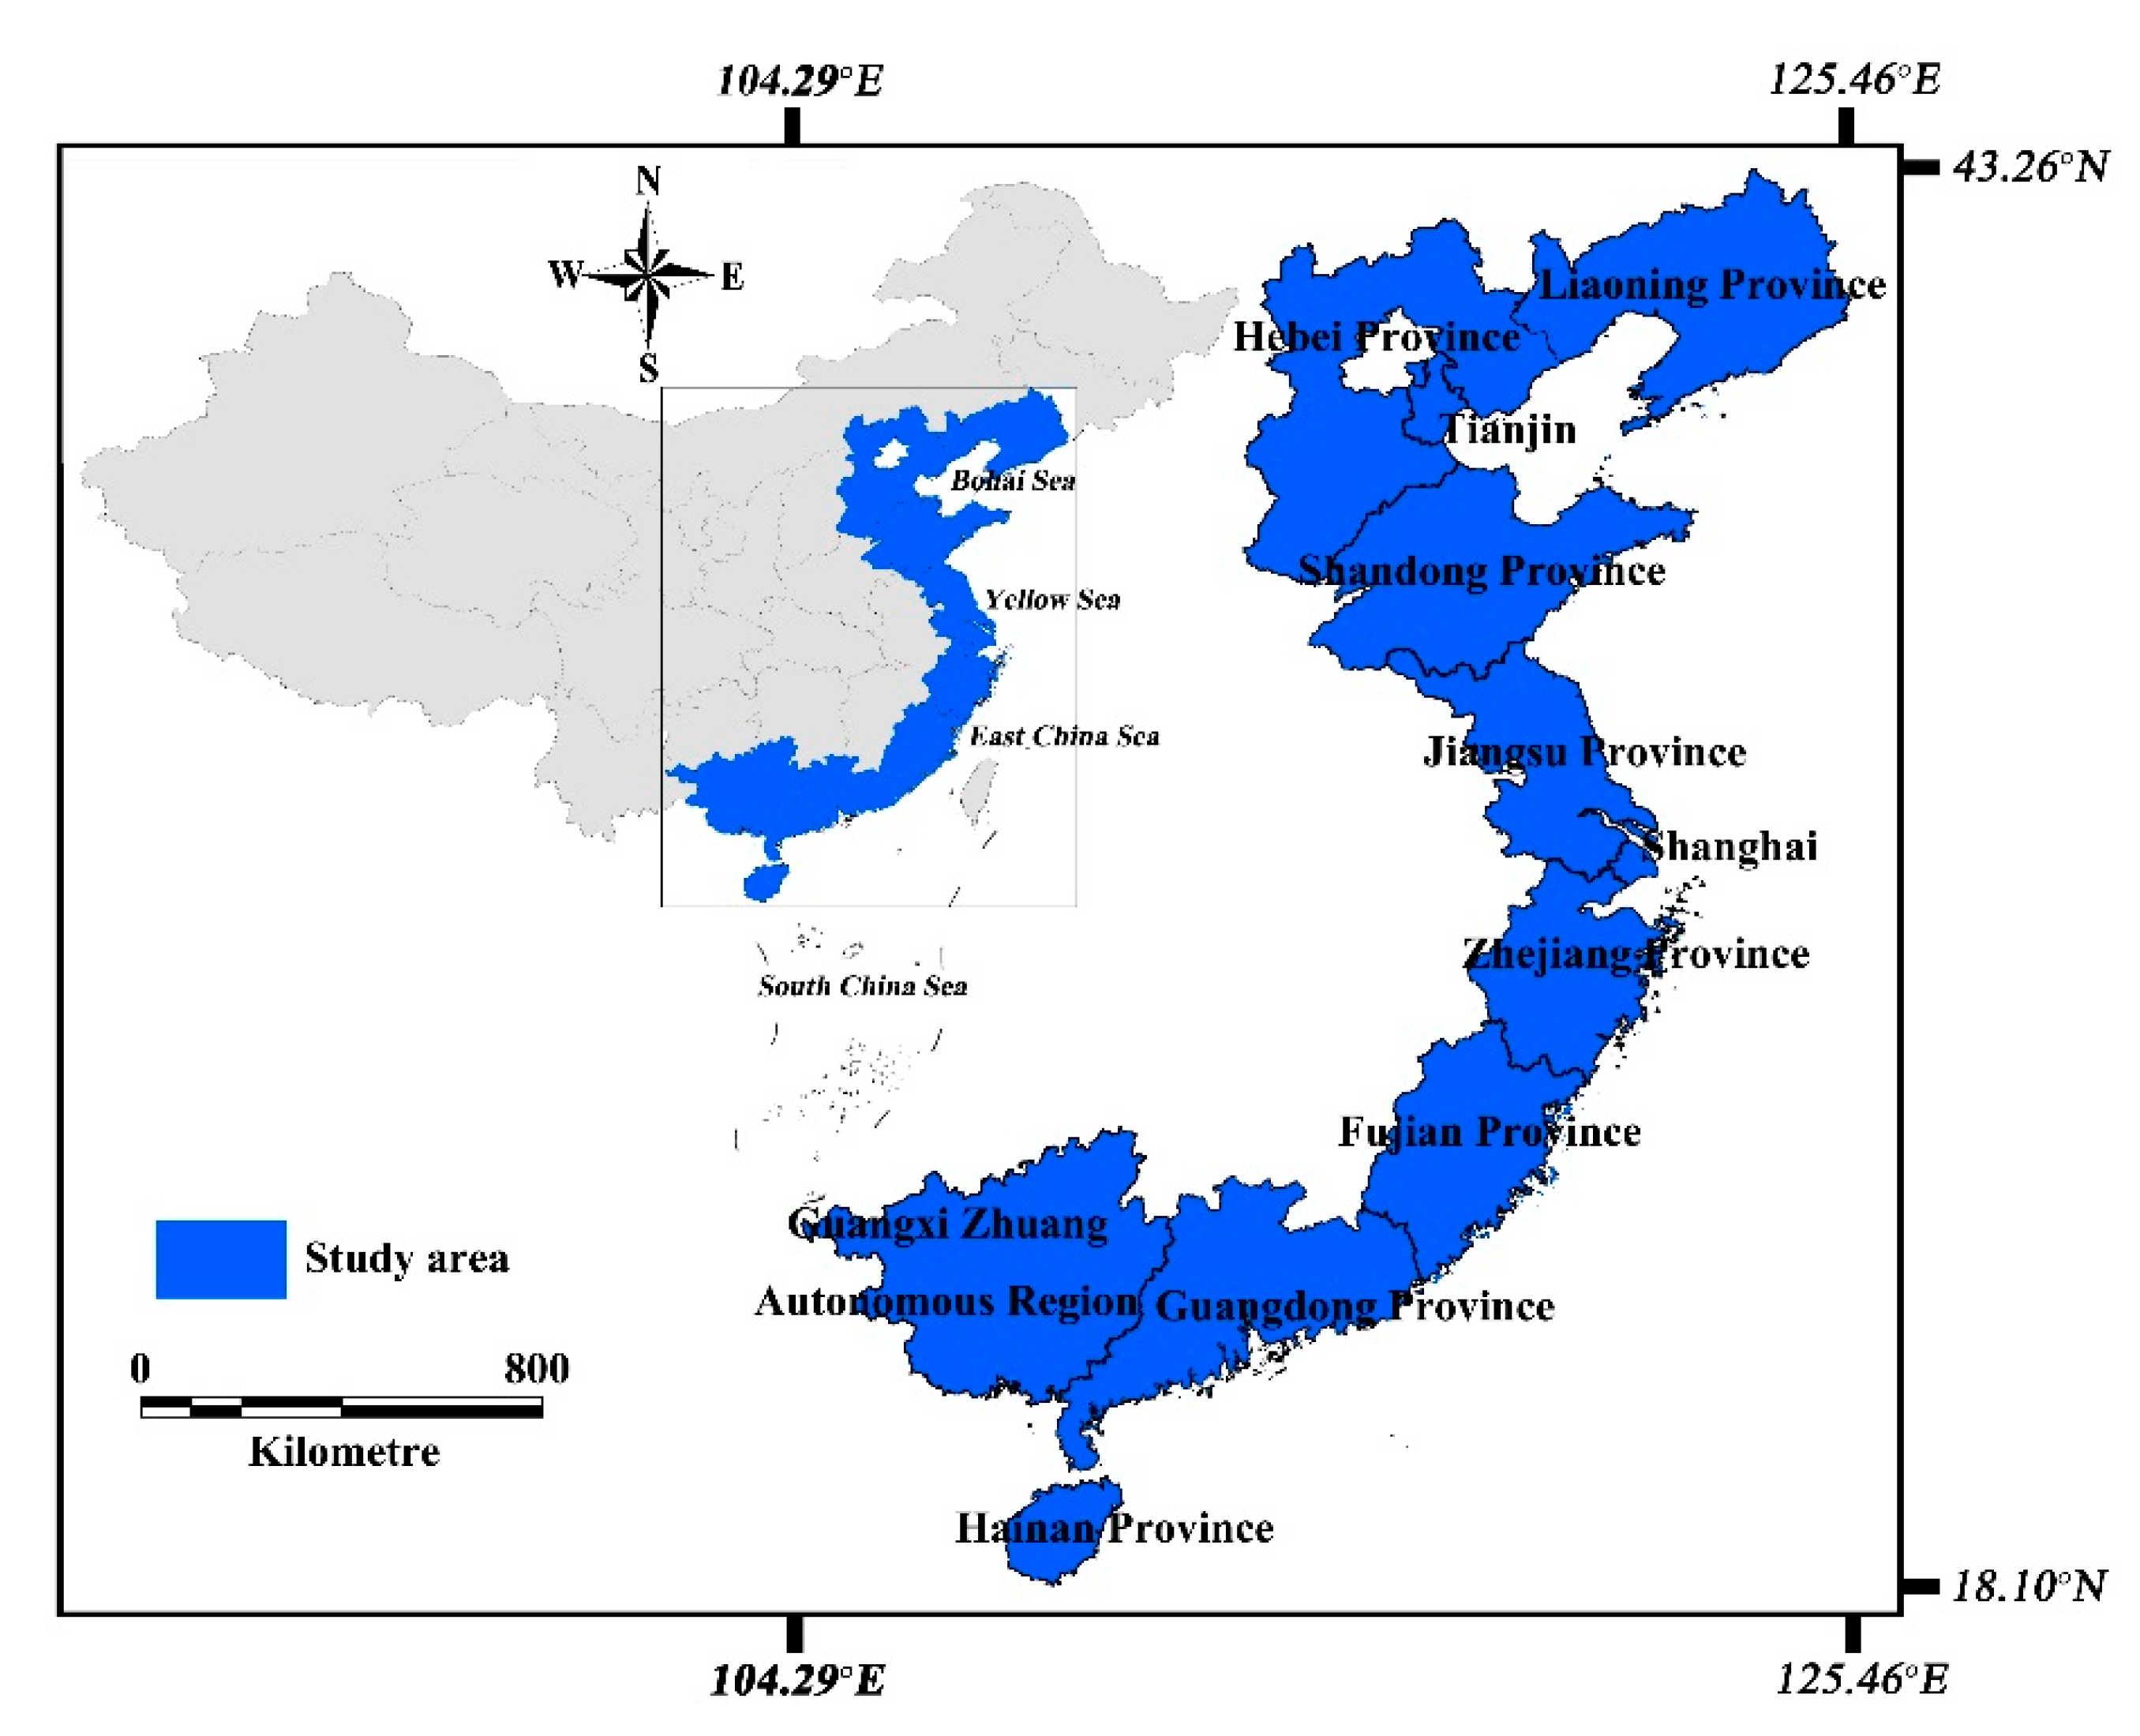
3.6. Study Area

4. Results
4.1. Information Entropy-Based Analysis
4.1.1. Four Types of Entropy

4.1.2. Entropy Flow, Entropy Production, and Total Entropy Change

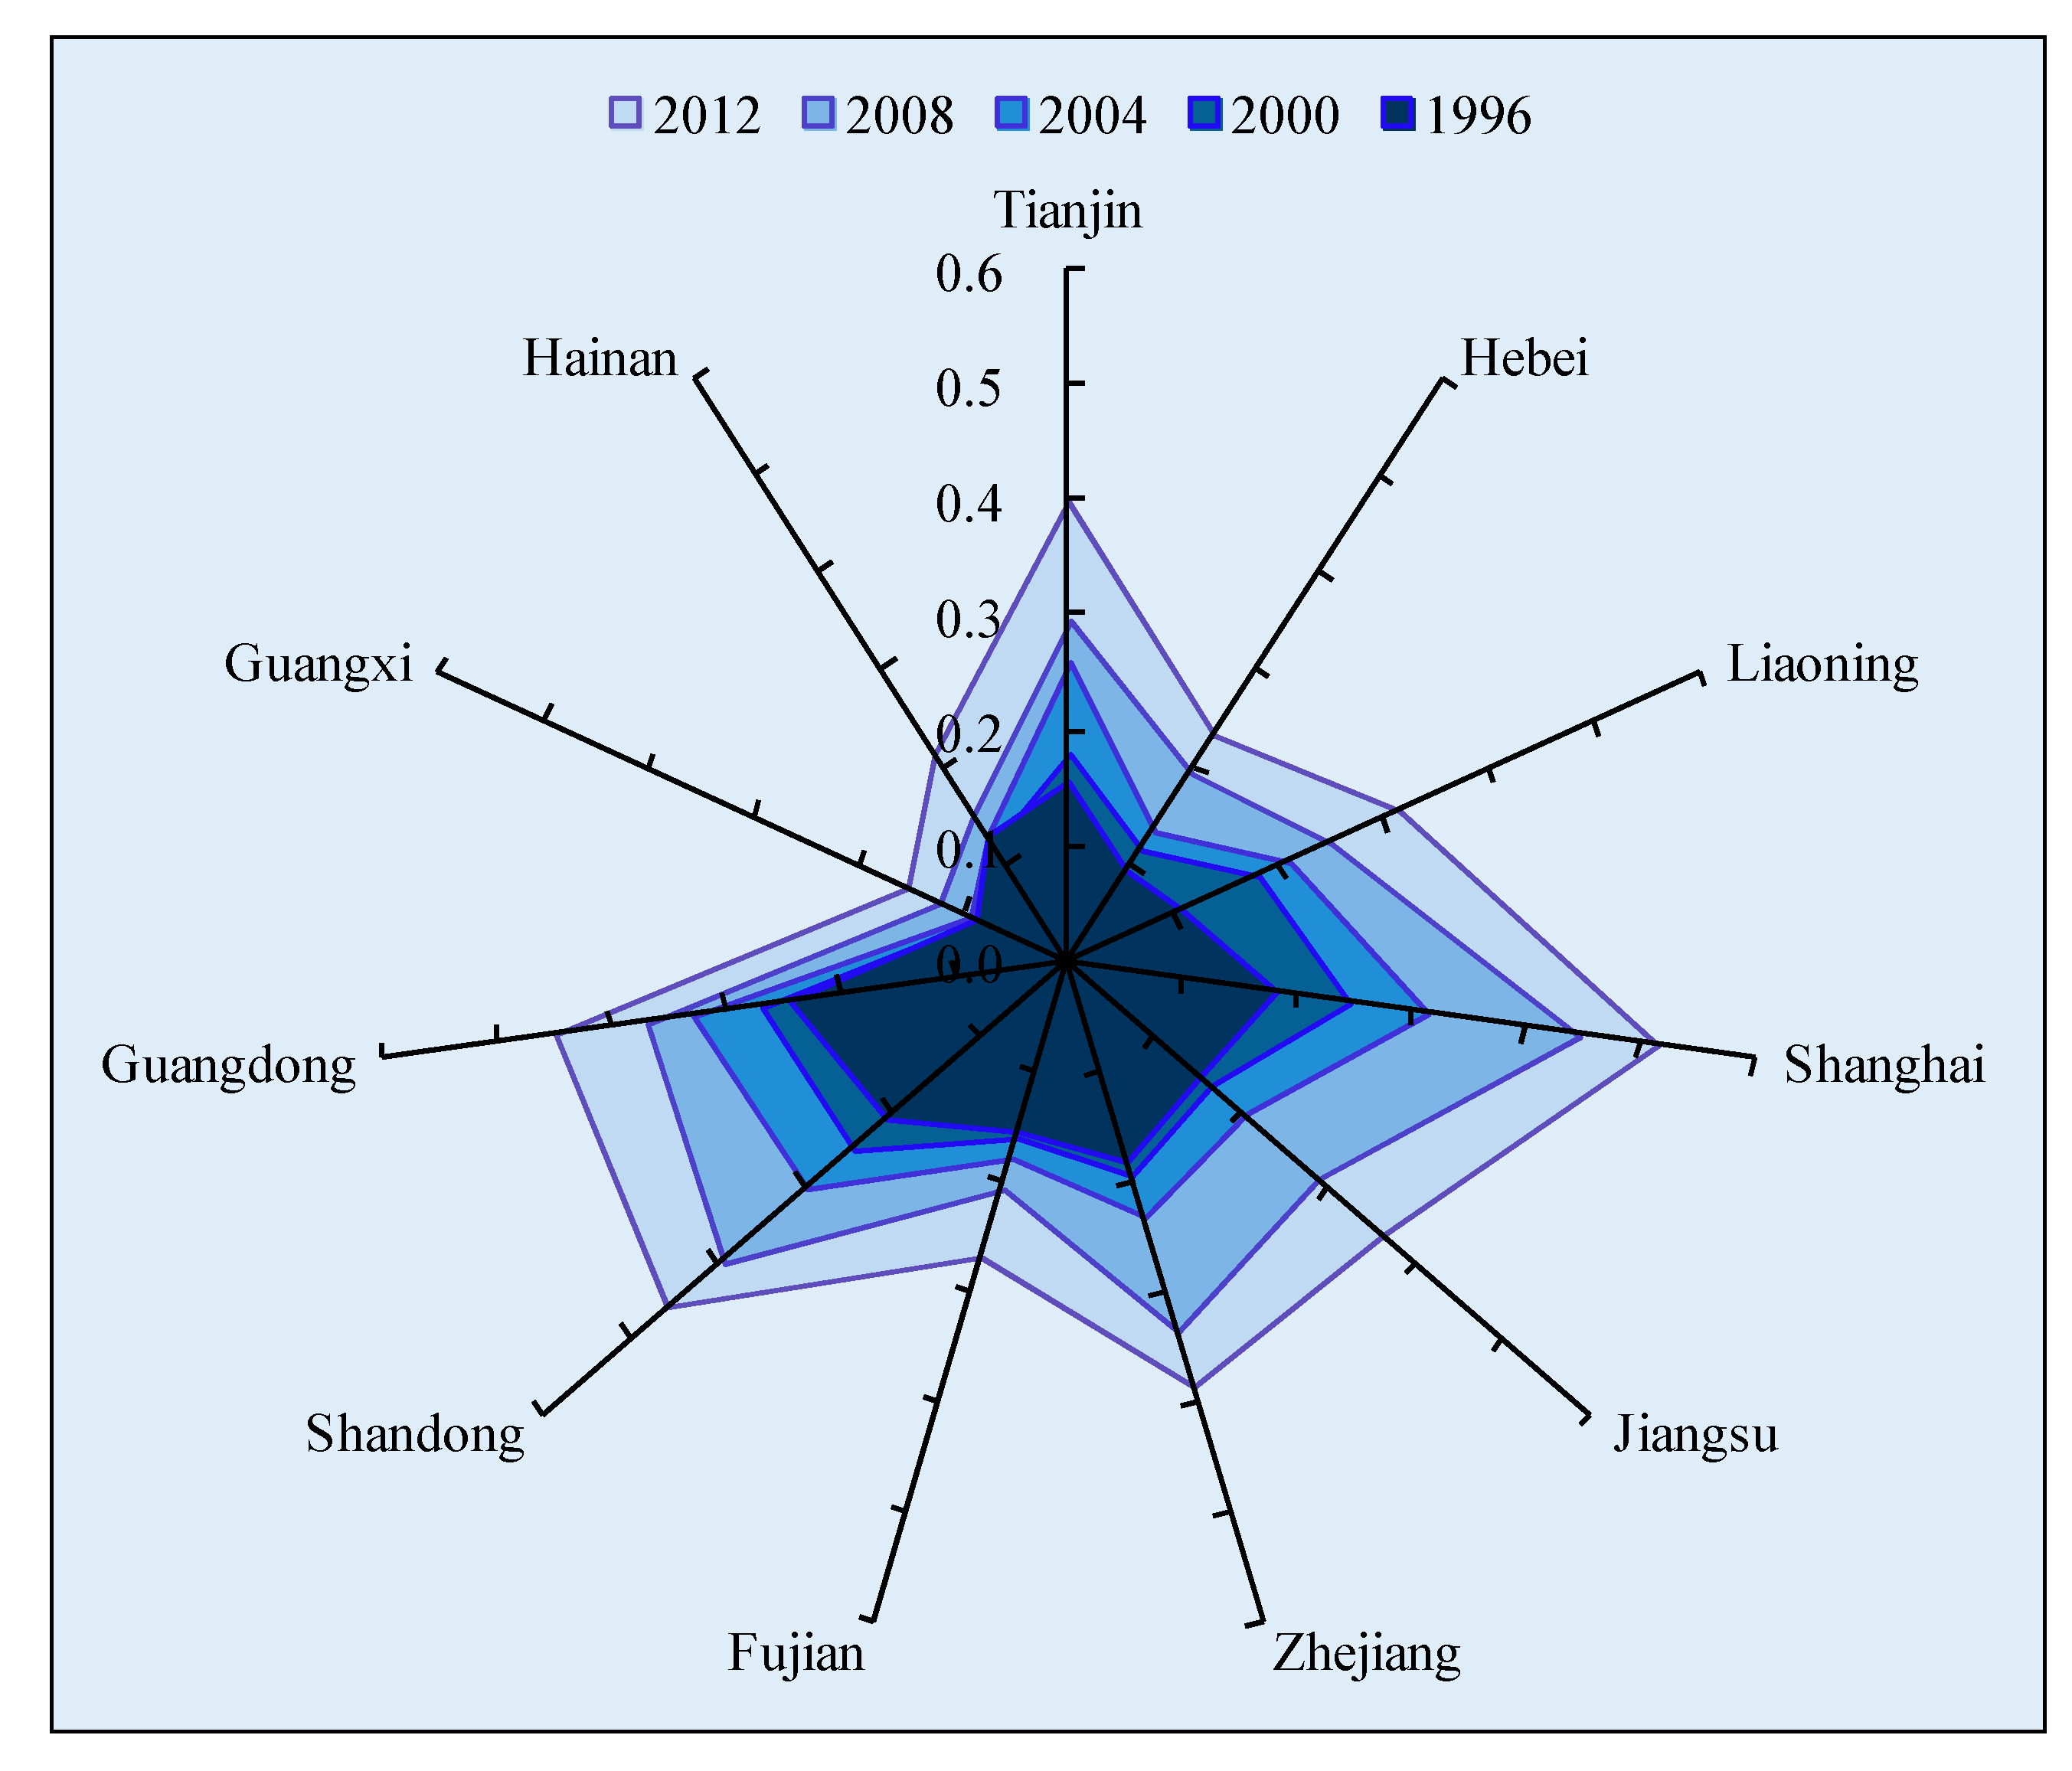
4.2. Sustainable Development Ability of the Human–Ocean System
4.3. Analysis of Human–Ocean System Evolution based on the Richards Model
| Region | r | λ | R-Squared | Evolution Curve | Development Speed |
|---|---|---|---|---|---|
| Tianjin | 0.0611 | 0.5448 | 0.9504 | Steep at first, smooth later | Quick at first, slow later |
| Hebei | 0.0592 | 0.8612 | 0.9754 | Steep at first, smooth later | Quick at first, slow later |
| Liaoning | 0.0694 | 0.6312 | 0.9238 | Steep at first, smooth later | Quick at first, slow later |
| Shanghai | 0.0671 | 0.2571 | 0.9564 | Steeper at first, smoother later | Quicker at first, slower later |
| Jiangsu | 0.0560 | 0.7790 | 0.9040 | Steep at first, smooth later | Quick at first, slow later |
| Zhejiang | 0.0487 | 0.5962 | 0.8826 | Steep at first, smooth later | Quick at first, slow later |
| Fujian | 0.0356 | 0.9808 | 0.8502 | Steep at first, smooth later | Quick at first, slow later |
| Shandong | 0.0509 | 0.3190 | 0.9693 | Steeper at first, smoother later | Quicker at first, slower later |
| Guangdong | 0.0389 | 0.4273 | 0.8957 | Steeper at first, smoother later | Quicker at first, slower later |
| Guangxi | 0.0355 | 1.0647 | 0.8211 | Smooth at first, steep later | Slow at first, quick later |
| Hainan | 0.0323 | 1.0933 | 0.7572 | Smooth at first, steep later | Slow at first, quick later |
| Region | R1 | R2 | At1996 | At1 | At2 | At3 | At2012 | Evolutionary Period |
|---|---|---|---|---|---|---|---|---|
| Tianjin | 3.2358 | 0.3090 | 0.1549 | 0.1548 | 0.4501 | 0.7515 | 0.3999 | Growth |
| Hebei | 3.5820 | 0.2792 | 0.0931 | 0.1951 | 0.4861 | 0.7787 | 0.2337 | Germination to growth |
| Liaoning | 3.3310 | 0.3002 | 0.1075 | 0.1663 | 0.4606 | 0.7596 | 0.3147 | Germination to growth |
| Shanghai | 2.9139 | 0.3432 | 0.1823 | 0.1136 | 0.4107 | 0.7197 | 0.5150 | Growth to maturity |
| Jiangsu | 3.4927 | 0.2863 | 0.1512 | 0.1851 | 0.4774 | 0.7722 | 0.3622 | Germination to growth |
| Zhejiang | 3.2925 | 0.3037 | 0.1802 | 0.1617 | 0.4564 | 0.7564 | 0.3857 | Growth |
| Fujian | 3.7114 | 0.2694 | 0.1532 | 0.2091 | 0.4981 | 0.7873 | 0.2683 | Growth |
| Shandong | 2.9839 | 0.3351 | 0.2076 | 0.1229 | 0.4198 | 0.7273 | 0.4592 | Growth to maturity |
| Guangdong | 3.1053 | 0.3220 | 0.2433 | 0.1386 | 0.4349 | 0.7395 | 0.4480 | Growth to maturity |
| Guangxi | 3.8017 | 0.2630 | 0.0874 | 0.2186 | 0.5061 | 0.7930 | 0.1529 | Germination |
| Hainan | 3.8324 | 0.2609 | 0.1287 | 0.2218 | 0.5088 | 0.7949 | 0.2141 | Germination |
5. Discussion and Conclusions
Acknowledgments
Author Contributions
Conflicts of Interest
Appendix A
| S1 | S2 | S3 | S4 | S5 | S6 | S7 | S8 | S9 | |
|---|---|---|---|---|---|---|---|---|---|
| S1 | 1.0000 | −0.1512 | −0.0422 | 0.4263 | 0.2184 | 0.0771 | 0.7776 | 0.8446 | 0.8356 |
| S2 | 1.0000 | 0.4544 | −0.0401 | 0.1113 | 0.2026 | −0.4262 | −0.2065 | −0.1966 | |
| S3 | 1.0000 | 0.0948 | −0.1938 | 0.1307 | −0.2282 | −0.3266 | −0.3448 | ||
| S4 | 1.0000 | 0.7070 | −0.1146 | 0.2691 | 0.3018 | 0.2825 | |||
| S5 | 1.0000 | −0.1026 | 0.1297 | 0.3800 | 0.3472 | ||||
| S6 | 1.0000 | −0.0991 | 0.0676 | 0.0314 | |||||
| S7 | 1.0000 | 0.8020 | 0.8114 | ||||||
| S8 | 1.0000 | 0.8990 | |||||||
| S9 | 1.0000 |
| C1 | C2 | C3 | C4 | C5 | C6 | C7 | C8 | C9 | |
|---|---|---|---|---|---|---|---|---|---|
| C1 | 1.0000 | −0.6077 | −0.3763 | −0.1458 | −0.1489 | −0.1016 | −0.4840 | −0.0455 | −0.2104 |
| C2 | 1.0000 | 0.6513 | −0.1748 | −0.2861 | −0.1496 | 0.7623 | −0.0201 | 0.0870 | |
| C3 | 1.0000 | −0.5269 | 0.0176 | −0.1723 | 0.8250 | 0.1861 | 0.4934 | ||
| C4 | 1.0000 | 0.0632 | 0.3398 | −0.3135 | −0.1174 | −0.3040 | |||
| C5 | 1.0000 | 0.5192 | −0.0567 | 0.5686 | 0.5520 | ||||
| C6 | 1.0000 | −0.1097 | 0.1510 | 0.4362 | |||||
| C7 | 1.0000 | 0.0963 | 0.2602 | ||||||
| C8 | 1.0000 | 0.4124 | |||||||
| C9 | 1.0000 |
| D1 | D2 | D3 | D4 | D5 | D6 | D7 | |
|---|---|---|---|---|---|---|---|
| D1 | 1.0000 | −0.0383 | 0.0198 | −0.0246 | 0.0746 | 0.2330 | 0.1096 |
| D2 | 1.0000 | −0.3556 | −0.4490 | −0.4549 | −0.4317 | −0.0243 | |
| D3 | 1.0000 | 0.6076 | 0.5512 | 0.8396 | −0.2352 | ||
| D4 | 1.0000 | 0.8933 | 0.6003 | −0.0920 | |||
| D5 | 1.0000 | 0.6083 | −0.1161 | ||||
| D6 | 1.0000 | −0.1396 | |||||
| D7 | 1.0000 |
| R1 | R2 | R3 | R4 | R5 | R6 | R7 | |
|---|---|---|---|---|---|---|---|
| R1 | 1.0000 | 0.5654 | 0.5446 | 0.2377 | −0.1835 | −0.0710 | 0.2470 |
| R2 | 1.0000 | 0.6560 | 0.4196 | −0.1400 | −0.0795 | 0.4340 | |
| R3 | 1.0000 | 0.3073 | −0.2943 | −0.1339 | 0.1977 | ||
| R4 | 0.3073 | 1.0000 | 0.0993 | −0.0656 | 0.3542 | ||
| R5 | 1.0000 | 0.2758 | −0.0615 | ||||
| R6 | 1.0000 | −0.1432 | |||||
| R7 | 1.0000 |
Appendix B
| S1 | S2 | S3 | S4 | S5 | S6 | S7 | S8 | S9 | Weight | |
|---|---|---|---|---|---|---|---|---|---|---|
| S1 | 1 | 4 | 5 | 3 | 6 | 7 | 2 | 2 | 3 | 0.0641 |
| S2 | 1 | 2 | 1/2 | 3 | 4 | 1/3 | 1/4 | 1/3 | 0.0154 | |
| S3 | 1 | 1/3 | 2 | 3 | 1/4 | 1/6 | 1/5 | 0.0081 | ||
| S4 | 1 | 3 | 5 | 1/3 | 1/4 | 1/2 | 0.0209 | |||
| S5 | 1 | 2 | 1/4 | 1/6 | 1/3 | 0.0100 | ||||
| S6 | 1 | 1/6 | 1/7 | 1/6 | 0.0052 | |||||
| S7 | 1 | 1/2 | 2 | 0.0399 | ||||||
| S8 | 1 | 2 | 0.0553 | |||||||
| S9 | 1 | 0.0311 |
| C1 | C2 | C3 | C4 | C5 | C6 | C7 | C8 | C9 | Weight | |
|---|---|---|---|---|---|---|---|---|---|---|
| C1 | 1 | 1/3 | 1/5 | 1/4 | 1/4 | 1/3 | 1/6 | 1/6 | 1/5 | 0.0061 |
| C2 | 1 | 1/2 | 1/2 | 1/3 | /2 | 1/3 | 1/2 | 1/3 | 0.0151 | |
| C3 | 1 | 2 | 3 | 3 | 1/3 | 1/2 | 2 | 0.0355 | ||
| C4 | 1 | 2 | 3 | 1/2 | 1/2 | 1/2 | 0.0255 | |||
| C5 | 1 | 3 | 1/3 | 1/2 | 1/2 | 0.0209 | ||||
| C6 | 1 | 1/5 | 1/4 | 1/3 | 0.0104 | |||||
| C7 | 1 | 2 | 3 | 0.0625 | ||||||
| C8 | 1 | 2 | 0.0436 | |||||||
| C9 | 1 | 0.0304 |
| D1 | D2 | D3 | D4 | D5 | D6 | D7 | Weight | |
|---|---|---|---|---|---|---|---|---|
| D1 | 1 | 4 | 2 | 3 | 3 | 2 | 6 | 0.0752 |
| D2 | 1 | 1/3 | 1/3 | 1/2 | 1/2 | 1/3 | 0.0165 | |
| D3 | 1 | 3 | 2 | 3 | 5 | 0.0577 | ||
| D4 | 1 | 2 | 1/2 | 4 | 0.0298 | |||
| D5 | 1 | 1/3 | 4 | 0.0231 | ||||
| D6 | 1 | 5 | 0.0398 | |||||
| D7 | 1 | 0.0080 |
| R1 | R2 | R3 | R4 | R5 | R6 | R7 | Weight | |
|---|---|---|---|---|---|---|---|---|
| R1 | 1 | 2 | 3 | 4 | 5 | 7 | 2 | 0.0780 |
| R2 | 1 | 2 | 3 | 5 | 5 | 1/2 | 0.0453 | |
| R3 | 1 | 3 | 4 | 4 | 1/3 | 0.0311 | ||
| R4 | 1 | 2 | 3 | 1/5 | 0.0166 | |||
| R5 | 1 | 3 | 1/3 | 0.0127 | ||||
| R6 | 1 | 1/5 | 0.0077 | |||||
| R7 | 1 | 0.0585 |
References
- Halpern, B.S.; Ebert, C.M.; Kappel, C.V.; Madin, E.M.P.; Micheli, F.; Perry, M.; Selkoe, K.A.; Walbridge, S. Global priority areas for incorporating land-sea connections in marine conservation. Conserv. Lett. 2009, 2, 189–196. [Google Scholar] [CrossRef]
- Halpern, B.S.; Walbridge, S.; Selkoe, K.A.; Kappel, C.V.; Micheli, F.; D’Agrosa, C.; Bruno, J.F.; Casey, K.S.; Ebert, C.; Fox, H.E.; et al. A global map of human impact on marine ecosystems. Science 2008, 319, 948–952. [Google Scholar] [CrossRef] [PubMed]
- Morrissey, K.; O’Donoghue, C. The role of the marine sector in the Irish national economy: An input-output analysis. Mar. Policy 2013, 37, 230–238. [Google Scholar] [CrossRef]
- Antunes, P.; Santos, R. Integrated environmental management of the oceans. Ecol. Econ. 1999, 31, 215–226. [Google Scholar] [CrossRef]
- Visbeck, M.; Kronfeld-Goharani, U.; Neumann, B.; Rickels, W.; Schmidt, J.; van Doorn, E. Establishing a Sustainable Development Goal for Oceans and Coasts to Face the Challenges of Our Future Ocean. Available online: https://www.ifw-members.ifw-kiel.de/publications/establishing-a-sustainable-development-goal-for-oceans-and-coasts-to-face-the-challenges-of-our-future-ocean/KWP_1847.pdf (accessed on 29 July 2015).
- Knap, A.; Dewailly, É.; Furgal, C.; Galvin, J.; Baden, D.; Bowen, R.E.; Depledge, M.; Duguay, L.; Fleming, L.E.; Ford, T.; et al. Indicators of ocean health and human health: Developing a research and monitoring framework. Environ. Health Perspect. 2002, 110, 839–845. [Google Scholar] [CrossRef] [PubMed]
- Parravicini, V.; Rovere, A.; Vassallo, P.; Micheli, F.; Montefalcone, M.; Morri, C.; Paoli, C.; Albertelli, G.; Fabiano, M.; Bianchi, C.N. Understanding relationships between conflicting human uses and coastal ecosystems status: A geospatial modeling approach. Ecol. Indic. 2012, 19, 253–263. [Google Scholar] [CrossRef]
- Qin, X.; Sun, C.; Zou, W. Quantitative models for assessing the human-ocean system’s sustainable development in coastal cities: The perspective of metabolic-recycling in the Bohai Sea Ring Area, China. Ocean Coast. Manag. 2015, 107, 46–58. [Google Scholar] [CrossRef]
- Liu, J.; Dietz, T.; Carpenter, S.R.; Alberti, M.; Folke, C.; Moran, E.; Pell, A.N.; Deadman, P.; Kratz, T.; Lubchenco, J.; et al. Complexity of coupled human and natural systems. Science 2007, 317, 1513–1516. [Google Scholar] [CrossRef] [PubMed]
- Liu, J.; Dietz, T.; Carpenter, S.R.; Folke, C.; Alberti, M.; Redman, C.L.; Schneider, S.H.; Ostrom, E.; Pell, A.N.; Lubvhenco, J.; et al. Coupled human and natural systems. AMBIO: J. Hum. Environ. 2007, 36, 639–649. [Google Scholar] [CrossRef]
- Alberti, M.; Asbjornsen, H.; Baker, L.A.; Brozovic, N.; Drinkwater, L.E.; Drzyzga, S.A.; Jantz, C.A.; Fragoso, J.; Holland, D.S.; Kohler, T.A.; et al. Research on coupled human and natural systems (CHANS): Approach, challenges, and strategies. Bull. Ecol. Soc. Am. 2011, 92, 218–228. [Google Scholar] [CrossRef]
- Costanza, R. Social traps and environmental policy. BioScience 1987, 37, 407–412. [Google Scholar] [CrossRef]
- Clausen, R.; Clark, B. The metabolic rift and marine ecology: An analysis of the ocean crisis within capitalist production. Organ. Environ. 2005, 18, 422–444. [Google Scholar] [CrossRef]
- Steffen, W.; Sanderson, A.; Tyson, P.; Jäger, J.; Matson, P.A.; Moore, B., III; Oldfield, F.; Richardson, K.; Schellnhuber, H.-J.; Turner, B.L.; et al. Global Change and the Earth System: A Planet Under Pressure; Springer: Berlin, Germany, 2004; p. 336. [Google Scholar]
- Dennison, W. Environmental problem solving in coastal ecosystems: A paradigm shift to sustainability. Estuar. Coast. Shelf Sci. 2008, 77, 185–196. [Google Scholar] [CrossRef]
- Malone, T.C.; DiGiacomo, P.M.; Gonçalves, E.; Knap, A.H.; Talaue-McManus, L.; de Mora, S. A global ocean observing system framework for sustainable development. Mar. Policy 2014, 43, 262–272. [Google Scholar] [CrossRef]
- Tallis, H.; Kareiva, P.; Marvier, M.; Chang, A. An ecosystem services framework to support both practical conservation and economic development. Proc. Natl. Acad. Sci. USA 2008, 28, 9457–9464. [Google Scholar] [CrossRef] [PubMed]
- Sachs, J.D.; Reid, W.V. Investments toward sustainable development. Science 2006, 312, 1002. [Google Scholar] [CrossRef] [PubMed]
- McCartney, M.; Finlayson, M.; de Silva, S. Sustainable development and ecosystem services. In On Target for People and Planet; International Water Management Institute: Colombo, Sri Lanka, 2014; pp. 28–32. [Google Scholar]
- Han, Z.; Liu, G. Evolution of China’s regional system of man-sea relation and its mechanism. Scientia Geogr. Sin. 2007, 27, 761–767. (In Chinese) [Google Scholar]
- Halpern, B.S.; Longo, C.; Hardy, D.; McLeod, K.L.; Samhouri, J.F.; Katona, S.K.; Kleisner, K.; Lester, S.E.; O’Leary, J.; Ranelletti, M.; et al. An index to assess the health and benefits of the global ocean. Nature 2012, 488, 615–620. [Google Scholar] [CrossRef] [PubMed] [Green Version]
- Di, Q.; Li, B.; Han, Z.; Sun, C. Spatial and temporal vulnerability analysis of the human-sea resource environment of the Bohai Rim Region. Res. Sci. 2012, 34, 2214–2221. (In Chinese) [Google Scholar]
- State Oceanic Administration, People Republic of China. China Marine Statistical Yearbook 1997–2013; China Ocean Press: Beijing, China, 1997–2013.
- Rao, H.; Lin, C.; Kong, H.; Jin, D.; Peng, B. Ecological damage compensation for coastal sea area uses. Ecol. Indic. 2014, 38, 149–158. [Google Scholar] [CrossRef]
- Han, Z.; Di, Q.; Liu, K. Research on the theories and assessment method of carrying capacity of marine region. Areal Res. Dev. 2006, 25, 1–5. (In Chinese) [Google Scholar]
- Di, Q.; Zhang, J.; Wu, J. Assessment of marine ecological carrying capacity in Liaoning province based on the ecosystem health. Scientia Geogr. Sin. 2014, 29, 256–264. (In Chinese) [Google Scholar]
- Sun, C.; Yu, G.; Wang, Z.; Liu, K.; Gui, C. Marine carrying capacity assessment and spatio-temporal analysis in the Bohai Sea Ring Area, China. Scientia Geogr. Sin. 2014, 34, 513–521. (In Chinese) [Google Scholar]
- Di, Q.; Han, Z.; Sun, Y. Assessment of sustainable development capability of marine economy and its application in Liaoning Province. Res. Sci. 2009, 31, 288–291. (In Chinese) [Google Scholar]
- Lu, J.; Wang, G. Impacts of population changes on marine resources in China since the economic reform. Popul. Res. 2000, 24, 35–42. (In Chinese) [Google Scholar]
- Di, Q.; Han, Y. Sustainable development ability of China’s marine ecosystem in the perspective of entropy. Scientia Geogr. Sin. 2014, 34, 664–671. (In Chinese) [Google Scholar]
- Stanners, D.; Bourdeau, P. Europe’s Environment: The Dobris Assessment; Office for Official Publication of the European Communities: Luxembourg, 1995. [Google Scholar]
- Gari, S.R.; Newton, A.; Icely, J.D. A review of the application and evolution of the DPSIR framework with an emphasis on coastal social-ecological systems. Ocean Coast. Manag. 2015, 103, 63–77. [Google Scholar] [CrossRef]
- Atkins, J.P.; Burdon, D.; Elliott, M.; Gregory, A.J. Management of the marine environment: Integrating ecosystem services and societal benefits with the DPSIR framework in a systems approach. Mar. Pollut. Bull. 2011, 2, 215–226. [Google Scholar] [CrossRef] [PubMed]
- Sekovski, I.; Newton, A.; Dennison, W.C. Megacities in the coastal zone: Using a driver-pressure-state-impact-response framework to address complex environmental problems. Estuar. Coast. Shelf Sci. 2012, 96, 48–59. [Google Scholar] [CrossRef]
- Qian, X.; Yu, J.; Dai, R. A new area of science—The open complex giant system and its methodology. Chin. J. Nat. 1990, 13, 3–10. (In Chinese) [Google Scholar]
- Prigogine, I. Thermodynamics of Irreversible Processes; Thomas: Springfield, MA, USA, 1955. [Google Scholar]
- Jørgensen, S.E. Thermodynamics and Ecological Modeling; CRC Press: Boca Raton, FL, USA, 2000. [Google Scholar]
- Zhang, Y.; Yang, Z.; Li, W. Analyses of urban ecosystem based on information entropy. Ecol. Modell. 2006, 197, 1–12. [Google Scholar] [CrossRef]
- Niklas, K.J. Information, entropy, and the evolution of living systems. Brittonia 1979, 31, 428–430. [Google Scholar] [CrossRef]
- Lin, Z.; Xia, B. Sustainability analysis of the urban ecosystem in Guangzhou City based on information entropy between 2004 and 2010. J. Geog. Sci. 2013, 23, 417–435. [Google Scholar] [CrossRef]
- Feng, H.; Chen, X.; Heck, P.; Miao, H. An entropy-perspective study on the sustainable development potential of tourism destination ecosystem in Dunhuang China. Sustainability 2014, 6, 8980–9006. [Google Scholar] [CrossRef]
- Shannon, C.E. A mathematical theory of communication. Bell Syst. Tech. J. 1948, 27, 379–423. [Google Scholar] [CrossRef]
- Martínez-Berumen, H.A.; López-Torres, G.C.; Romo-Rojas, L. Developing a method to evaluate entropy in organizational systems. Procedia Comput. Sci. 2014, 28, 389–397. [Google Scholar] [CrossRef]
- Bailey, K. Entropy systems theory. Systems Science and Cybernetics. In Encyclopedia of Life Support Systems (EOLSS), Developed under the Auspices of the UNESCO; Eolss Publishers: Oxford, UK, 2001. [Google Scholar]
- Huang, I.B.; Keisler, J.; Linkov, I. Multi-criteria decision analysis in environmental sciences: Ten years of applications and trends. Sci. Total Environ. 2011, 409, 3578–3594. [Google Scholar] [CrossRef] [PubMed]
- Iwaro, J.; Mwasha, A.; Williams, R.G.; Zico, R. An Integrated Criteria Weighting Framework for the sustainable performance assessment and design of building envelope. Renew. Sustain. Energy Rev. 2014, 29, 417–434. [Google Scholar] [CrossRef]
- Saaty, T.L. How to make a decision: The analytic hierarchy process. Eur. J. Oper. Res. 1990, 48, 9–26. [Google Scholar] [CrossRef]
- Mon, D.; Cheng, C.; Lin, J. Evaluating weapon system using fuzzy analytic hierarchy process based on entropy weight. Fuzzy Sets Syst. 1994, 62, 127–134. [Google Scholar] [CrossRef]
- Zou, Z.; Yun, Y.; Sun, J. Entropy method for determination of weight of evaluating indicators in fuzzy synthetic evaluation for water quality assessment. J. Environ. Sci. 2006, 18, 1020–1023. [Google Scholar] [CrossRef]
- Hodgson, G.M. Evolution and Institutions: On Evolutionary Economics and the Evolution of Economics; E. Elgar: Cheltenham, UK, 1999. [Google Scholar]
- Richards, F.J. A flexible growth function for empirical use. J. Exp. Bot. 1959, 10, 290–301. [Google Scholar] [CrossRef]
- Xing, L.; Sun, M.; Wang, Y. Richards growth model of living-organism. J. Biomath. 1997, 13, 348–353. (In Chinese) [Google Scholar]
- Turnhout, E.; Hisschemöller, M.; Eijsackers, H. Ecological indicators: Between the two fires of science and policy. Ecol. Indic. 2007, 7, 215–228. [Google Scholar] [CrossRef]
- Lin, T.; Lin, J.; Cui, S.; Cameron, S. Using a network framework to quantitatively select ecological indicators. Ecol. Indic. 2009, 9, 1114–1120. [Google Scholar] [CrossRef]
- Valentin, A.; Spangenberg, J.H. A guide to community sustainability indicators. Environ. Impact Assess. Rev. 2000, 20, 381–392. [Google Scholar] [CrossRef]
- Ma, H.; Wang, Q.; Ke, Q.; Li, G.-M.; Xu, J.-C. Analysis on evolution of urban ecosystem and ability of sustainable development in Wenzhou. Ecol. Economy 2008, 10, 131–135. [Google Scholar]
- National Bureau of Statistics of China. China Statistical Yearbook 1997–2013; China Statistic Press: Beijing, China, 1997–2013.
- National Bureau of Statistics Ministry of Environmental Protection. China Statistical Yearbook On Environment 1997–2013; China Statistic Press: Beijing, China, 1997–2013.
- Wu, K.; Jin, J. Attribute recognition method of regional ecological security evaluation based on combined weight on principle of relative entropy. Scientia Geogr. Sin. 2008, 28, 754–758. (In Chinese) [Google Scholar]
- Zhang, Q.; Wang, B.-D.; He, B.; Cong, F.-J. Study of sustainable evolution track of regional water resources complex system. J. Taiyuan Univ. Technol. 2010, 5, 749–755. (In Chinese) [Google Scholar]
- Wang, R.; Li, F.; Hu, D.; Li, B.L. Understanding eco-complexity: Social-economic-natural complex ecosystem approach. Ecol. Complex. 2011, 8, 15–29. [Google Scholar] [CrossRef]
- He, Q.; Bertness, M.D.; Bruno, J.F.; Li, B.; Chen, G.; Coverdale, T.C.; Altieri, A.H.; Bai, J.; Sun, T.; Pennings, S.C.; et al. Economic development and coastal ecosystem change in China. Sci. Rep. 2014, 4, 1–9. [Google Scholar] [CrossRef] [PubMed]
- Rombouts, I.; Beaugrand, G.; Artigas, L.F.; Dauvin, J.C.; Gevaert, F.; Goberville, E.; Kopp, D.; Lefebvre, S.; Luczak, C.; Spilmont, N.; et al. Evaluating marine ecosystem health: Case studies of indicators using direct observations and modelling methods. Ecol. Indic. 2013, 24, 353–365. [Google Scholar] [CrossRef]
- Jørgensen, S.E.; Xu, F.L.; Costanza, R. Handbook of Ecological Indicators for Assessment of Ecosystem Health, 2nd ed.; CRC Press/Taylor and Francis: Boca Raton, FL, USA, 2010. [Google Scholar]
- Yu, L.; Hou, X.; Gao, M.; Shi, P. Assessment of coastal zone sustainable development: A case study of Yantai, China. Ecol. Indic. 2010, 10, 1218–1225. [Google Scholar] [CrossRef]
- Li, B. Vulnerability in human-sea economic system of liaoning coastal area in China. Sci. Geogr. Sin. 2014, 34, 711–716. [Google Scholar]
- Brundtland, G.H. Report of the World Commission on Environment and Development: Our Common Future. Available online: http://www.un-documents.net/our-common-future.pdf (accessed on 30 July 2015).
- Malone, T.C.; Digiacomo, P.M.; Goncalves, E.; Knap, A.H.; Talaue-McManus, L.; de Mora, S.; Muelbert, J. Enhancing the global ocean observing system to meet evidence based needs for the ecosystem-based management of coastal ecosystem services. Nat. Resour. Forum. 2014, 38, 168–181. [Google Scholar] [CrossRef]
- Ye, G.; Chou, L.; Yang, S.; Wu, J.; Liu, P.; Jin, C. Is integrated coastal management an effective framework for promoting coastal sustainability in China’s coastal cities? Mar. Policy 2015, 56, 48–55. [Google Scholar] [CrossRef]
- Holthus, P. Sustainable development of oceans and coasts: The role of the private sector. Nat. Resour. Forum 1999, 23, 169–176. [Google Scholar]
© 2015 by the authors; licensee MDPI, Basel, Switzerland. This article is an open access article distributed under the terms and conditions of the Creative Commons Attribution license (http://creativecommons.org/licenses/by/4.0/).
Share and Cite
Sun, C.; Zhang, K.; Zou, W.; Li, B.; Qin, X. Assessment and Evolution of the Sustainable Development Ability of Human–Ocean Systems in Coastal Regions of China. Sustainability 2015, 7, 10399-10427. https://doi.org/10.3390/su70810399
Sun C, Zhang K, Zou W, Li B, Qin X. Assessment and Evolution of the Sustainable Development Ability of Human–Ocean Systems in Coastal Regions of China. Sustainability. 2015; 7(8):10399-10427. https://doi.org/10.3390/su70810399
Chicago/Turabian StyleSun, Caizhi, Kunling Zhang, Wei Zou, Bin Li, and Xionghe Qin. 2015. "Assessment and Evolution of the Sustainable Development Ability of Human–Ocean Systems in Coastal Regions of China" Sustainability 7, no. 8: 10399-10427. https://doi.org/10.3390/su70810399