1. Introduction
Energy consumptions are increasing on a world scale, and the highest energy demand is in the residential sector and in services related to buildings [
1].
In order to reduce energy consumptions, one of the goals set by the European Union is to improve existing buildings and to design buildings with high energy performances [
2]. On the European level, reaching a “near-zero energy building” has been set as a goal for the public sector from 2018 and for new buildings from 2020. In order to reach this aim, several strategies have been examined and realized in different application fields: many works analyzed the design of technologic solutions at an urban scale as the cogeneration and the district heating and cooling systems [
3,
4,
5,
6,
7,
8] or at the single-building scale as the use of devices with higher energy performance or innovative materials [
9,
10,
11,
12,
13]. However, the energy analysis is not always combined with an in-depth examination of the indoor environment [
14,
15]. Other research focused on the analysis of the outdoor context in terms of meteorological data [
16,
17,
18], on the optimization of passive devices and techniques [
19,
20,
21,
22,
23]. However, these strategies are not always easy to apply, especially to existing buildings. Indeed, European building heritage needs to be preserved because of its historical, artistic and architectural values, and often, retrofit interventions cannot be realized. This situation is particularly identifiable in Italy, which is the country with most UNESCO World Heritage Sites [
24].
The Energy Performance of Buildings Directive (EPDB) disposes also that every member country should arrange a national plan about energy efficiency and made mandatory the Energy Performance Certificate (EPC) for existing and new buildings. However, at least in Italy, the EPC tool does not take into account the impact that it has on the environment. Energy demand connected to the production process, the use of certain kinds of raw materials and the disposal of the final product are not evaluated in the Italian EPC. The Italian energy regulation does not consider the so-called life cycle assessment (LCA) approach [
25], which sets the goal to quantify the environmental impact of a product along its entire lifecycle. The application of the environmental evaluation on existing and new buildings is not mandatory, and it is rarely applied during the design stage, since it often needs long times, a wide amount of accurate data about the building and its location and a long elaboration stage.
In addition in the Italian energy regulation, only the evaluation of winter heating and domestic hot water (DHW) production consumptions is mandatory with the result of a weak and misleading energy evaluation. Applications of the Italian EPC can be found in [
26,
27,
28,
29,
30]. Fantozzi
et al. [
26] evaluated the energy demand of two new residential building in Tuscany (Italy) testing different labelling criteria suggested by European standards and Italian local administrations. Still Fantozzi
et al. [
27] studied the thermal performance of the architectural envelope of a building prototype in winter and summer conditions with particular attention to the wall stratigraphy. Evangelisti
et al. [
28] evaluated the energy performance of a test-cell, characterized by three different wall types, through a dynamic calculation code and a steady-state code based on Italian standards, concluding that these simplified procedures do not allow one to correctly evaluate the building’s inertial behavior. Asdrubali
et al. [
29] examined nine buildings, covering several different construction techniques, in terms of energy performance, evaluated with
in situ measurements and numerical simulations. De Lieto Vollaro
et al. [
30] conducted a comparative analysis on the energy performance of an old building using a semi-stationary software and a dynamic one considering transparent elements characterized by progressively improved properties of thermal transmittance and solar gain factor.
There are more mandatory requirements for buildings performance in the Mediterranean European context compared to the ones asked by Italian standards [
31]. The Spanish Ministry of Industry, Tourism and Commerce developed a software for buildings energy certification, which takes into account cooling consumptions, as well. In Cyprus, the EPC implementation became mandatory with the Ministerial Order for the Minimum Energy Performance Requirements of 2009 for all residential and non-residential buildings and includes cooling needs expressed in terms of primary energy. In France, the Réglementation thermique 2012 is in effect for all new construction; it covers cooling consumptions of the building and reports the environmental impact related to building energy consumption.
The present paper wants to show how the incompleteness of the Italian energy performance analysis can lead to misleading results. A generic case study has been examined with two different approaches: one based only on the energy efficiency improvement and one based on the environmental impact decrease. In order to apply the latter method, a preliminary study of the tools available in Italy for the environmental impact evaluation of buildings was carried out, with particular attention to the ITACA protocol [
32]. A simplified methodology was proposed in order to integrate the energy performance evaluation with environmental considerations. The obtained results show how the energy performance approach actually gives a more impacting role to the winter period, orienting choices on high performance materials without considering the embodied energy and emissions in production, transportation and disposal processes. On the opposite side, the integrated approach shows also how the overall energy demand of the building can decrease both in the summer and winter period using natural materials, even if they have lower thermal performance.
The case study has been analyzed in different locations in order to underline the applicability of the proposed approach in areas of the Italian territory characterized by different climate and heating/cooling needs.
3. Green Building Evaluation: The ITACA Protocol
Green building certification tools are based on two methodologies [
37]: the multi-criteria approach and the LCA approach. The multi-criteria tools are structured in different hierarchical groups, which have different weights on the final evaluation, based on a scoring system. Among them, the most known are the British BREEAM (Building Research Establishmemt Environmental Assessment Method) [
38] and the American LEED (Leadership in Energy and Environmental Design) [
39]. In the Italian view, a national protocol was developed by ITACA (Institute for Innovation and Transparency of Contracts and Environmental Compatibility) and it refers to the Sustainable Building (SB) method [
40], a multi-criteria methodology internationally managed by iiSBE (International Initiative for Sustainable Built Environment) for the research project Green Building Challenge.
Several works investigated the green building rating systems. Ding [
41] analyzed different environmental building assessment methods used in different countries in order to develop a sustainability index. Ali and Al Nsairat [
37] developed a green building rating system for developing countries by integrating criteria from different assessment methodological frameworks. As results, they obtained a green residential building assessment tool for Jordan. Lee [
42] compared five green building schemes, BREEAM, LEED, CASBEE (Comprehensive Assessment System for Building Environmental Efficiency), BEAM (Building Environmental Assessment Method) Plus and Chinese ESGB (Evaluation Standard for Green Building), showing that they are based on relative performance. Especially, LEED is less flexible in its assessment criteria, but is the only one that adopts an energy cost budget approach. Asdrubali
et al. [
43] compared LEED and ITACA rating systems, applying them on two residential Italian buildings in order to suggest a more balanced score distribution. They concluded that ITACA could focus more on the site, while LEED gives great importance to the site sustainability.
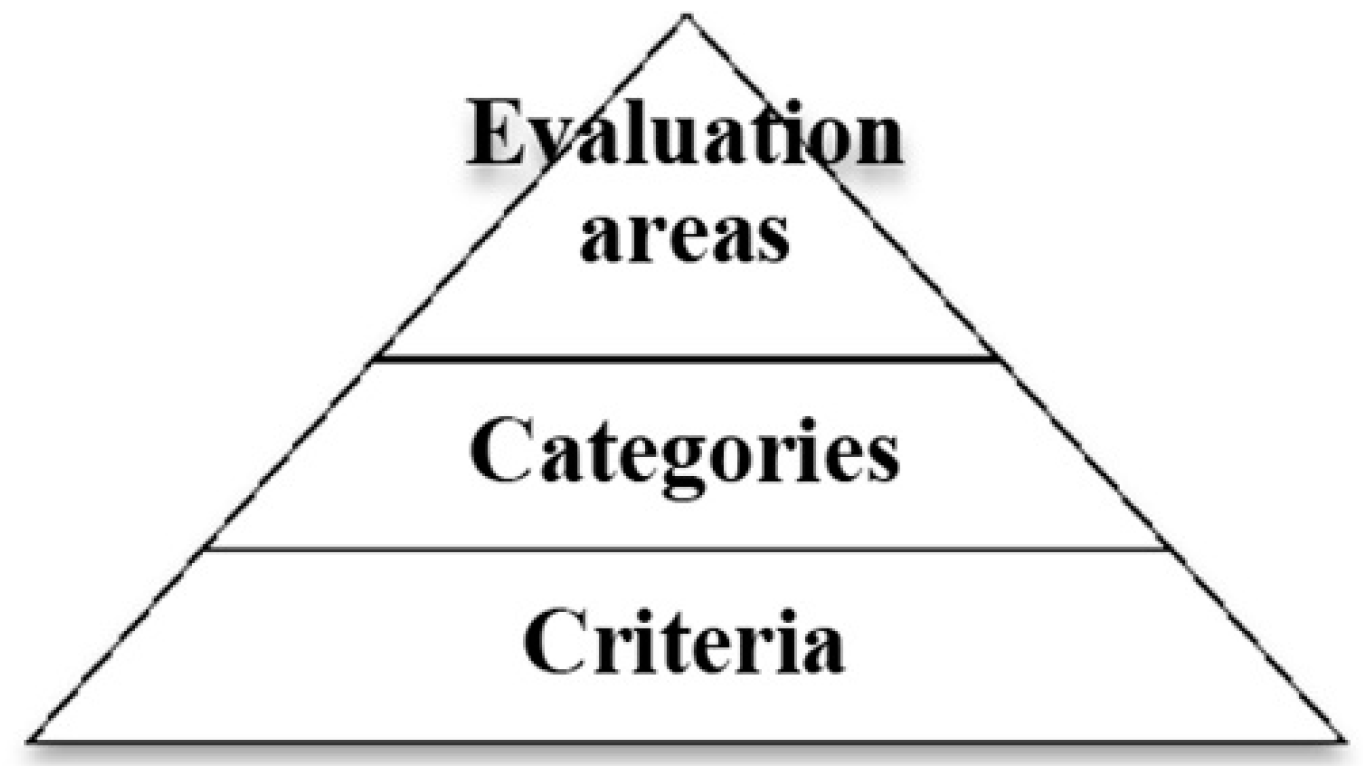
As the other multi-criteria tools, the ITACA protocol is structured into different criteria, which are the elemental units, grouped into different categories; the categories are also grouped into evaluation areas (
Figure 1,
Table 1).
Figure 1.
ITACA protocol structure.
Figure 1.
ITACA protocol structure.
Table 1.
Evaluation areas of the residential version of the ITACA protocol.
Table 1.
Evaluation areas of the residential version of the ITACA protocol.
| Evaluation Area | 1. Site Quality | 2. Resources Consumption | 3. Environmental Loads | 4. Interior Environmental Quality | 5. Services Quality |
|---|
| Weight | 5.17% | 43.97% | 18.10% | 13.79% | 19.0% |
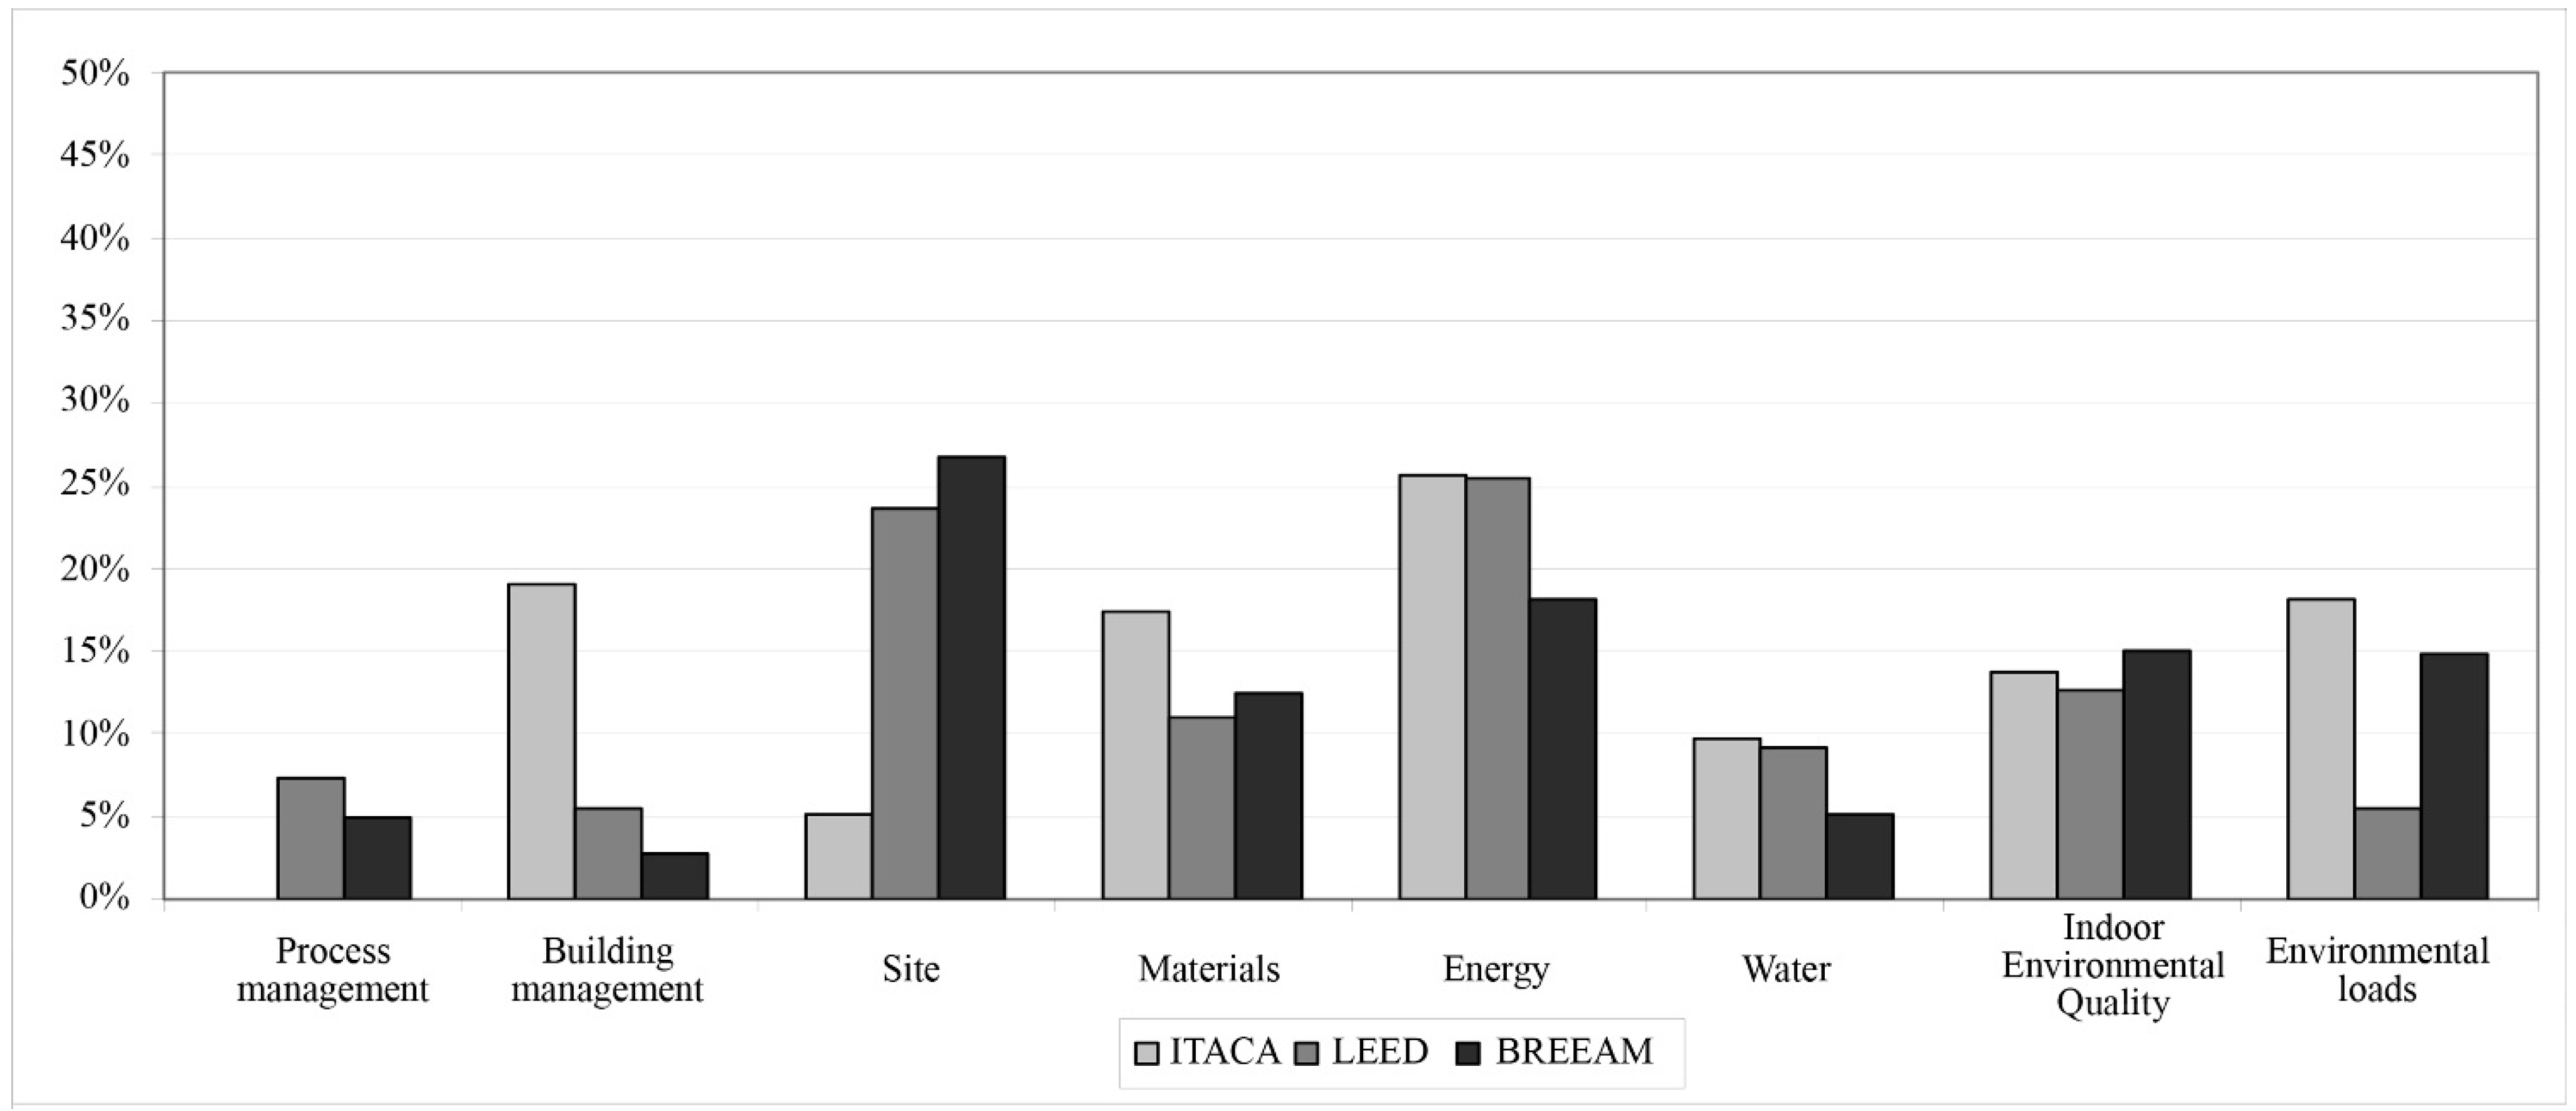
The main difference among these systems is the weight of every criterion, since the evaluation areas are roughly the same (
Figure 2).
Figure 2.
Evaluation areas weighing among ITACA, LEED and BREEAM from [
44].
Figure 2.
Evaluation areas weighing among ITACA, LEED and BREEAM from [
44].
In this work, the residential version of the ITACA protocol [
45] was considered, which is described by 49 criteria. For each criterion, there is a score ranking from −1 to +5 assigned to the building, where zero is the minimum performance required by actual laws. Each criterion has a different weight on the final score, and they are divided into two categories:
The weight of criteria is assigned by the Italian regions in order to adapt the evaluation to a specific territory or area.
As the final result of the analysis, a global environmental score is achieved, which represents the energy-environmental sustainability performance of the investigated building on the basis of the evaluation scale adopted by ITACA. The environmental score is the threshold established by region regulations to obtain subsidies. On this basis, the percentage of goals achieved is calculated.
4. The Combined Approach
Results obtained from the energy analysis are completely based on the winter period, although thermal problems deriving from the summer season are prevalent in the Italian climate.
In order to design a more complete evaluation methodology, which could be able to combine the energy performance certificate with environmental impact considerations, all of the criteria of the ITACA protocol were examined. The criteria forming a part of the categories in
Table 2 were considered useful to reach the aim of this work.
Table 2.
Chosen criteria of the ITACA protocol.
Table 2.
Chosen criteria of the ITACA protocol.
| Evaluation Area | | Category | Criteria |
|---|
| 2. Resources Consumption | 2.1 | Non-renewable primary energy needed during building’s lifecycle Weight: 53.3% | 2.1.1 | Building materials’ embodied energy |
| 2.1.2 | Thermal transmittance of building envelope |
| 2.1.3 | Net energy for heating |
| 2.1.4 | Primary energy for heating |
| 2.1.5 | Solar radiation control |
| 2.1.6 | Building thermal inertia |
| 2.1.7 | Net energy for cooling |
| 2.1.8 | Primary energy for cooling |
| 2.3 | Eco-friendly materials Weight: 24.4% | 2.3.1 | Material from renewable resources |
| 2.3.2 | Recycled/recover materials |
| 2.3.3 | Local materials |
| 2.3.4 | Local materials for finishing construction |
| 2.3.5 | Recyclable materials |
| 3. Environmental Loads | 3.1 | Equivalent CO2 emissions Weight: 52.6% | 3.1.1 | Embodied emissions in building materials |
| 3.1.2 | Expected emissions in the operational phase |
These criteria were integrated in the Italian standard energy performance evaluation in order to create a simplified analysis containing also environmental considerations. The proposed combined approach allows a better control of building energy consumptions in the wider time of its life cycle.
A case study of a standard building has been chosen and analyzed. Its architectural elements have been studied, and some of them have been changed in order to obtain two different results: one oriented on a better energy performance and the other one oriented on a better environmental sustainability. Energy and environmental performances of the building have been studied in three different Italian locations characterized by different heating/cooling needs with the standard Energy Performance Certificate and the partial ITACA protocol evaluation.
5. The Case Study
Nowadays, the design phase of a building and the assessment of its future energy consumptions are conceived together. Otherwise, designing a building and evaluating its energy performance only in a second stage would not respect current legislation. Indeed, new buildings are required to meet minimum standards in terms of thermal transmittance of the envelope and of global energy performance. Furthermore, new buildings have to be consciously designed in order to satisfy the evolution of future European directives, which expect the buildings to become “near-zero energy buildings” by 2020.
In order to analyze the proposed integrated approach, which could be applied in different locations, a new residential building was chosen. The designed building is one linear element composed of five typologies of flats, differing from each other in shape, exposure and net area and arranged in four floors for a total amount of 40 flats (
Figure 3).
Figure 3.
Schematic plan (a) and section (b) of the building.
Figure 3.
Schematic plan (a) and section (b) of the building.
The building structure is composed of pillars and beams made of reinforced concrete. The stratigraphy of infill walls and ceilings has been defined during the last phase of the design stage, according to the environmental parameters taken into account.
The building is equipped with a central heating system with a condensing boiler for the space heating and the DHW supply. In addition, the building is also equipped with a solar thermal energy system, which covers about 65% of DWH supply. The contribution of the renewable energy sources has been detracted by the overall energy demand of the main thermal system with a consequent improvement of the Energy Performance Indexes and a decrease of fuel demand and CO2 emissions.
Passive devices were not used, except for large glazed elements and screening systems. The main characteristics of the building are summarized in
Table 3.
Table 3.
Building characteristic.
Table 3.
Building characteristic.
| Intended Destination | Architectural Typology | Floors | Air-Conditioned Gross Volume | Net Area | External Area | Area/Volume Ratio |
|---|
| Residential | Reinforced concrete frame | 4 | 9576 m3 | 2503 m2 | 3391 m2 | 0.35 |
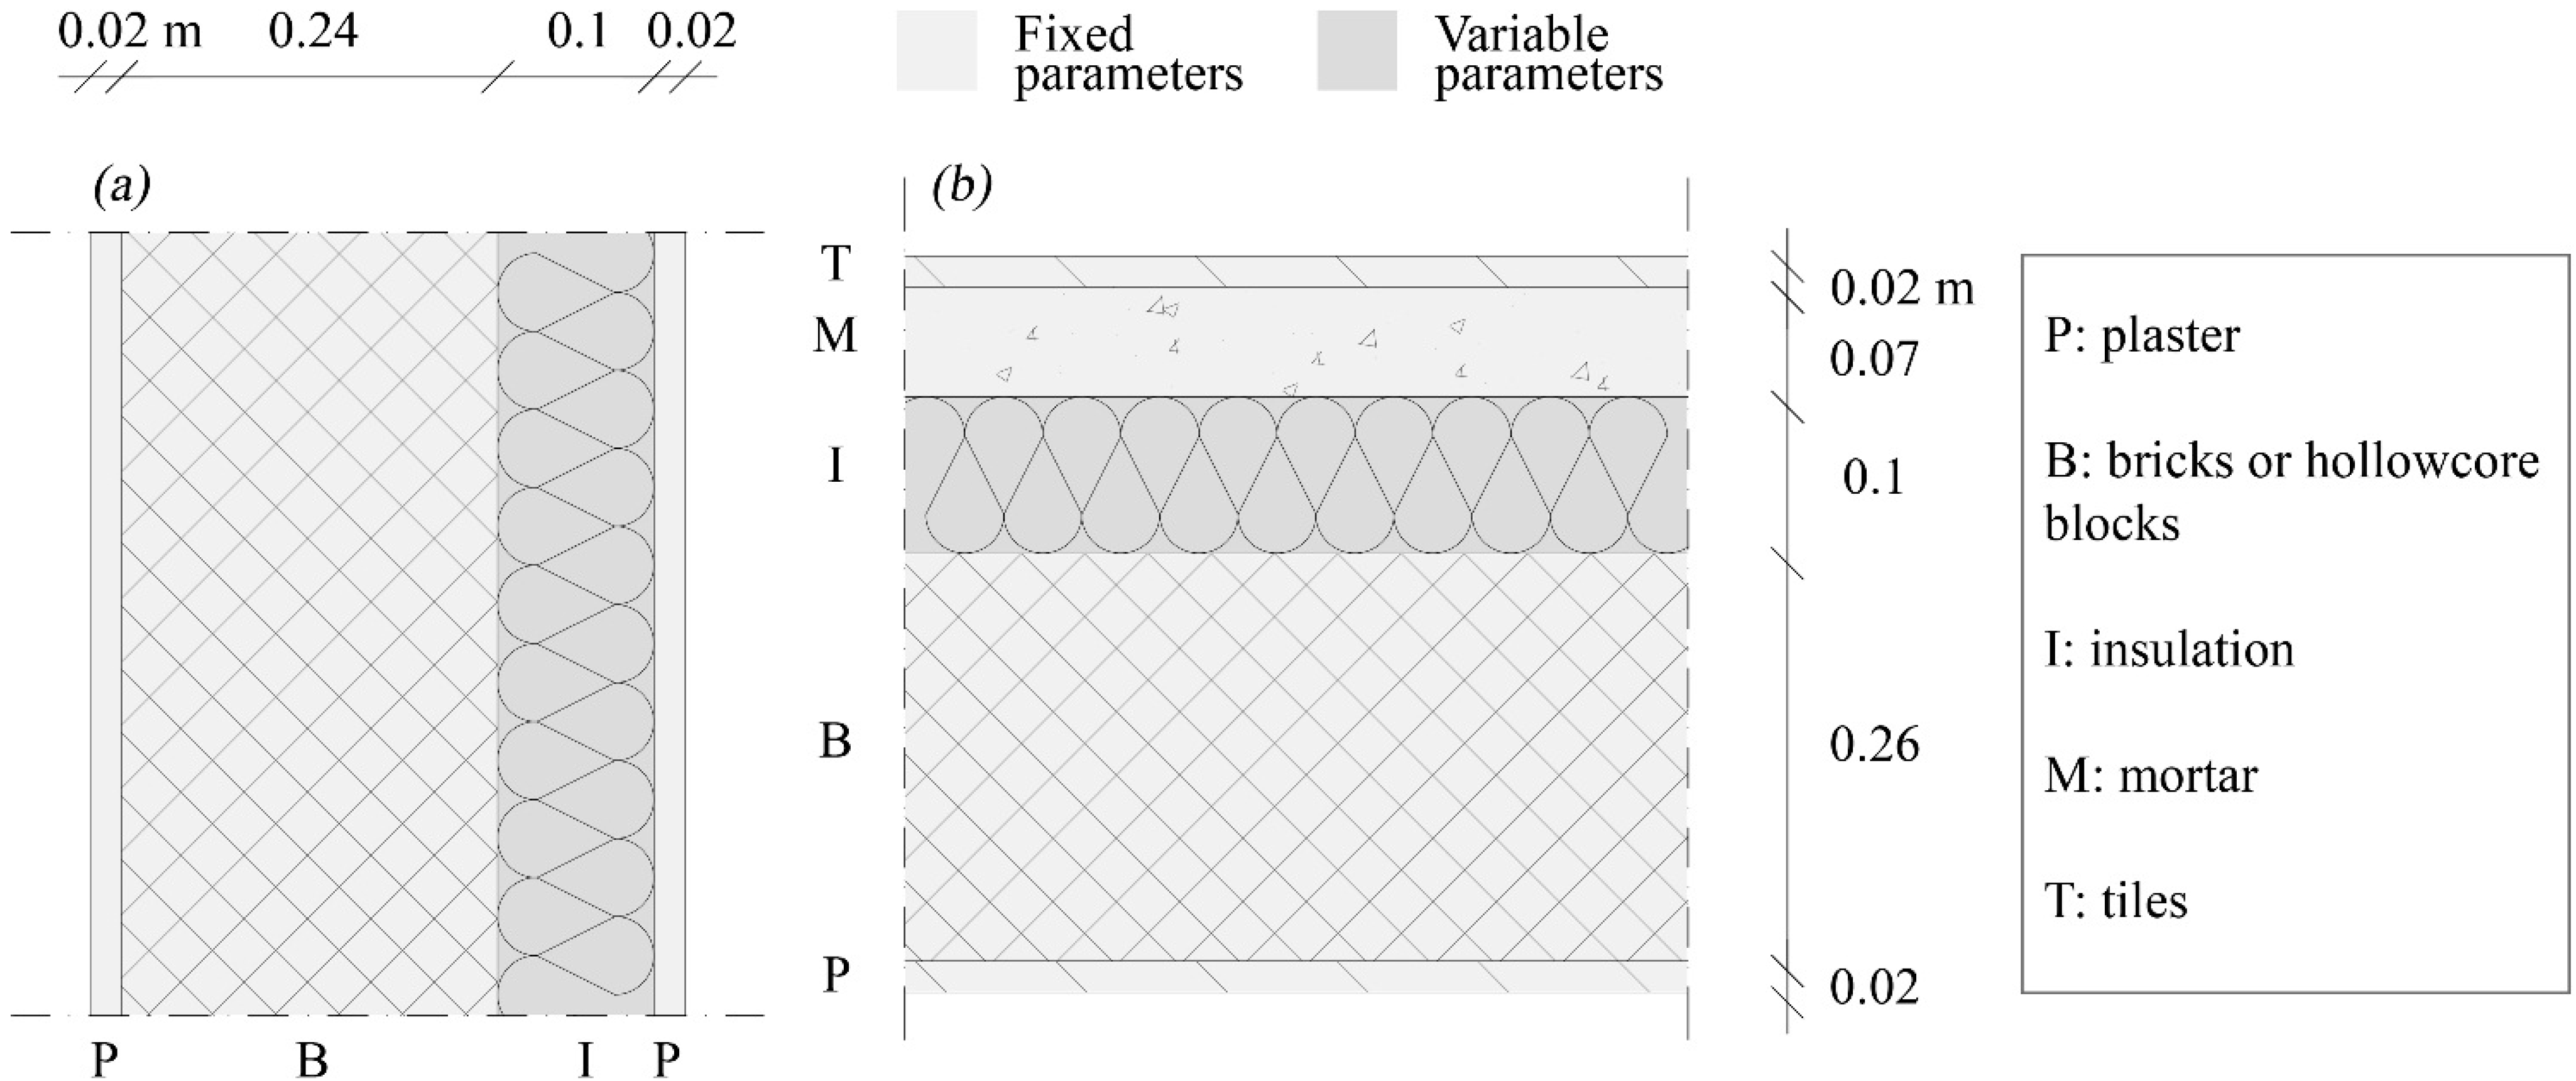
The architectural elements were divided into two categories: fixed and variable parameters (
Table 4). Variable parameters differ from fixed, since they can be changed to improve the energy-environmental performances of the building (
Figure 4). All of the parameters operate as input data for both energy and environmental evaluations.
Table 4.
Fixed and variable parameters of the building.
Table 4.
Fixed and variable parameters of the building.
| Fixed Parameters | Variable Parameters |
|---|
| General architectural data (volume, area, etc.) | Insulation type (fixed thickness: 10 cm) |
| Architectural structure | Windows frames |
| Thermal and electrical systems | Filler gas in the insulated glazing (fixed thickness: 6-9-6 mm) |
| Interior wall and ceilings stratigraphy | |
Figure 4.
Schematic stratigraphy of infill walls (a) and ceilings (b) of the building.
Figure 4.
Schematic stratigraphy of infill walls (a) and ceilings (b) of the building.
5.1. Fixed Parameters
Even if good practice requires that the design phases of a building follow both energy and environmental considerations from the beginning to the end of the executive process, it is very difficult to fully comply with these requirements. For this reason, setting some parameters of the building as fixed has been considered as a more realistic approach. These elements are related to building morphology, architectural typology, architectural envelope and air-conditioning systems (
Table 5). They were designed in order to pick standard efficient choices from the energy and environmental points of view.
Table 5.
Fixed parameters of the building.
Table 5.
Fixed parameters of the building.
| Frontiers to the Outdoor Space | Windows | Shading Devices | Wind Sensitivity |
|---|
| External insulation and finishing system | Double glazing with low emissivity film | External brise-soleil | Low |
5.2. Variable Parameters
Directive 1989/106/CEE [
46] establishes the essential requirements for materials used in the construction industry for public and private buildings. At the international level, the environmental declaration of building products is regulated by ISO 21930:2007 [
47]. The characteristics of different kinds of external insulation, windows frames and filler gas in the insulated glazing have been studied (
Table 6,
Table 7 and
Table 8). For the insulation, a fixed thickness of 0.1 m was chosen, while the insulating material was varied, as well for the window air gap, the thickness of which is of 0.09 m. These analyses were carried out in order to orient the variable parameters choice according to a high energy performance and a low environmental impact. This phase was necessary to understand how different building materials impact on human health and on the environment during their entire lifecycle.
Thermal characteristics (conductivity, specific heat capacity, density) make reference to UNI 10351:1994 [
48] and UNI EN ISO 10456:2007 [
49], while embodied energy (EE) and embodied carbon (EC) make reference to the ITACA protocol database and to the Inventory of Carbon and Energy (ICE) [
50] of the University of Bath.
Table 6.
Characteristics of different thermal insulations.
Table 6.
Characteristics of different thermal insulations.
| | Conductivity | Specific Heat Capacity | Density | Embodied Energy (EE) | Embodied Carbon (EC) |
|---|
| W/mK | J/kgK | kg/m3 | MJ | kgCO2 |
|---|
| RENEWABLE MATERIALS |
| Wood fiber | 0.037 | 2000 | 265 | 1,182,562.5 | 52,821.1 |
| Kenaf fiber | 0.039 | 1700 | 50 | 89,250 | 2380 |
| Cork panel | 0.041 | 1670 | 105 | 829,355.6 | 8277.9 |
| RECYCLABLE MATERIALS |
| Expanded cellular glass | 0.055 | 1000 | 140 | 1,143,292.5 | 63,932.8 |
| Cellulose fiber | 0.058 | 1900 | 67.5 | 99,101 | 3213 |
| Glass wool | 0.039 | 1030 | 20 | 149,940.0 | 7497 |
| MINERAL MATERIALS |
| Rock wool | 0.037 | 1030 | 30 | 100,406.3 | 6827.6 |
| Expanded perlite | 0.037 | 1000 | 90 | 224,910 | 13,119.8 |
| FOSSIL MATERIALS |
| Expanded polystyrene (EPS) | 0.034 | 1500 | 20 | 297,500 | 9996 |
| Extruded polystyrene (XPS) | 0.04 | 1450 | 38 | 565,250 | 18,992.4 |
| Polyurethane | 0.03 | 1260 | 30 | 592,620 | 58,012.5 |
The values in
Table 6 show that the best thermal insulation is guaranteed by the polyurethane (conductivity 0.03 W/mK), but the kenaf fiber has the lowest environmental impact considering both EE (89,250 MJ) and EC (2380 kg CO
2 eq.) during the production process.
Table 7.
Characteristics of different window frames.
Table 7.
Characteristics of different window frames.
| Window Frame | Thermal Transmittance | Embodied Energy (EE) | Embodied Carbon (EC) |
|---|
| W/m2K | MJ | kgCO2 |
|---|
| Aluminum | 5.88 | 5470 | 279 |
| PVC | 2.00 | 2310 | 118 |
| Wood | 2.7 | 360 | 19 |
Table 8.
Characteristics of different filler gasses for the insulated glazing.
Table 8.
Characteristics of different filler gasses for the insulated glazing.
| Filler Gas | Thermal Transmittance | Embodied Energy (EE) | Embodied Carbon (EC) |
|---|
| W/m2K | MJ | kgCO2 |
|---|
| Xenon | 2.48 | 4500 | 229 |
| Krypton | 2.53 | 510 | 26 |
| Argon | 2.76 | 31 | 2 |
| Air | 2.97 | 0 | 0 |
The same considerations can be done in terms of window frames materials (
Table 7), where the wood has the best performance on both EE and EC profiles, but the PVC has a low thermal transmittance, and in terms of filler gasses for the insulated glazing (
Table 8), where the xenon has the best thermal transmittance (2.48 W/m
2K), but the air is better on the environmental profile.
Previous analyses show that good quality materials from the energy point of view generally assure a high thermal performance, but on the other side, they are mostly detrimental for the environment. This is the reason why two different paths have been carried out: the first is based on the high energy profile of chosen materials (Configuration A); the other one (Configuration B) is based on the low embodied energy and emissions of chosen materials (
Table 9).
Table 9.
Summary of the variable parameters’ choice.
Table 9.
Summary of the variable parameters’ choice.
| Variable Parameter | Configuration A | Configuration B |
|---|
| Insulation | Polyurethane foam | Kenaf fiber |
| Window frame | PVC | Wood |
| Filler gas | Xenon | Air |
The design of the opaque building envelope in Configuration A contains a polyurethane foam layer as the thermal insulation. This material has the best thermal performance among the considered ones. However, the raw material required in the production process derives from the oil, and it is strongly impacting on the environment both for EE and EC. PVC frames and xenon were chosen for the windows. The PVC is a fire-resistant and acid-resistant material, with a good thermal conductivity and a very long lifetime. On the other hand, it is harmful to human health and the environment during both the production and the disposal phases, and one of the raw materials for PVC production is derived from oil. The xenon also has good thermal insulation properties, but its production strongly impacts the environment.
Following the environmental profile, instead, the kenaf fiber has been chosen as the wall insulation material, which is also characterized by a good thermal resistance. Wood frames and dehydrated air were chosen as options for windows systems. Wood is a recyclable and renewable raw material; it is light and resistant, ensures high thermal performances and good durability. Air allows good insulation without any previous treatment and is always available.
6. Results and Discussion
6.1. First Configurations of the Project
The two different proposed configurations (A and B) were applied on the hypothetical buildings, located in three different cities in order to find a methodology applicable in different locations (
Table 10). The choice of the cities was made based on the Italian climatic zone classification established by the Presidential Decree 412/1993 [
51].
The chosen places are the city of Palermo (Climatic Zone B), the city of Rome (Climatic Zone D) and the city of Cuneo (Climatic Zone F). Zone A was discarded since it involves only a few locations in Italy.
Table 10.
Characteristics of the chosen cities.
Table 10.
Characteristics of the chosen cities.
| City | Latitude | Longitude | Altitude | Climatic Zone | Degree Days | Operation Period of the Heating System | Daily Hours |
|---|
| Palermo | 38°6′N | 13°21′E | 14 m | B | 751 | 1 December–15 March | 8 |
| Rome | 41°53′N | 12°28′E | 20 m | D | 1415 | 1 November–15 April | 12 |
| Cuneo | 44°23′N | 7°33′E | 534 m | F | 3012 | No limitation | No limitation |
All of the analyses were carried out for the whole building in accordance with both the UNI/TS 11300 Parts 1 and 2 and the ITACA protocol for a total of 12 different sets of results (
Table 11). The Energy Performance Certificates were obtained with the software MC11300 [
52], while evaluations based on the materials’ embodied energy and emissions were carried out with the ITACA protocol’s frameworks.
Table 11.
Summary of the parametric analyses.
Table 11.
Summary of the parametric analyses.
| City | Building Configuration | Analysis Name |
|---|
| UNI/TS 11300 Parts 1 and 2 (EPC) | ITACA Protocol (IT) |
|---|
| Palermo (PA) | A | PAAEPC | PAAIT |
| B | PABEPC | PABIT |
| Rome (RM) | A | RMAEPC | RMAIT |
| B | RMBEPC | RMBIT |
| Cuneo (CN) | A | CNAEPC | CNAIT |
| B | CNBEPC | CNBIT |
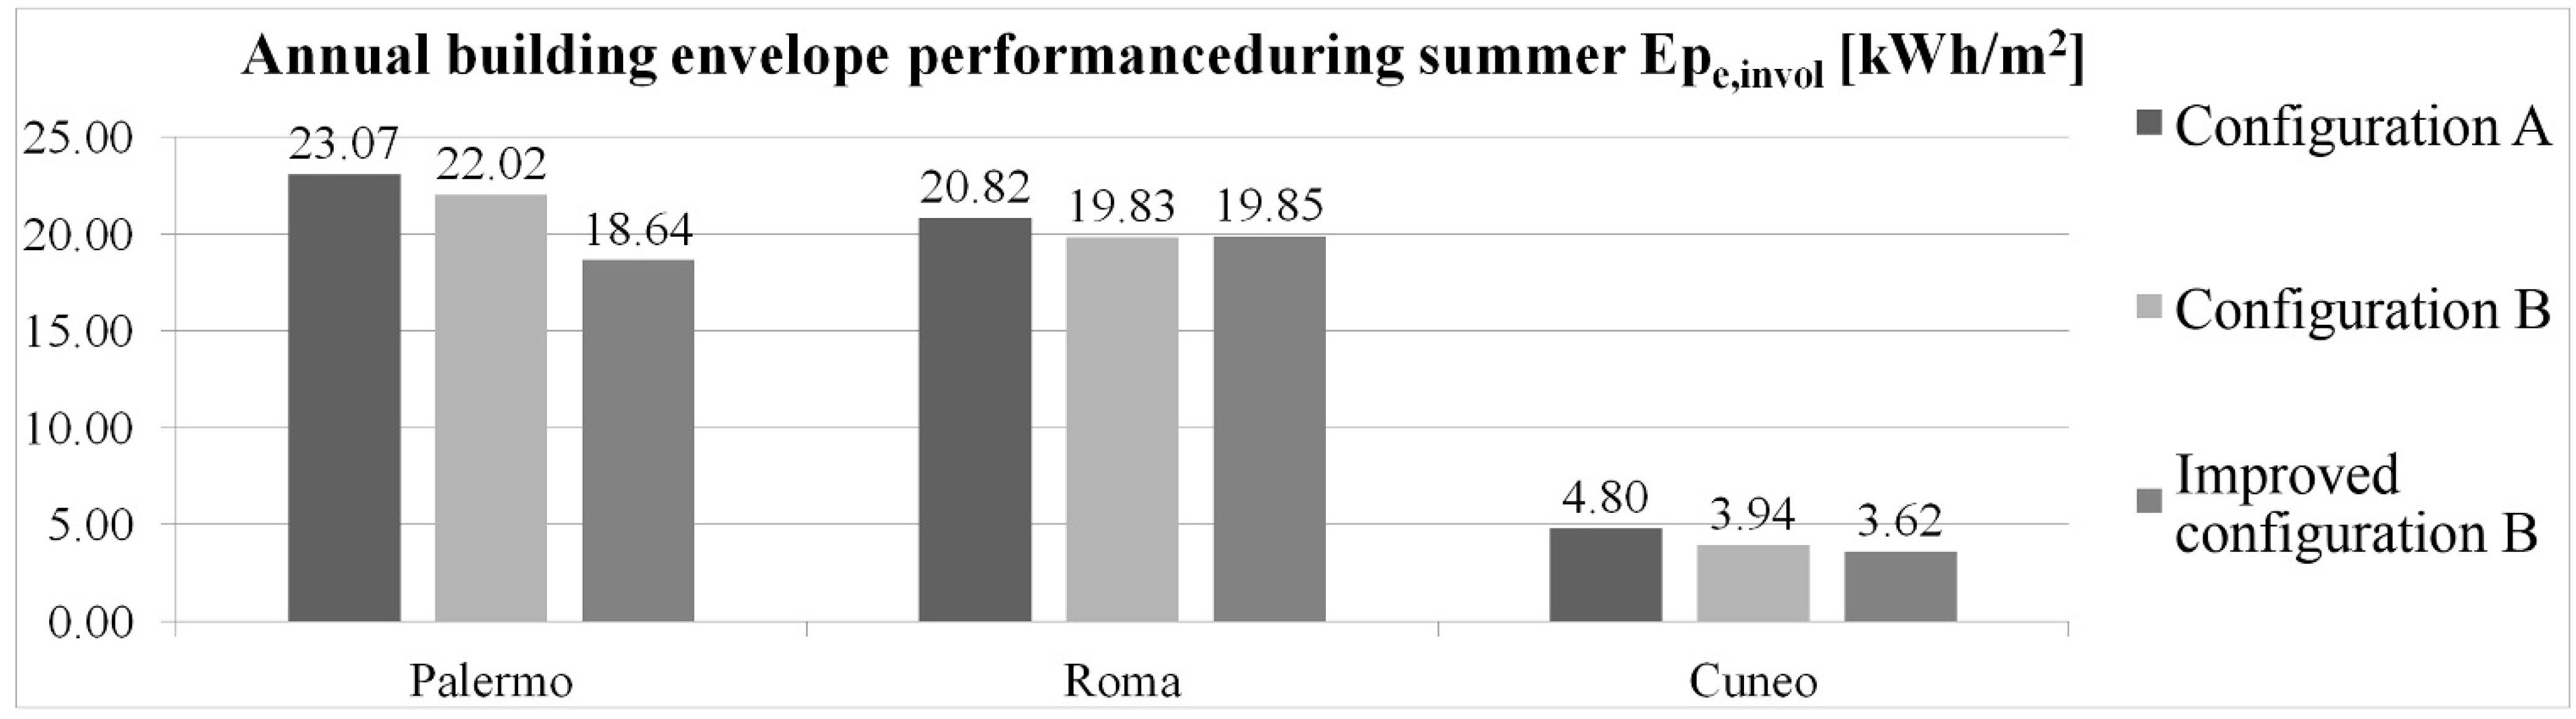
As the first choice, the building was located in Rome. Results obtained from RMAEPC show that the building is evaluated in the B ranking with the annual global performance index Epgl equal to 33.11 kWh/m2. The annual energy performance of the envelope during the summer cooling Epe,invol is equal to 20.82 kWh/m2, which is equivalent to the III class (medium quality) in accordance to the Italian regulations. In the RMAIT, the building obtains an environmental score of 0.82 and a goal achievement from the environmental impact point of view of 43%.
In the RMBEPC analysis, the building obtains a lower ranking in the energy classification. The annual Epgl is equal to 36.92 kWh/m2, equivalent to the C class. Anyway, the Epe,invol is equal to 19.82 kWh/m2, and the quality of the envelope is the II class (good quality). The environmental score reached in the RMBIT analysis is higher than the RMAIT and is equal to 0.98 (51% of the goals achieved).
The comparison among the results obtained from the different configurations shows that the standard energy certification could be misleading if not well interpreted. If on the one side, the materials chosen for Configuration A seem more suitable for the decrease of energy consumptions during the lifecycle of the building, on the other side, the consumptions due to the production and the disposal phases are not considered at all. In addition, the results show that the eco-friendly materials have a better performance in the summer cooling, always considering that the energy demand during the summer season is only partially analyzed in the Italian standard energy certification.
The same parametric sets of analysis have been transposed in another two different climatic zones, and the previous considerations can be applied also to the new results (
Table 12).
Table 12.
Results for the three locations.
Table 12.
Results for the three locations.
| Indexes and Scores | PALERMO (B) | ROME (D) | CUNEO (F) |
|---|
| Building Configuration | Building Configuration | Building Configuration |
|---|
| A | B | A | B | A | B |
|---|
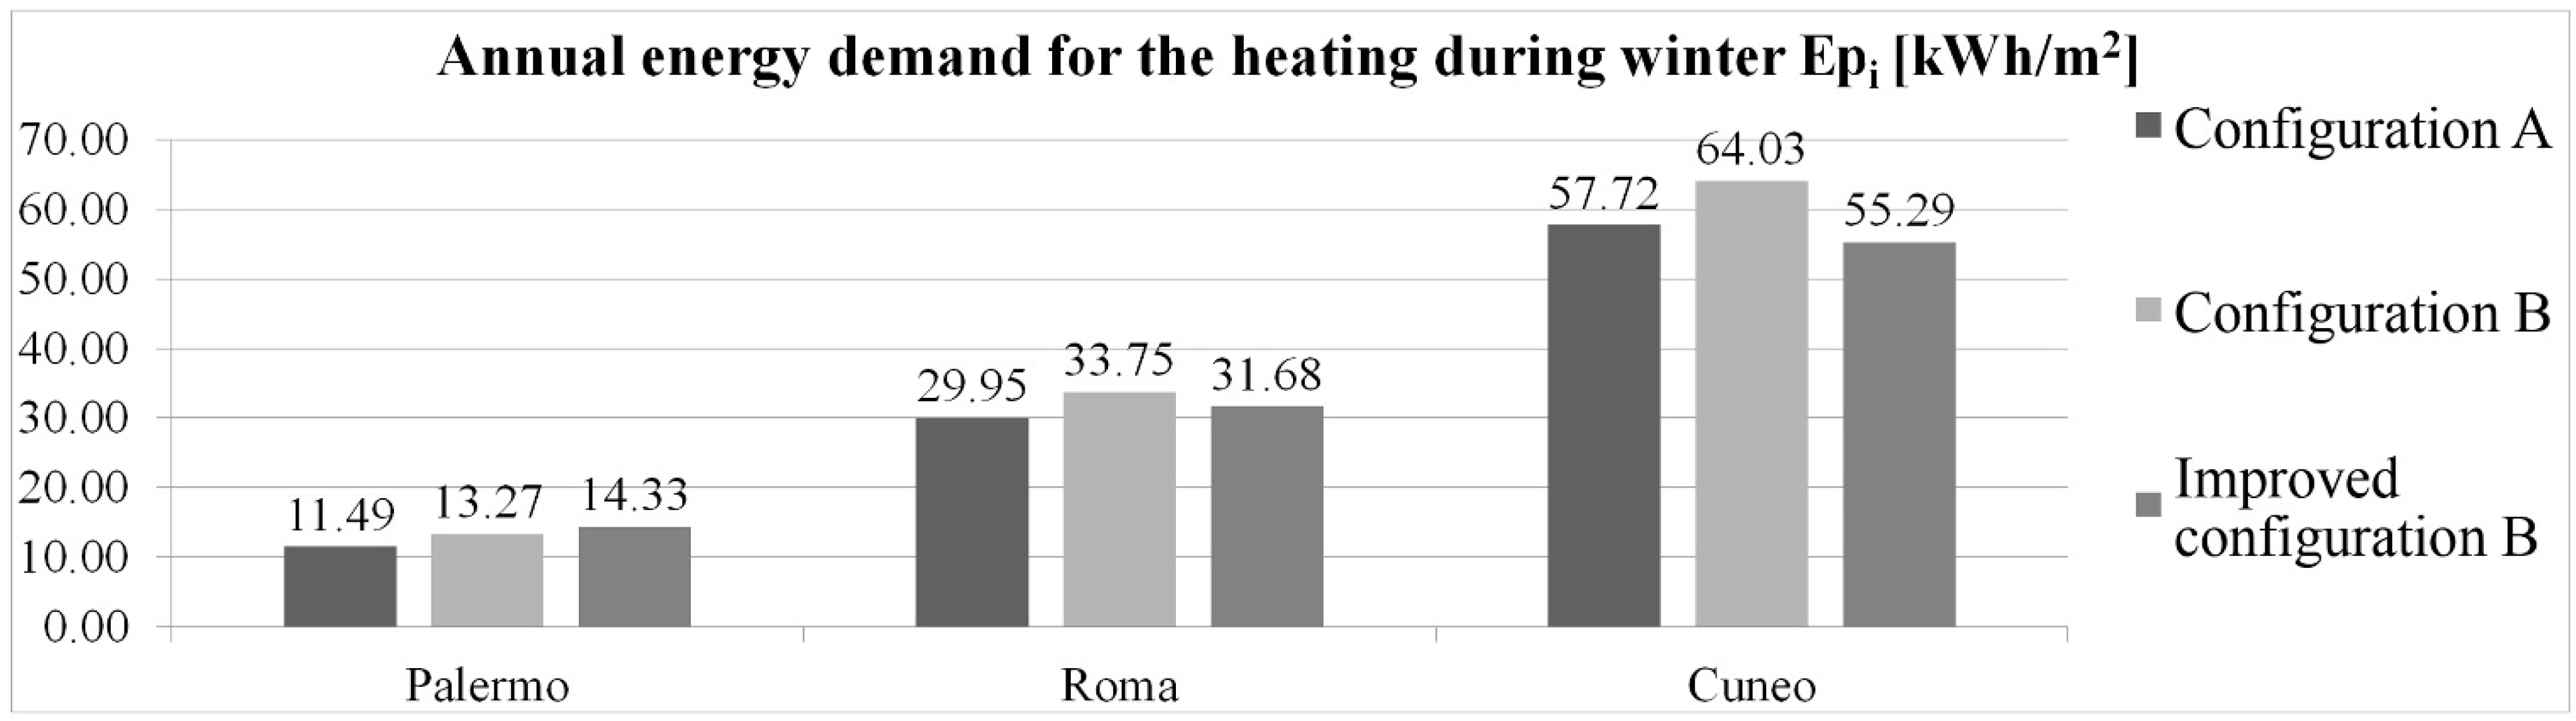
| Annual Epi (kWh/m2) | 11.49 | 13.27 | 29.95 | 33.75 | 57.73 | 64.03 |
| Annual Epacs (kWh/m2) | 3.17 | 3.17 | 3.17 | 3.17 | 3.17 | 3.17 |
| Annual Epgl (kWh/m2) | 14.68 | 16.47 | 33.12 | 36.92 | 60.90 | 67.20 |
| Energy ranking | A | A | B | C | C | C |
| Annual Epe,invol (kWh/m2) | 23.07 | 22.02 | 20.82 | 19.83 | 4.80 | 3.94 |
| Quality class | III | III | III | II | I | I |
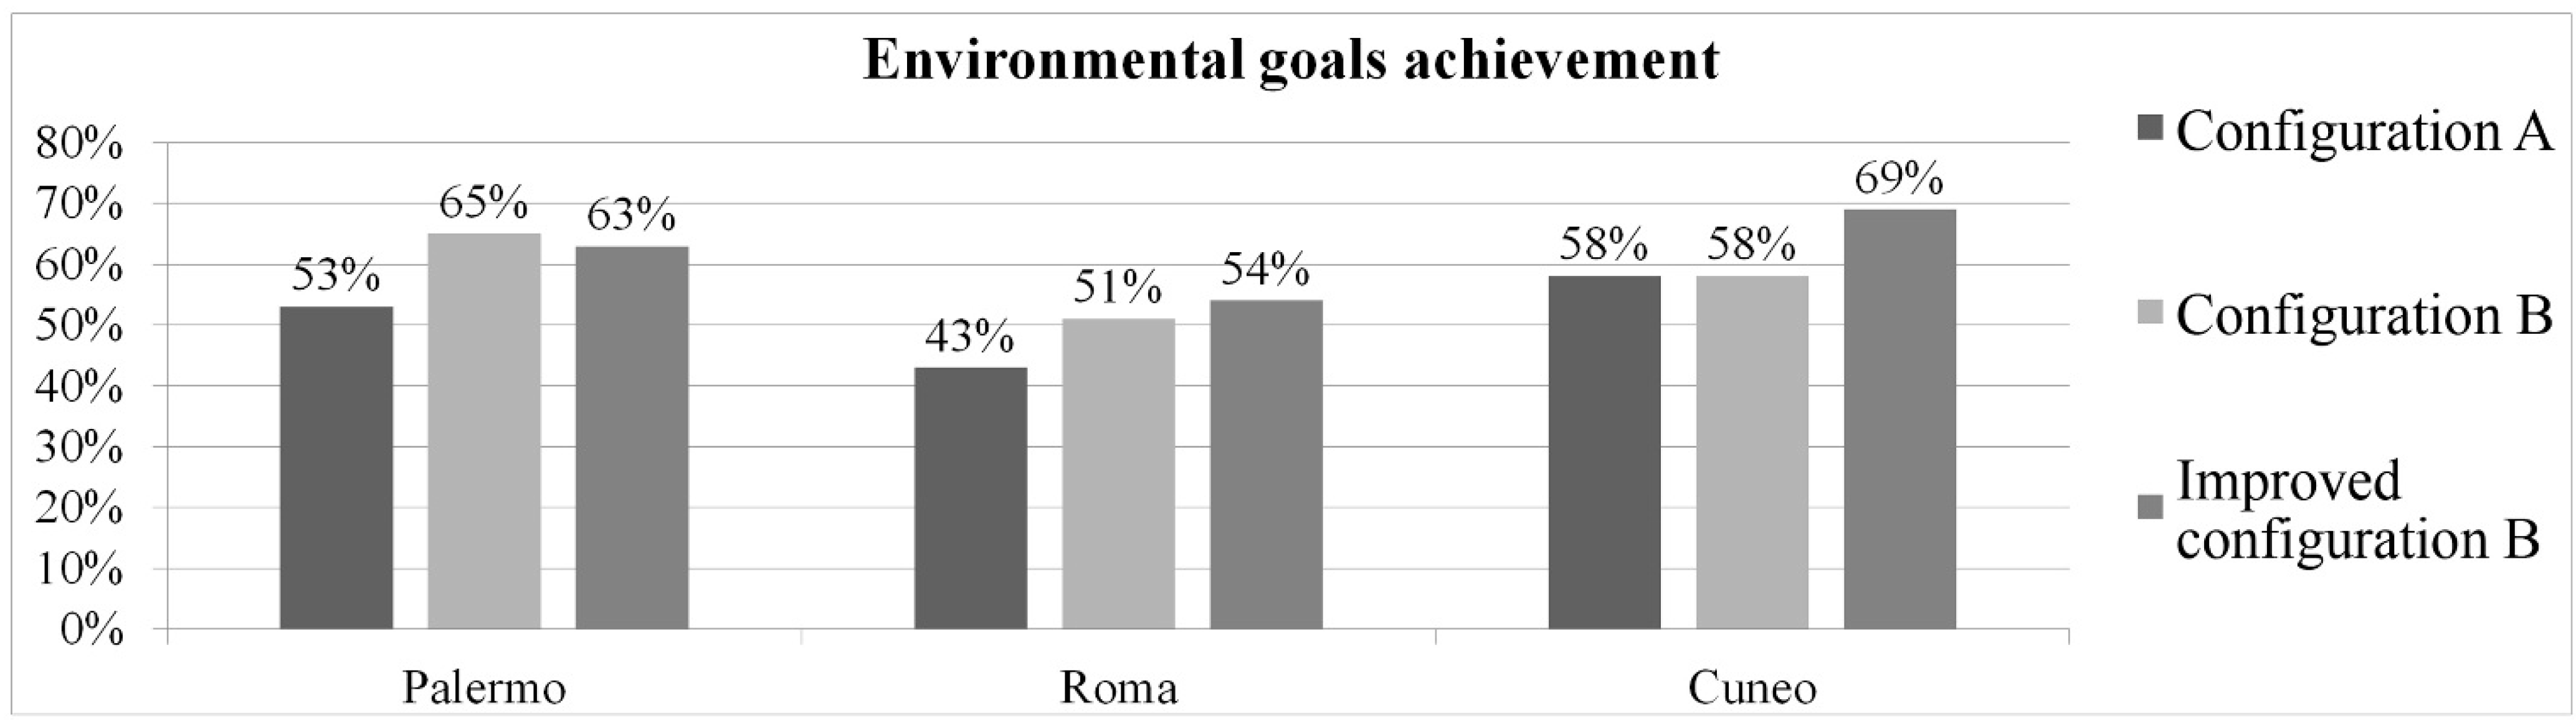
| Environmental score | 1.02 | 1.25 | 0.82 | 0.98 | 0.90 | 1.32 |
| Goals achievement | 53% | 65% | 43% | 51% | 47% | 58% |
Configuration A presents a better performance from the energy point of view, with respect to Configuration B. In the same way, Configuration B presents a better performance from the environmental point of view, compared to Configuration A. This fact is even more obvious in the current Italian evaluation system. Despite that, the better performances in the summer period are not enough to shift the final choice on the environmental one. For these reasons, Configuration B was slightly changed in order to understand if there is convenience in the use of an eco-friendly design also from the energy point of view.
7. Conclusions
In the present work, a study of the tools available in the Italian context for the Energy Performance Certificate of buildings has been carried out, highlighting that the Italian standards establish as mandatory only the evaluation of winter heating and DHW production consumptions. At first glance, the obtained values bring misleading results, which are far from the real energy demand of the analyzed building. In addition to that, they do not take into account the impact of the building on the environment during its lifecycle. For this reason, a simple case study of a new building has been studied, imposing some fixed and variable parameters and locating it in three different cities in the Italian territory. The variable parameters were changed in order to obtain two different configurations: one oriented to improve energy performances (Configuration A); the other one to lower the environmental impact (Configuration B). These configurations were analyzed in accordance with both the UNI/TS 11300 Parts 1 and 2 and the ITACA protocol’s frameworks for the whole building. The results show that Configuration A fits into the energy analysis as well as Configuration B fits into the environmental analysis. On the whole, Configuration A obtains a better energy ranking than Configuration B. For this reason, few corrections to the variable parameters’ selection have been applied. The improved Configuration B results in an increase of both the environmental score and the energy ranking.
This result underlines how the Energy Performance Certificate in Italy can be easily oriented also to considerations based on the environmental impact of buildings and materials. The proposed approach allows one to obtain that goal, combining the simplicity of the energy consumption evaluation with the completeness of the green building analysis. This methodology could take one to a higher awareness of the link between the energy performance of buildings and their environmental impact, orienting the design of new buildings and the choice of retrofit interventions respecting both evaluative areas.


 ,
, 


