Article

Evaluating Effects of Poultry Waste Application on Phosphorus Loads to Lake Tenkiller

1
Department of Environmental Engineering, Andong National University, Andong 760-748, Korea
2
Department of Rural Construction Engineering, Kongju National University, Yesan 340-702, Korea
3
Department of Agricultural and Biological Engineering, Purdue University, West Lafayette, IN 47907-2093, USA
*
Author to whom correspondence should be addressed.
Sustainability 2015, 7(8), 10115-10134; https://doi.org/10.3390/su70810115
Submission received: 13 May 2015 / Revised: 13 July 2015 / Accepted: 14 July 2015 / Published: 29 July 2015

Abstract

:
Lake Tenkiller located in Oklahoma, USA is a large midcontinent reservoir in a eutrophic state due to excess phosphorus (P) loads. Poultry waste application within the Illinois River Watershed in northeast Oklahoma and northwest Arkansas has been identified as a major contributor to overall P loads within Lake Tenkiller. In this study, Groundwater Loading Effects of Agricultural Management Systems (GLEAMS) was applied to evaluate the effect of poultry waste application on P loads to Lake Tenkiller. Historical P loads to Lake Tenkiller during 1951–2000 have increased from approximately 166,000 kg/year to more than 295,000 kg/year with the Illinois River at Tahlequah subwatershed increasing from 68% to 78% of total P loads over that period. Increased poultry waste application based on poultry growth rates could increase P load to Lake Tenkiller from 311,000 kg/year to more than 528,000 kg/year. Cessation of poultry waste application and addition of buffers along streams could reduce P loads to approximately 92,000 kg/year for cessation of poultry waste application alone and about 89,000 kg/year for cessation of poultry waste application with buffers. One possible strategy to reduce P load to Lake Tenkiller is to cease applying poultry waste application, especially in the portion of the Illinois River above the Tahlequah USGS gage station.

1. Introduction

Pollution is divided into point and nonpoint source pollution based on its pathway. Nonpoint source pollution is generated from land and highly depends on rainfall, so it may be difficult to accurately quantify major sources, estimate amounts, and control. In recent years, nonpoint source pollution has received significant attention and has been considered a key source of numerous water quality problems. Phosphorus (P) is an important cause of eutrophication and often a limiting factor in algal blooms in lakes and reservoirs. Many researchers have explored the relationship between P loading from watersheds and chlorophyll-a concentration in lakes and reservoirs [1,2,3,4,5,6].
Poultry operations have a higher confined animal unit density than other livestock production systems, and the concentration of P in poultry manure is greater than in other livestock manure [7]. Therefore, significant amounts of P have been loaded from pasture or cropland to water bodies as a result of applying poultry litter fertilizer in the US [8,9,10,11,12]. Long-term application of poultry litter can increase the labile P forms in soil and accelerate soluble P transport in surface runoff by changing soil properties related to Ca-Al bound P [13,14]. Total P concentration in streams was strongly correlated with the intensity of poultry farm operations within the Illinois River watershed in Oklahoma and Arkansas, USA [15].
Various best management practices (BMPs) have been proposed to mitigate the effects of poultry litter application on water quality problems. Reduction of poultry litter application can reduce nitrate nitrogen and P concentrations in vadose water as well as in runoff water [7,16,17,18,19]. Aluminum sulfate amendment of poultry litter has been suggested as a BMP to reduce the solubility and release of phosphate [20,21,22]. Grass buffer strips can capture sediment adsorbed P and reduce soluble P in surface runoff from pasture applied poultry litter [7,23]. Chaubey et al. [24] reported poultry litter application timing also influences nutrient runoff, and buffer strip and grazing management were two important BMPs in pasture areas receiving poultry litter applications.
Groundwater Loading Effects of Agricultural Management Systems (GLEAMS) is a mathematical model to simulate complex climate-soil-management interactions [25] and has been widely used to simulate nutrient movement and to evaluate BMPs to reduce nutrient loadings from agriculture land. De Paz and Ramos [26] evaluated the effect of different nitrogen fertilization on nitrate leaching using GLEAMS coupled with GIS technology in a region of Valencia, Spain. Bakhsh et al. [27] estimated nitrate nitrogen loss from subsurface drainage water from swine manure and urea-ammonium-nitrate fertilized plots using GLEAMS in Iowa, USA. Adeuya et al. [28] developed the National Agricultural Pesticide Risk Analysis that builds on GLEAMS named GLEAMS-NAPRA and evaluated impacts of land use and management change on runoff, sediment, and nutrient loss from northeastern Indiana, USA. Bosch et al. [19] evaluated reducing P runoff by dairy herd and crop nutrient management using GLEAMS. GLEAMS was selected for use in this study based on its ability to simulate movement of nutrients with surface runoff as well as to shallow groundwater, its demonstrated performance in simulating nutrient losses from field to watershed scales, and its ability to simulate detailed agricultural management systems.
Lake Tenkiller is a large US midcontinent reservoir located in Oklahoma, USA and is in a eutrophic state due to the excess P loads due to poultry waste application on watershed pastures [29]. In the study presented herein, the historical P loads of Lake Tenkiller were quantified for the last 50 years, and the effect of poultry waste application to pastures for 50 years into the future were evaluated by simulating the scenarios using GLEAMS. The scenarios included continued poultry waste application to pastures at present rates, increased application for growth in poultry numbers, cessation of poultry waste application, and cessation of poultry waste application combined with buffers along streams.

2. Materials and Methods
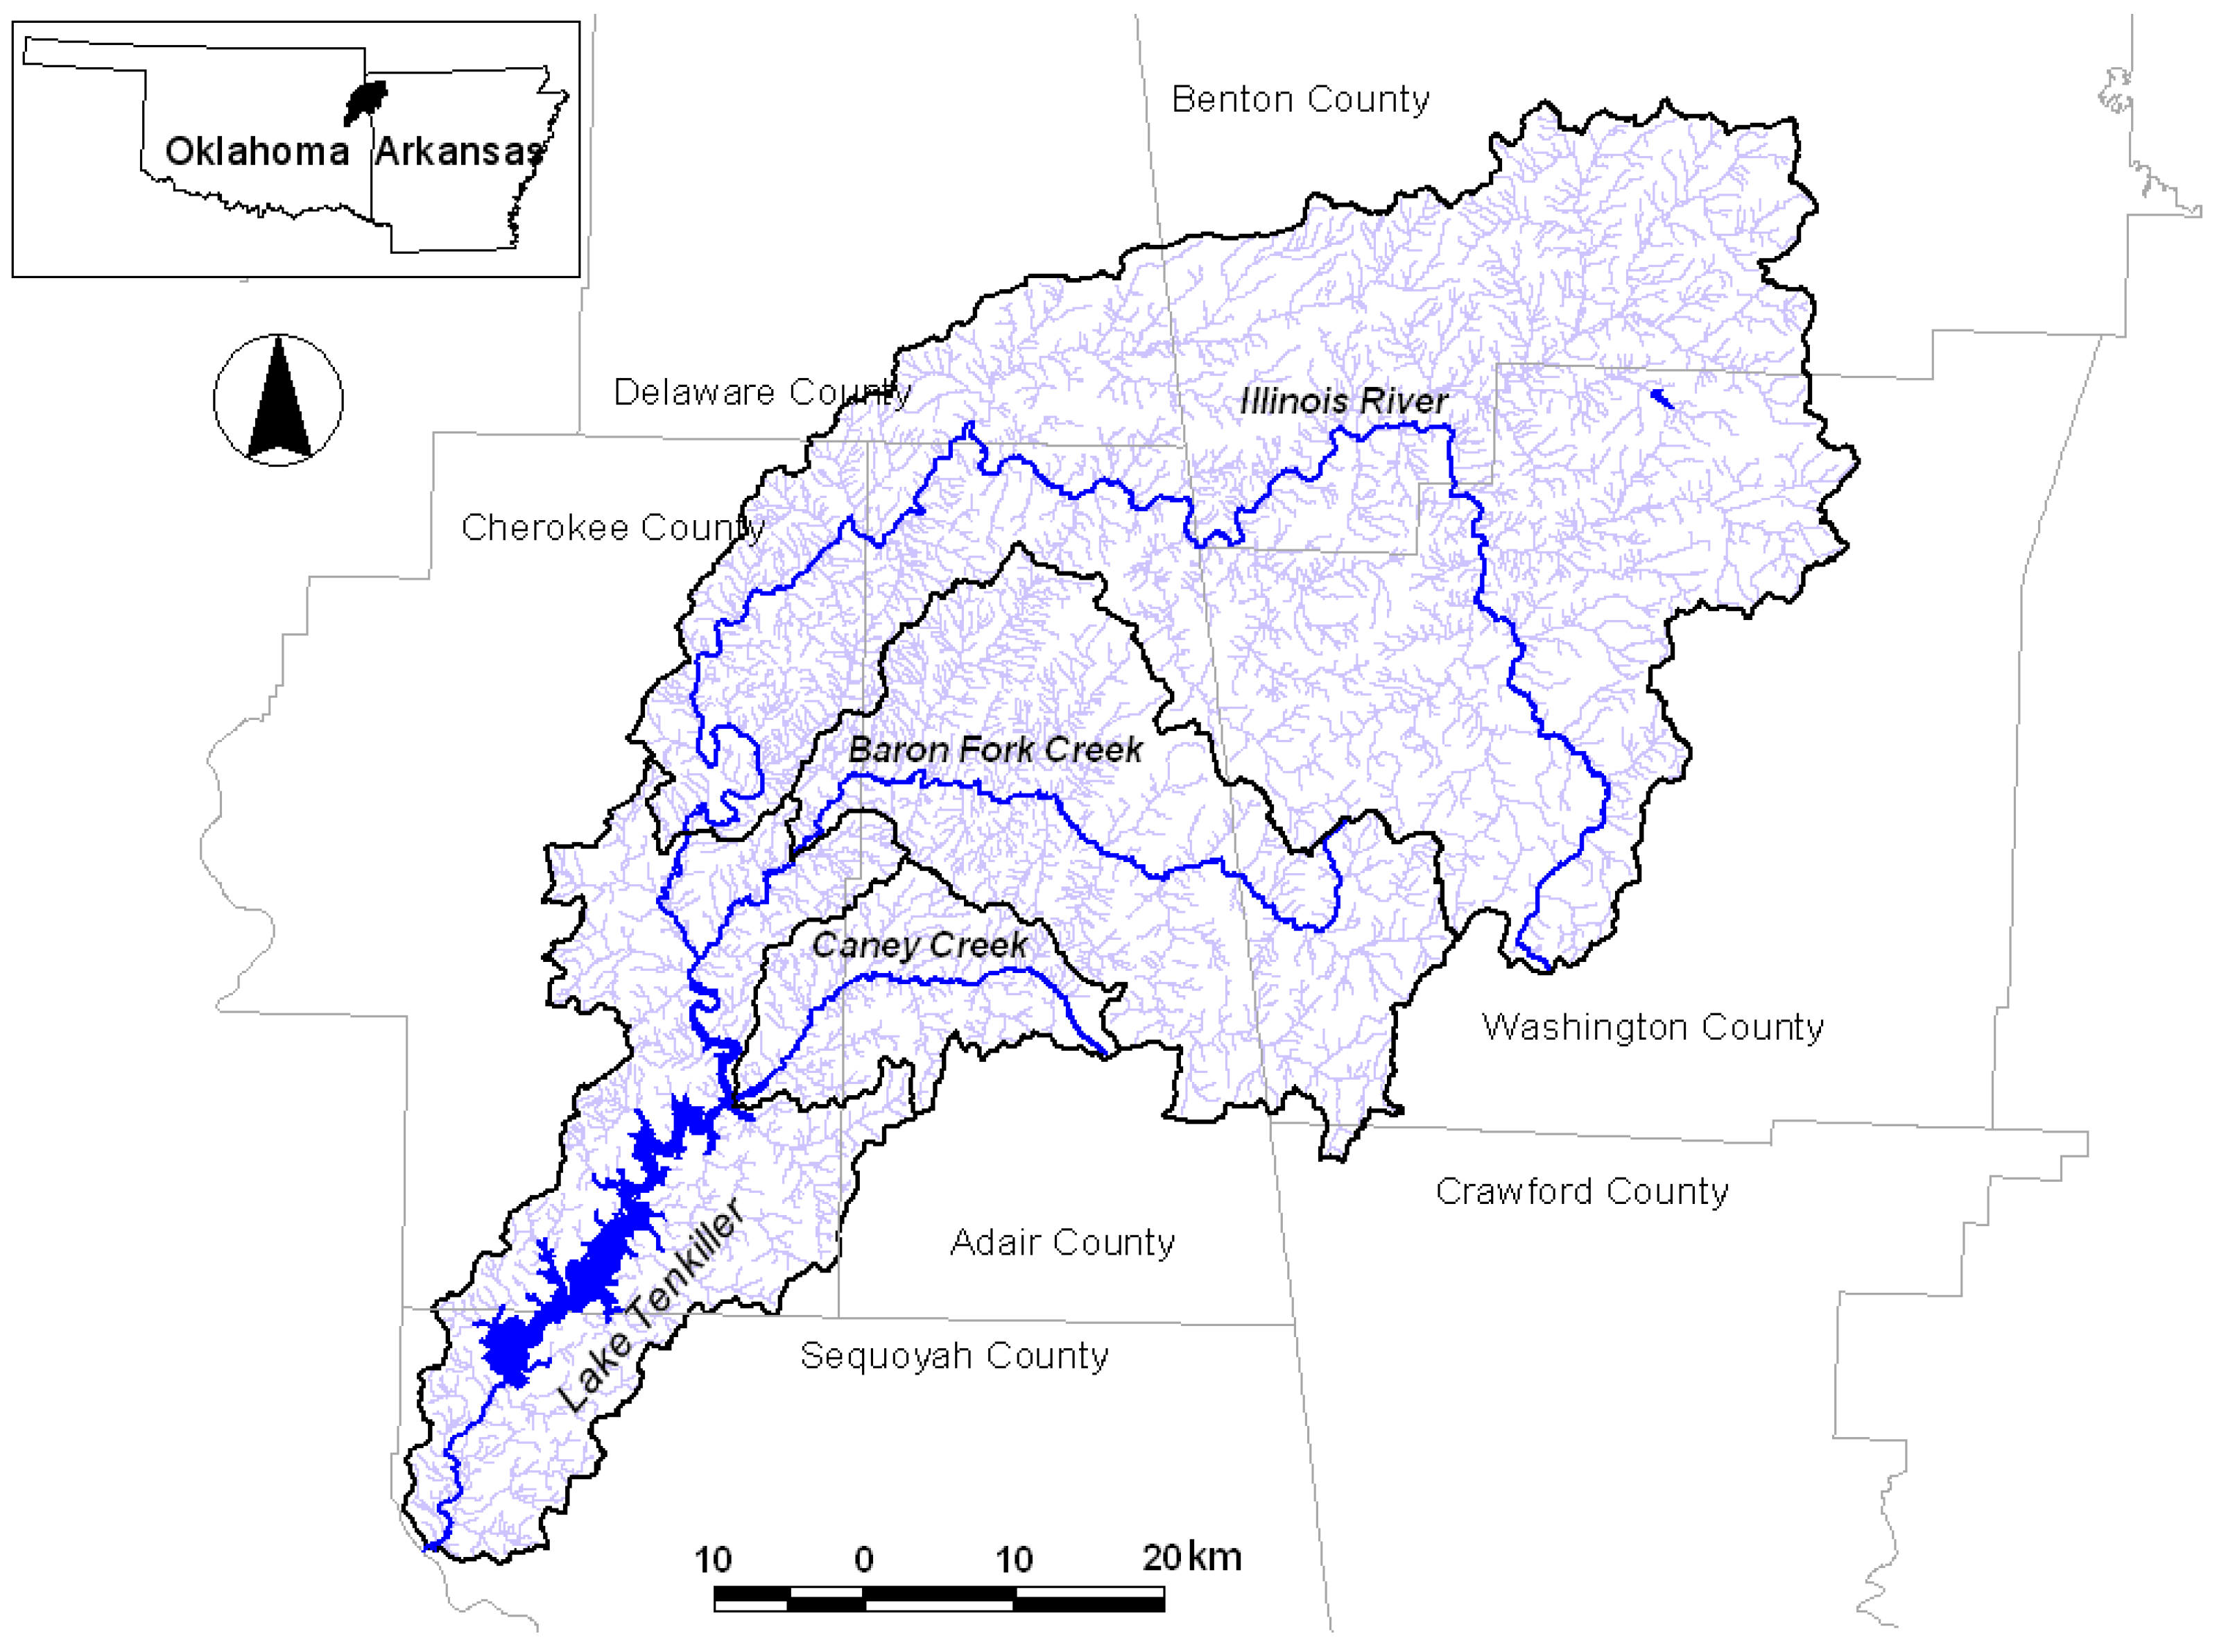
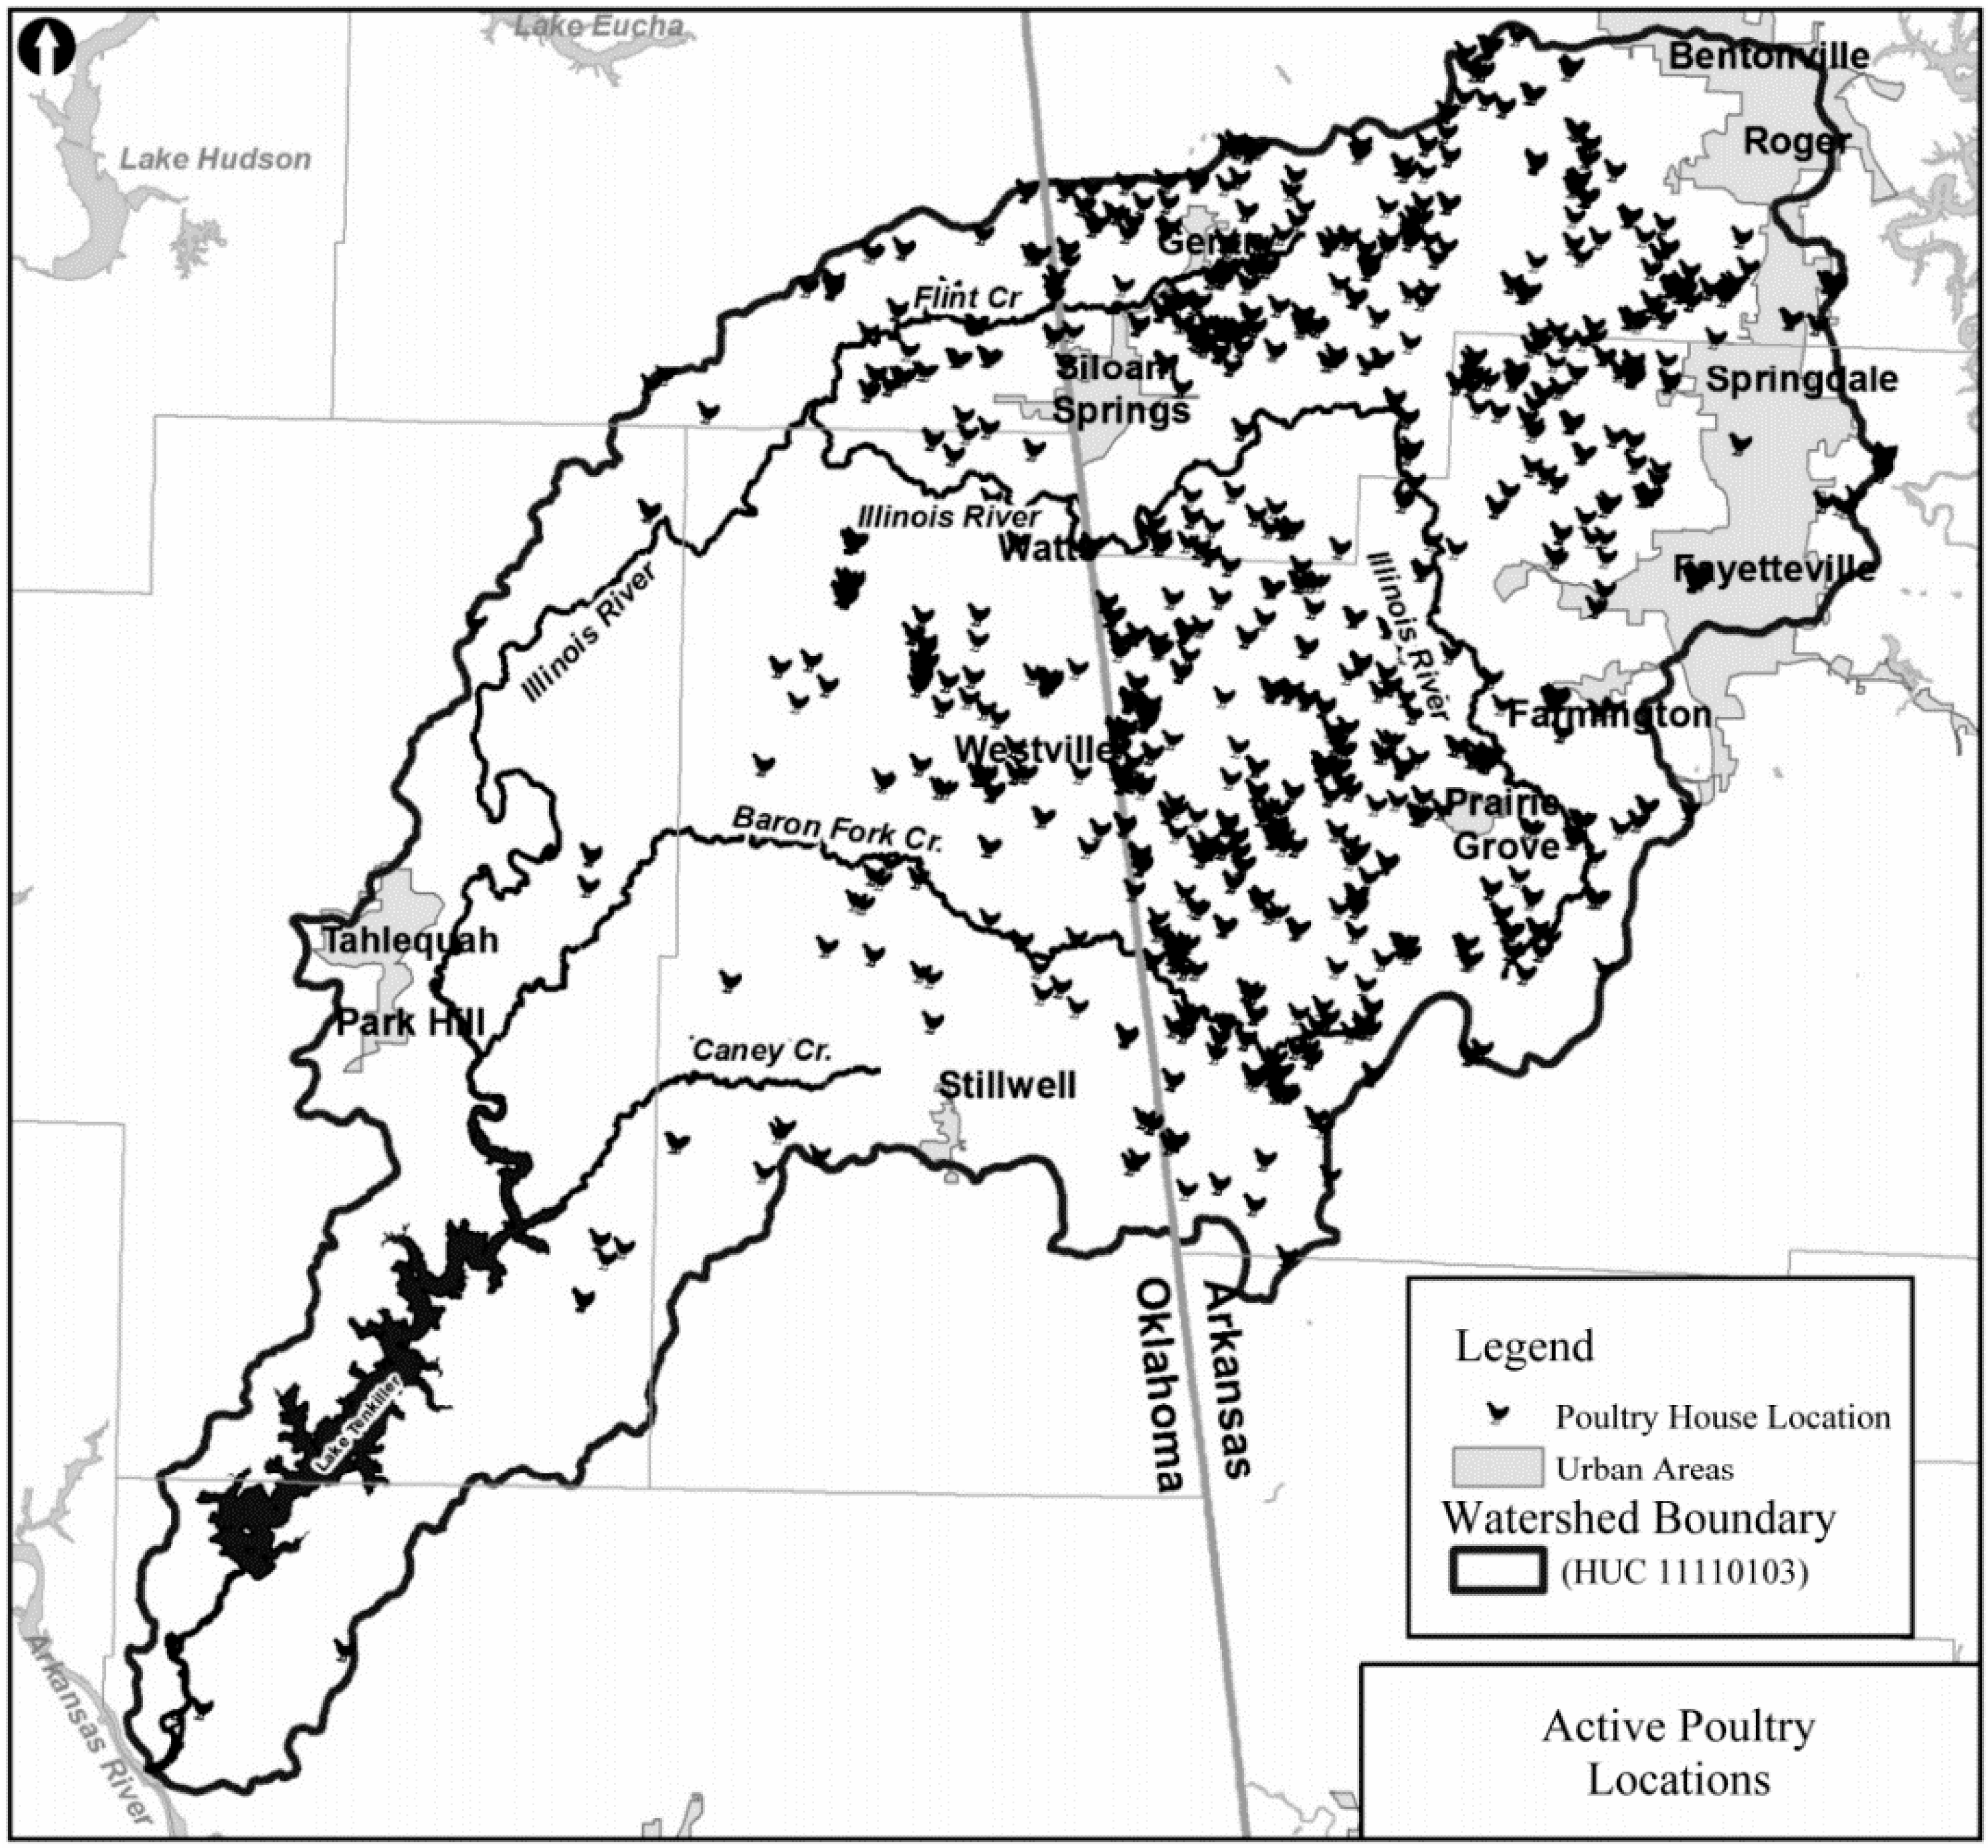
2.1. Study Area

The Illinois River Watershed encompasses nearly 4257.3 km2 in northeast Oklahoma and northwest Arkansas (Figure 1). The watershed spans seven counties and feeds the largest reservoir in Eastern Oklahoma, Lake Tenkiller which is also known as Tenkiller Ferry Reservoir. The Illinois River was designated a “Wild and Scenic River” in 1970 and benefits from state protection this designation provides. This protection promotes tourism in the watershed, which sees its peak between April and September when stream flow and temperatures are best for river activities [30]. The main recreational activity in the watershed is canoeing/kayaking, but other activities include camping, fishing, hiking, hunting, horseback riding, wildlife viewing, and sightseeing.
Figure 1. Lake Tenkiller and Illinois River watershed in southwest Arkansas and northeast Oklahoma.
Sustainability 07 10115 g001
Reports of diminishing water quality caused by eutrophication of Lake Tenkiller and water quality degradation of the Illinois River and its tributaries have prompted concern from both local citizens and state officials [31]. The eutrophication has been attributed to excess nutrients, specifically P. Poultry waste application within the IRW to pastures is identified as a substantial contributor to overall P loads within IRW streams and rivers and Lake Tenkiller [32]. Poultry waste produced within the IRW ranges between 354,000 and more than 500,000 tons annually and a substantial amount of poultry waste is land applied within the IRW annually [33]. The annual average P load entering Lake Tenkiller was about 577,000 pounds-P per year, and more than 86% of the total P load was transported to the lake by runoff which is predominately nonpoint source pollution [34].

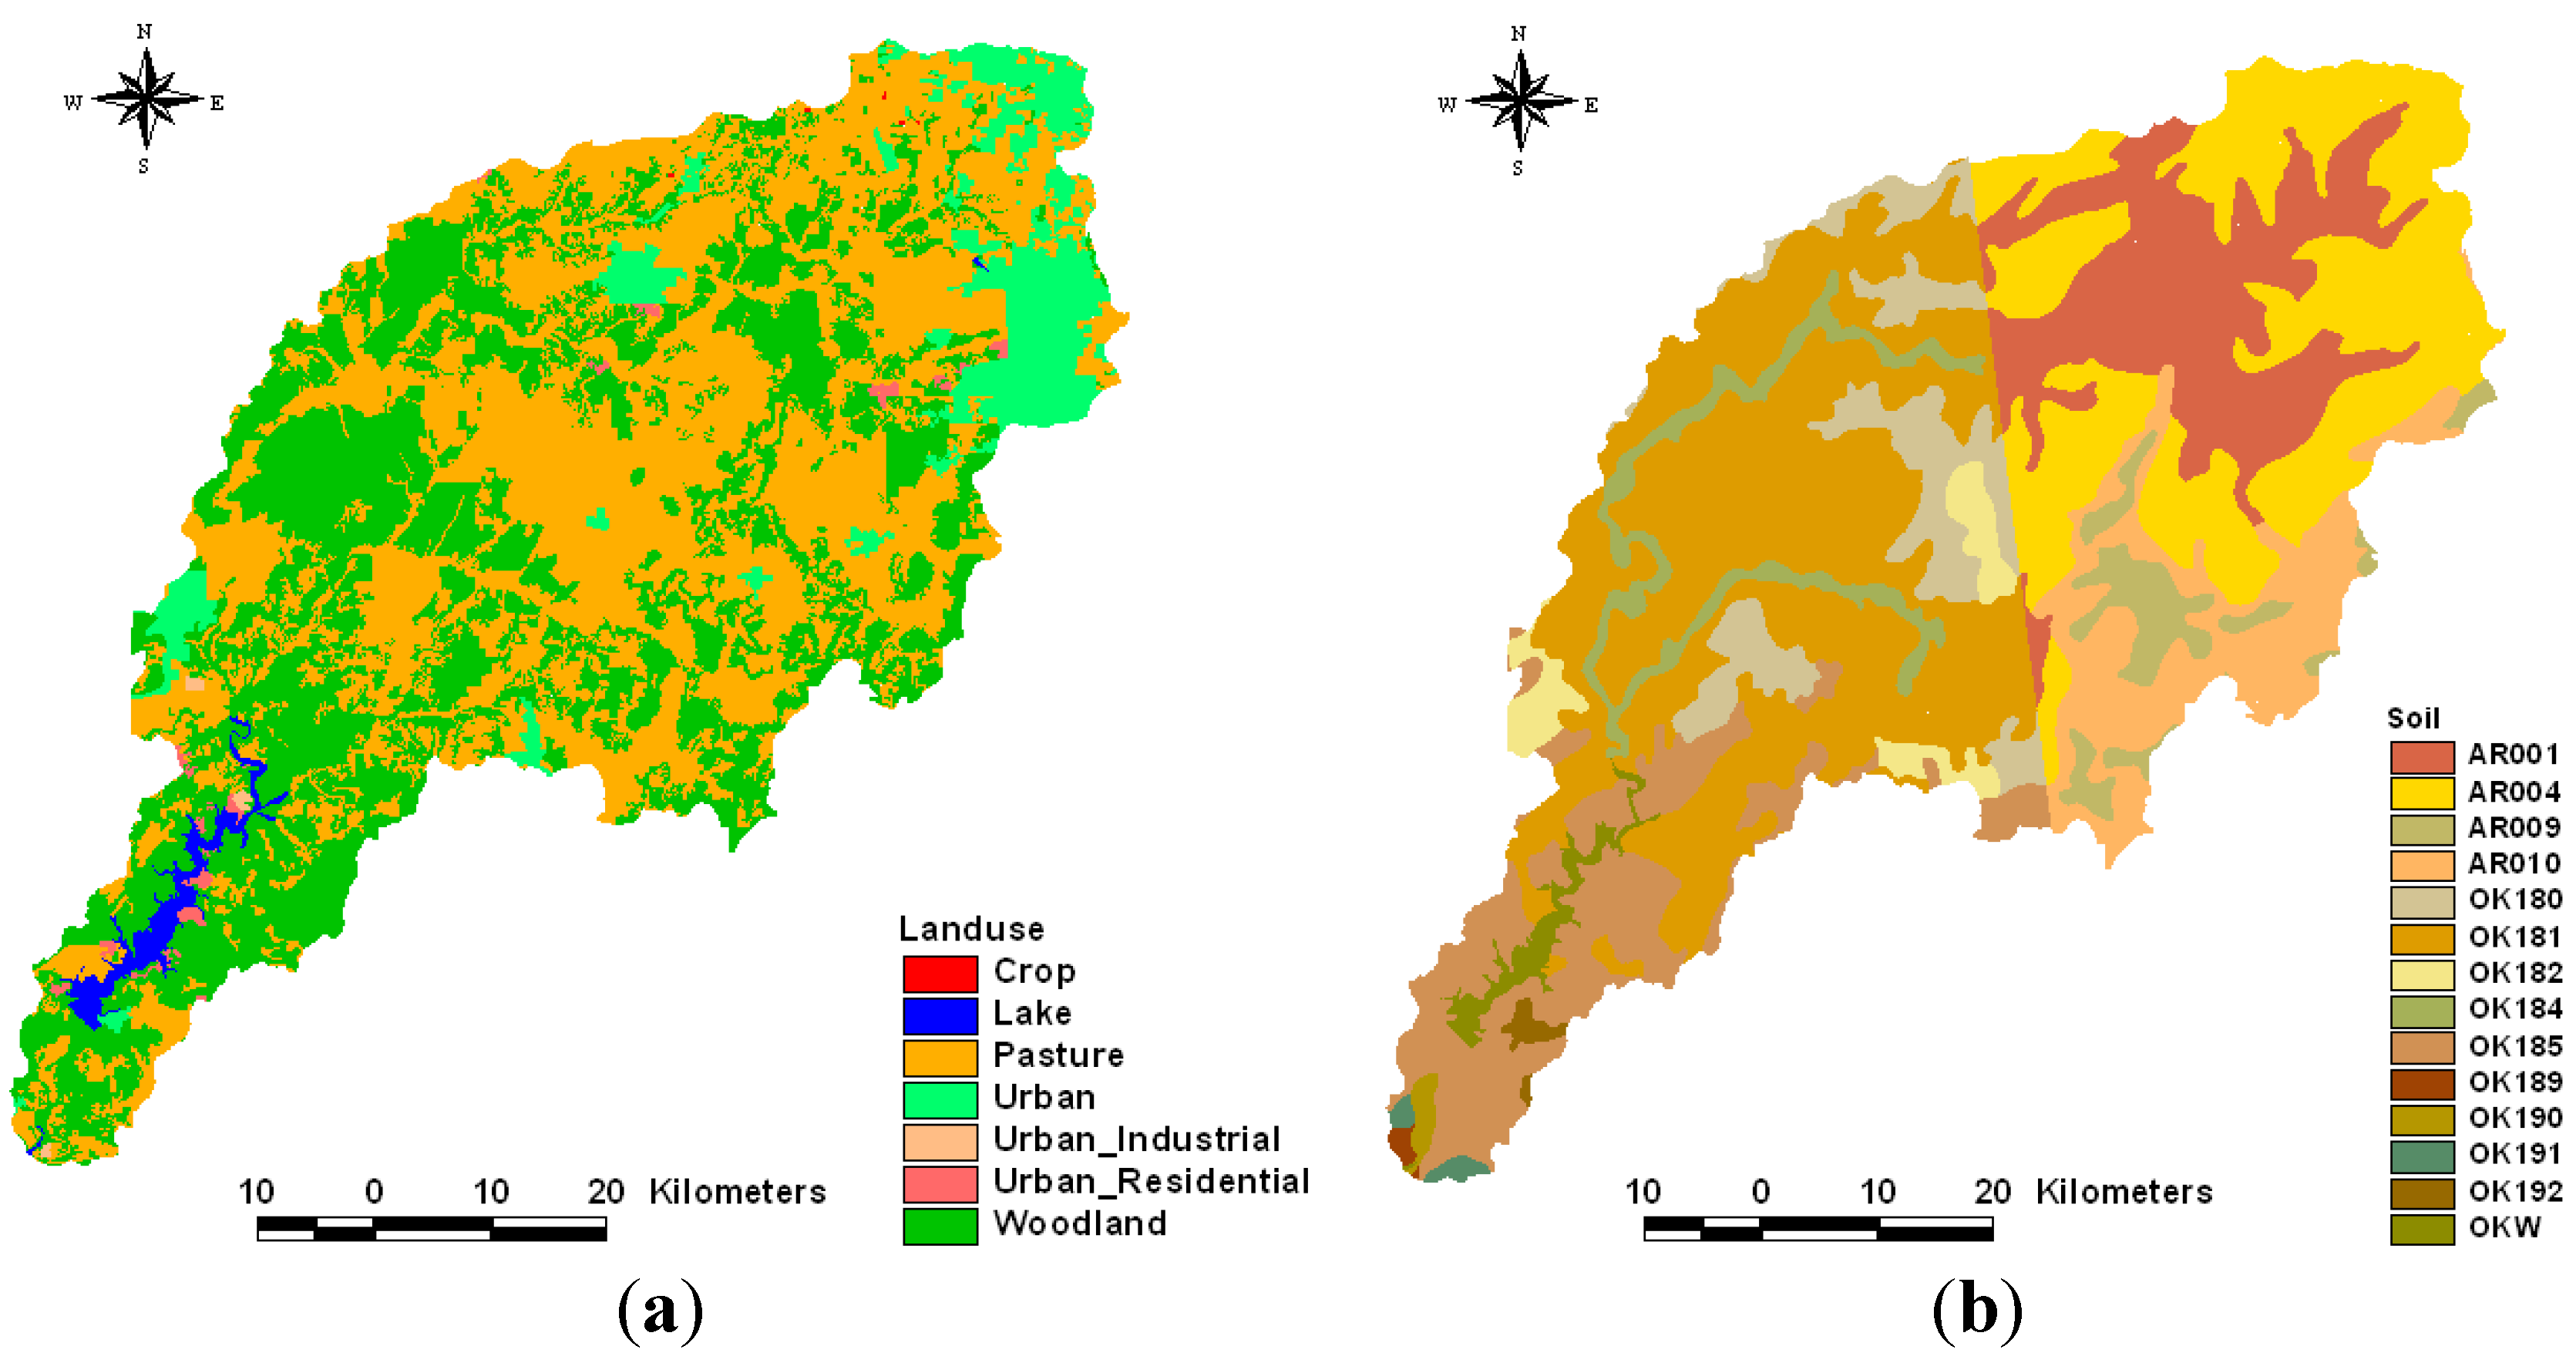
2.2. Data Preparation

The National Land Cover Dataset (NLCD) for 2001 was used to provide land use information for modeling (Figure 2a). The primary land use type is pasture at about 50% (2126 km2) of total watershed area followed by forest with about 40% (1728 km2) of total area. Urban land uses comprise approximately 9% of the area and water and crops make up a small portion of the watershed. The spatial distribution of soil data and soil properties were obtained from the State Soil Geographic (STATSGO) database. The soil groups were divided into 14 categories by STMUID and major soil group (Figure 2b). The STATSGO database contains numerous soil properties for each soil group that were used in parameterizing GLEAMS. The watershed topographic characteristics were determined from the digital elevation model (DEM) from the USGS with a 30m grid cell resolution. Observed daily precipitation and average monthly temperature data were obtained from the National Climatic Data Center (NCDC). Soil Test Phosphorus (STP) data from the University of Arkansas and Oklahoma State University were used to determine STP by county. Stream flow data were obtained from USGS stream flow gauging stations nearest Lake Tenkiller, and USGS stream flow gauging stations used are listed in Table 1. The sum of flow and P loads from subwatersheds named Illinois River at Tahlequah, Baron Fork, and Caney Creek based on USGS gauge stations provide inputs to Lake Tenkiller referred to as “total” in this study.
Figure 2. Landuse and soil map in the Illinois River watershed. (a) Land use map; (b) Soil map.
Sustainability 07 10115 g002
Table 1. USGS gage stations for each watershed.
Watershed NameUSGS Gage Station
Illinois River at TahlequahUSGS 07196500 Illinois River near Tahlequah, OK
Baron ForkUSGS 07197000 Baron Fork at Eldon, OK
Caney CreekUSGS 07197360 Caney Creek near Barber, OK
Poultry house locations were identified from aerial photography, and active houses were identified through examination of records and site investigation in the field. Poultry waste generation for the 2005–2006 period was computed based on the active poultry houses in the IRW and poultry waste production data from an adjacent watershed (Eucha-Spavinaw) [35]. The computed waste was 354,000 tons containing 4642 tons of P [33]. The poultry house location data were used to allocate waste application to pastures as shown in Figure 3. The USDA Agricultural Census data on livestock production were used to compute P additions to the watershed for livestock [36]. Total applied P by poultry waste is shown in Table 2.
USGS and the Oklahoma Water Resources Board (OWRB) water quality samples and USGS flow data were used to compute observed P loads at the study gauging stations between 1997 and 2006 using LOADEST [37].
Figure 3. Distribution of active poultry houses in the Illinois River watershed [33].
Sustainability 07 10115 g003
Table 2. Calibration and validation tolerances or targets.
ItemRelative Error (%)
Very GoodGoodFair
Hydrology/Flow<1010–1515–25
Sediment<2020–3030–45
Water Temperature<78–1213–18
Water Quality/Nutrients<1515–2525–35
Pesticides/Toxics<2020–3030–40

2.3. GLEAMS Application

The GLEAMS and a routing equation derived from observed flow and P load data in IRW were used to model P losses from nonpoint sources and to route NPS and point source P to Lake Tenkiller. The IRW was divided into hydrologic response units (HRUs) and GLEAMS applied to each HRU. This approach is used by other models such as SWAT [38], and many other researchers have applied GLEAMS using this approach [26,39,40,41,42,43]. Land use and soil data were combined using a GIS intersection process to identify HRUs. GIS elevation and watershed boundary data were used to subdivide HRUs to place them within the study watersheds. The combination of GLEAMS and a routing equation is similar to the approach by Ouyang [44] and Wagner et al. [45] in modeling P loads from a watershed reaching Lake Okeechobee because GLEAMS does not simulate P routing in stream/rivers. Many other researchers have developed pollutant routing models to simulate transportation of pollutants from sources to receiving water and most of P routing equations are power functions with stream flow rate [46,47,48,49]. A P routing model was created for each gauging location used in the modeling effort (Tahlequah, Baron Fork near Eldon, and Caney Creek). The equations were of the form:
P l o a d = a + b × Q × P a c c + c × Q 2 × P a c c
where, Pload is a daily P load in kg, a, b, and c are empirical coefficients obtained during equation calibration, Q is daily flow rate at USGS gauge (m3/s), and Pacc is computed P accumulated in the stream or river (kg).
P loads from point sources (waste water treatment plants) were directly input to streams and rivers for routing through the streams/rivers to Lake Tenkiller. Nonpoint sources of P loads were modeled with GLEAMS. Individual BMPs within each HRU were not considered explicitly by the modeling system, rather calibration was used to incorporate impacts of existing BMPs into the calibrated model. Some soil parameters were initially estimated from STATSGO soil properties and then calibrated based on observed runoff and nutrient loss data. These include effective saturated conductivity, curve number (CN), rooting depth, depth of bottom of each soil layer, soil field capacity, soil wilting point, soil saturated hydraulic conductivity, and soil organic matter. The relative values of soil parameters across soils were linked so it was only necessary to calibrate a parameter linking soil properties rather than each soil property for each soil.
Calibration and validation processes were performed based on approximately 10-year simulation periods for hydrology, considering available data. For the hydrologic simulation, calibration was performed using data for 1996–2005, and validation was performed using data for 1986–1995. Caney Creek was an exception, since observed flows for Caney Creek were not collected prior to 1998, and therefore Caney Creek calibration used 1998 through 2006 data. The watershed drained by Caney Creek is much smaller than the other gauged watersheds and also contributes much less P due to its land uses and management. For the P simulation, calibration was performed with 1998 through 2002 data, and validation was performed using 2003 through 2006 data. Beginning in 1998, runoff events were targeted for P sampling and thus P data from 1998 through 2006 were used in the P calibration and validation.
Statistical analysis including goodness of fit (R2), Nash-Sutcliffe coefficients, and relative error was used for model performance, and relative error was used for evaluating calibration and validation success as shown in Table 2 [50].

2.4. Scenario Development

Modeling scenarios were devised to quantify P loads to the three gauging station locations closest to Lake Tenkiller (Illinois River at Tahlequah, Baron Fork and Caney Creek). To model future scenarios, weather data representing the 1997–2006 period was used, as this period has the best available data for the IRW and was used for modeled P calibration and validation. In addition, the rainfall and flows into Tenkiller for this period are variable (dry years and wet years), representing much of the anticipated level of variability. The scenarios include continuation of poultry waste land application at current levels (1997–2006) in the IRW named Scenario 1, cessation of all poultry waste land application in the IRW (Scenario 2), an increase in poultry waste land application based on continued growth in the poultry industry within the IRW (Scenario 3), and buffers along third order and larger streams with cessation of poultry waste application in the IRW (Scenario 4). Modeling scenarios are summarized in Table 3.
Table 3. Scenarios for controlling P load from IRW.
NameDescription
Scenario 1Continued poultry waste application to pastures at present rates
Scenario 2Cessation of poultry waste application
Scenario 3Growth in IRW poultry numbers based on 1982 to 2002 growth and corresponding waste application
Scenario 4Cessation of poultry waste application combined with buffers along streams
Wells et al. [51] used the model results in this study to drive a hydrodynamic and water quality of Lake Tenkiller.

3. Results and Discussion

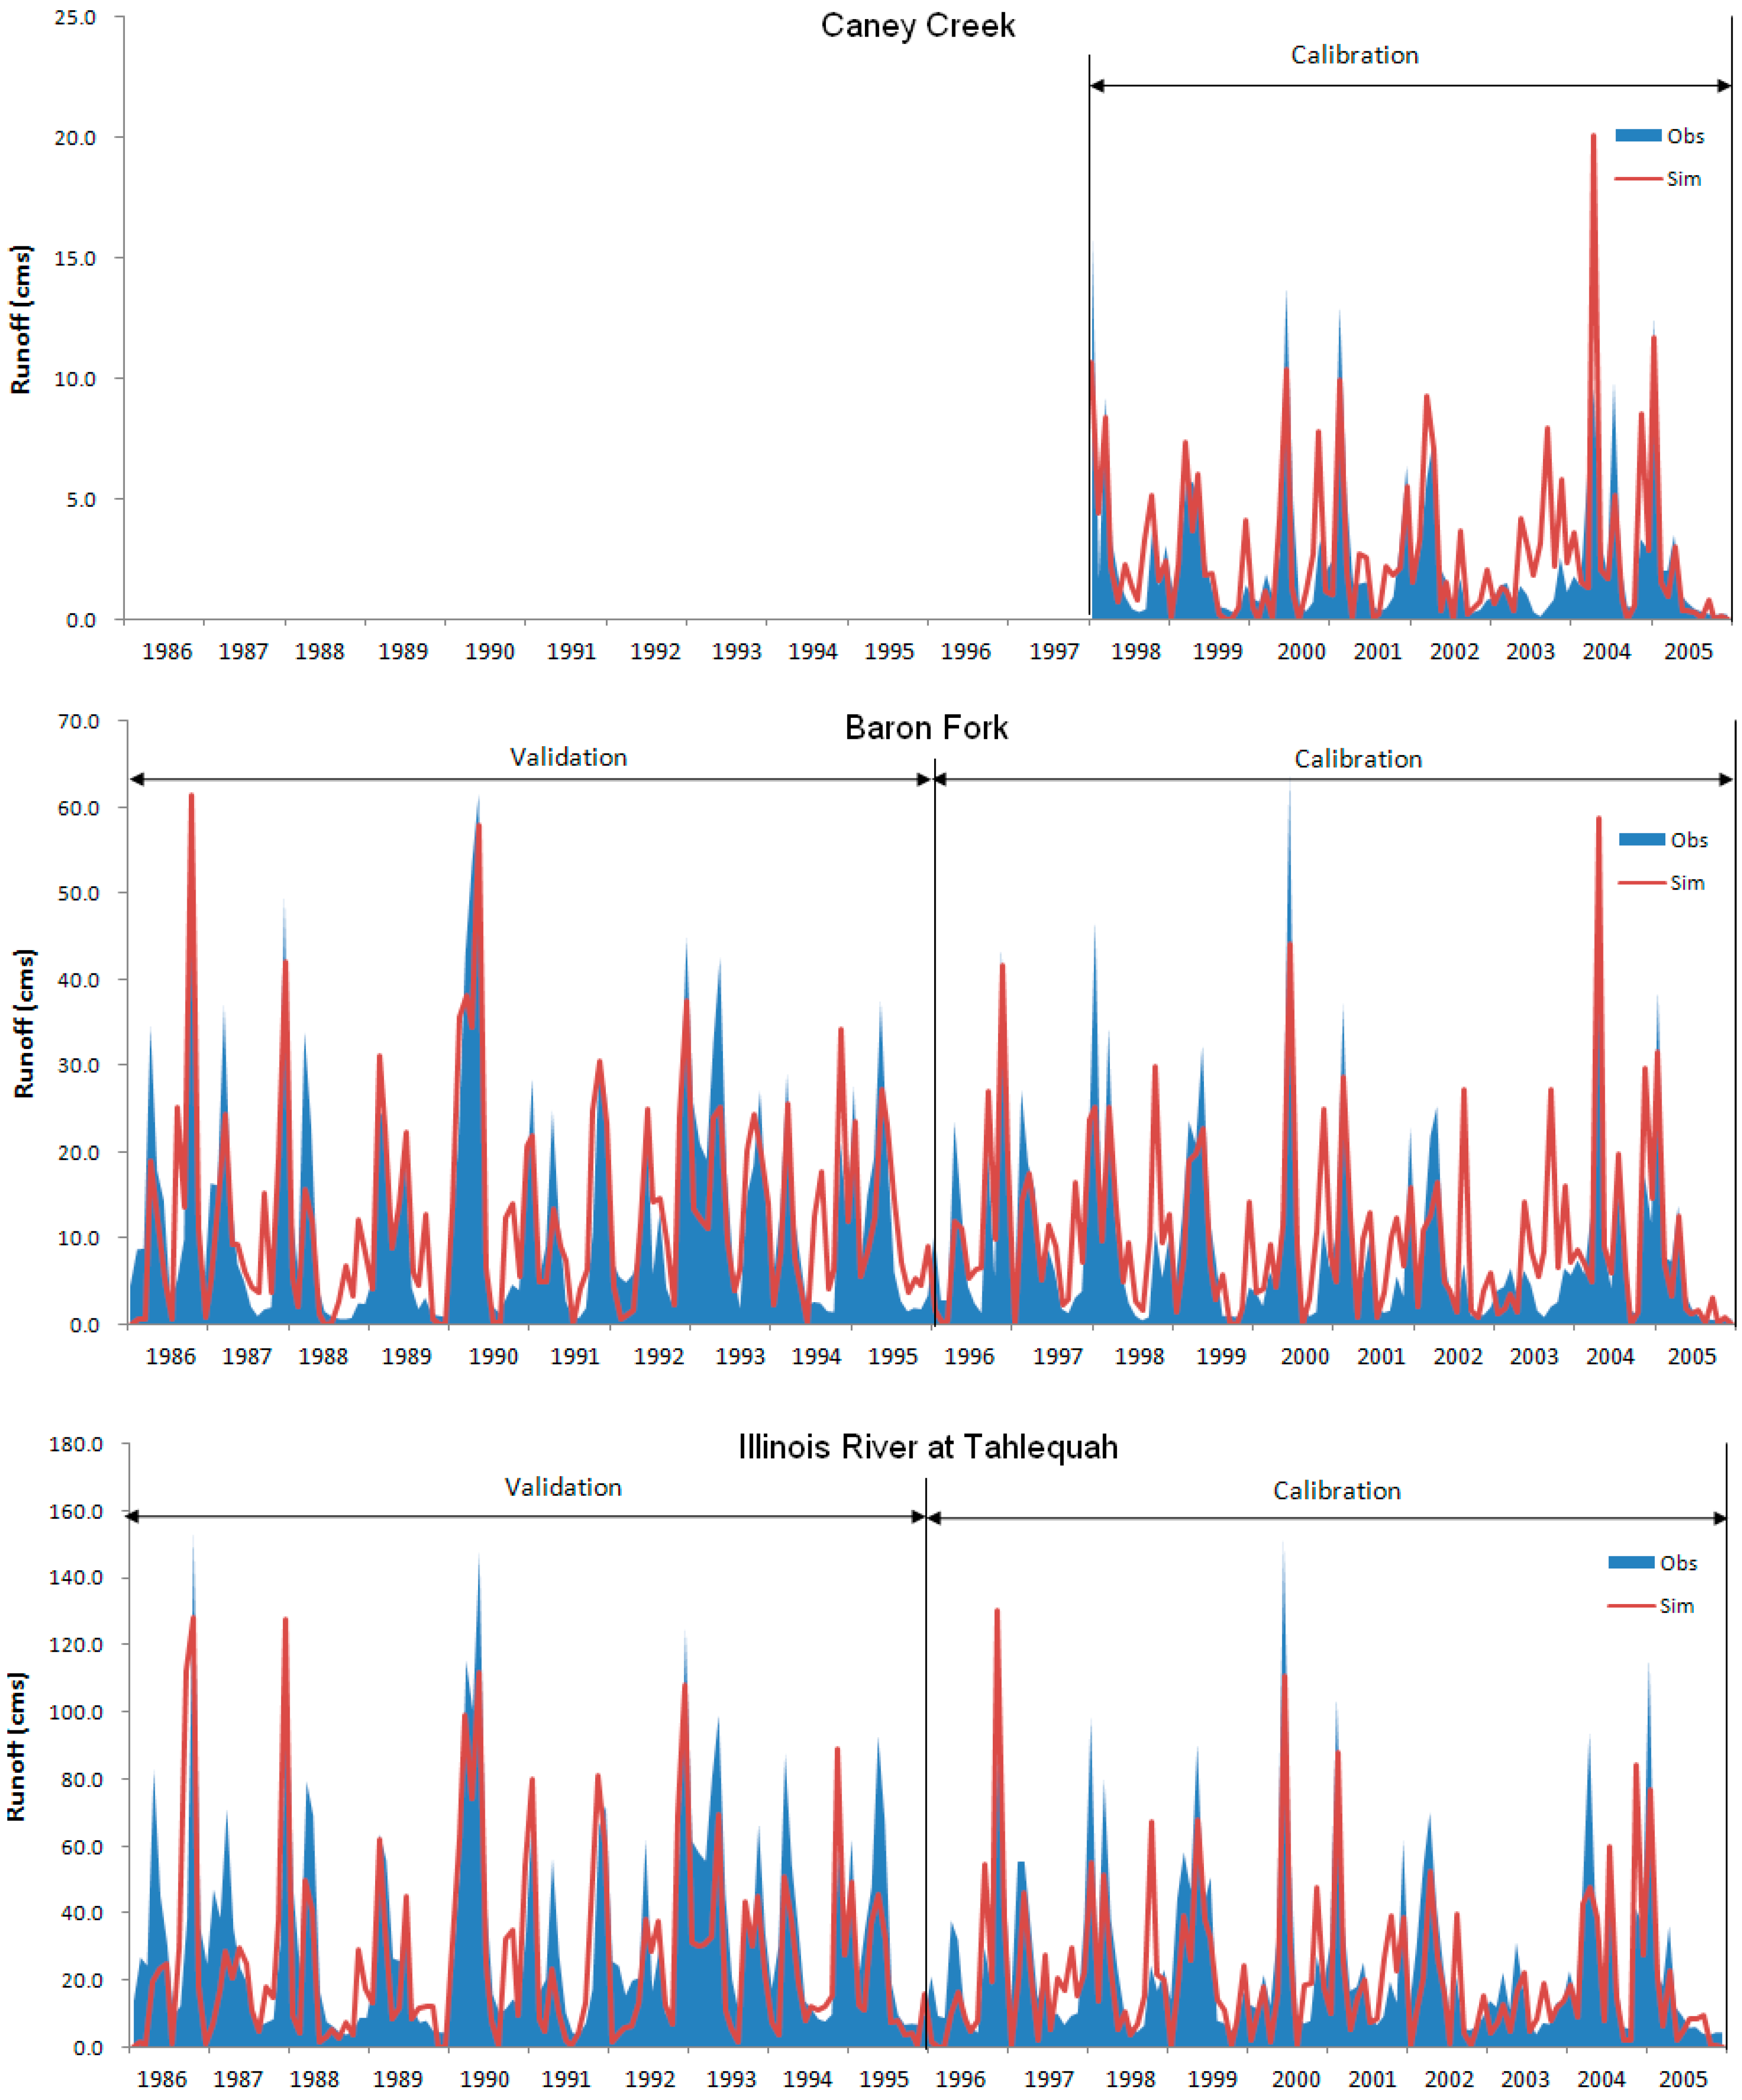
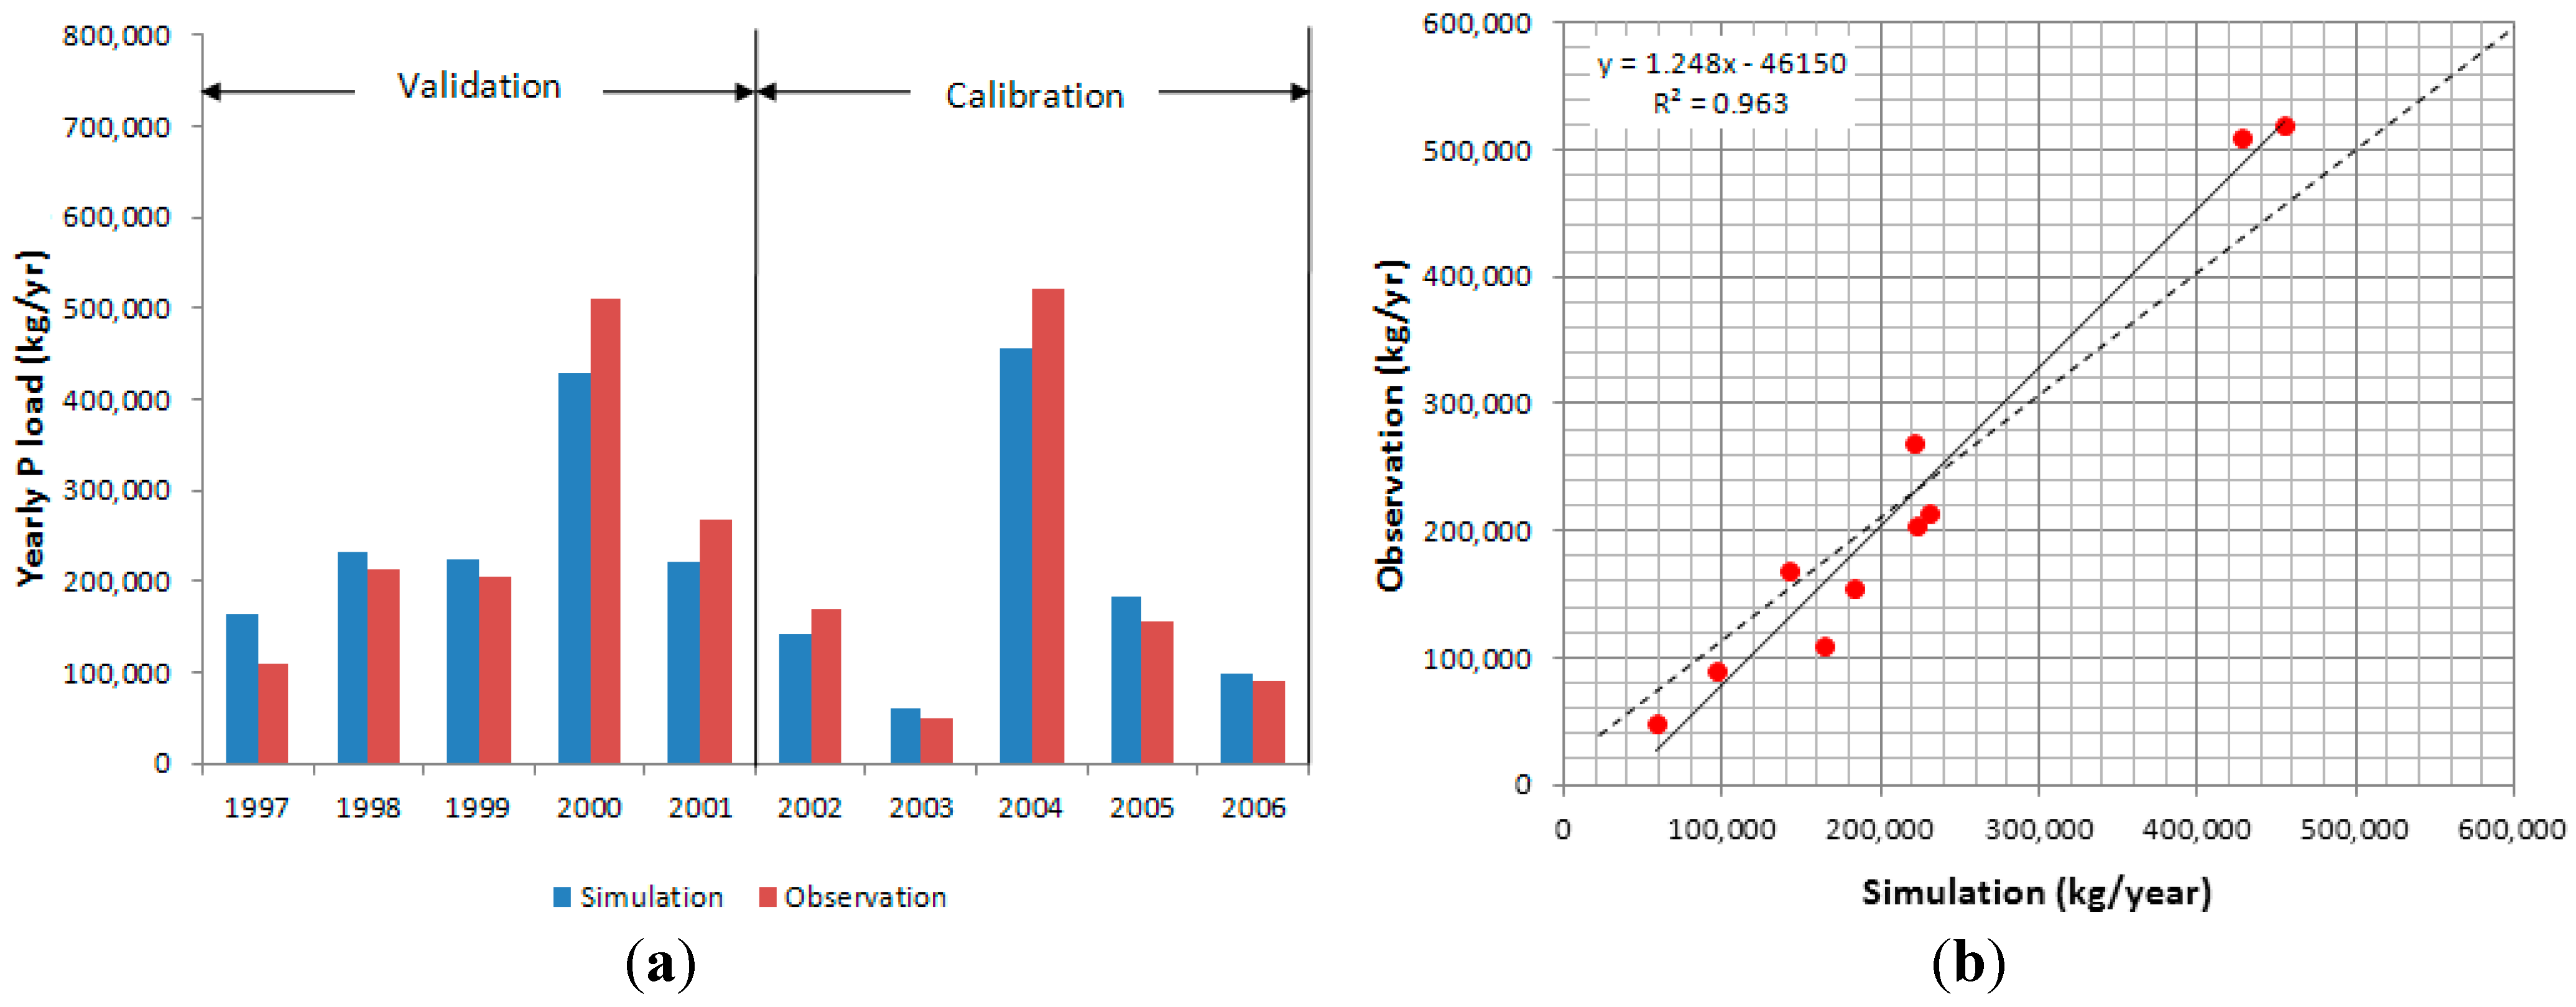
3.1. GLEAMS Calibration and Validation

The comparisons of monthly observed and simulated runoff for calibration and validation during 1986–2005 are shown in Figure 4. Monthly calibration for Baron Fork, Caney Creek, and Illinois River at Tahlequah produced Nash-Sutcliffe efficiencies (NS) of 0.64, 0.51, and 0.63, respectively, and RE of 6%, 8%, and −20%, respectively (Table 4). Calibration performances were “very good” for Baron Fork and Caney Creek and “fair” for Illinois River at Tahlequah. Monthly validation for Baron Fork and Illinois River at Tahlequah resulted in RE values of −5% and −27%, respectively. The results illustrated that the calibrated GLEAMS model could predict flow for a range of conditions (Table 4).
Figure 4. Calibration and validation for monthly runoff.
Sustainability 07 10115 g004
Table 4. Model performance for calibration and validation of monthly runoff.
WatershedsCalibrationValidation
NSR2REPerformanceNSR2REPerformance
Baron Fork0.640.656Very good0.730.73−5Very good
Illinois River at Tahlequah0.630.68−20Fair0.590.67−27Fair
Caney Creek0.510.608Very goodData is not available
Yearly P load to Tenkiller is shown in Table 5. Average yearly P load to Tenkiller was 228,896 kg/year for the study period. As both the modeled and observed P loads show, the loads vary greatly from year to year. This is due to the variation in weather and flows within the IRW. The statistical analysis for calibration and validation of P load to Tenkiller is shown in Table 6 and Figure 5. Both performances were “Very good” for Tenkiller showing −3% and 5% relative errors for calibration and validation, respectively.
Table 5. Modeled P load at Gauging stations in Illinois River watershed.
YearModeled P LoadObserved Total P Load
Illinois River at TahlequahBaron ForkCaney CreekTotal
1997126,53228,0299922164,483109,364
1998184,34839,9416877231,165214,013
1999195,31524,1033545222,963204,316
2000289,965118,35519,040427,361510,540
2001175,44433,11911,954220,517268,751
2002115,26622,7894813142,869168,153
200354,6472894135858,89949,113
2004304,970123,25026,674454,894520,696
2005151,13626,6845780183,600154,523
200670,42721,685500497,11589,489
Average166,80544,0859497220,387228,896
Table 6. Model performance for P load to Tenkiller.
Calibration/ValidationAverage yearly P Load (kg)Relative ErrorPerformance
ObservationSimulation
Calibration (2002~2006)261,398253,298−3%Very good
Validation (1997~2001)196,395187,476−5%Very good
Figure 5. Calibration for total P load to Tenkiller. (a) Comparison of yearly total P load; (b) 1:1 scatter plot.
Sustainability 07 10115 g005

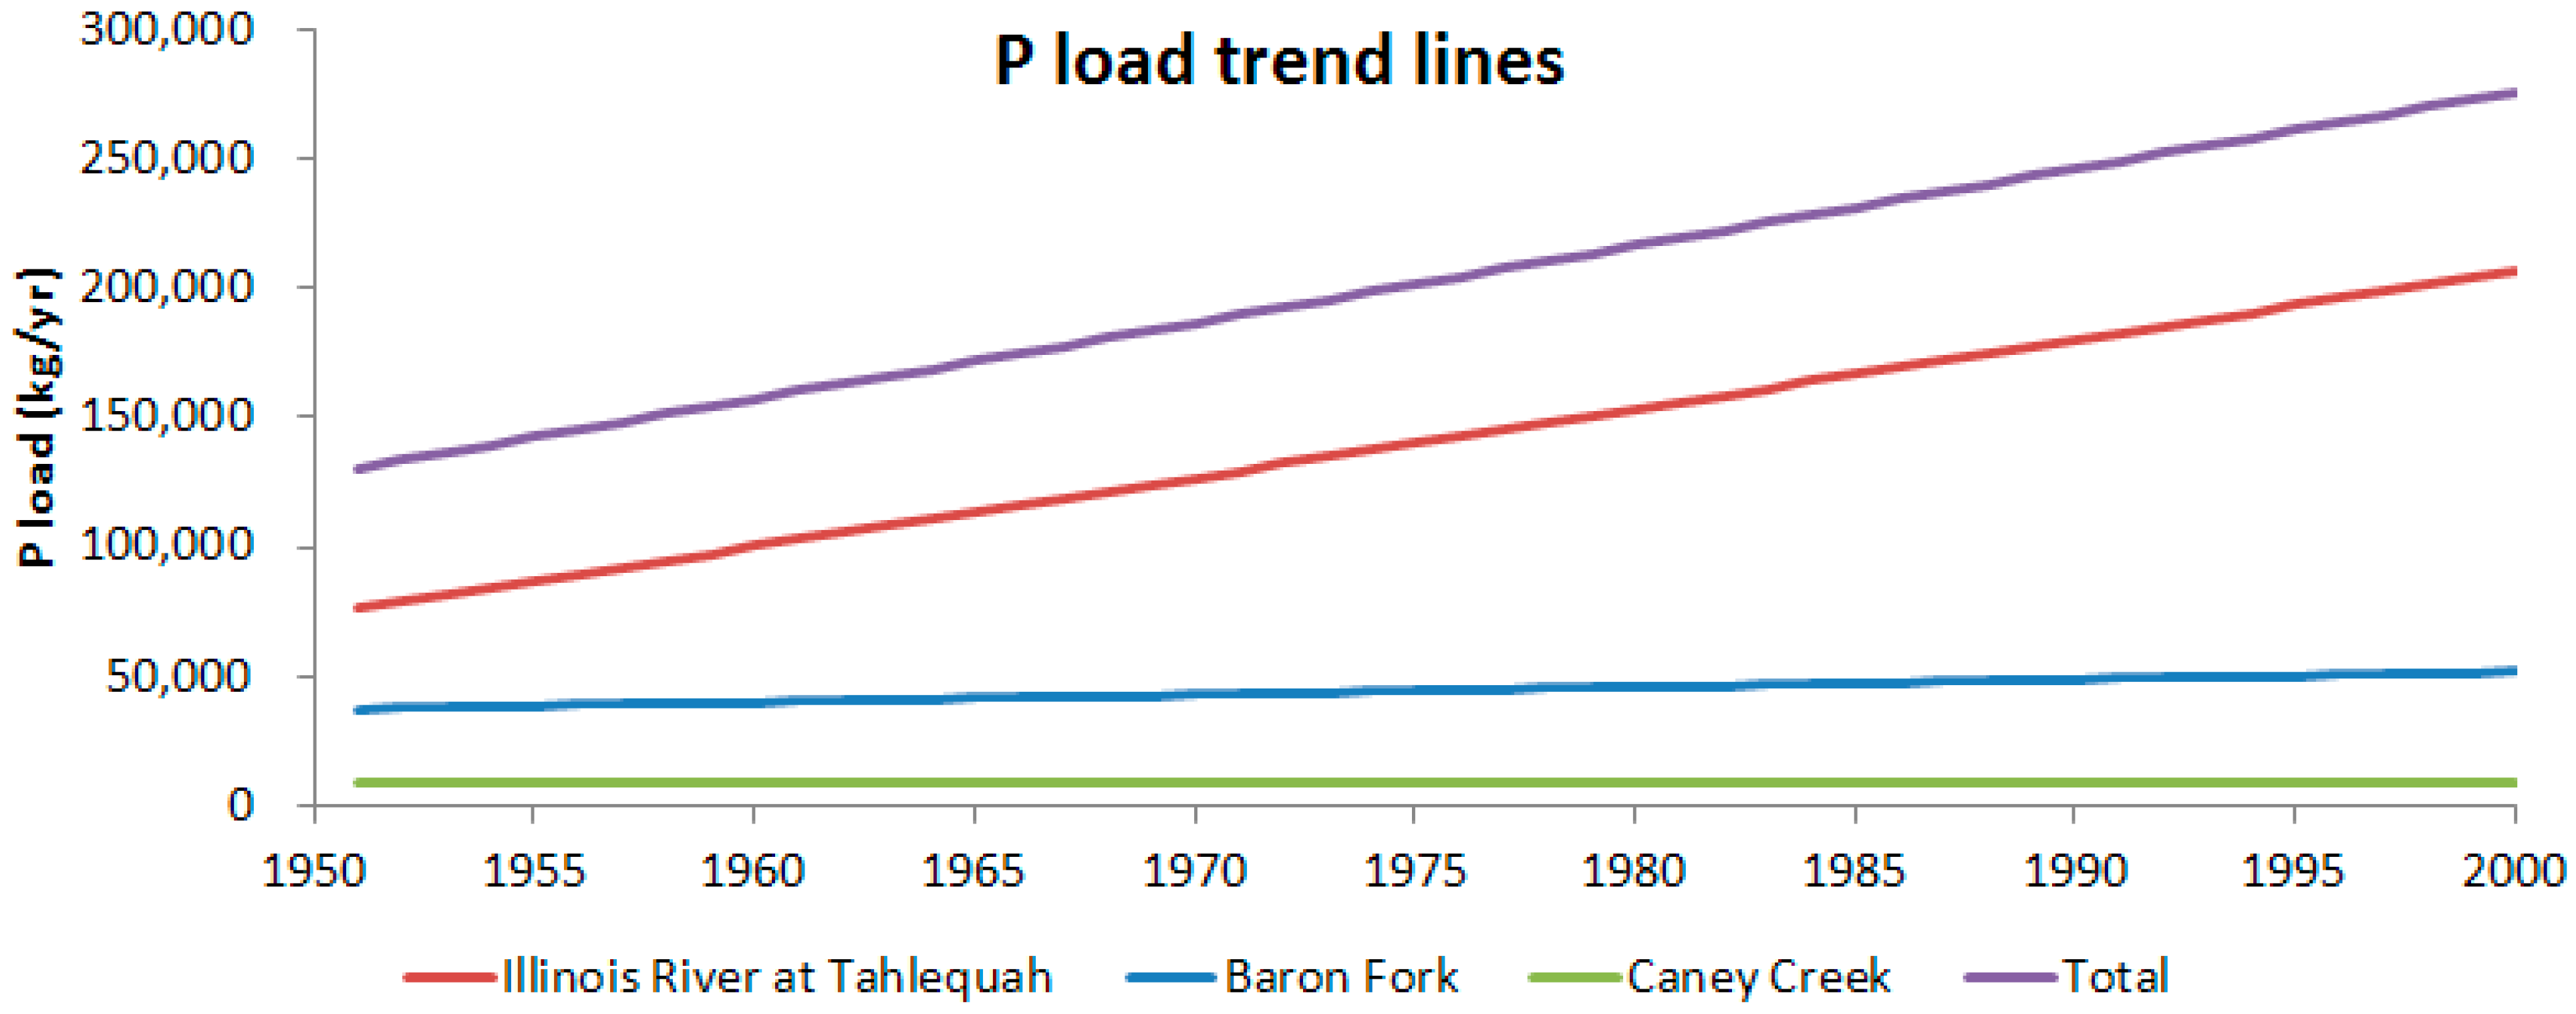
3.2. Historical P Loads in Illinois River Watershed Streams and Rivers
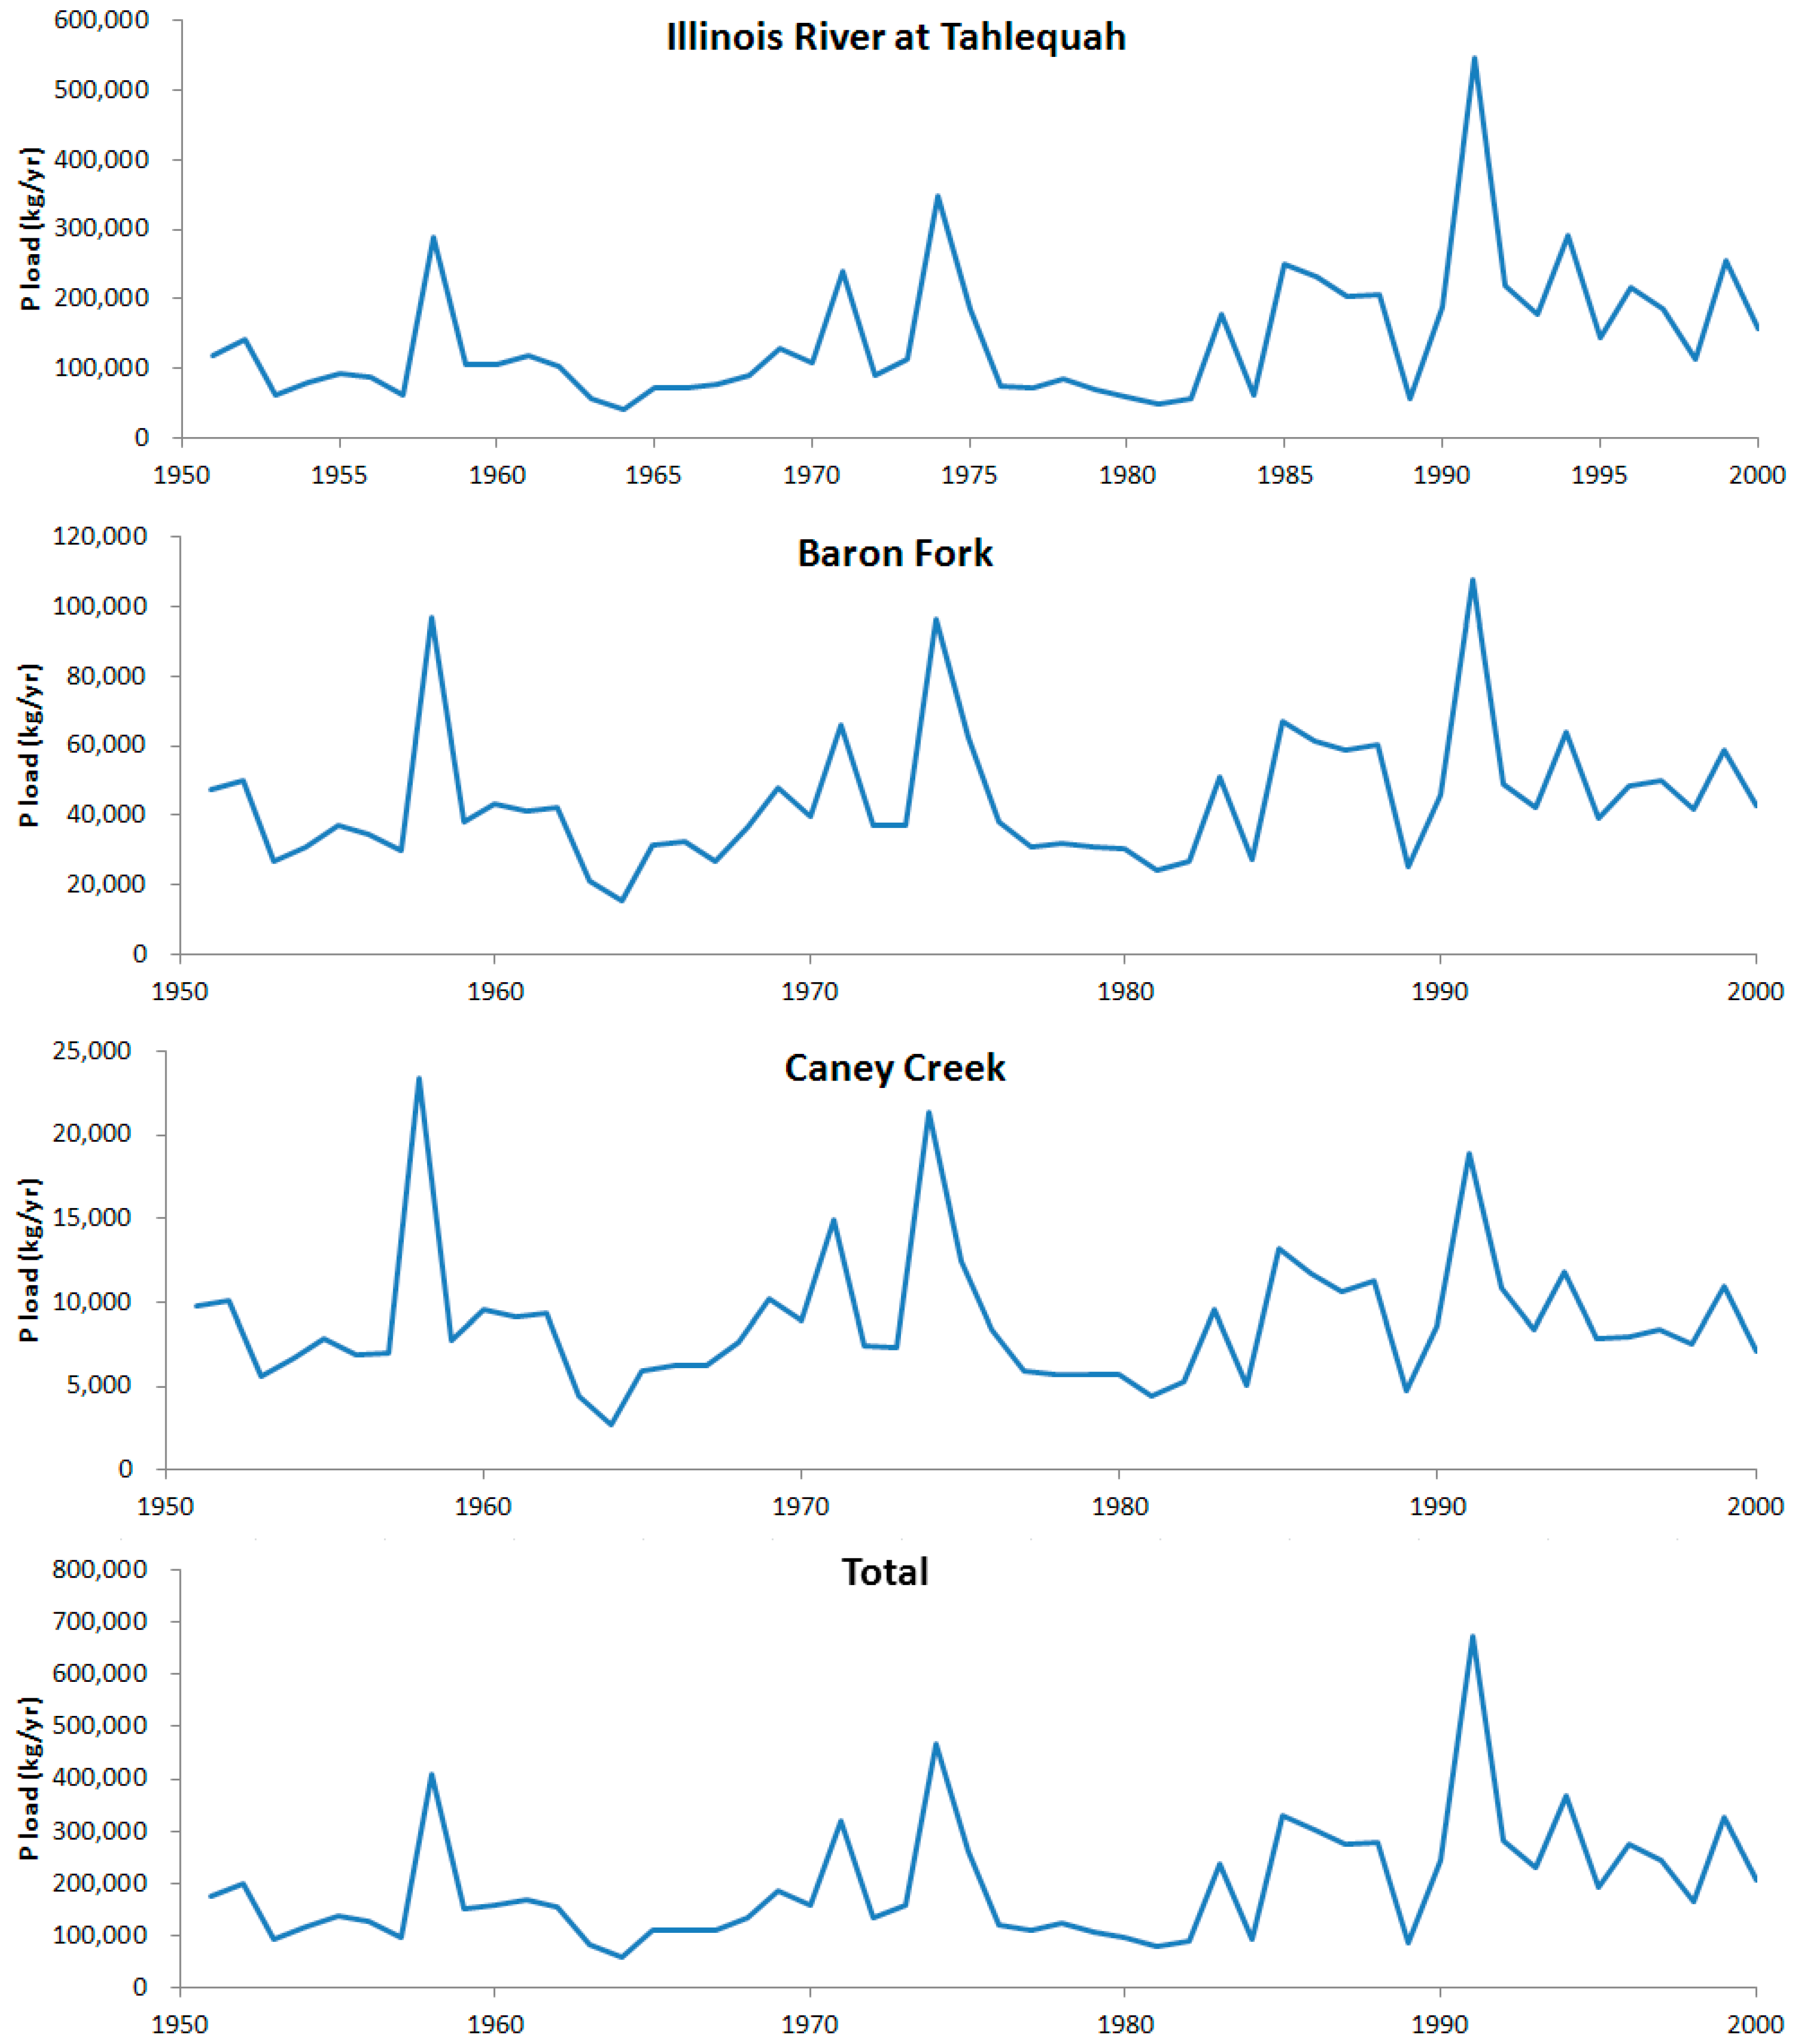
Figure 6 and Figure 7 show the modeled P loads from the IRW from 1951 to 2000. Soil P levels were assumed to be equivalent to current levels in Sequoyah County, which would be considered equivalent to soil P levels for the entire watershed in 1951. Poultry P applications to pastures in the IRW were based on historical poultry production in the watershed. P load has increased from the Illinois River at Tahlequah during the last 50 years, especially for 1990–2000. P load to Lake Tenkiller has increased from 166,706 kg/year to 295,406 kg/year based on the 10-year average P load (Table 7).
Figure 6. Historical P load trend during 1950~2000.
Sustainability 07 10115 g006
The trend line at Illinois River at Tahlequah indicates P loads increase approximately 4173 kg/year and at Baron Fork by approximately 349 kg/year. The Caney Creek watershed showed little change in P loads over this 50 year period, since its pastures received little poultry waste over this period.
Figure 7. Historical P load trend lines during 1950–2000.
Sustainability 07 10115 g007
Table 7. Change in historical P loads in the IRW for 10 year periods during 1951–2000.
YearModeled P Load (kg/year)
Illinois River at TahlequahBaron ForkCaney CreekTotal
1951–1960113,77443,4839449166,706
1961–197087,16833,4847084127,737
1971–1980134,04746,1909462189,699
1981–1990148,80044,6858452201,937
1991–2000231,13854,3089961295,406
Average142,98544,4308882196,297

3.3. Scenario Evaluation

3.3.1. Increased Poultry Waste Application
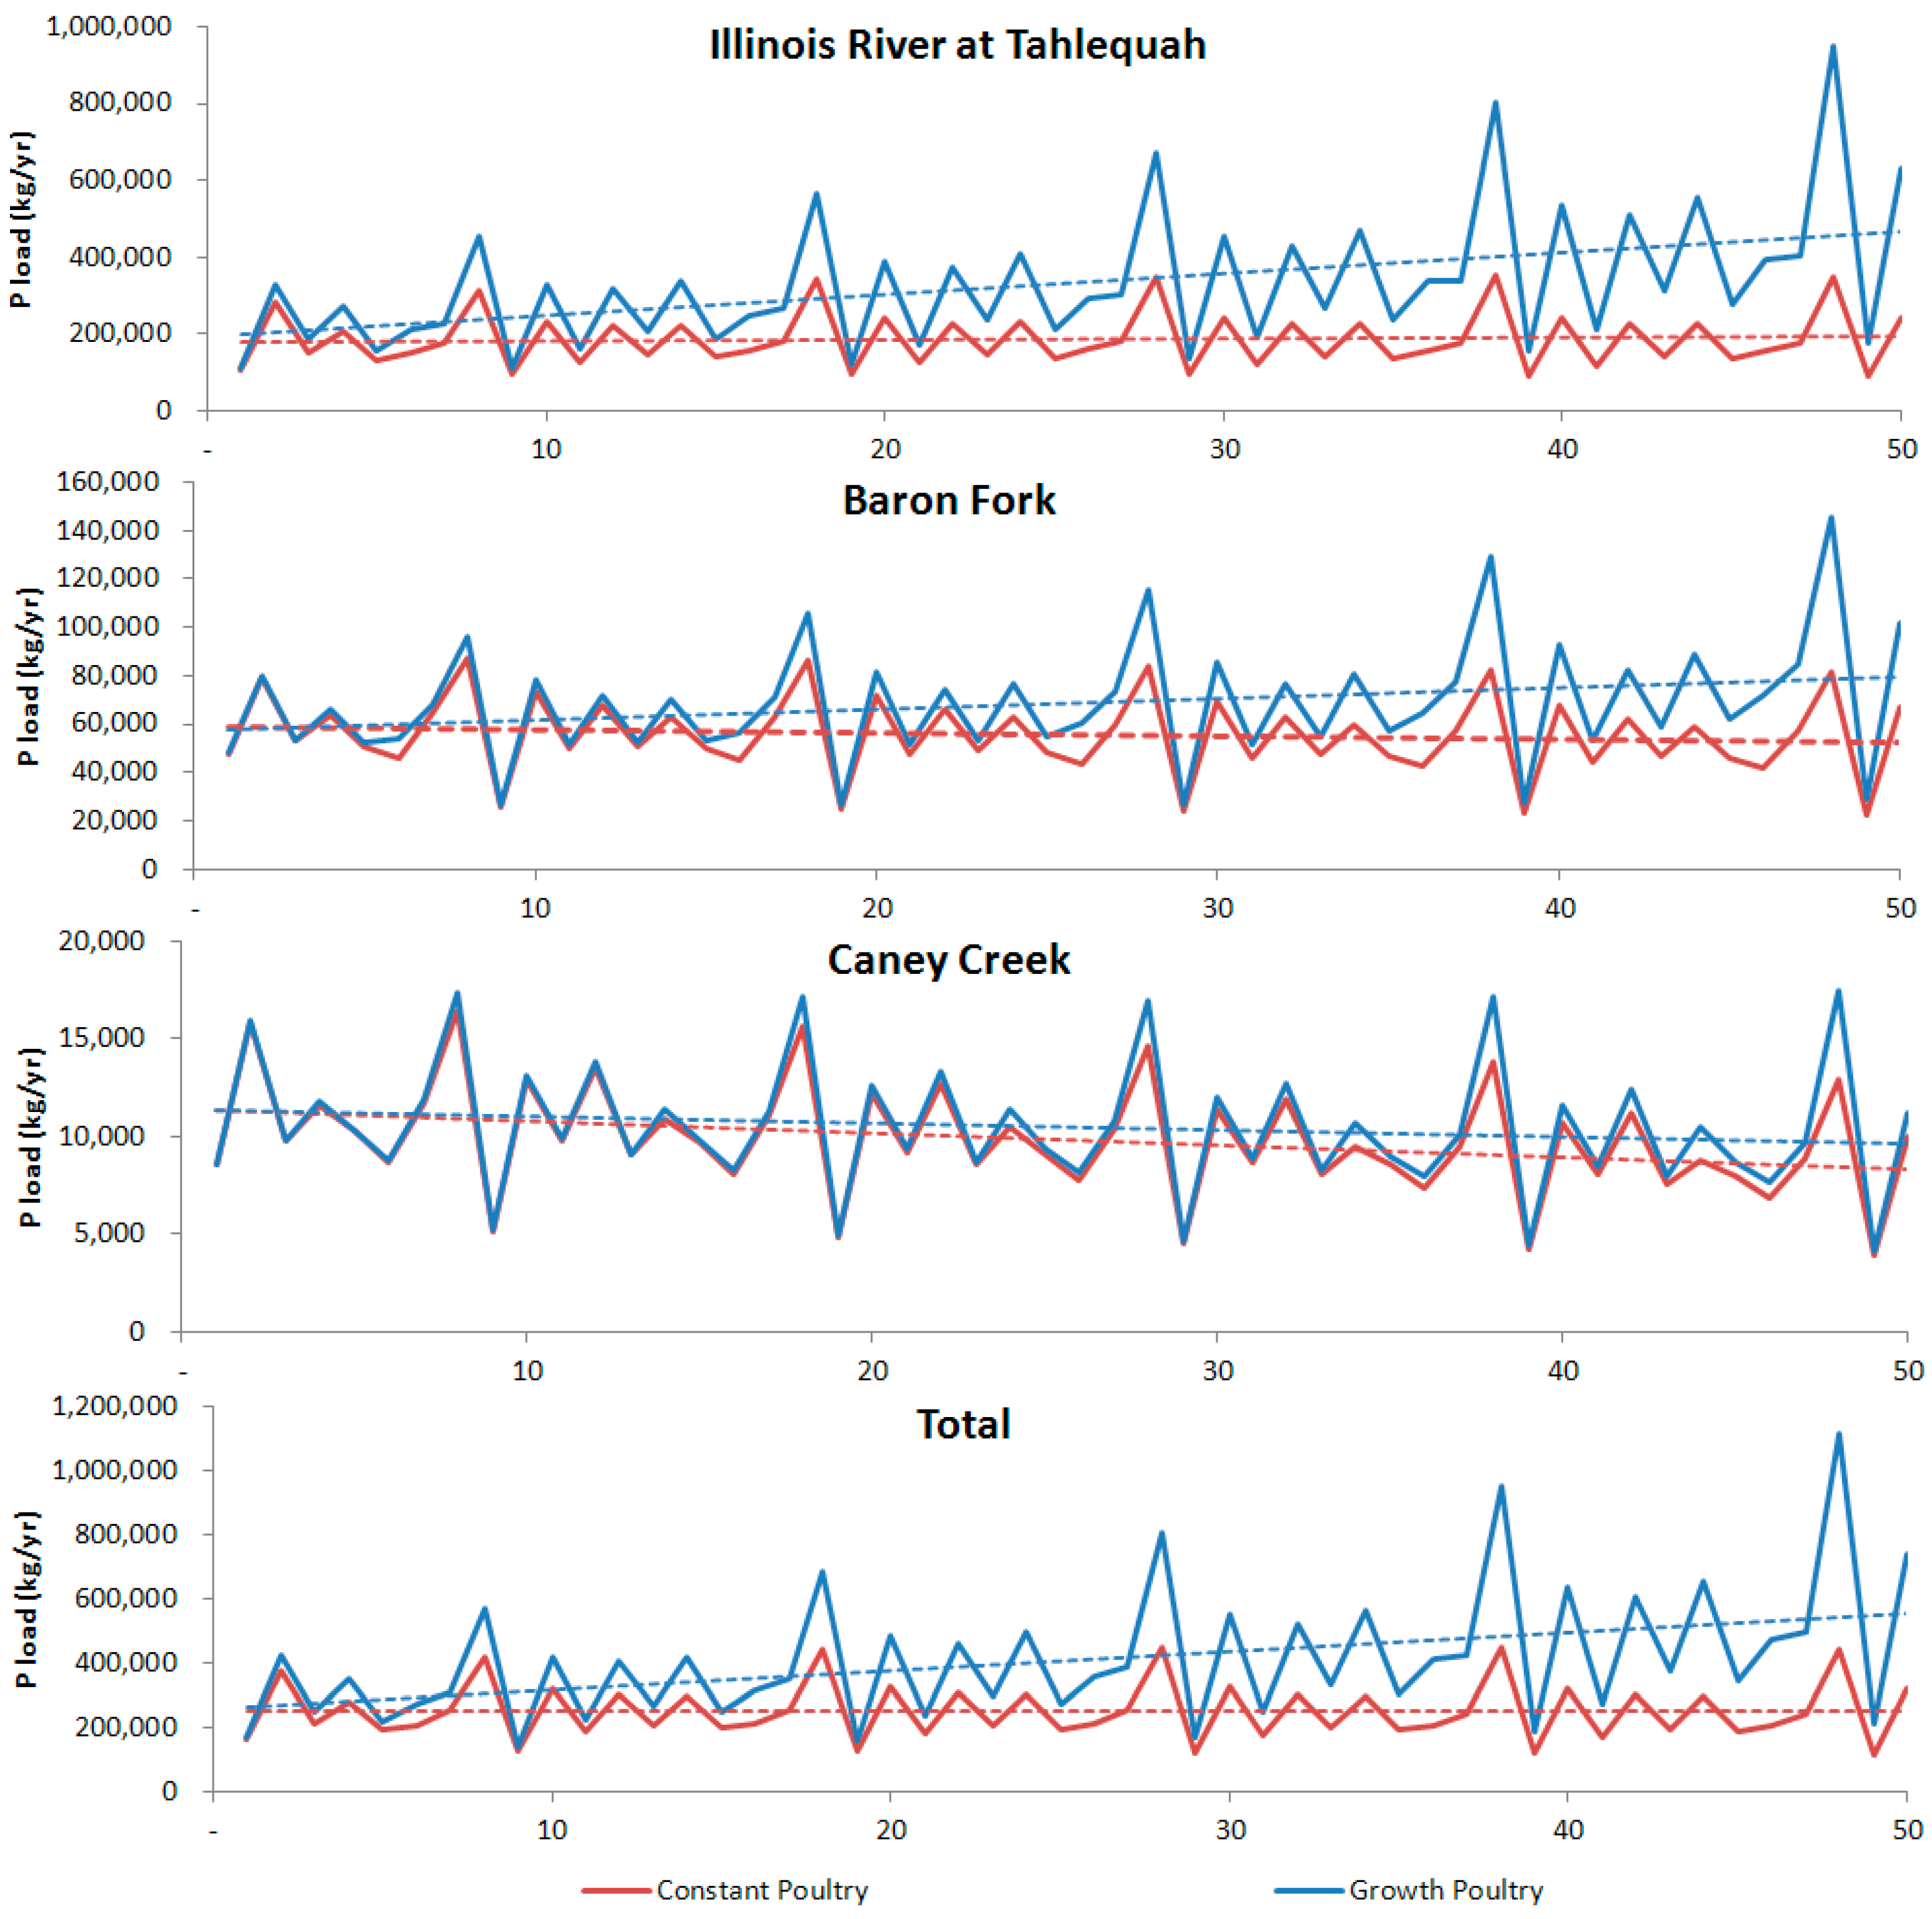
Figure 8 and Table 8 show the comparison of P loads for continued growth and continued poultry waste application in IRW based on the rate of growth between 1982 and 2002 from the USDA Agricultural Census poultry data. For continued poultry waste application in the IRW, modeled P loads to Lake Tenkiller would increase during the first 20 years. For the next 30 years, P loads to Lake Tenkiller would decline slightly and stabilize at levels above current Lake Tenkiller P loads due to P saturation of soils. Therefore, P loads for continued poultry waste application to pastures at present rates were slightly increased in 50 years. Based on this growth rate assumption, P loads to Lake Tenkiller through the Illinois River at Tahlequah location would increase substantially (85%) as a result of increased poultry waste application in this watershed during the 50 year period compared to first 10 years. P load changes at the Baron Fork location would increase a smaller amount (25%) due to less poultry waste being applied in this watershed. P loads at the Caney Creek location would decrease slightly over time (50 years) in this scenario (but less than no changes in poultry production) due to the small amount of poultry waste applied in this watershed and the low STP levels. IRW P load resulting from growth in poultry would be significantly increased, with loads over two times compared to that for a constant poultry waste assumption in the 41–50 year time period.
Figure 8. Comparison of P load for continued waste application and growth in waste application modeled after poultry growth in IRW between 1982 and 2002 based on Agricultural Census Data [36].
Sustainability 07 10115 g008
Table 8. Annual P loads for growth in IRW poultry compared to P loads for poultry waste applied to IRW at current rates. Weather repeats every 10 years so results are summarized in 10 year periods. Units are kg/year.
WatershedYear
1–1011–2021–3031–4041–50
Illinois River at TahlequahGrowth poultry237,890279,284325,687376,016441,186
Constant poultry183,980187,244188,962186,635185,381
Difference (%)294972101138
Barron ForkGrowth poultry62,30764,05667,17171,17077,729
Constant poultry59,29157,24555,56153,68152,877
Difference (%)512213347
Caney CreekGrowth poultry11,26510,82710,46010,0649805
Constant poultry11,10010,481987892248609
Difference (%)136914
TotalGrowth poultry311,462354,167403,318457,250528,720
Constant poultry254,371254,969254,401249,540246,868
Difference (%)22395983114

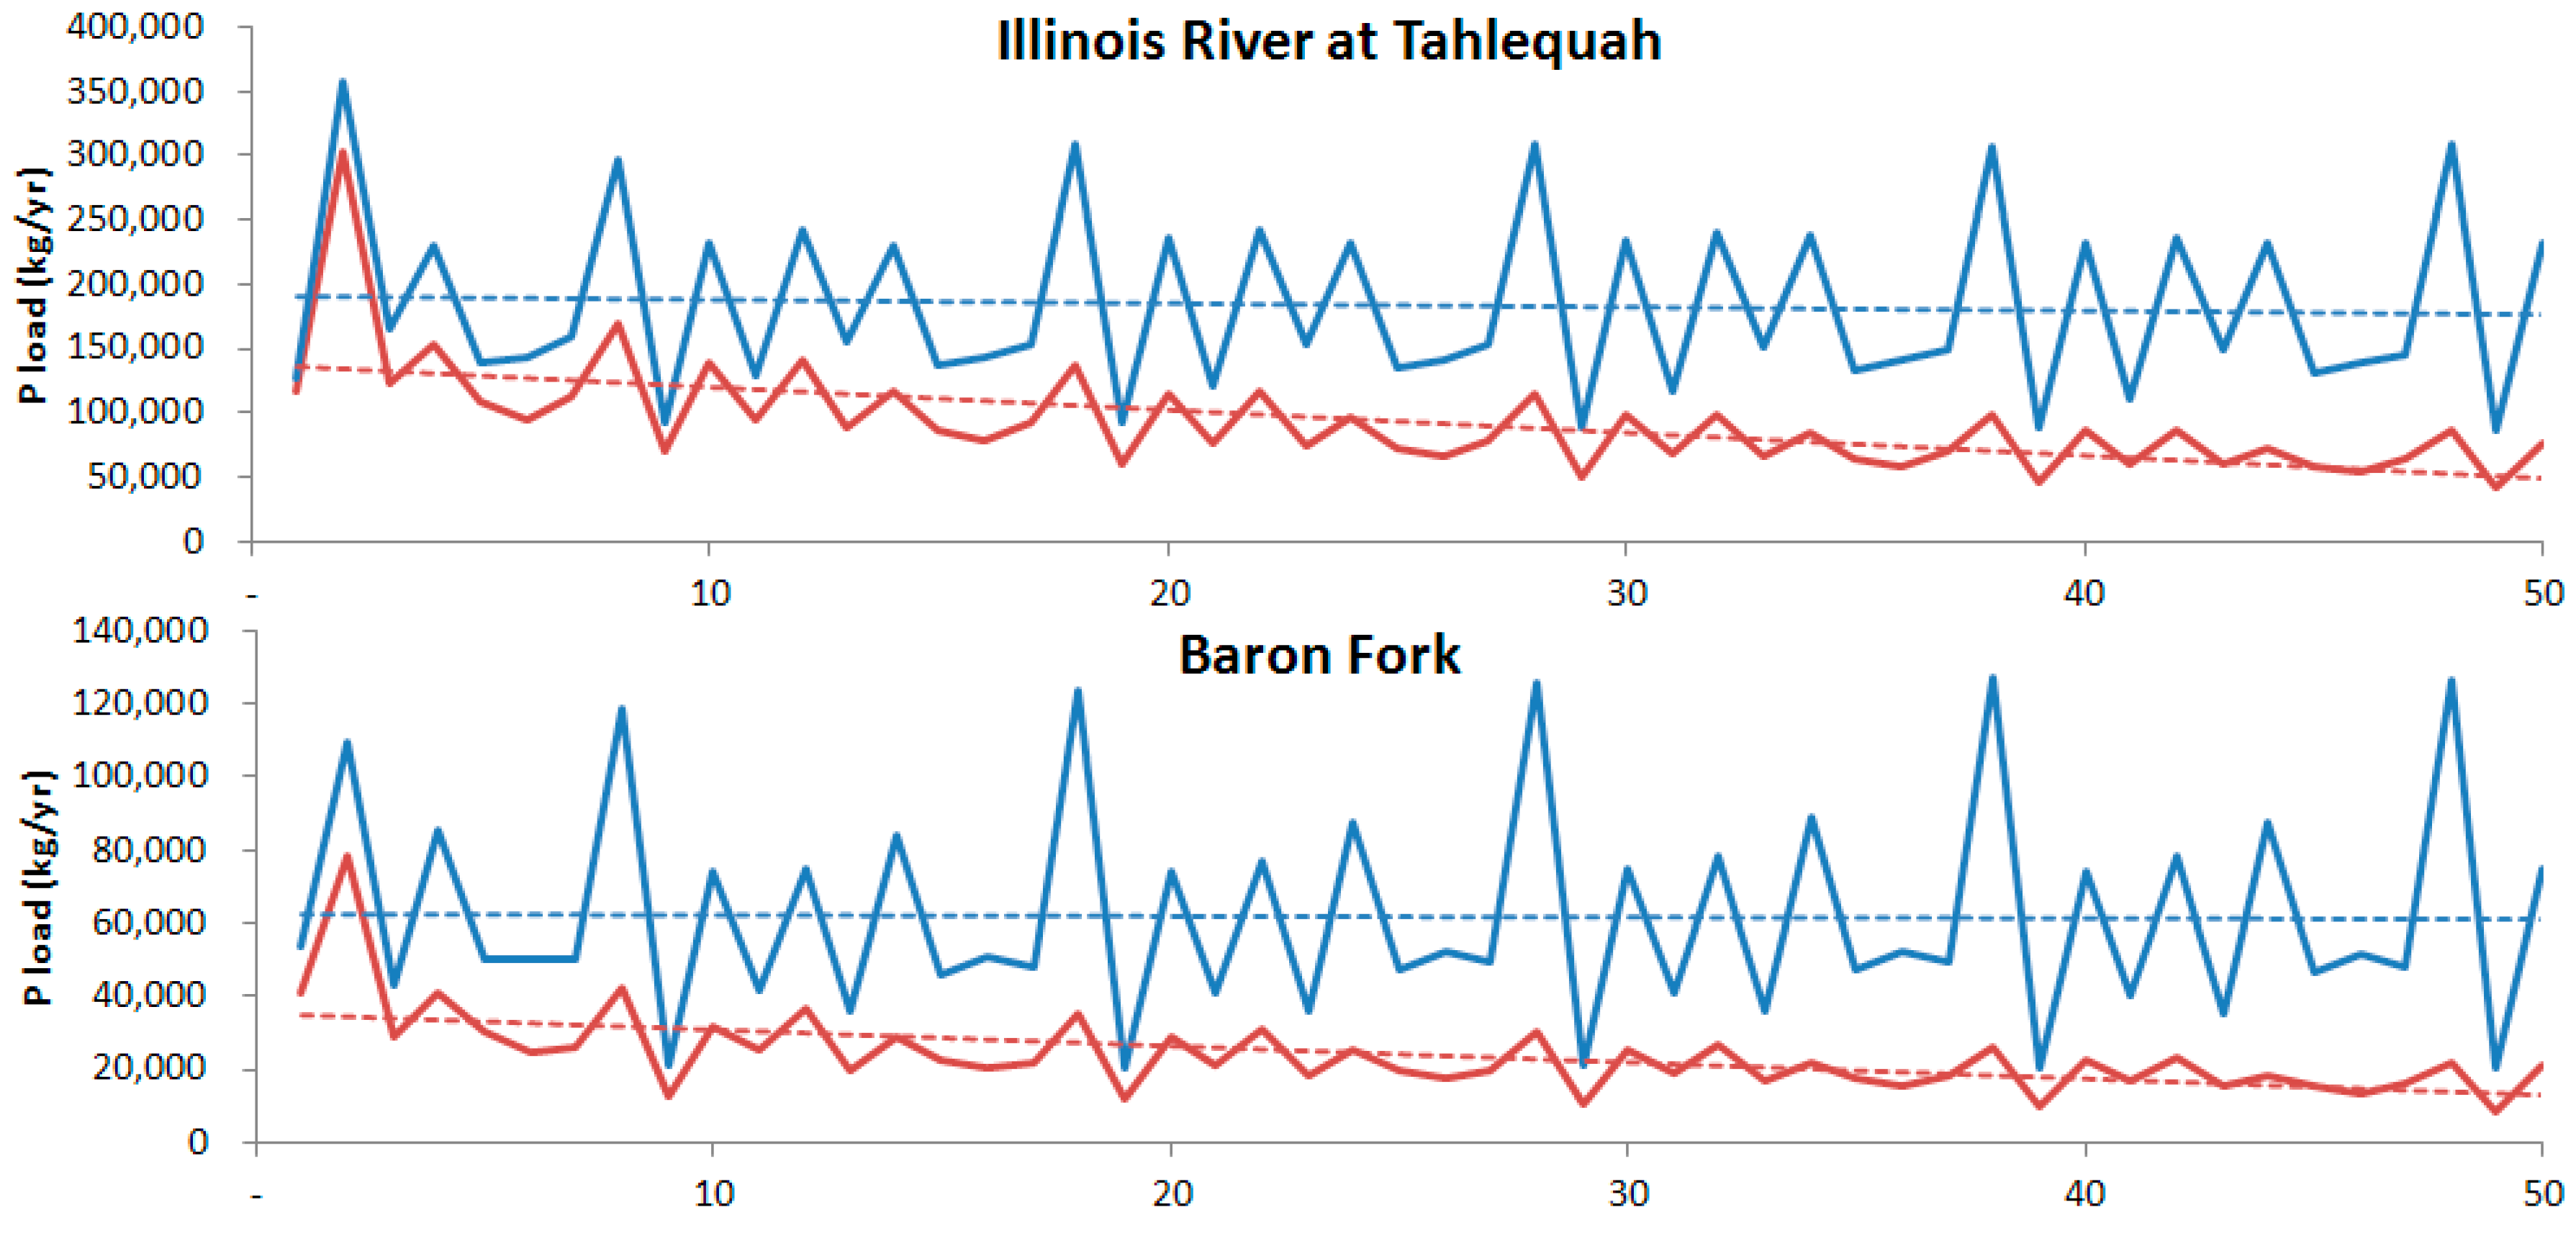
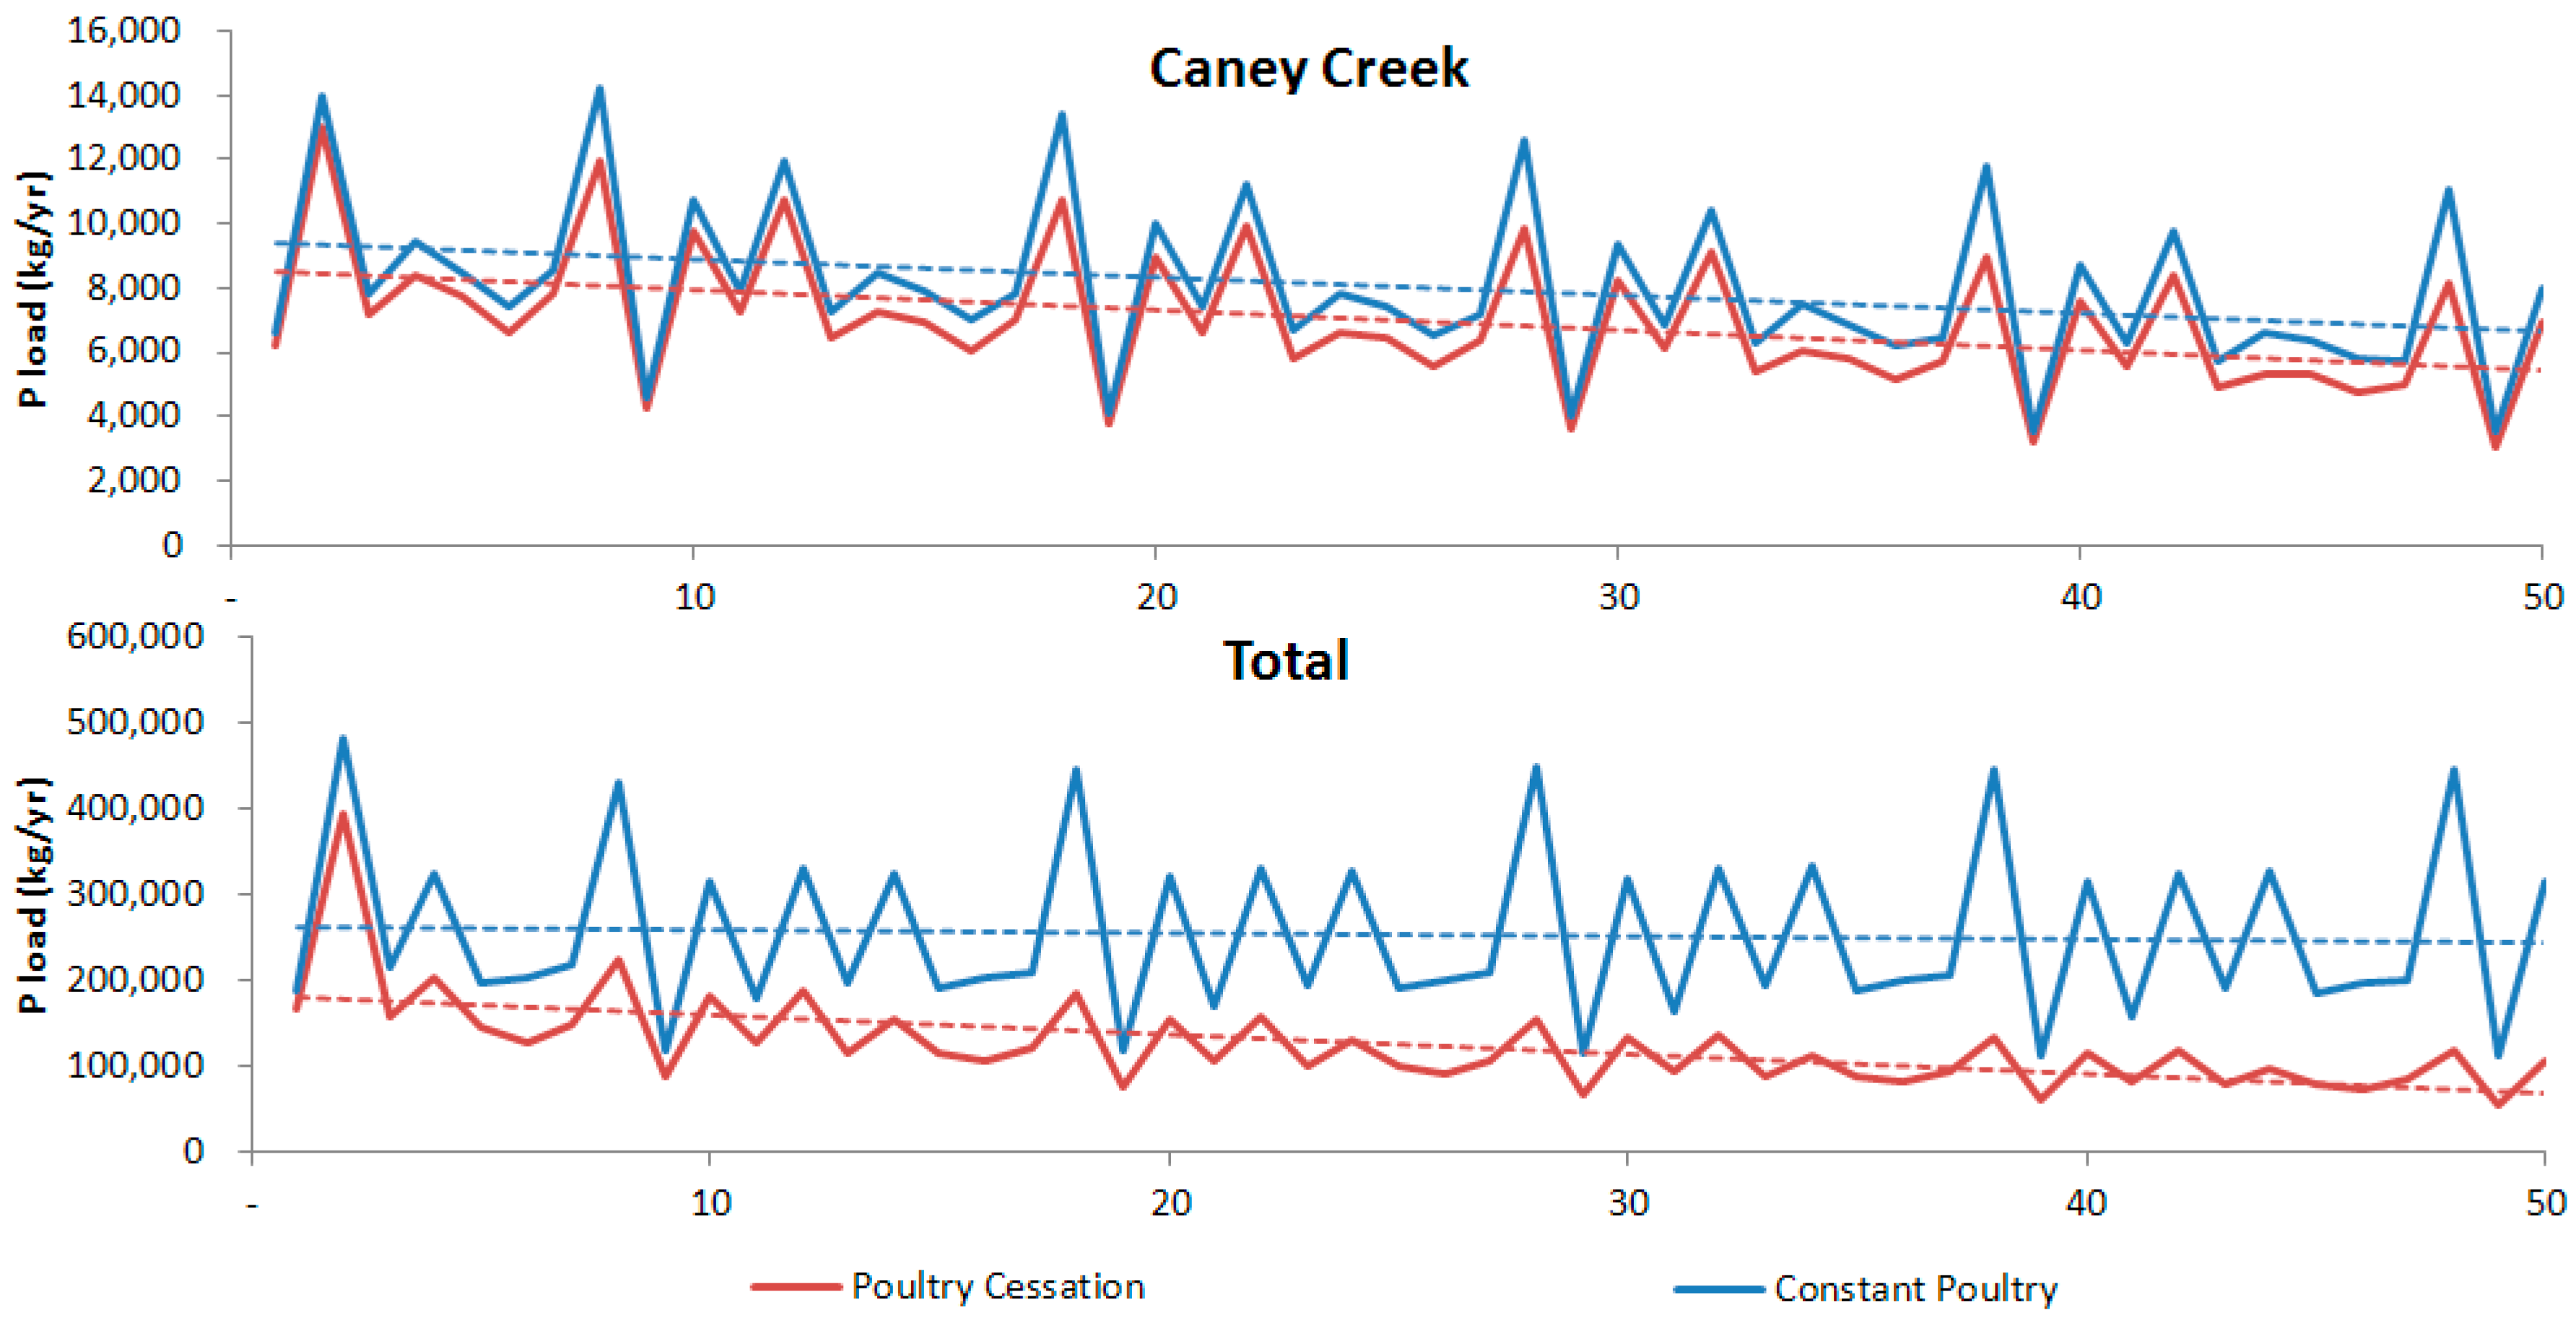
3.3.2. Poultry Waste Cessation
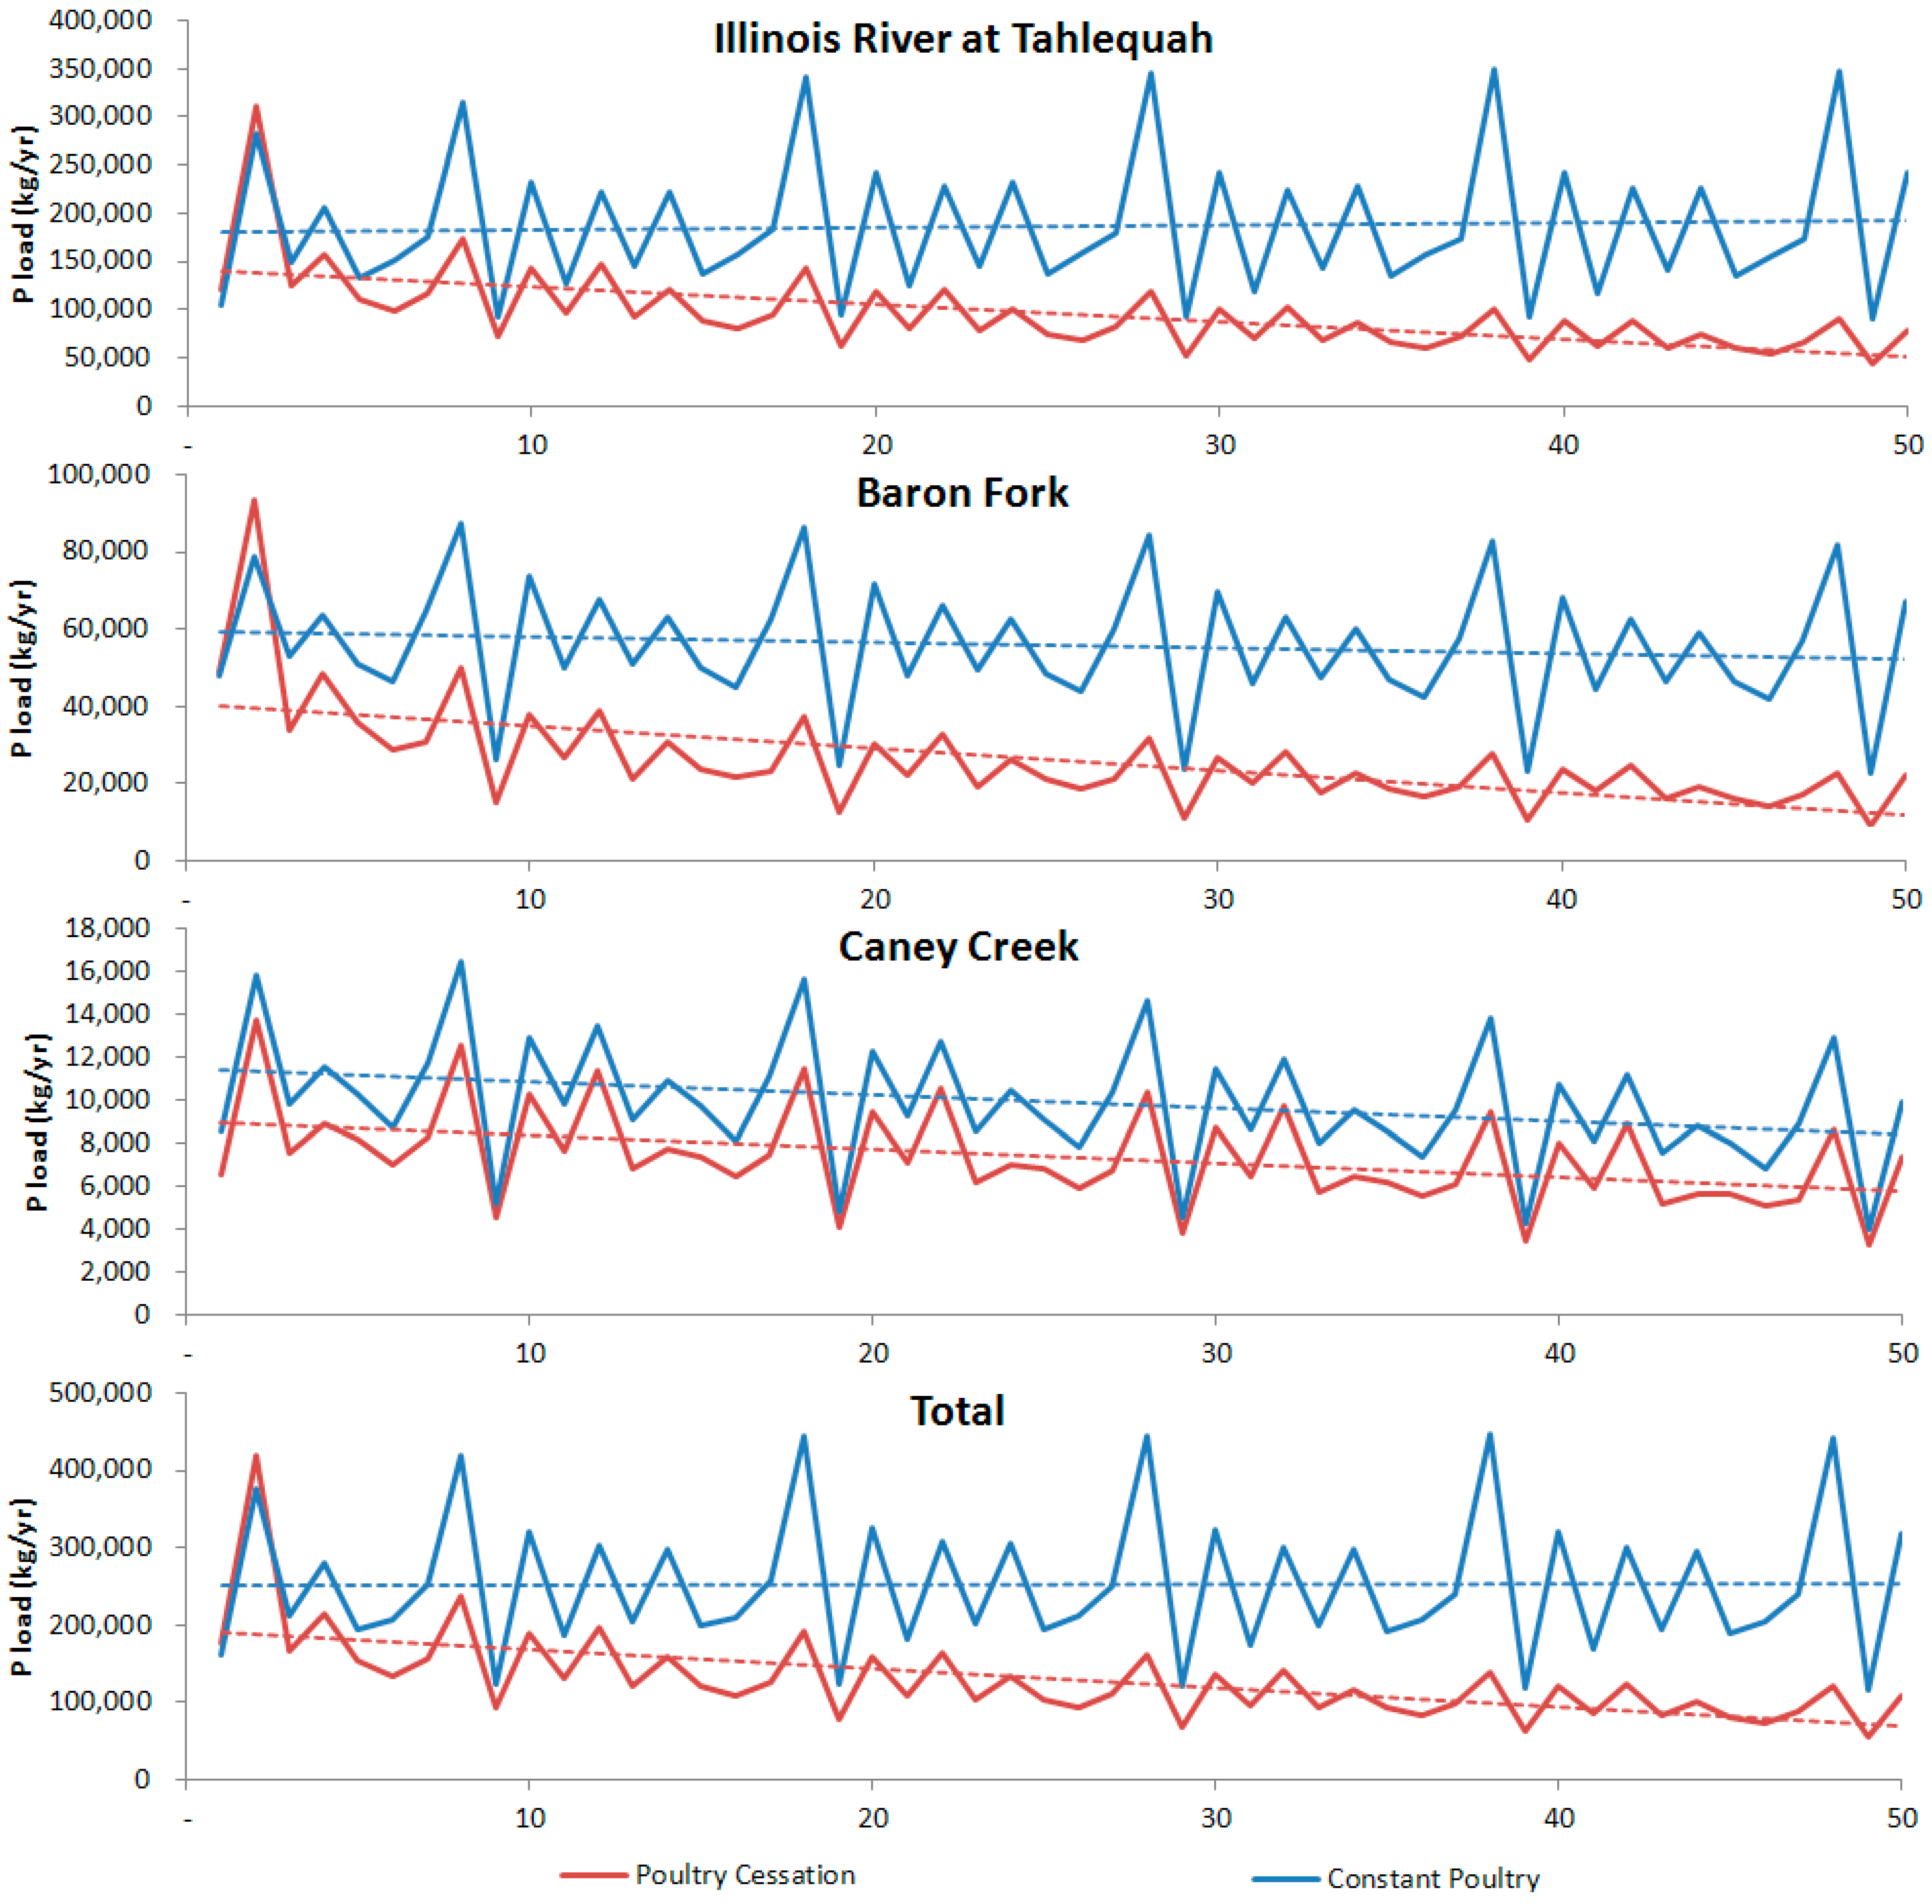
Cessation of poultry waste application in the IRW would efficiently decrease P loads to Lake Tenkiller from 193,898 to 91,861 kg/year during a 50 year period (Figure 9 and Table 9). Compared to the constant poultry values, cessation of poultry waste application could reduce P loads from 246,868 kg/year to 91,861 kg/year after 50 years. Significant P load reductions could be achieved from the Illinois River at Tahlequah by cessation of poultry waste application.
Figure 9. Comparison of P load for continuing poultry waste application and for cessation of poultry waste application.
Sustainability 07 10115 g009
Table 9. Change in annual P loads to Lake Tenkiller for 10 year periods into the future for continued poultry waste application and cessation of waste application in the IRW. Weather repeats every 10 years so results are summarized in 10 year periods. Units are kg/year.
WatershedYear
1–1011–2021–3031–4041–50
Illinois River at TahlequahConstant poultry183,980187,244188,962186,635185,381
Poultry cessation142,965104,69687,72176,73267,958
Difference (%)−22−44−54−59−63
Barron ForkConstant poultry59,29157,24555,56153,68152,877
Poultry cessation42,20026,55622,99120,41417,814
Difference (%)−29−54−59−62−66
Caney CreekConstant poultry11,10010,481987892248609
Poultry cessation87337,9757,3126,6936089
Difference (%)−21−24−26−27−29
TotalConstant poultry254,371254,969254,401249,540246,868
Poultry cessation193,898139,227118,023103,83991,861
Difference (%)−24−45−54−58−63

3.3.3. Buffers and Poultry Waste Land Application Cessation

P loads were calculated for three locations (Illinois River at Tahlequah, Baron Fork, and Caney Creek) for the combination of poultry waste land application cessation and 30 m buffers placed along 3rd order and larger streams and rivers with adjacent pasture (Figure 10 and Table 10). The addition of vegetated 30 m buffers combined with poultry waste application cessation in the IRW would provide further reductions of P loads of between 3% and 5% compared to poultry waste application cessation alone. The addition of vegetated 30 m buffers along all IRW streams combined with poultry waste application cessation in the IRW would provide further reductions of P loads of between 10% and 13% compared to poultry waste application cessation alone.
Figure 10. Comparison of P load for the combination of buffers along third order and larger streams and rivers and poultry waste land application cessation in the IRW.
Sustainability 07 10115 g010aSustainability 07 10115 g010b
P from poultry waste application is the most significant P source in IRW waters [32], and this P has been major source of benthic algal biomass [52]. In this study, the annual P loads to Lake Tenkiller were modeled as 196,297 kg/year for 1951–2000 as shown in Table 6. Engel et al. [33] reported annual P loads to Tenkiller during 1997~2006 were approximately 229,000 kg/year and were approximately 220,000 kg/year in this study as shown in Table 5. These P loads to Tenkiller were consistent with values by Pickup et al. [34] and Tortorelli and Pickup [53].
More than 73% of P load to Lake Tenkiller came from the Illinois River at Tahlequah during 1951~2000 as shown in Table 7, and therefore the total P load to Lake Tenkiller during 1951~2000 was similar to that for the Illinois River at Tahlequah (Figure 6). Poultry waste application, including past application that contributed to soil P levels, is a major contributor to P load to Lake Tenkiller as shown in Table 9. Poultry waste application cessation could reduce P load by more than 60% after 50 years compared to continued poultry waste application at current rates. This is consistent with the findings of others. For example, Engel et al. [33] reported poultry is responsible for almost 60% of P reaching Lake Tenkiller for the 1999–2006 period, and Cook et al. [29] estimated P runoff from poultry waste was 63% of total P load to Lake Tenkiller.
Poultry waste application matched with crop nutrient requirements should be considered in reducing nutrient runoff. However, when manures are applied to match crop N requirements, the P applied in the manure is often two- to five-fold greater than crop P requirements [19]. This results a high P loads to nearby waters [54,55,56]. In this study, one possible strategy to reduce P load to Lake Tenkiller is to stop poultry waste application, especially in the portion of the Illinois River at Tahlequah associated with the Tahlequah USGS flow gauge, as illustrated in Table 10 and Figure 9. The most efficient reduction of P load to Lake Tenkiller is stopping poultry waste application, because the major source of P load is from poultry waste application.
Table 10. Annual P Loads for poultry waste cessation and poultry waste cessation combined with buffers along third order and larger streams in the IRW. Weather repeats every 10 years so results are summarized in 10 year periods. Units are kg/year.
WatershedYear
1–1011–2021–3031–4041–50
Illinois River at TahlequahConstant poultry183,980187,244188,962186,635185,381
Poultry cessation + buffer139,248101,01384,74574,27265,885
Difference (%)−24−46−55−60−64
Barron ForkConstant poultry59,29157,24555,56153,68152,877
Poultry cessation + buffer35,64725,10921,83919,40016,931
Difference (%)−40−56−61−64−68
Caney CreekConstant poultry11,10010,481987892248609
Poultry cessation + buffer82887,525690163195750
Difference (%)−25−28−30−31−33
TotalConstant poultry254,371254,969254,401249540246,868
Poultry cessation + buffer183,183133,647113,48599,99088,566
Difference (%)−28−48−55−60−64

4. Conclusions

The effect of poultry waste application within the Illinois River Watershed (IRW) in Oklahoma and Arkansas USA on P load from the watershed to Lake Tenkiller was evaluated using the GLEAMS model combined with a routing model. About 70% of total P loads originate from the portion of the Illinois River Basin above the Tahlequah USGS gauge, and therefore change of P load to Lake Tenkiller has a similar trend with this portion of the basin during the 1951–2000 period.
Poultry waste application within the IRW has been a major contributor to P load reaching Lake Tenkiller. Average yearly P load for 10 year periods increased from approximately 166,700 kg/year for 1951–1960 to more than 295,000 kg/year by 1991–2000. P load over the next 50 years resulting from continued growth in poultry waste application would increase significantly, with P loads over two times compared to that for a constant poultry waste assumption. Cessation of poultry waste application could efficiently decrease P loads over time. Poultry waste application cessation could reduce P loads from approximately 194,000 kg/year to nearly 92,000 kg/year over a 50 year period, while continued poultry waste application would result in expected P loads of nearly 247,000 kg/year in 50 years. Results demonstrate that the critical area and source for eutrophication of Lake Tenkiller is the portion of the Illinois River above the USGS Tahlequah gauging station and poultry waste application, respectively. Further study on poultry waste application cessation and other poultry waste control strategies and practices in the IRW is needed for sustainable land use and water management.

Acknowledgments

A portion of the research was supported by a grant from 2012 International Academic Exchange Program of Andong National University.

Author Contributions

Ji-Hong Jeon wrote the paper and applied GLEAMS, Chan-Gi Park reviewed the references and provided useful comments, and Bernard A. Engel designed and directed this research including making model runs. All authors have read and approved the final manuscript.

Conflicts of Interest

The authors declare no conflict of interest.

References

  1. Vollenweider, R.A. The Scientific Basis of Lake and Stream Eutrophication with Particular Reference to Phosphorus and Nitrogen as Eutrophication Factors; Tech. Rep. DAS/DSI/68.27; Organization for Economic Cooperation and Development: Paris, France, 1968. [Google Scholar]
  2. Dillon, P.J.; Rigler, F.H. The phosphorus-chlorophyll relationship in lakes. Limnol. Oceanogr. 1974, 19, 767–773. [Google Scholar] [CrossRef]
  3. Prepas, E.E.; Trew, D.O. Evaluation of the phosphorus-chlorophyll relationship for lakes off the Precambrian Shield in Western Canada. Can. J. Fish. Aquat. Sci. 1983, 40, 27–35. [Google Scholar] [CrossRef]
  4. Mazumder, A. Phosphorus-chlorophyll relationships under contrasting herbivory and thermal stratification: Predictions and patterns. Can. J. Fish. Aquat. Sci. 1994, 51, 390–400. [Google Scholar] [CrossRef]
  5. Conroy, J.D.; Kane, D.D.; Dolan, D.M.; Edwards, W.J.; Charlton, M.N.; Culver, D.A. Temporal trends in Lake Erie plankton biomass: Roles of external phosphorus loading and dreissenid mussels. J. Great Lakes Res. 2005, 1, 89–110. [Google Scholar] [CrossRef]
  6. Cook, P.L.; Holland, D.P. Long term nutrient loads and chlorophyll dynamics in a large temperate Australian lagoon system affected by recurring blooms of cyanobacteria. Biogeochemistry 2012, 107, 261–274. [Google Scholar] [CrossRef]
  7. Sharpley, A.N.; Herron, S.; Daniel, T. Overcoming the challenges of phosphorus based management in poultry farming. J. Soil Water Conserv. 2007, 62, 375–389. [Google Scholar]
  8. Kellogg, R.L.; Lander, C.H.; Moffitt, D.C.; Gollehon, N. Manure nutrients relative to the capacity of cropland and pastureland to assimilate nutrients: Spatial and temporal trends for the United States. Proc. Water Environ. Fed. 2000, 16, 18–157. [Google Scholar] [CrossRef]
  9. Kleinman, P.J.; Sharpley, A.N.; Wolf, A.M.; Beegle, D.B.; Moore, P.A. Measuring water-extractable phosphorus in manure as an indicator of phosphorus in runoff. Soil Sci. Soc. Am. J. 2002, 66, 2009–2015. [Google Scholar] [CrossRef]
  10. Dutta, S.; Inamdar, S.; Tso, J.; Aga, D.S.; Sims, J.T. Free and conjugated estrogen exports in surface-runoff from poultry litter-amended soil. J. Environ. Qual. 2010, 39, 1688–1698. [Google Scholar] [CrossRef] [PubMed]
  11. Romeis, J.; Hellmich, R.L.; Candolfi, M.P.; Carstens, K.; de Schrijver, A.; Gatehouse, A.M.R.; Herman, R.A.; Huesting, J.E.; McLean, M.A.; Raybould, A.; et al. Recommendations for the design of laboratory studies on non-target arthropods for risk assessment of genetically engineered plants. Transgenic Res. 2011, 20, 1–22. [Google Scholar] [CrossRef] [PubMed]
  12. Abdala, D.B.; Ghosh, A.K.; da Silva, I.R.; de Novais, R.F.; Alvarez Venegas, V.H. Phosphorus saturation of a tropical soil and related P leaching caused by poultry litter addition. Agric. Ecosyst. Environ. 2012, 162, 15–23. [Google Scholar] [CrossRef]
  13. Reiter, M.S.; Daniel, T.C.; DeLaune, P.B.; Sharpley, A.N.; Lory, J.A. Effects of long-term poultry litter application on phosphorus soil chemistry and runoff water quality. J. Environ. Qual. 2013, 42, 1829–1837. [Google Scholar] [CrossRef] [PubMed]
  14. Ranatunga, T.D.; Reddy, S.S.; Taylor, R.W. Phosphorus distribution in soil aggregate size fractions in a poultry litter applied soil and potential environmental impacts. Geoderma 2013, 192, 446–452. [Google Scholar] [CrossRef]
  15. Cox, T.J.; Engel, B.A.; Olsen, R.L.; Fisher, J.B.; Santini, A.D.; Bennett, B.J. Relationships between stream phosphorus concentrations and drainage basin characteristics in a watershed with poultry farming. Nutr. Cycl. Agroecosyst. 2013, 95, 353–364. [Google Scholar] [CrossRef]
  16. Adams, P.L.; Daniel, T.C.; Nichols, D.J.; Pote, D.H.; Scott, H.D.; Edwards, D.R. Poultry litter and manure contributions to nitrate leaching through the vadose zone. Soil Sci. Soc. Am. J. 1994, 58, 1206–1211. [Google Scholar] [CrossRef]
  17. Kang, M.S.; Srivastava, P.; Tyson, T.; Fulton, J.P.; Owsley, W.F.; Yoo, K.H. A comprehensive GIS-based poultry litter management system for nutrient management planning and litter transportation. Comput. Electron. Agric. 2008, 64, 212–224. [Google Scholar] [CrossRef]
  18. DeLaune, P.B.; Haggard, B.E.; Daniel, T.C.; Chaubey, I.; Cocharn, M.J. The Eucha/Spavinaw phosphorus index: A court mandated index for litter management. J. Soil Water Conserv. 2006, 61, 96–105. [Google Scholar]
  19. Bosch, D.J.; Wolfe, M.L.; Knowlton, K.E. Reducing phosphorus runoff from dairy farms. J. Environ. Qual. 2006, 35, 918–927. [Google Scholar] [CrossRef] [PubMed]
  20. Sims, J.T.; Luka-McCafferty, N.J. On-farm evaluation of aluminum sulfate (alum) as a poultry litter amendment. J. Environ. Qual. 2002, 31, 2066–2073. [Google Scholar] [CrossRef] [PubMed]
  21. Seiter, J.M.; Staats-Borda, K.E.; Ginder-Vogel, M.; Sparks, D.L. XANES spectroscopic analysis of phosphorus speciation in alum-amended poultry litter. J. Environ. 2008, 37, 477–485. [Google Scholar] [CrossRef] [PubMed]
  22. Smith, D.R.; Moore, P.A.; Miles, D.M.; Haggard, B.E.; Daniel, T.C. Decreasing phosphorus runoff losses from land-applied poultry litter with dietary modifications and alum addition. J. Environ. Qual. 2004, 33, 2210–2216. [Google Scholar] [CrossRef] [PubMed]
  23. Watts, D.B.; Torbert, H.A. Impact of gypsum applied to grass buffer strips on reducing soluble P in surface water runoff. J. Environ. Qual. 2009, 38, 1511–1517. [Google Scholar] [CrossRef] [PubMed]
  24. Chaubey, I.; Chiang, L.; Gitau, M.W.; Mohamed, S. Effectiveness of best management practices in improving water quality in a pasture-dominated watershed. J. Soil Water Conserv. 2010, 65, 424–437. [Google Scholar] [CrossRef]
  25. Knisel, W.G.; Turtola, E. GLEAMS model application on a heavy clay soil in Finland. Agric. Water Manag. 2000, 43, 285–309. [Google Scholar] [CrossRef]
  26. De Paz, J.M.; Ramos, C. Simulation of nitrate leaching for different nitrogen fertilization rates in a region of Valencia (Spain) using a GIS–GLEAMS system. Agr. Ecosyst. Environ. 2004, 103, 59–73. [Google Scholar] [CrossRef]
  27. Bakhsh, A.; Kanwar, R.S.; Jaynes, D.B.; Colvin, T.S.; Ahuja, L.R. Prediction of NO3-N losses with subsurface drainage water from manured and UAN-fertilized plots using GLEASM. Trans. ASAE 1999, 43, 69–77. [Google Scholar] [CrossRef]
  28. Adeuya, R.K.; Lim, K.J.; Engel, B.A.; Thomas, M.A. Modeling the average annual nutrient losses of two watersheds in Indiana using GLEAMS-NAPRA. Trans. ASAE 2005, 48, 1739–1749. [Google Scholar] [CrossRef]
  29. Cooke, G.D.; Welch, E.B.; Jones, J.R. Eutrophication of Tenkiller Reservoir, Oklahoma, from nonpoint agricultural runoff. Lake Reserv. Manag. 2011, 27, 256–270. [Google Scholar] [CrossRef]
  30. OSRC (Oklahoma Scenic Rivers Commission). The Illinois River Management Plan—1999; Oklahoma Scenic River Commisson: Tahlequah, OK, USA, 1998. [Google Scholar]
  31. Haraughty, S. Comprehensive Basin Management Plan for the Illinois River Basin in Oklahoma; Oklahoma Conservation Commission: Tahlequah, OK, USA, 1999. [Google Scholar]
  32. Olsen, R.L.; Chappell, R.W.; Loftis, J.C. Water Quaty Sample Collection, Data Treatment and Results Presentation for Principal Components Analysis: Literature Review and Illinois River Watershed Case Study. Water Res. 2012, 46, 3110–3122. [Google Scholar] [CrossRef] [PubMed]
  33. Engel, B.A.; Smith, M.; Fisher, J.B.; Olsen, R.; Ahiablame, L. Phosphorus Mass Balance of the Illinois River Watershed in Arkansas and Oklahoma. J. Water Resour. Prot. 2013, 5, 591–603. [Google Scholar] [CrossRef]
  34. Pickup, B.E.; Andrews, W.J.; Haggard, B.E.; Green, W.R. Phosphorus Concentrations, Loads and Yields in the Illinois River Basin, Arkansas and Oklahoma, 1977–2001; US Geological Survey Water Resources Investigations Report 03-4168; USGS: Reston, VA, USA, 2003.
  35. Fisher, J.B.; Hight, R.; van Waasbergen, R.; Engel, B.A.; Smith, M. Estimates of the Mass Generated, Disposal Timing and the Spatial Distribution of Disposal Sites within the Illinois River Watershed (Oklahoma and Arkansas, United States). In Proceedings of the 20th International Symposium on Environmental Science and Technology, Shanghai, China, 2–5 June 2009; pp. 1238–1247.
  36. Veneman, A.M.; Jen, J.J. 2002 Census of Agriculture; United States Summary and State Data, Vol. 1, Geographic Area Series Part 51, AC-02-A-51; USDA: Washington, DC, USA, 2004.
  37. USGS Water Resources Applications Software: LOADEST. Available online: http://water.usgs.gov/software/loadest (accessed on 3 October 2014).
  38. Arnold, J.G.; Srinivasan, R.; Muttiah, R.S.; Williams, J.R. Large area hydrologic modeling and assessment part I: Model development. J. Am. Water Resour. Assoc. JAWRA 1998, 34, 73–89. [Google Scholar] [CrossRef]
  39. De Paz, J.M.; Ramos, C. Linkage of a geographical information system with the gleams model to assess nitrate leaching in agricultural areas. Environ. Pollut. 2002, 118, 249–258. [Google Scholar]
  40. Leone, A.; Ripa, M.N.; Uricchio, V.; Deák, J.; Vargay, Z. Vulnerability and risk evaluation of agricultural nitrogen pollution for Hungary’s main aquifer using DRASTIC and GLEAMS model. J. Environ. Manag. 2009, 90, 2969–2978. [Google Scholar] [CrossRef] [PubMed]
  41. Manguerra, H.B.; Tate, W.; Lahlou, M. ARCVIEW-GLEAMS Integration for Pesticide Source Loading Estimation; Parsons, J.E., Thomas, D.L., Huffman, R.L., Eds.; Southern Cooperative Series Bulletin: Oklahoma City, OK, USA, 2001; pp. 169–183. [Google Scholar]
  42. Garnier, M.; Lo Porto, A.; Marini, R.; Leone, A. Integrated use of GLEAMS and GIS to prevent groundwater pollution caused by agricultural disposal of animal waste. Environ. Manag. 1998, 22, 747–756. [Google Scholar] [CrossRef]
  43. Djodjic, F.; Montas, H.; Shirmohammadi, A.; Bergström, L.; Ulén, B. A decision support system for phosphorus management at a watershed scale. J. Environ. Qual. 2002, 31, 937–945. [Google Scholar] [CrossRef] [PubMed]
  44. Ouyang, Y. Simulating dynamic load of naturally occurring TOC from watershed into a river. Water Res. 2003, 37, 823–832. [Google Scholar] [CrossRef]
  45. Wagner, R.A.; Tisdale, T.S.; Zhang, J. A framework for phosphorus transport modeling in the Lake Okeechobee Watershed. JAWRA 1996, 32, 57–73. [Google Scholar] [CrossRef]
  46. Jung, J.-W.; Lim, B.-J.; Choi, D.-H.; Choi, Y.-J.; Lee, K.-S.; Kim, Y.-J.; Kim, K.-S.; Chang, N.-I.; Yoon, K.-S. Evaluation of flow-pollutant load delivery ratio equations on main subwatersheds within Juam Lake. J. Environ. Sci. 2012, 10, 1235–1244. [Google Scholar] [CrossRef]
  47. Keem, M.S.; Shin, H.S.; Park, J.H.; Kim, S. Empirical equation for pollutant loads delivery ratio in Nakdong River TMDL unit watershed. J. Korean Soc. Water Qual. 2009, 25, 580–588. [Google Scholar]
  48. Park, J.-H.; Hwang, H.; Rhew, D.; Kwon, O.-S. Estimation of delivery ratio based on BASINS/HSPF model for total maximum daily load. J. Korean Soc. Water Qual. 2012, 28, 833–842. [Google Scholar]
  49. Park, J.; Kim, K.; Hwang, K.; Lee, Y.; Lim, B. Application of load duration curve and estimation of delivery ratio by flow durations using discharge-load rating curve at Jiseok stream watershed. J. Korean Soc. Water Qual. 2013, 29, 523–530. [Google Scholar]
  50. Donigian, A.S. Watershed model calibration and validation: The HSPF experience. Proc. Water Environ. Fed. 2002, 2002, 44–73. [Google Scholar] [CrossRef]
  51. Wells, S.A.; Wells, V.I.; Berger, C. Impact of phosphorus loading from the watershed on water quality dynamics in Lake Tenkiller, Oklahoma, USA. In Proceedings of the World Environmental and Water Resources Congress, EWRI, ASCE, Albuquerque, NM, USA, 2012; pp. 888–899.
  52. Stevenson, R.J.; Bennett, B.J.; Jordan, D.N.; French, R.D. Phosphorus regulates stream injury by filantous green algae, thresholds, DO, and pH. Hydrobilogia 2012, 695, 25–42. [Google Scholar] [CrossRef]
  53. Tortorelli, R.L.; Pickup, B.E. Phosphorus Concentration, Loads, and Yields in the Illinois River Basin, Arcansas and Oklahoma, 2000–2004; USGS Publications Warehouse: Oklahoma City, OK, USA, 2006. [Google Scholar]
  54. Daniel, T.C.; Sharpley, A.N.; Edwards, D.R.; Wedephol, R.; Lemunyon, J.L. Minimizing surface water eutrophication from agriculture by phosphorus management. J. Soil Water Conserv. 1994, 49, 30–38. [Google Scholar]
  55. Pote, D.H.; Daniel, T.C.; Nichols, D.J.; Sharpley, A.N.; Moore, P.A.; Miller, D.M., Jr.; Edwards, D.R. Relationship between phosphorus levels in three ultisols and phosphorus concentrations in runoff. J. Environ. Qual. 1999, 28, 170–175. [Google Scholar] [CrossRef]
  56. Pote, D.H.; Daniel, T.C.; Sharpley, A.N.; Moore, P.A., Jr.; Edwards, D.R.; Nichols, D.J. Relating extractable soil phosphorus to phosphorus losses in runoff. Soil Sci. Soc. Am. J. 1996, 60, 855–859. [Google Scholar] [CrossRef]

