1. Introduction
Thermal conditions in street canyons are important topics of urban microclimate, that influence the buildings energy demand and have a large impact on the thermal comfort and health of the people [
1]. Surface temperature distribution and air circulation play an important role on heat exchanges between the building and canyon air, that in turn influence pedestrian comfort and the energy demand of buildings [
2,
3,
4,
5,
6,
7,
8,
9].
In this paper, the convective heat exchange between the exterior building surfaces and the external environment has been studied, because this heat exchange can be 3 to 4 times higher than long-wave radiative heat exchange [
10].
Convection heat transfer between solid wall surfaces and the surrounding air plays an important role in building energy performance, indoor air temperature distribution, buoyancy-driven flow motion,
etc. Knowledge of the convective heat transfer coefficients (CHTC), is required to assess the energy performance of buildings [
10,
11,
12]. It is used by Building Energy Simulation programs.
Blocken
et al. [
12] studied the importance of using an appropriate CHTC model for simulations of a specific building. In effect the results show that the cooling energy demand is more sensitive to different convection models than the heating energy demand.
Apart from buildings, the CHTC is also used in Urban Canopy models [
13,
14,
15], which are developed to assess the climate in urban areas, e.g., heat islands, that require accurate predictions of the CHTC, on the ground, or roofs or vertical walls. These mesoscale models use CHTCs to quantify the turbulent heat fluxes from building surfaces and streets in the urban canopy.
The convective heat transfer coefficient is influenced by several factors, such as the geometry of the building and building surroundings, the position at the building envelope, the building surface roughness, wind speed, wind direction, local airflow patterns and surface to air temperature differences [
16].
In urban areas, local airflow patterns around a building strongly depend on the arrangement and geometry of neighboring buildings [
17] which strongly influence the convective heat transfer coefficients. Terrain type influences the mean wind speed and turbulence intensity profiles [
18], which also influence the CHTC [
16].
There are different methods to obtain values for CHTC, which can be categorized as: analytical, wind-tunnel experiments or full-scale experiments on buildings [
19,
20] and the numerical method [
21]. Analytical methods are only applicable for some specific flow regimes and simple geometries, e.g., flat plates and cylinders [
22].
Wind-tunnel experiments of convective heat transfer at the surfaces of bluff bodies can also be used [
23]. Most of these experiments however consider bluff bodies in rather thin boundary layers and at relatively low Reynolds numbers (Re = 103/105) which makes them not directly applicable for atmospheric flow around buildings. Note that many of the existing correlations only consider a single CHTC value for a specific surface and do not take into account the distribution of the correlation over the surface.
Another option to obtain CHTCs is to use Computational Fluid Dynamics (CFD). The main advantages of CFD are that, for a specific building or building configuration, high spatial resolution can be obtained and high-Reynolds number flows for atmospheric conditions (Re = 105/−107) can be considered.
Apart from the flow field, detailed information of the thermal field is available, also in the boundary-layer region, which is valuable for the analysis of the CHTC. In building aerodynamics, steady RANS is frequently used to model air flow, compared to unsteady RANS (URANS) or Large-Eddy Simulations (LES).
In CFD simulations, two options for modeling flow parameters in the near-wall region exist: low-Reynolds number modeling (LRNM) and wall functions method. For the first model, a very high grid resolution is required close to the wall and so very high computational cost is associated. Therefore, wall functions are commonly used instead. They are semiempirical formulae that model the region between the wall and the logarithmic layer. So that much coarser grids can be used.
In Bloken
et al. [
24] it is shown that in recirculating and stagnation flows and when natural convention is relevant, standard wall functions model can overpredict the CHTC values and propose modifications of the standard wall function.
In [
25], it is shown that in urban canyons the SWF give CHTC that agree with LRNM, if natural convection effects are moderate, that is when the Richardson number, R
i, defined as R
i = gHΔT/u
02 is lower than 1, but for high values of R
i modified wall function are needed.
In this paper, following the studies and validations made in [
2,
3] we study the impact of surface heating on heat exchanges and flow fields within an isolated tridimensional canyon and on the external windward façade.
This paper is organized as follows.
Section 2 describes the numerical model used in the numerical simulations. In
Section 3 a comparison between convective heat transfer coefficient values on the windward and leeward façade within an urban canyon and on the windward external façade given by our simulations and the CHTC given by experimental correlation [
19,
20,
21,
22,
23,
24,
25,
26,
27] and by numerical simulations by other authors [
21] is carried out.
2. CFD, Numerical Model
The simulations have been performed with the commercial CFD code Ansys Fluent 14.0, 3D double precision, pressure based version and the steady RANS equations have been solved in combination with the standard k-ε model.
The governing equations can be expressed as follows.
Heat conservation equation:
where
is the average speed of air flow;
is the Reynolds stress;
is the air density;
is the molecular viscosity;
is the thermal-induced buoyant force;
is the potential temperature;
is the heat diffusivity. The standard
k-
ε model has been used to solve the turbulence problem. The turbulence kinetic energy,
, and its rate of dissipation,
, are obtained from the following transport equations:
and
where
is the generation of turbulence kinetic energy due to the mean velocity gradients;
is the generation of turbulence kinetic energy due to buoyancy;
,
constants and the
and
expressions are reported in the standard
k-
ε model of Ansys Fluent 14.0, 2011;
and
are the turbulent Prandtl numbers for
and
, respectively.
The degree to which
ε is affected by the buoyancy is determined by the constant
C3ε. In Ansys Fluent,
C3ε is not specified, but is instead calculated according to the following relation:
where ν is the component of the flow velocity parallel to the gravitational vector and u is the component of the flow velocity perpendicular to the gravitational vector. In this way,
C3ε will become 1 for buoyant shear layers for which the main flow direction is aligned with the direction of gravity. For buoyant shear layers that are perpendicular to the gravitational vector,
C3ε will become zero (Ansys Fluent Version 14.0.0, 2011). To evaluate the impact of thermal effects, the natural convection module has been activated by setting an incompressible ideal gas model for air density. The radiation exchanges have been evaluated setting up the S2S radiation model, in which the energy exchange parameters are accounted for by a geometric function called a “view factor”. The simulated urban canyon has the following characteristics: it has an aspect ratio
H/W = 1 and
L/W = 5, the orientation is N-S, the building’s width and height are 20 m, the street width is 20 m and the street length is 100 m. A steady state simulation has been carried out with the fixed ambient temperature, by varying the building walls and ground temperature and varying the wind speed but using only one direction 45° N.
In [
2,
3,
4,
5,
6,
7,
8,
9,
10,
11,
12,
13,
14,
15,
16] it is shown that the average CHTC on the windward façade is not very sensitive to wind direction so that a wind direction of 45° from the normal can represent a wide range of wind directions between 0° and 60°.
Based on the best
practice guidelines by Franke
et al. [
28] and Tominaga
et al. [
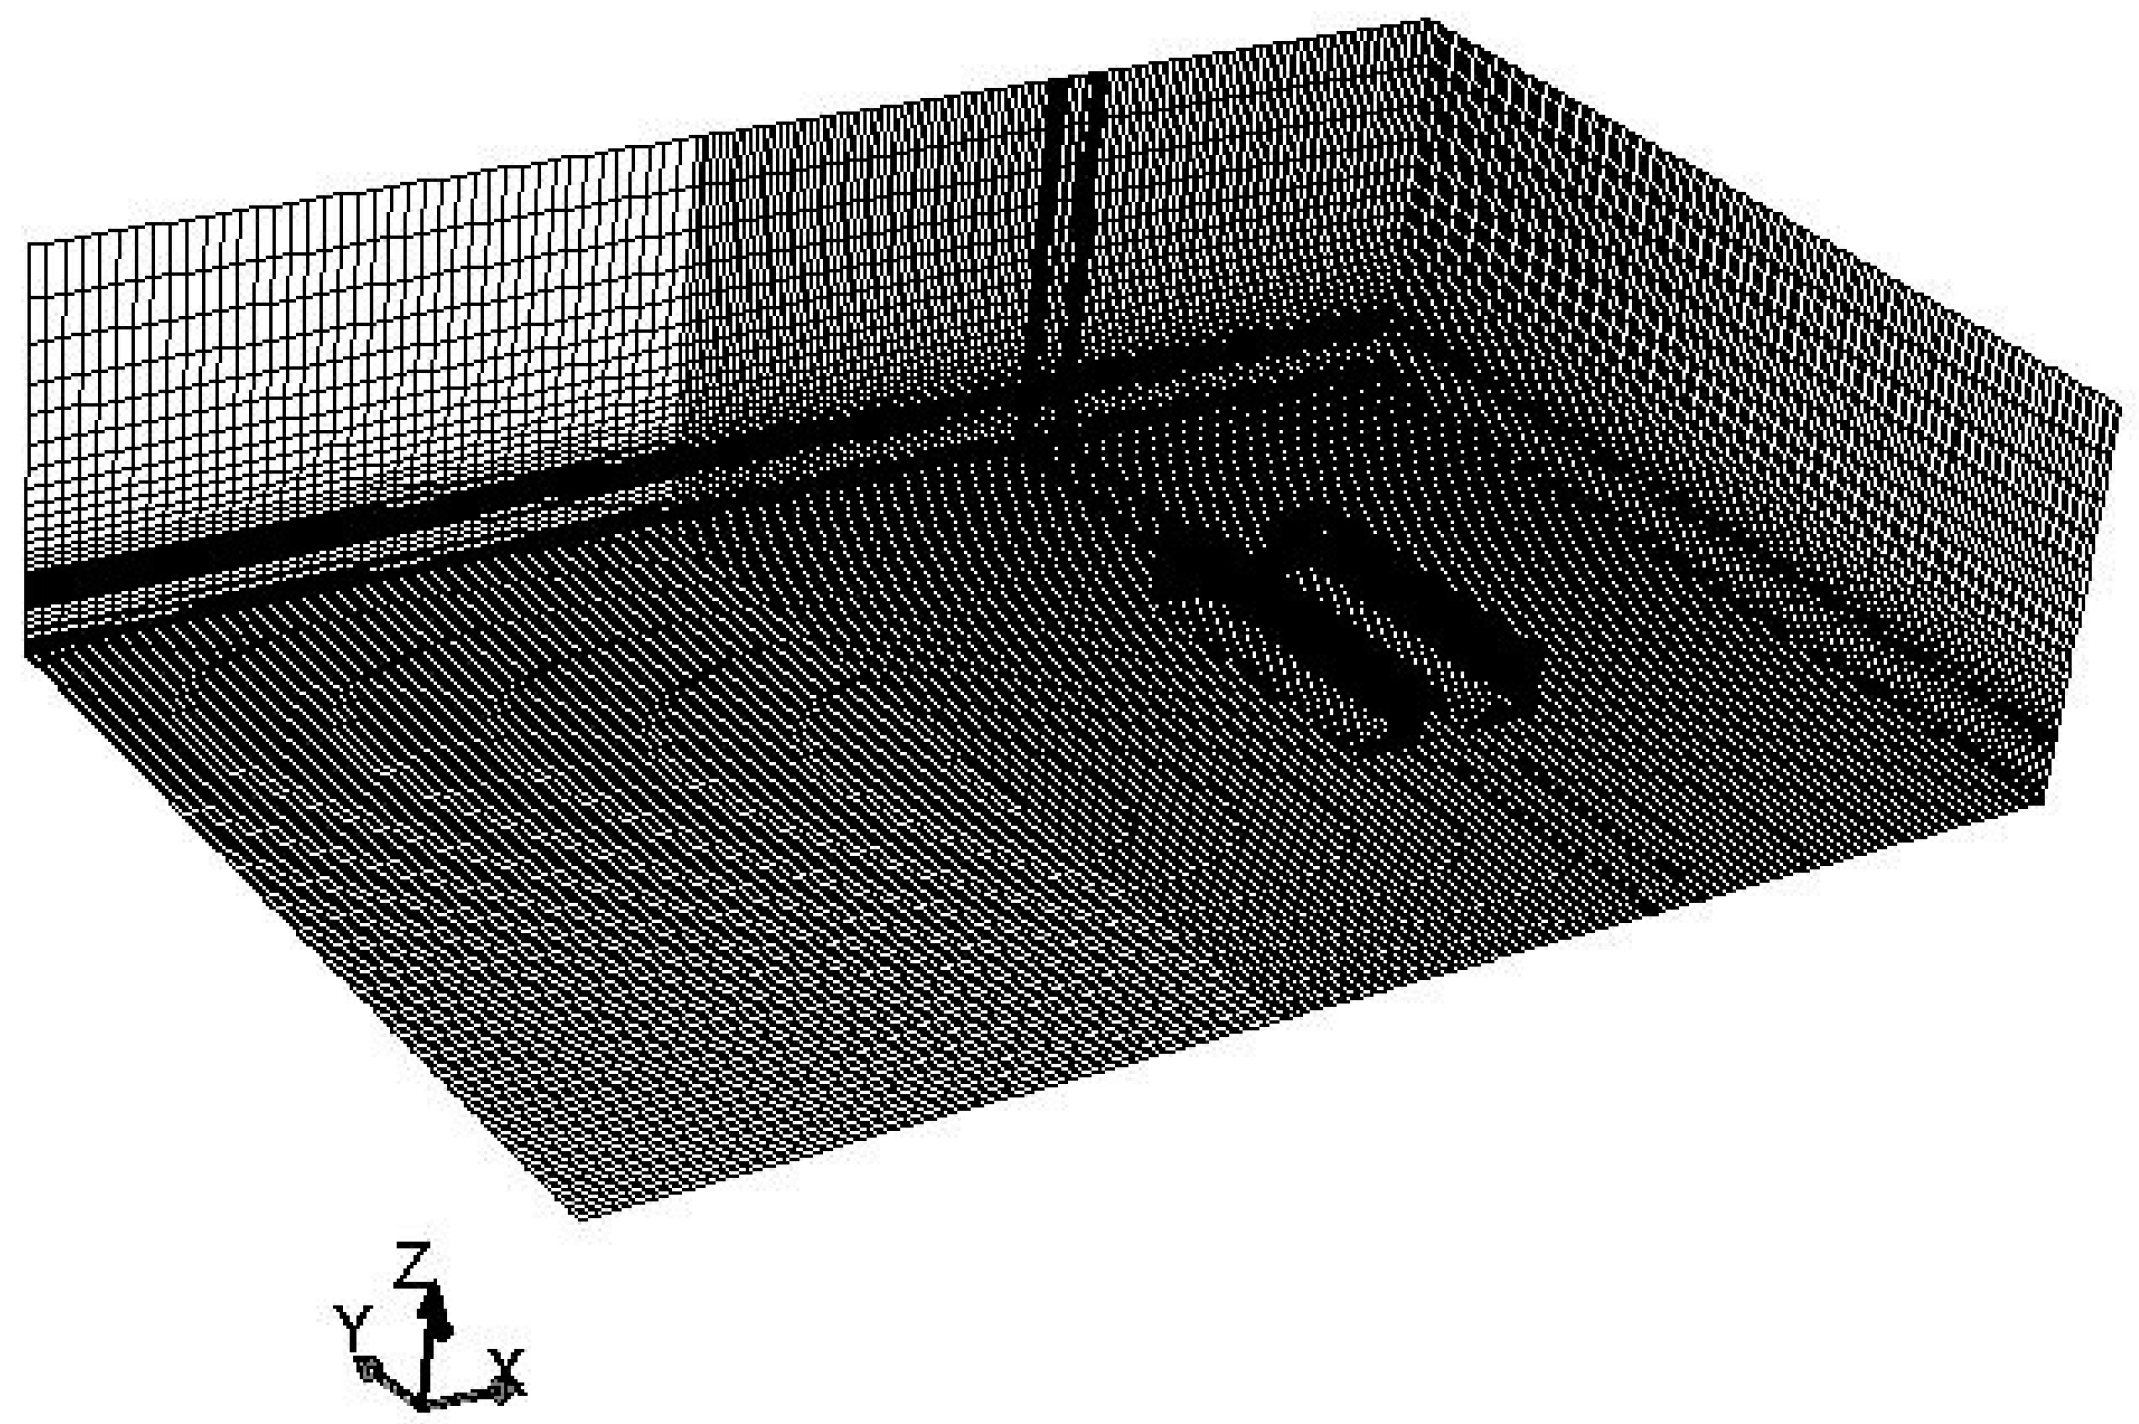
29], the extension of computational domain is: 23H × 15H × 6H. These dimensions values have been chosen to take into account of the blockage ratio and to ensure the flow re-development behind the building region. To ensure a high quality of the computational grid, it is fully structured and the shape of the cells has been chosen as hexahedral (
Figure 1). Particularly, the temperature of surfaces were fixed at a value of 30 °C higher than that of the air, the temperature of undisturbed air (303 K), the temperature of the internal air of the buildings (299 K). To simulate the ground influence, the computational domain has been extended 5 m below the ground level. The ground has been simulated setting the following parameters: density = 1000 kg/m
3; specific heat = 1000 J/kgK; thermal conductivity = 2 W/mK; temperature at −5 m = 288 K; emissivity = 0.9; solar radiation absorptivity (direct visible and infrared) = 0.8 [
3]. Furthermore, the materials characteristics have been reported in Bottillo
et al. (2013) [
3]:
i.e., the building walls have: density = 1000 kg/m
3; specific heat = 1000 J/kgK; thermal conductivity = 0.15 W/mK; thickness = 0.30 m; internal air temperature = 299 K; emissivity = 0.9; solar radiation absorptivity (direct visible and near infrared) = 0.8.
According to the study of Ramponi and Blocken [
30], the velocity profile has been set giving a uniform velocity magnitude at the velocity inlet boundary, the turbulence intensity at 10% and the roughness length
. As the flow approaches the built area, the velocity inlet profile is fully-developed before reaching the buildings [
2,
3].
Figure 1.
Domain canyon mesh.
Figure 1.
Domain canyon mesh.
3. Results
In this paper, several CFD simulations have been performed in order to evaluate the heat exchanges within an isolated tridimensional canyon that has the following geometric characteristics: aspect ratio
H/W = 1 and
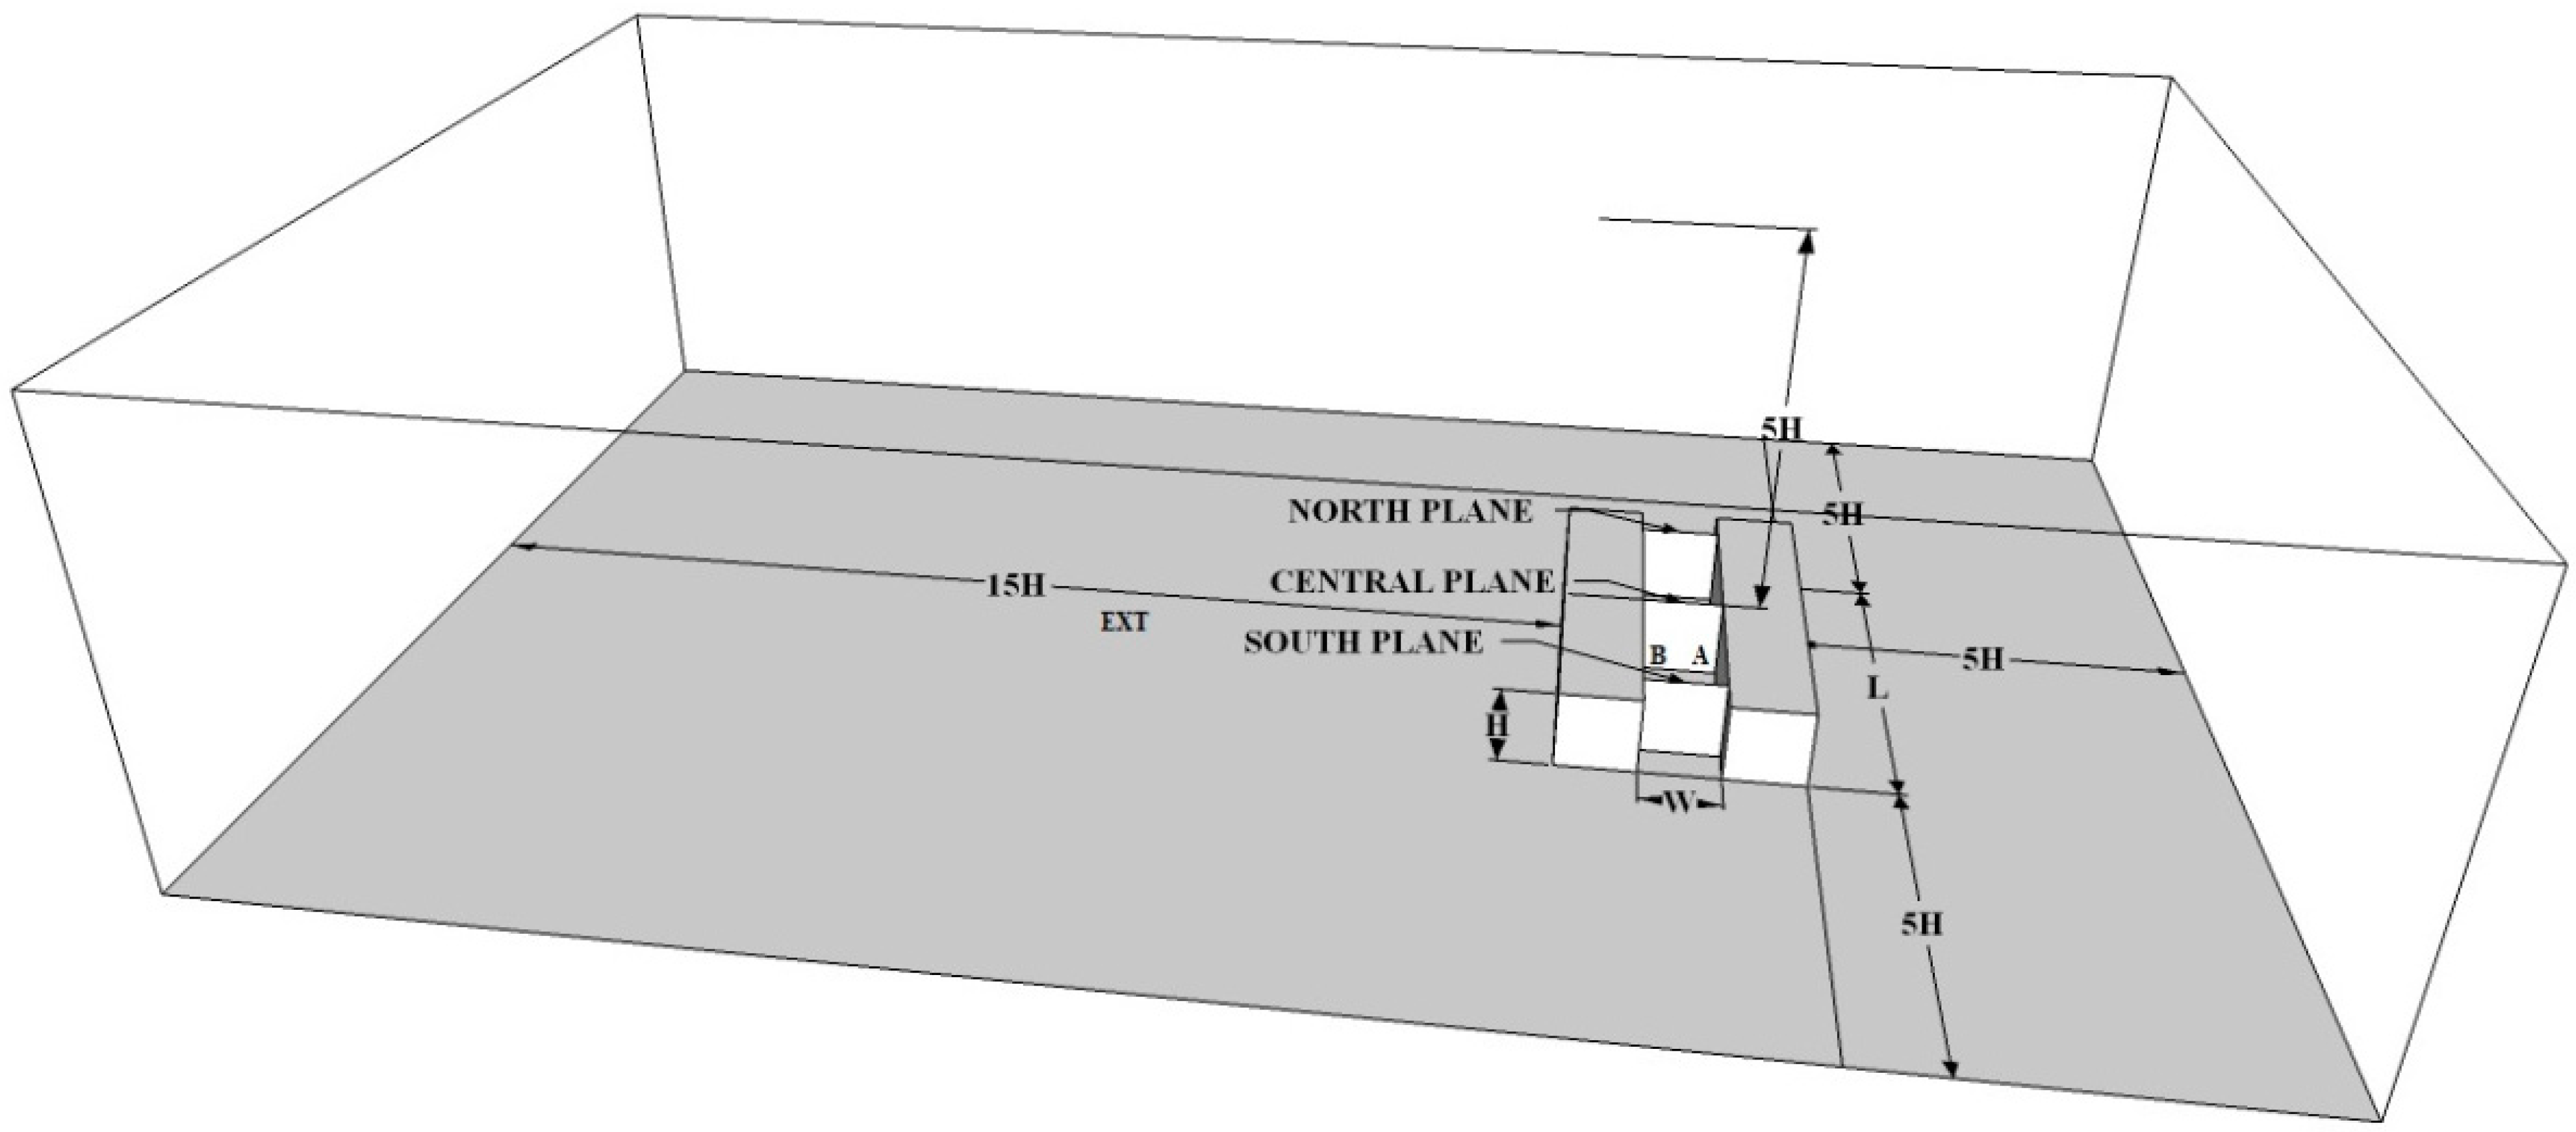
L/W = 5, the width and height of buildings are 20 m, the street width is 20 m and its length is 100 m (
Figure 2).
Figure 2.
Computational domain.
Figure 2.
Computational domain.
The value of convective heat transfer coefficient for different thermal conditions of the buildings surface and the ground has been studied, both for an external façade of the canyon that for the façade inside the canyon.
As reported in [
3,
16], the average value of convective heat transfer coefficient on building façades within an urban canyon depends strongly on the ambient wind velocity magnitude (u
0 and less on the wind direction, even if along the canyon, the convective heat transfer coefficient can have strong variations.
In [
3,
16] is shown that the average CHTC on the windward façade is not very sensitive to wind direction so that a wind direction of 45° from the normal can represent a wide range of wind directions between 0° and 60°.
This conclusion allows us to perform a parametric analysis on the average values of convective heat transfer coefficient, based on results of 3D CFD simulations characterized by an average wind direction. Considering an ambient wind direction of +45°, several simulations have been performed on an isolated street canyon (
H/W = 1) subject to different wind intensities and thermal fields. We have divided our canyon in three zones. The northern zone of the input air flow, a central zone and a south zone of the air flow exit. We made three lines on the first node near the windward walls and leeward representative of these three areas and we found the average value of the CHTC in all these nodes [
2,
3,
31,
32,
33].
In order to validate the CFD numerical model, a comparison with four models (
Table 1), recommended in the paper [
12], of convective heat transfer coefficient calculation, implemented in a BES program (ESP-r), has been performed. It is also considered a numerical correlation (
Table 1) studied by Defraeye
et al. [
21].
As reported in [
12] there is considerable uncertainty in the prediction of convective heat transfer coefficient related to the use of convection models. The four models chosen for the comparison are based on full-scale experiments and they are developed by: Loveday and Taki [
20], ASHRAE task group [
26], MoWITT [
27] and Liu and Harris [
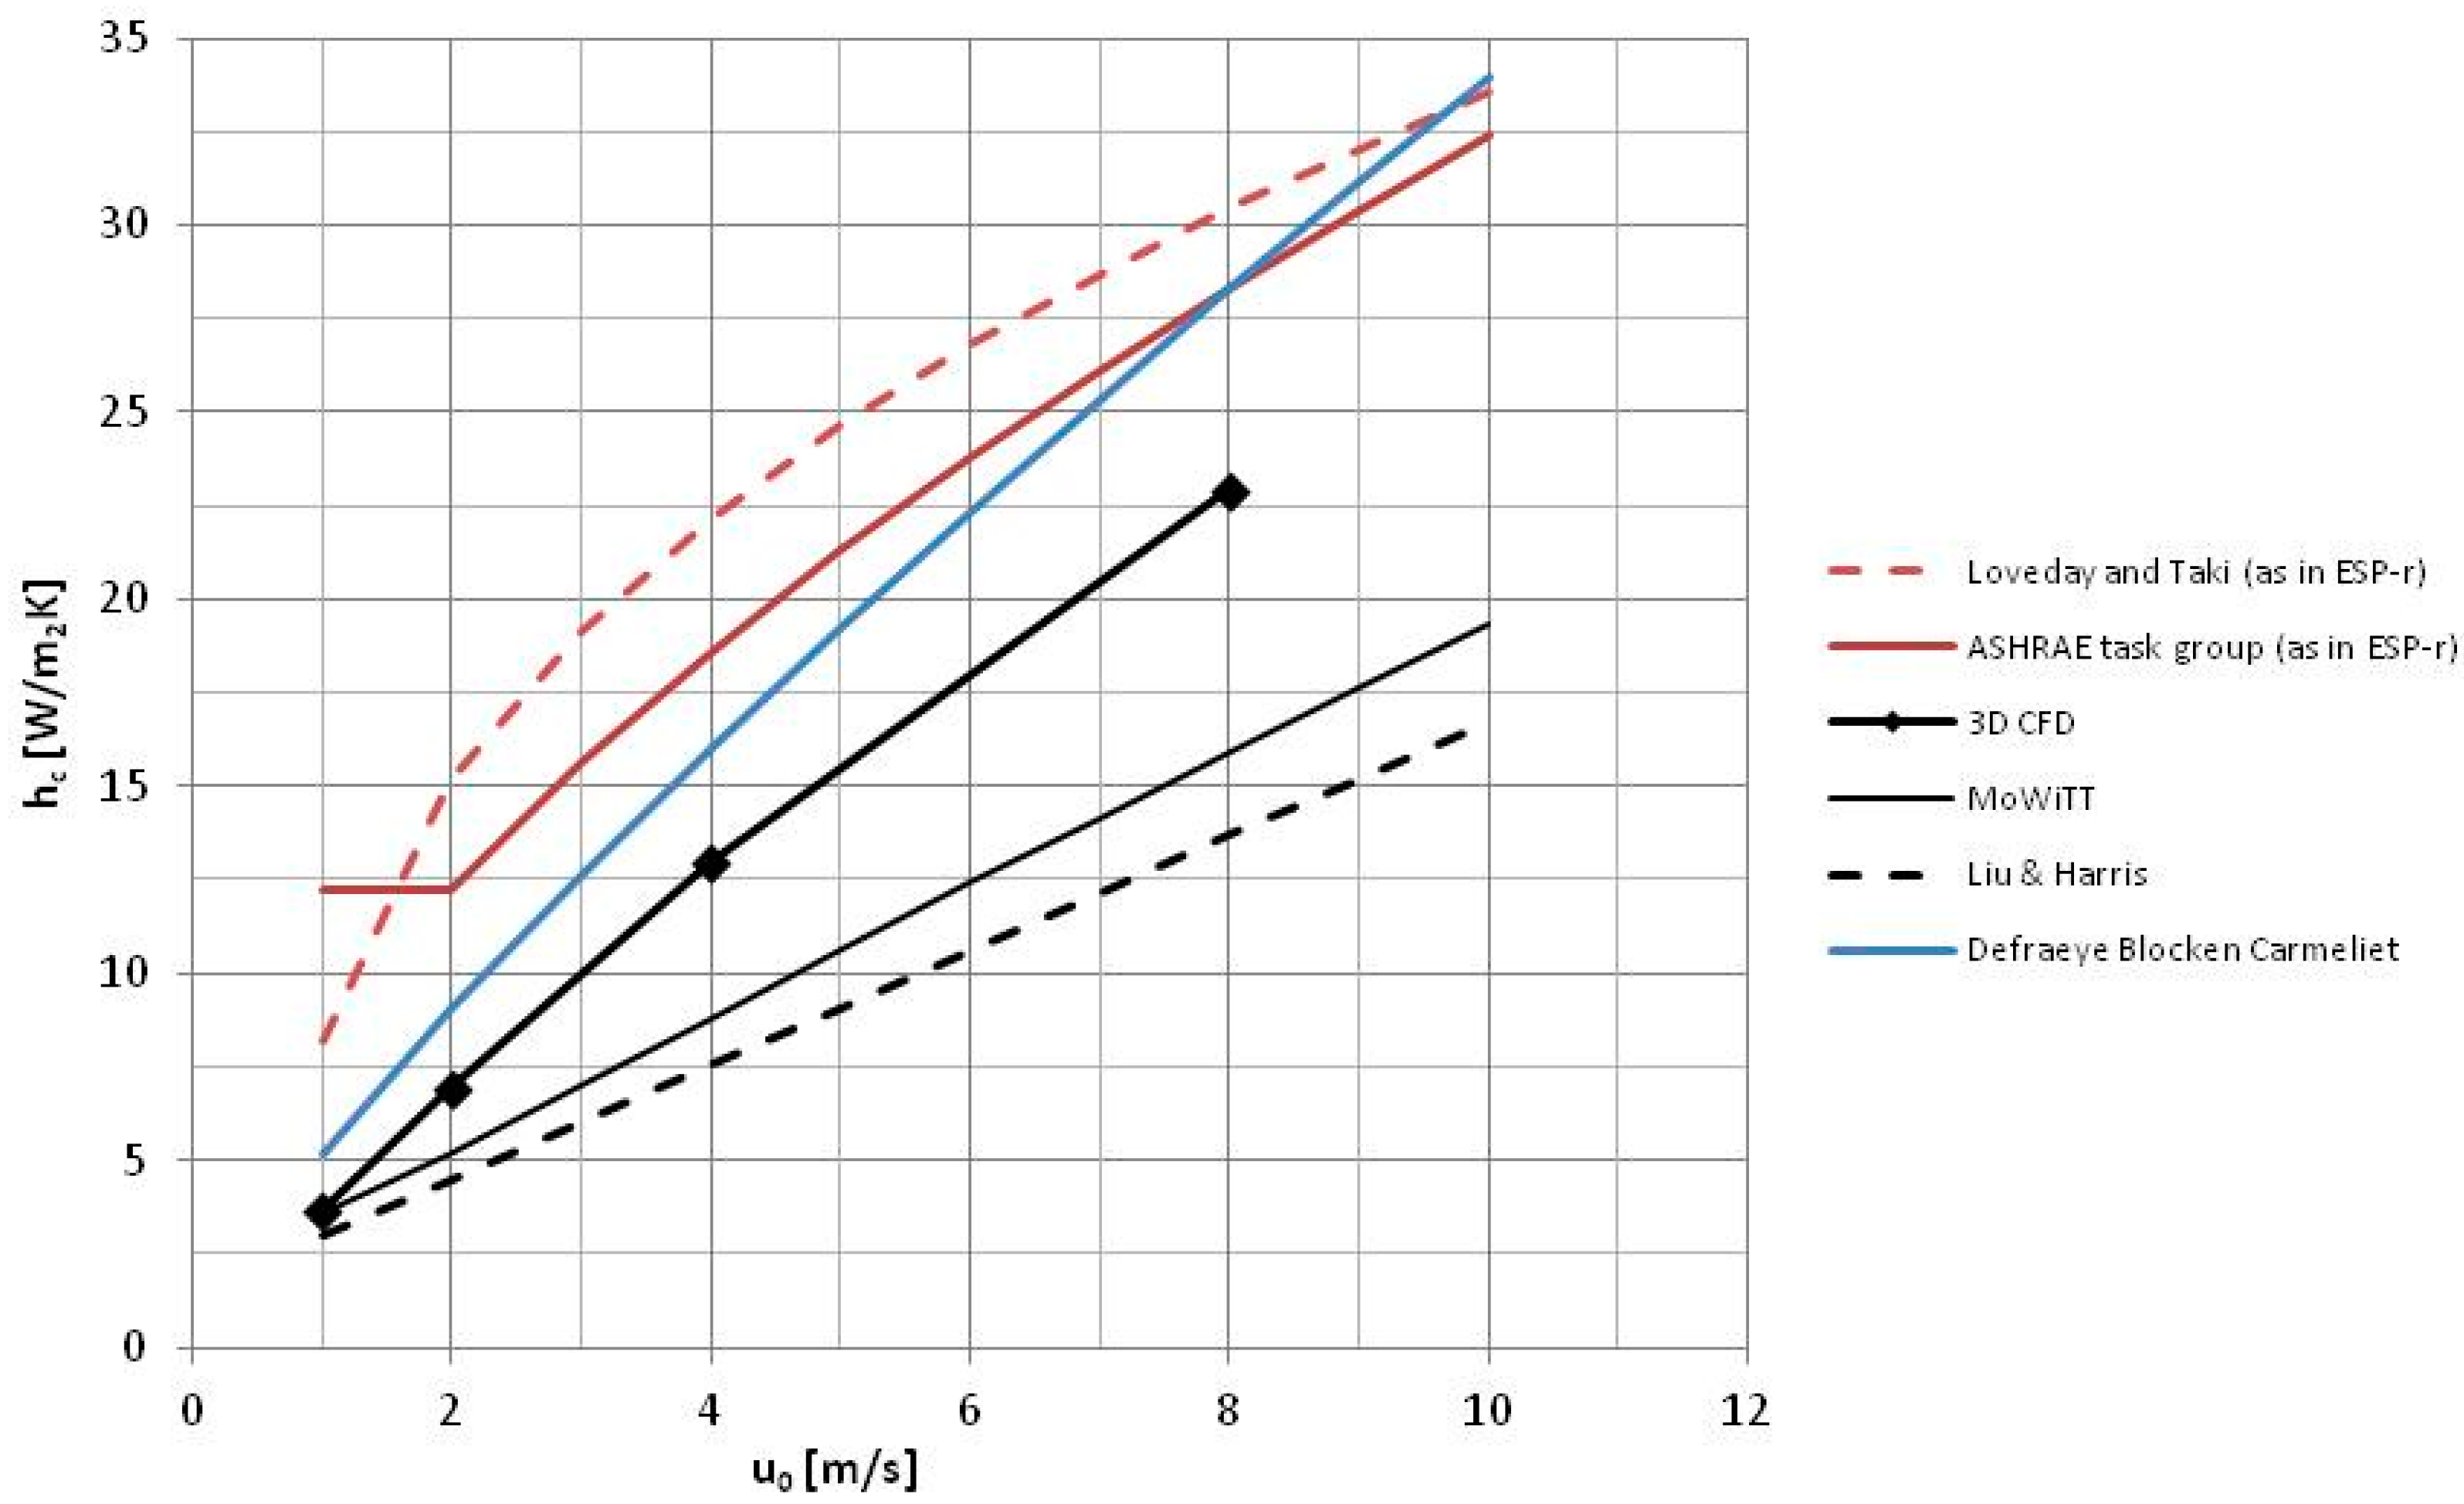
19]. These models can be divided in two groups: Loveday and Taki and the ASHRAE task group, that are representative of buildings with 6–8 floor (high buildings), MoWITT and Liu and Harris, that are representative of low buildings. We chose to compare results of models on the windward façade with the values obtained with the CFD canyon model, considering the external windward façade, that is the first façade subject to the ambient wind. In
Figure 3, CHTC profiles related to wind speed measured at 10 m above ground level in the upstream undisturbed wind flow (
), are shown; in CFD simulations,
corresponds to the wind velocity magnitude assigned at the inlet boundary condition (
). The temperature difference between the wall and the wind flow in 30 °C, it is used in CFD simulation and in the Mowitt correlation. As it can be seen, CFD simulations achieve intermediate values between the two groups of models, Instead the numerical correlation of Blocken takes values similar to those for the high buildings.
Table 1.
Expressions of different correlations models used in the paper.
Table 1.
Expressions of different correlations models used in the paper.
| MODELS | CORRELATIONS |
|---|
| Loveday and Taki | | - |
| ASHRAE task group | | for else |
| MoWITT | | |
|
|
| Liu and Harris | | - |
| Defraeye Blocken Carmeliet | | - |
Figure 3.
Comparison on convective heat transfer coefficient values calculated with correlations and 3D Computational Fluid Dynamics (CFD) simulations.
Figure 3.
Comparison on convective heat transfer coefficient values calculated with correlations and 3D Computational Fluid Dynamics (CFD) simulations.
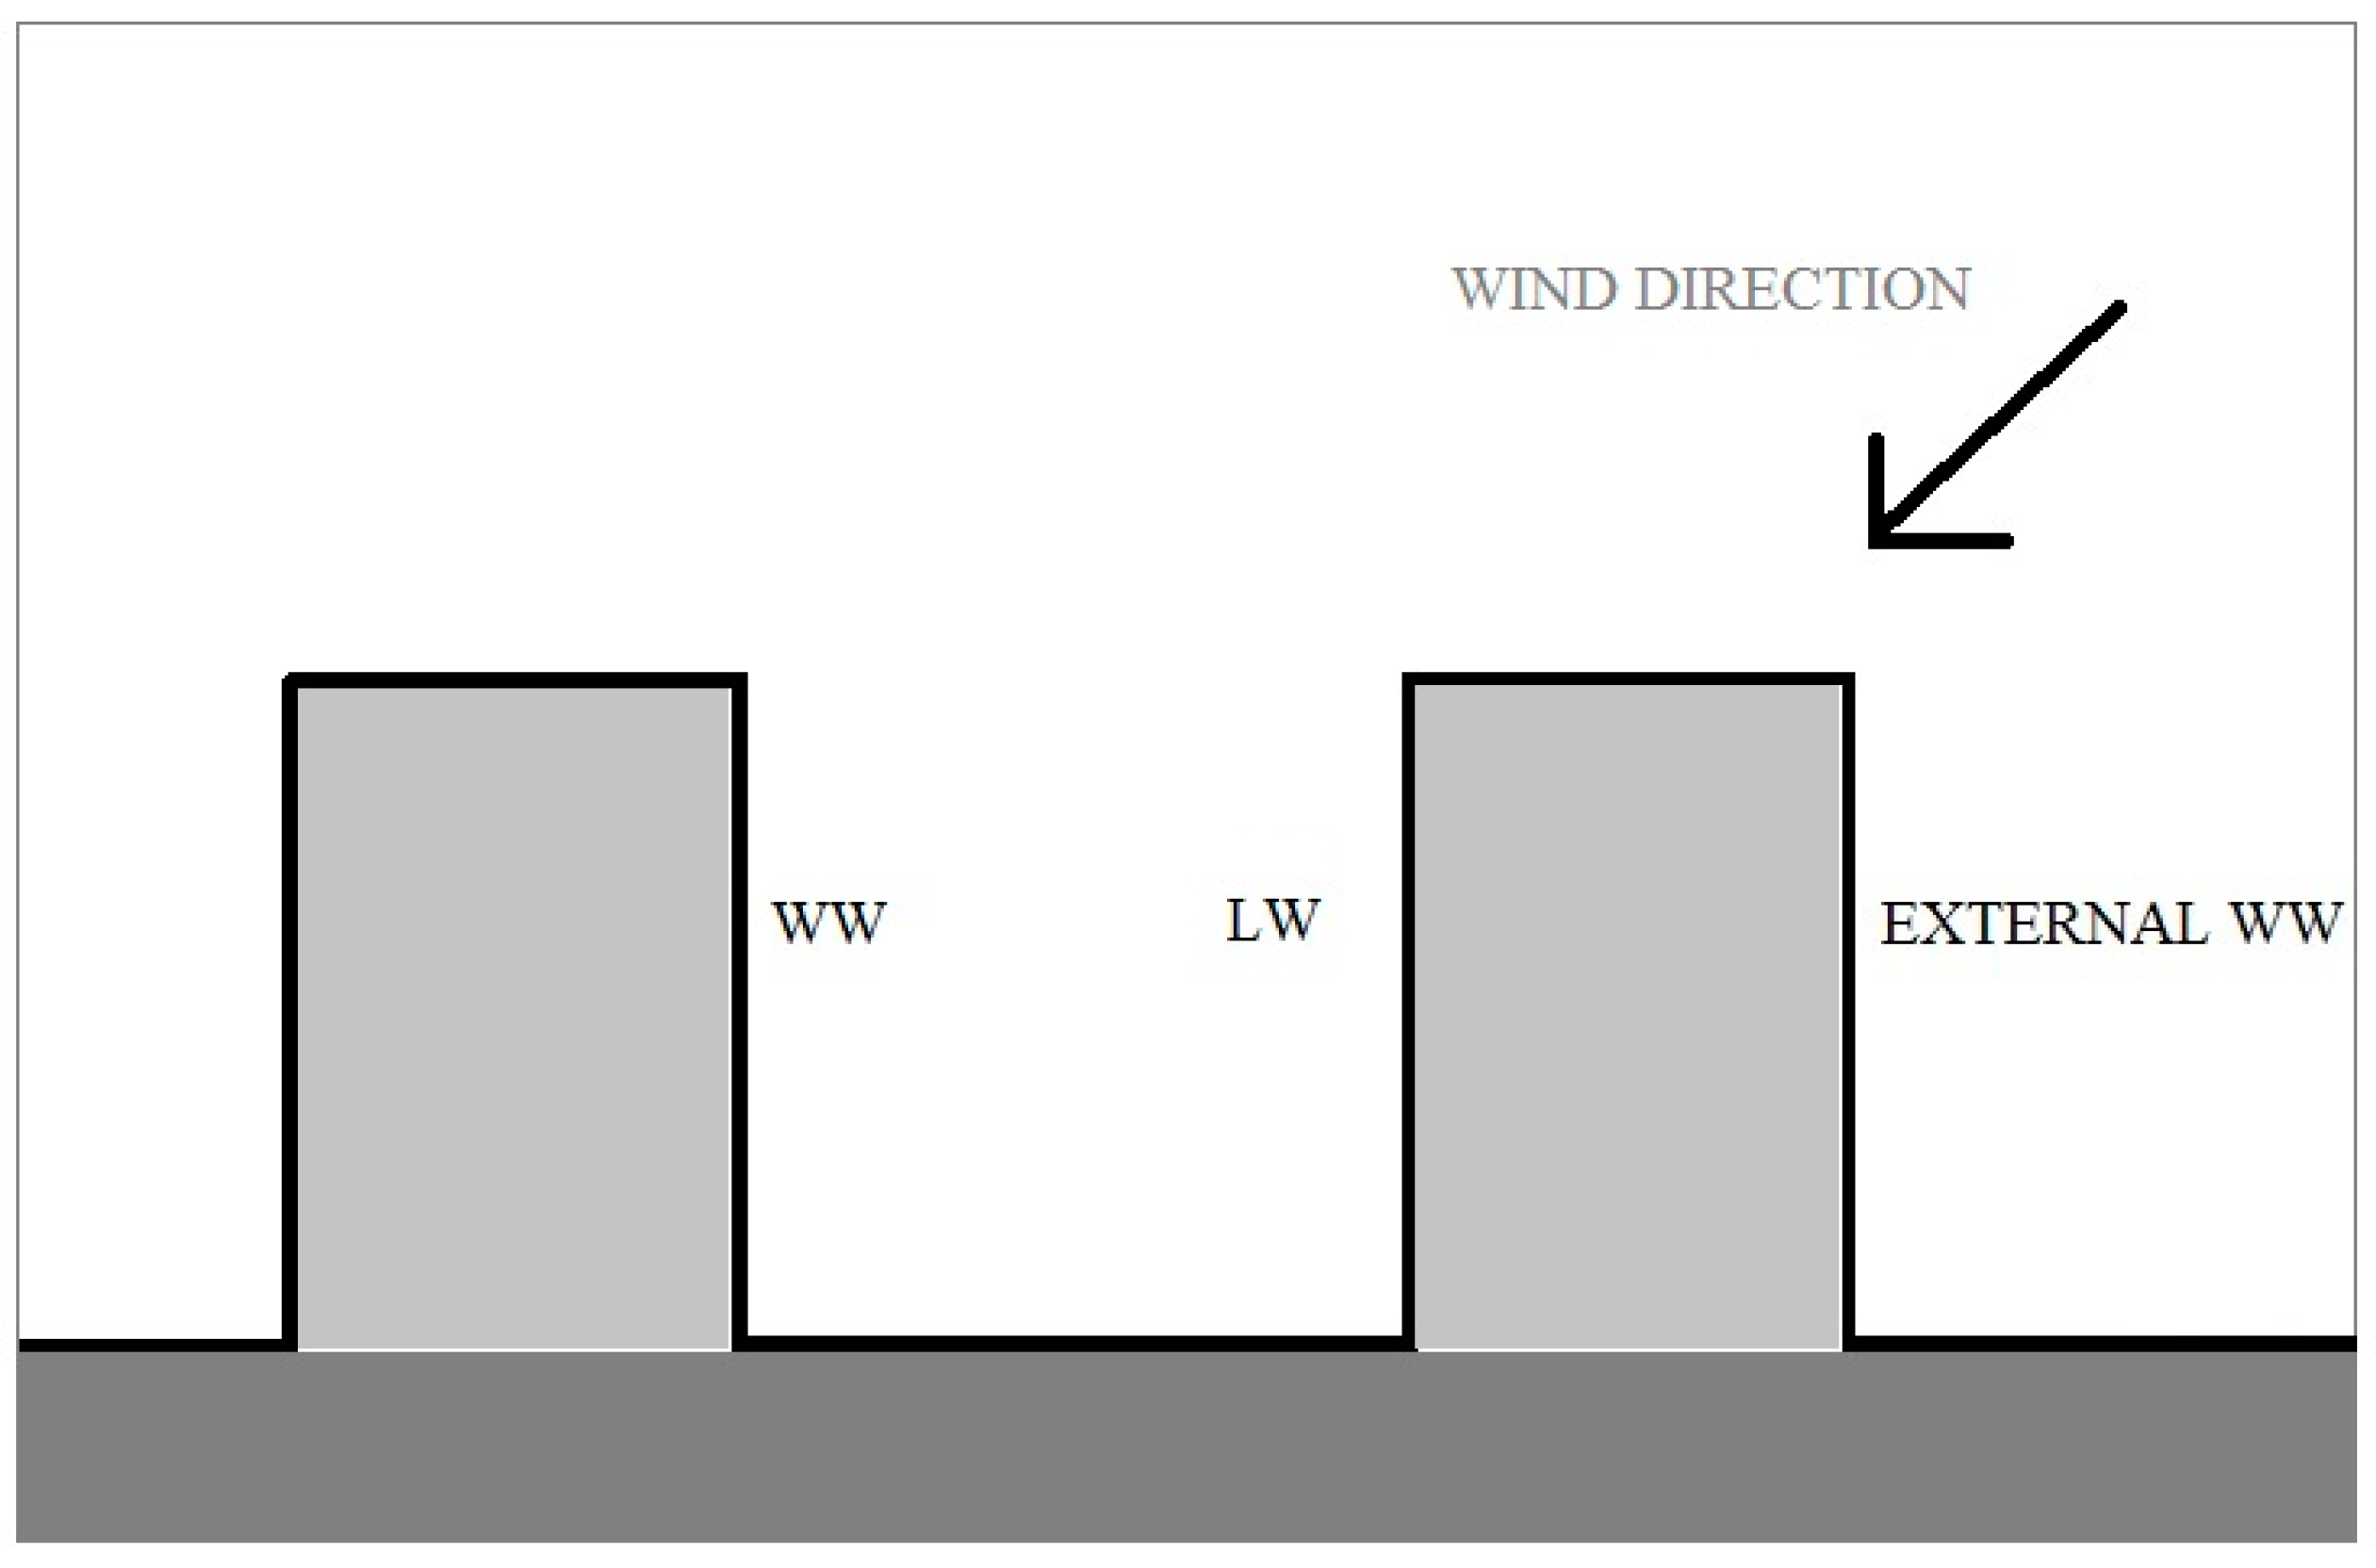
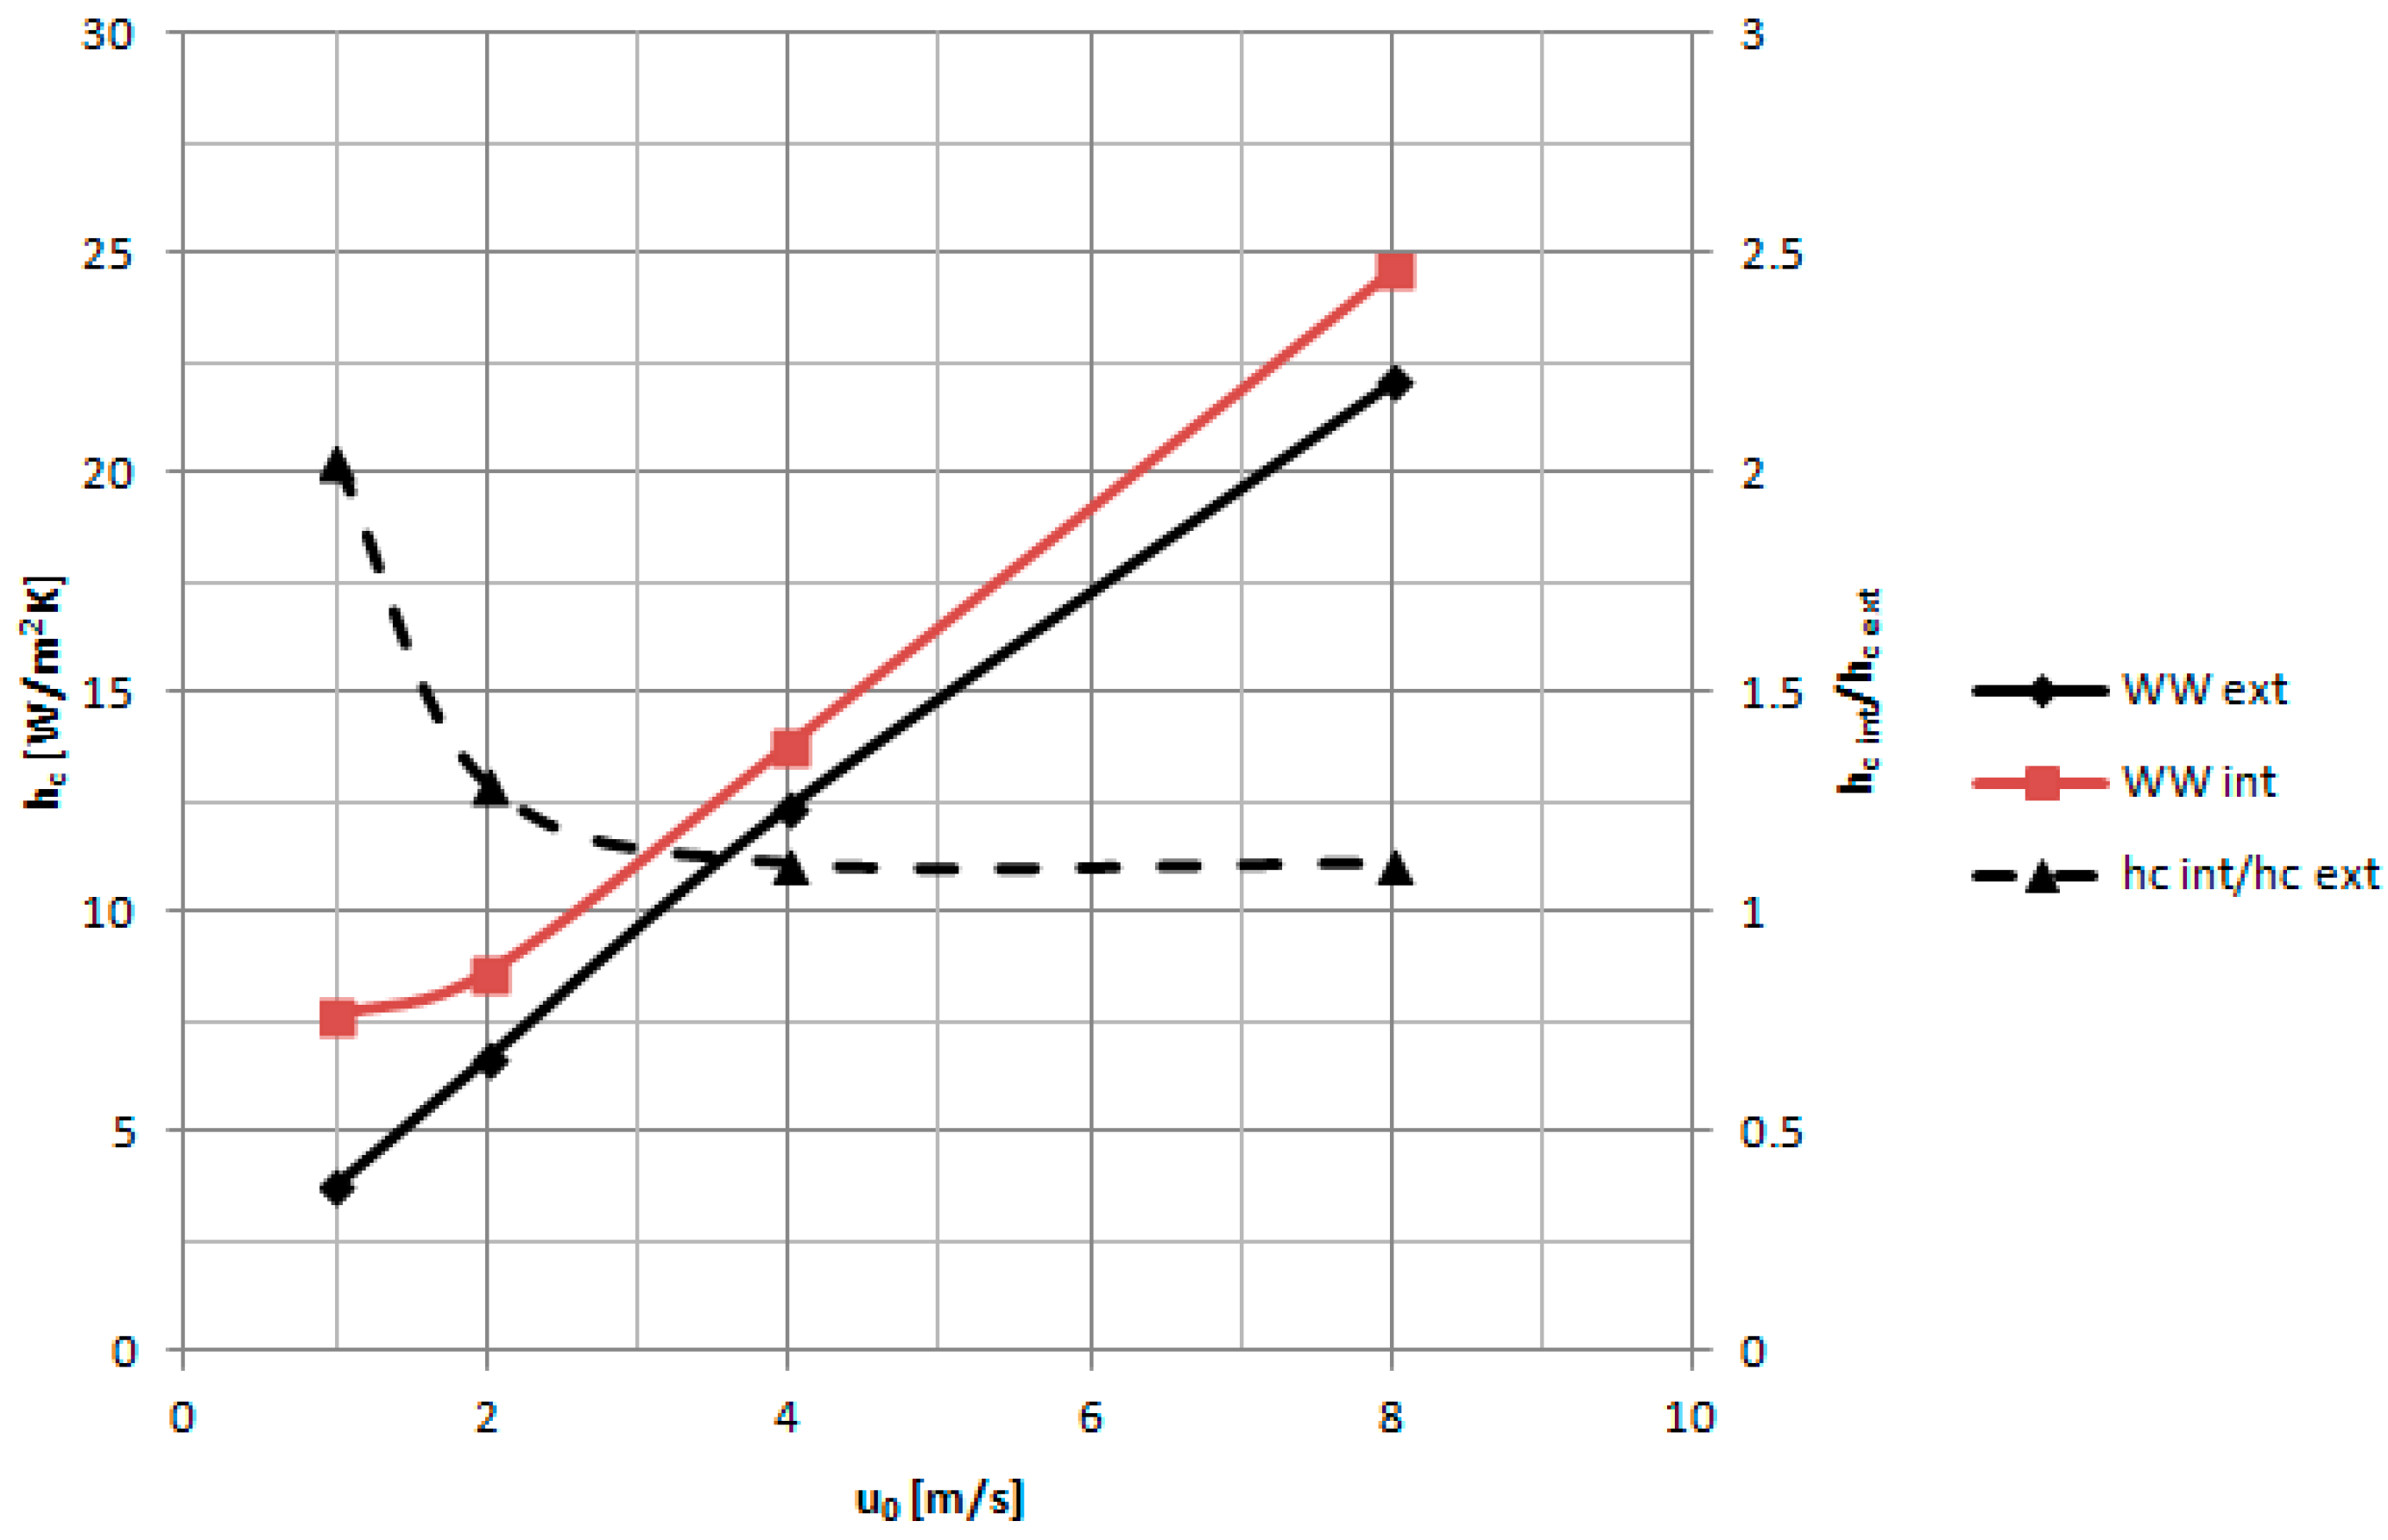
Figure 4 show the windward and leeward facades, and in
Figure 5, a comparison between
hc values on the external windward façade and the internal one is proposed.
Figure 4.
Windward and leeward scheme for our simulations.
Figure 4.
Windward and leeward scheme for our simulations.
The convective heat transfer coefficient on the windward façade within the canyon is always higher than the one on the external windward and, as it can be seen, by increasing the ambient wind speed, the difference increases to a value of 10%. Due to natural convection effects, at low ambient wind speed, the internal windward CHTC doubles the external value.
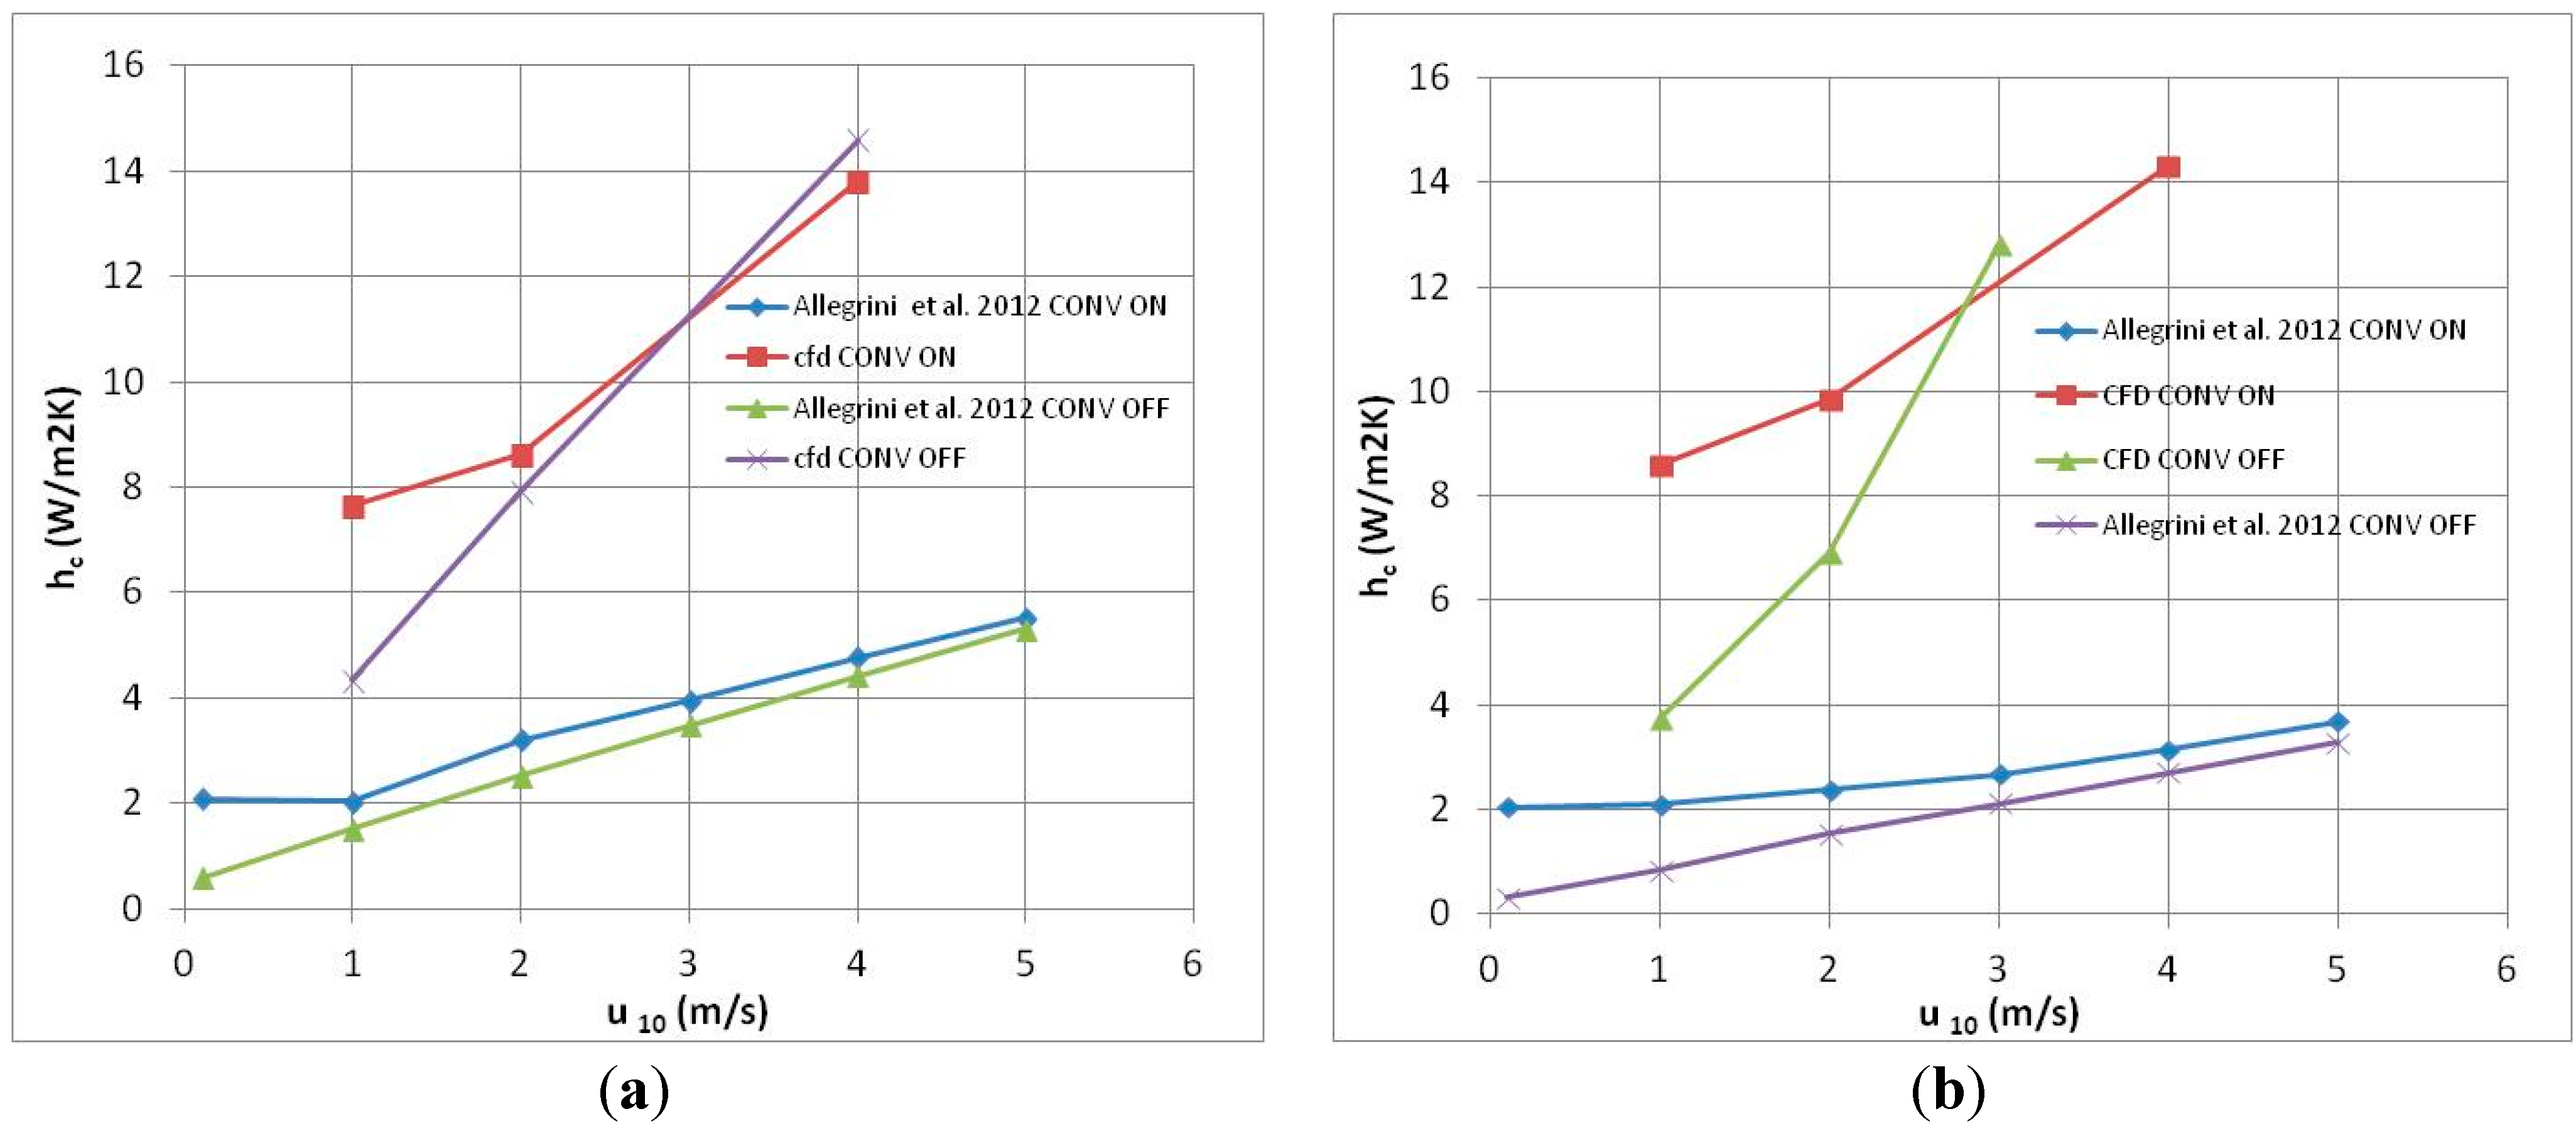
The CFD values of convective heat transfer coefficient for an internal façade were compared to the results of a two-dimensional canyon by Allegrini
et al. [
34]. The parameters used for this comparison are:
H/W = 1 and the difference temperature between the surfaces is 30 °C with convection on and off.
Figure 5 and
Figure 6 show that the values of the convective heat transfer coefficient for our simulations are always higher than those of results of paper [
34], and this should be due to the effects of the three-dimensional canyon.
Figure 5.
Comparison on convective heat transfer coefficient values (CHTC) between external and internal windward façades.
Figure 5.
Comparison on convective heat transfer coefficient values (CHTC) between external and internal windward façades.
Figure 6.
(a) Convective heat transfer coefficients (CHTC) versus wind speed with a temperature of 30 °C for the heated surfaces in windward facades; (b) CHTC versus wind speed with a temperature of 30 °C for the heated surfaces in leeward facades.
Figure 6.
(a) Convective heat transfer coefficients (CHTC) versus wind speed with a temperature of 30 °C for the heated surfaces in windward facades; (b) CHTC versus wind speed with a temperature of 30 °C for the heated surfaces in leeward facades.
Three-dimensional effects produce changes in the structure and intensity of the flow field along the canyon. This could be the reason why the values of the average velocity are always higher than in the 2D simulations by Saneinejad
et al. [
35].
Bottillo
et al. [
2,
3] showed that for each ambient wind condition the vortex structure changes significantly along the entire length of the canyon; even if the ambient wind direction is almost transversal to the canyon, there is always a remarkable longitudinal velocity component, which in turn affects the heat transfer coefficient values.
4. Conclusions
In this paper there is an agreement between our results and those obtained from the correlations used in BES programs, resulting from experimental data for external facades. This gives us confidence in the use within the canyon.
Furthermore, the results clearly show the coherence of using the CFD model for the evaluation of the convective heat transfer coefficient both an interior and an exterior canyon facades even if there are flows recirculating and presence of natural convection.
Differences were found between our values of hc and those obtained from other numerical work by Blocken et al. both in the canyon and exterior facades. The biggest differences are in the values within the canyon.
The difference between our values and the ones obtained by Allegrini
et al. [
34] seems largely due to the effect of three-dimensional CFD simulation. Furthermore, the values of
hc, reported in this paper are higher than the ones calculated in 2D models [
35].
The three-dimensional effects in a canyon are very important because they change the structure of the flow field and the velocity magnitude values.
Bottillo
et al. [
2,
3] showed that for each ambient wind condition, the vortex structure changes significantly along the entire length of the canyon; even if the ambient wind direction is almost transversal to the canyon, there is always a remarkable longitudinal velocity component, that in turn affects the heat transfer coefficient values.
Therefore, the velocity values are much higher than the values of Saneinejad
et al. [
35]. Since our velocity values are higher, the thermal exchange and the heat exchange coefficient increase.
The CFD results for external façades of the canyon are in good agreement with the experimental correlations. This allows us to affirm that the numerical simulation could be used to evaluate the thermal field of buildings, even when the thermal and fluid dynamic fields become a very complex problem for the presence of recirculation effects and natural convection. As regards the values in the canyon there are differences, especially if the models used are two- instead of three-dimensional. It is necessary to validate the results through experimental measurements.


