Article

The Use of an Innovative Jig to Stimulate Awareness of Sustainable Technologies among Freshman Engineering Students

by
Pierre Hertzog
*,† and
Arthur James Swart
Central University of Technology, Electrical, Electronic and Computer Engineering, Park Road, Willows, Bloemfontein 9300, South Africa
*
Author to whom correspondence should be addressed.
These authors contributed equally to this work.
Sustainability 2015, 7(7), 9100-9117; https://doi.org/10.3390/su7079100
Submission received: 13 April 2015 / Revised: 2 July 2015 / Accepted: 6 July 2015 / Published: 14 July 2015

Abstract

:
Renewable energy systems, such as photovoltaic (PV) systems, still require a great deal of research and development in order to improve efficiency, reduce overall manufacturing costs, and to become more sustainable in the future. Solar power production using PV modules has increased and is currently one of the fastest growing energy technologies worldwide, leading to speculation that it will be the main source of electrical power in future. This on-going research and implementation of PV modules and systems necessitates the effective training of technicians, technologists and engineers required to install, maintain or interface with these systems. The Department for Electrical, Electronic and Computer Engineering at the Central University of Technology, Free State (CUT) in South Africa has implemented a Higher Certificate in Renewable Energy Technologies (HCRET) in January 2014. The purpose of this article is to outline a practical innovative jig that was used to stimulate awareness and understanding of the fundamental operating principles of one specific sustainable technology, namely PV modules. Electronic measurements from this innovative jig are obtained by using an ARDUINO UNO board which interfaces with LabVIEW. Student perceptions of using this innovative jig are further presented, which indicate that the practical experiments were satisfying, challenging, relevant and applicable to PV module operation.

Graphical Abstract

1. Introduction

“A man who has never gone to school may steal from a freight car; but if he has a university education, he may steal the whole railroad” [1]. These words, by the 26th president of America Theodore Roosevelt, drive home the point, not of stealing, but the potential which can arise from developing and maintaining an educated mind. Acquiring an educated mind often starts with elementary school education, while maintaining that educated mind requires life-long learning. In fact, the connotation of China’s higher engineering education includes cultivation of a proper attitude of engineering, a scientific attitude of quality, a concept of internationalized education and life-long learning [2]. Life-long learning includes all types of social education activities [3] as well as the production of knowledge in any field of study [4]. Subsequently, freshman students who enter the engineering profession with the desire to become trained technicians, technologists or engineers must be encouraged to engage in life-long learning, especially with regard to the on-going design and development of more efficient PV modules in order to promote sustainability for future generations.
Poor performance and dropouts among freshman engineering students can, in part, be ascribed to the poor matching of learning and teaching styles [5]. However, the use of different educational technologies can appeal to a wide range of learning styles of engineering students. For example, the use of computer based software packages, such as MATLAB or LabVIEW, involves inductive, sequential, active and visual learning, as students are required to input specific data in a certain order and interpret the results. In fact, previous research has shown how an ARDUINO board can be integrated with MATLAB to achieve specific learning objectives and provide a successful engineering experience for freshman engineering students [6,7]. Academics, therefore, need to adjust their preferred teaching styles to accommodate the diverse learning styles of students [8] and to understand the connection between particular forms of educational technology and their effects on learning and teaching styles [9].
The purpose of this article is to outline a practical innovative jig and its related practical experiments, which were developed to assist freshman engineering students to better grasp the operating principles of photovoltaic (PV) modules in order to promote this sustainable technology. These students engage with inductive, sequential, active and visual learning as they manipulate specific parameters and then visually observe the associated effects. A number of practical experiments are outlined along with the correlated electronic measurements obtained in LabVIEW. Perceptions of freshman electrical engineering students regarding these practical experiments were also obtained using a questionnaire administered by means of an electronic response system.
This article firstly outlines and explains the context in which this study took place. Thereafter, the innovative jig which was developed for freshman engineering students enrolled for a course in renewable energy is explained. The practical experiments are then presented where students have the opportunity to change specific parameters, viewing and measuring the associated effects via the developed LabVIEW interface. Finally, student perceptions of using this innovative jig are given followed by succinct conclusions.

2. Context

In November 2013, the first solar farm of 75 MW near Kalkbult was connected to the South African national grid [1]. Kalkbult was the first of many to follow. The Renewable Energy Independent Producers Procurement Programme, directed by the Department of Energy, has so far approved 31 projects for the Northern Cape [6]. This area is also the main source of students for the Central University of Technology, Free State (CUT), where The Department for Electrical, Electronic and Computer Engineering is located. This provides CUT with a unique opportunity to create awareness and provide effective training to students regarding the operating and installation of these renewable energy systems. This opportunity aligns itself with the Department’s objectives for providing quality education to students with regard to both electronic and power engineering, where the principles and application of electricity, electronics, electrostatics and electromagnetism are discussed. A range of sub-studies are also offered which focus on power electronics, control systems, signal processing and telecommunications. Undergraduate freshman engineering students at CUT have the choice to enroll for a number of different National Diplomas, which usually take a minimum of three years to complete. These programmes often include both theoretical and practical instruction where students can demonstrate vital graduate attributes, such as problem-solving and being technologically literate [2].
The Department for Electrical, Electronic and Computer Engineering implemented a Higher Certificate in Renewable Energy Technologies (HCRET) in January 2014. This is the first pre-graduate course in renewable energy that was approved by the South African Qualification Authority (SAQA). This certificate was designed for individuals who want to engage more with sustainable energy sources and enter the renewable energy field as technicians. Successful completion of the HCRET indicates that students have been able to demonstrate the acquisition of specific learning outcomes relating to the application, design, installation and operation of PV and Small Wind energy systems [1]. This certificate requires one year of full time study which is divided in two semesters (six modules are offered per semester, as shown in Table 1).
Table 1. Modules for HCRET [3].
Semester 1Semester 2
Digital LiteracyHealth and Safety: Principles and Practice
Academic Literacy and Communication StudiesElectrical Installation Practice
Mathematics I APower Generation and Storage
Electrical Engineering ISolar Energy Systems II
Applied Physics of Energy ConversionSmall Wind Generation
Solar Energy Systems IMathematics I B
Digital Literacy, Academic Literacy, Mathematics I A and Mathematics I B are compulsory modules offered by service departments at CUT. The module entitled “Health and Safety: Principles and Practice” is offered by a professional service provider from within this field.
Renewable energy has the potential to play an important role in providing sustainable energy to millions of people in developing countries who have, as yet, no access to clean energy. Despite many of these countries enjoying a variety of renewable energy sources, such as hydro, solar, wind, geothermal, and biomass [4], access to sustainable energy remains elusive for many rural communities [5]. After a decade of astonishing worldwide growth in wind power generation, sustainable utilization of this energy source has become an issue of utmost importance [6,7]. Solar PV energy could also play a significant role in the replacement of fossil fuels leading to a clean energy solution with almost zero environmental impact [8]. Because of its cleanliness, ubiquity, abundance, and sustainability, solar PV energy has become well recognized and widely utilized [9]. Although both solar and wind energy technologies are important in the South African context, this article focuses on experiments done in a solar PV engineering laboratory.

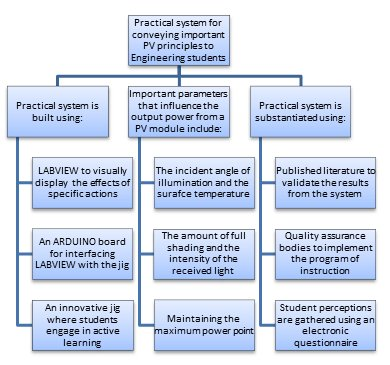
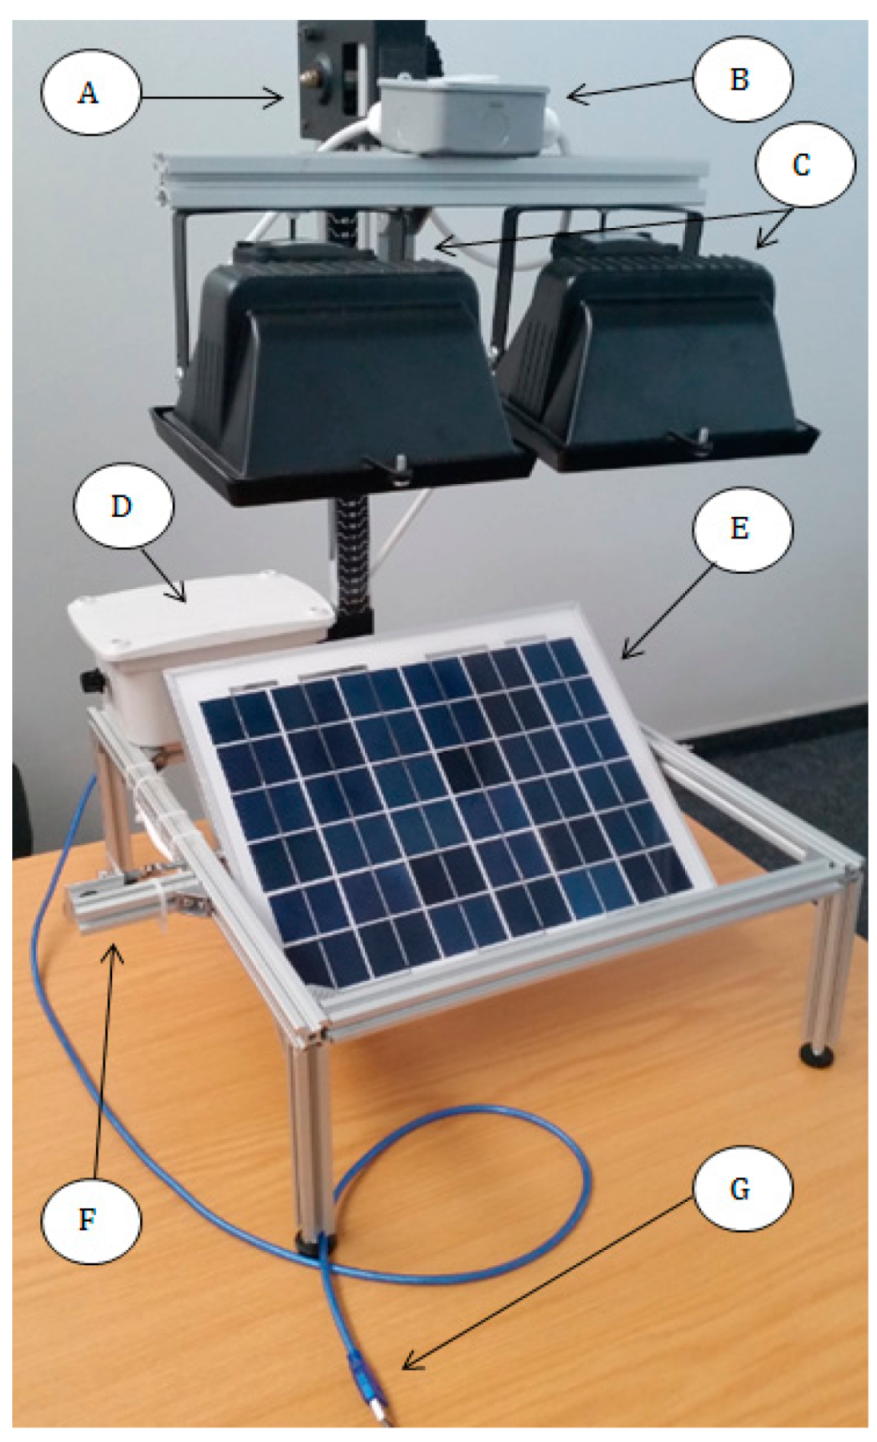
3. Innovative Jig for Demonstrating PV Module Operation

The aim of the system was to assist electrical engineering students to comprehend the operating principles of a PV module with the use of one single hardware and software setup. The layout of the system is shown in Figure 1.
Figure 1. System configuration of the innovative jig.
Sustainability 07 09100 g001
The innovative jig comprises the following components, as shown in Figure 2:
  • A 10 W PV module mounted on an aluminium structure (F) where its tilt angle can be varied (E);
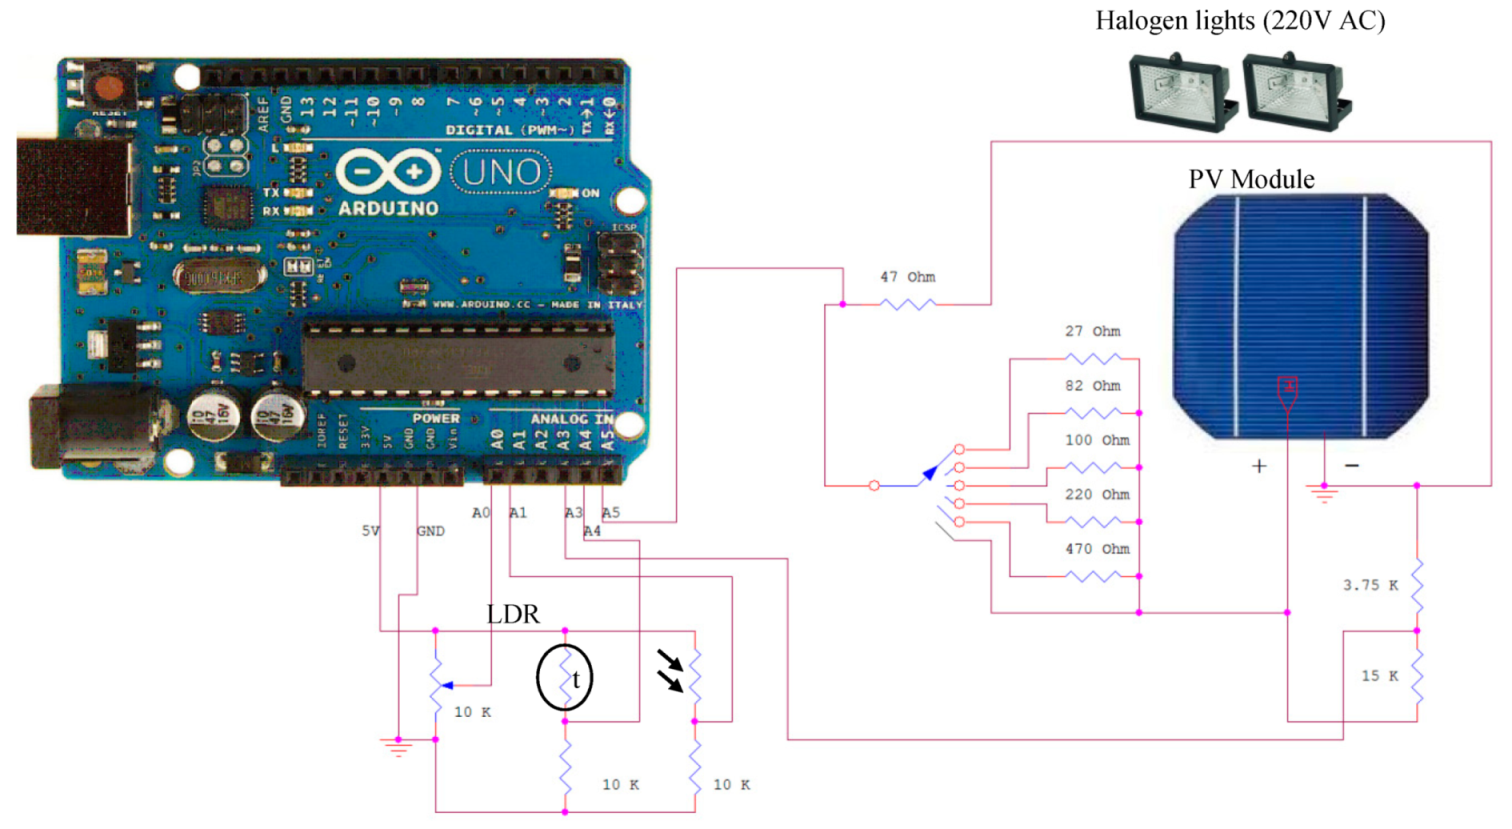
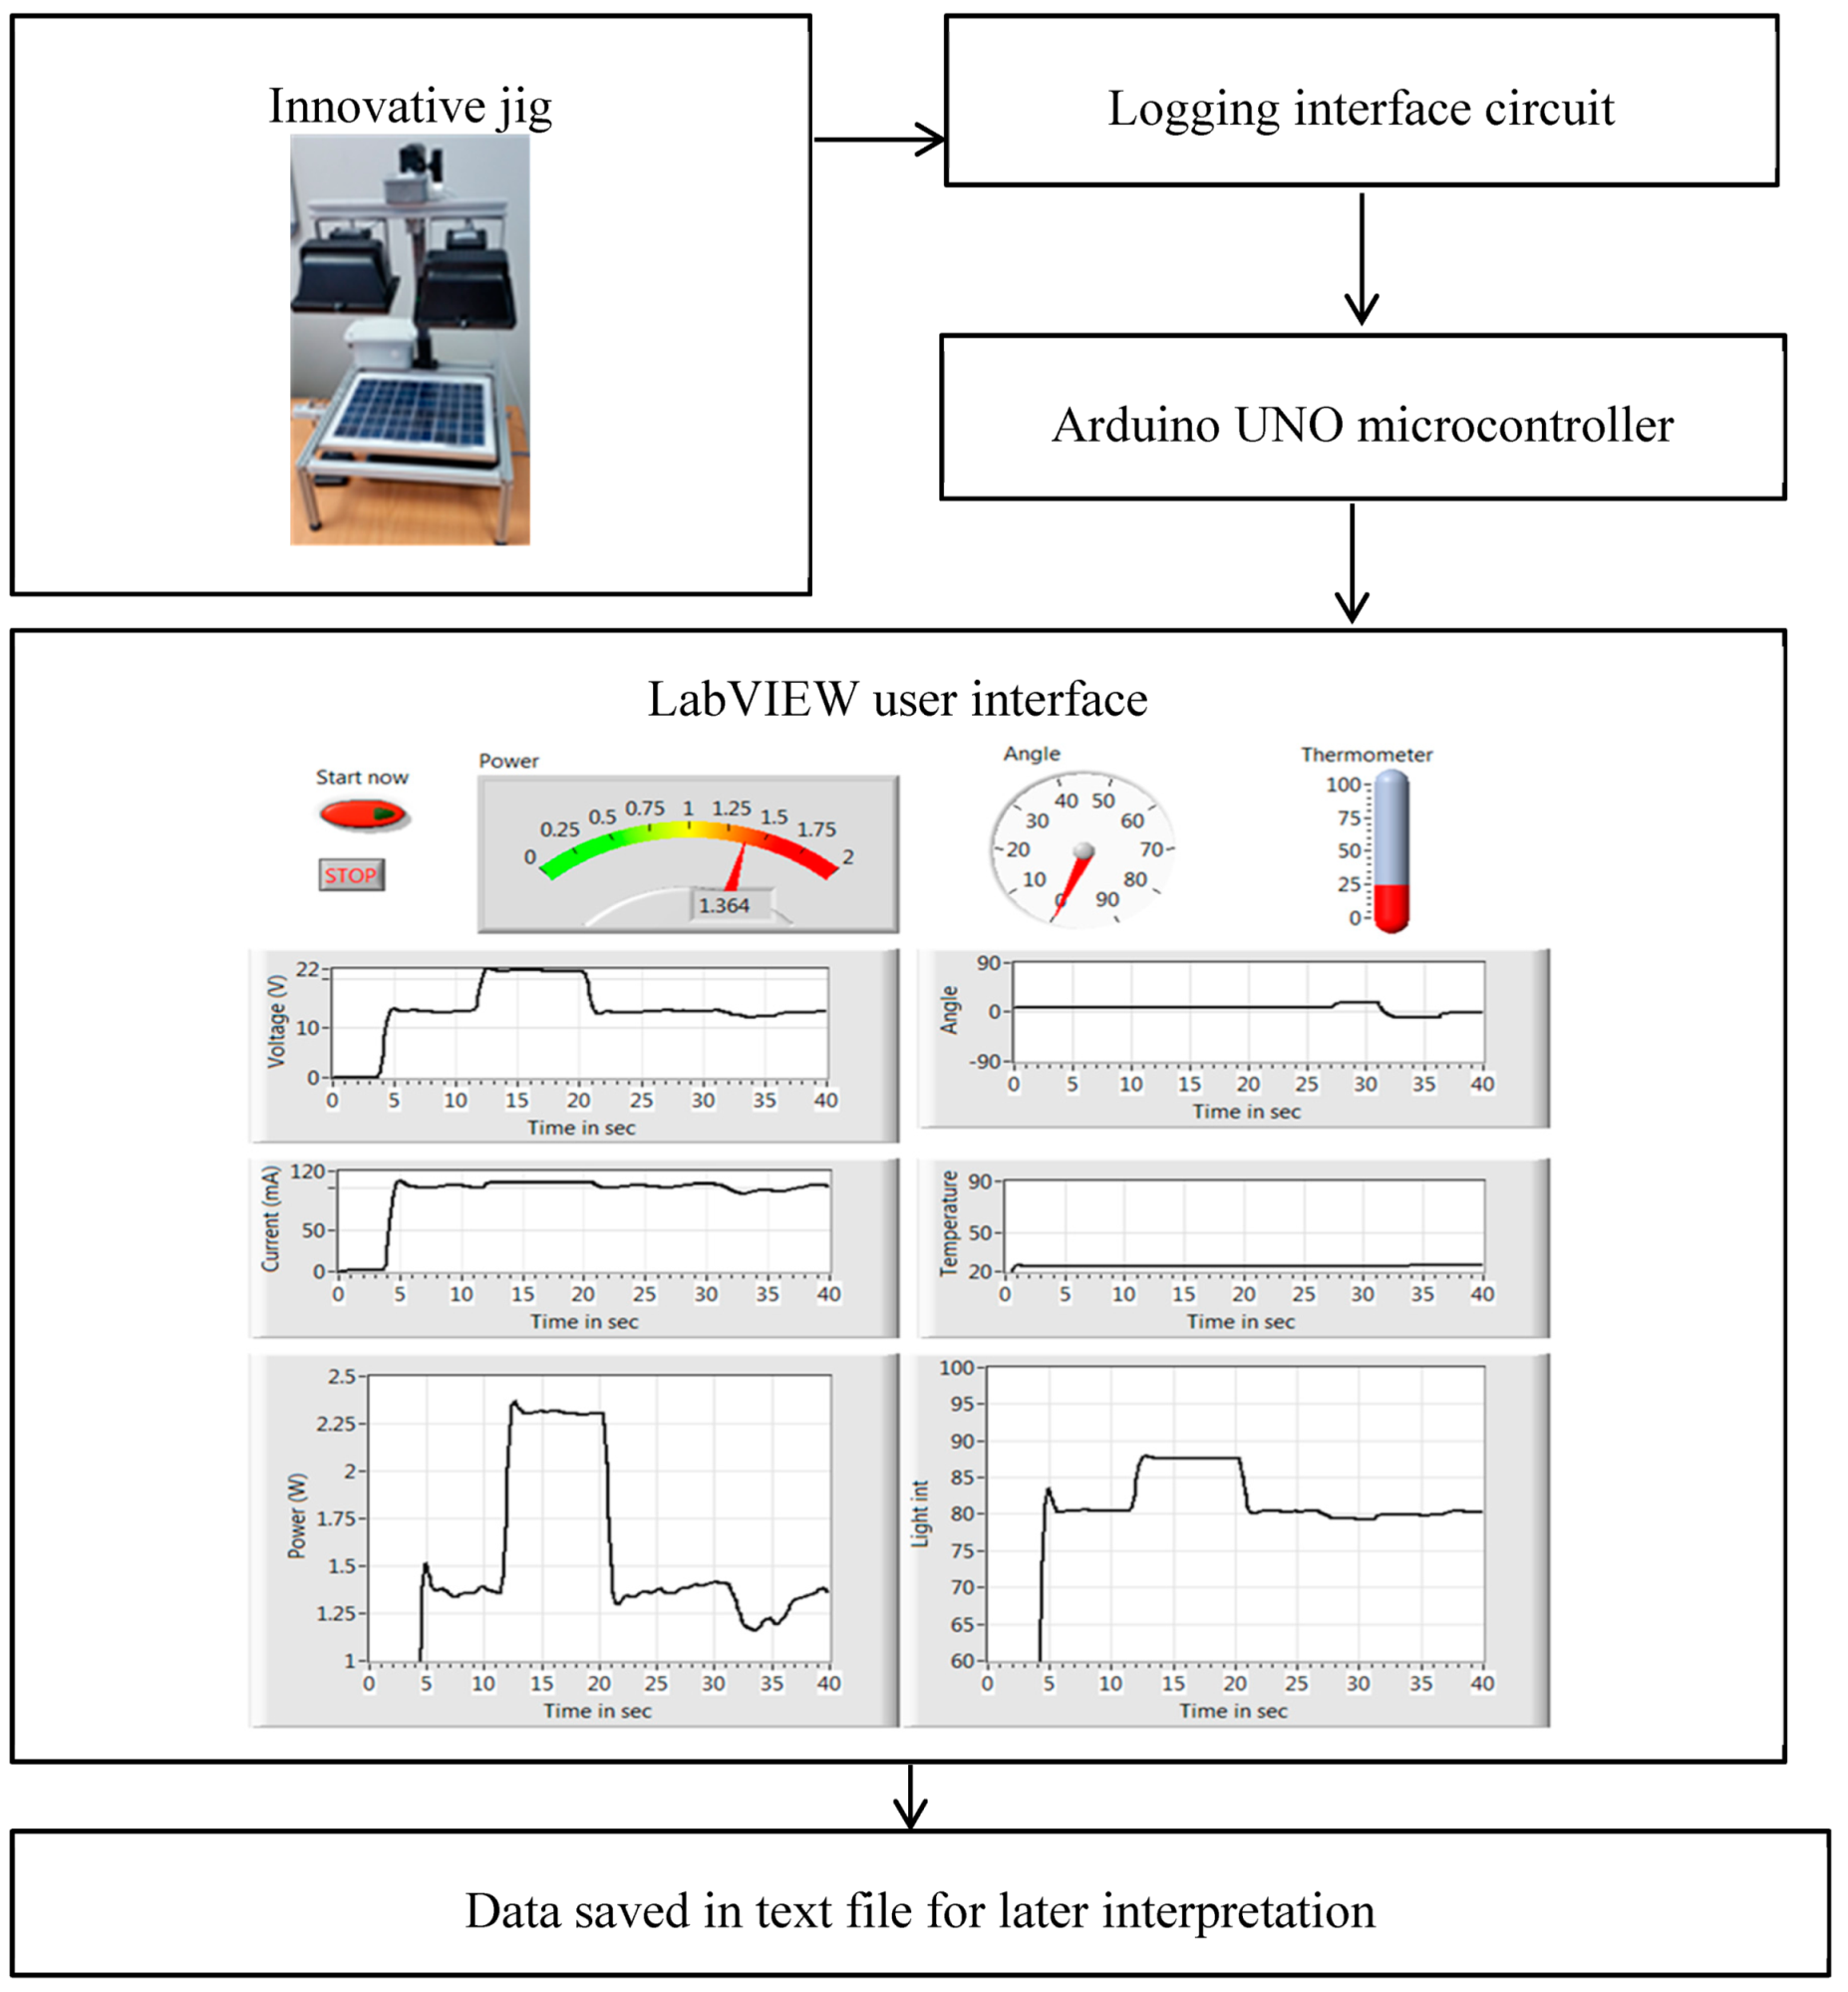
  • A USB connector (G) from an ARDUINO microcontroller located in a watertight box with specific selectable load resistors (D) to enable the sensed data to be viewed and recorded in LabVIEW on a PC;
  • A mechanism to adjust the distance of the light source to the PV module (A);
  • A switch where the two lights can be switched on or off individually (B); and
  • Two 500 W halogen lights (C) which serve as the light source.
Figure 2. Innovative jig.
Sustainability 07 09100 g002
With the aid of this system; an electrical engineering student may demonstrate the achievement of the following learning outcomes:
  • Document the effect how various incident angles of illumination affect the output power of a PV module [10];
  • Assess the influence of temperature on the output power of a PV module [11,12];
  • Verify the negative impact of hard shading (full shading) on the output power of a PV module [13],
  • Determine the I-V curve of a PV module [14,15]; and
  • Clarify the influence of different light intensities on the output power of a PV module [16].
The ARDUINO board that was used to relay the data to the LabVIEW software is an electronic based platform that was originally designed to simplify the process of studying digital electronics. The ARDUINO board was selected which comprises a microcontroller, a programming language and an Integrated Development Environment (IDE) [17]. This board can easily be integrated into LabVIEW, where a customizable program can be developed according to end-user needs. Other reasons for choosing this platform include [18]:
  • It is an open-source project where the software/hardware is extremely accessible and very adaptable;
  • It is flexible and offers a variety of digital and analogue inputs/outputs, serial interface and digital and PWM outputs;
  • It is easy to change and update the program as it connects to a PC via USB and communicates using standard serial protocol;
  • It is an inexpensive microcontroller for which the software is freely available; and
  • It has a large online community with a lot of references, example source codes and libraries to refer to.
National Instruments LabVIEW is a graphical programming language that has its roots in automation control and data acquisition. Its graphical representation, similar to a process flow diagram, was created to provide an intuitive programming environment for scientists and engineers. The language has matured over the last 20 years to become a general purpose programming environment. LabVIEW has several key features which make it a good choice in an automation environment. These include simple network communication, common communication protocols (RS232, GPIB, etc.), powerful toolsets for process control and data fitting, fast and easy user interface construction, and an efficient code execution environment [19].
Figure 3. LabVIEW user interface.
Sustainability 07 09100 g003
The LabVIEW user interface that was developed and used for the practical experiments is shown in Figure 3. Before the ARDUINO can be used in conjunction with LabVIEW, it needs to be loaded with the LabVIEW base software [20]. In the LabVIEW software, the ARDUINO must be initiated, and again closed at the end of every session. Voltage readings are obtained from the ARDUINO by using the analog read function. The output power of the module is calculated by multiplying the measured output voltage by the calculated current through the load. This current is then calculated in LabVIEW by using the voltage across a known resistor that exists in series with the switchable loads. Temperature readings for the module are obtained by a thermistor read function in LabVIEW. The relative light intensities are measured with the use of a light dependant resistor. The tilt angle of the module is measured with the aid of a variable resistor that is set up as a potential divider. The voltage from the potential divider circuit is read by the analogue input pin, A0, of the ARDUINO UNO board and passed onto LabVIEW, where it is interpreted and displayed as the tilt angle. The distance from the lights to the PV module is not measured by a sensor. The circuit diagram for the innovative jig is shown in Figure 4.
Figure 4. Circuit diagram of innovative jig.
Sustainability 07 09100 g004
Table 2. An example of part of a text file.
DateTime msCurrent mATemp °CAngle °Voltage VLight int relative
26 May 2015480050.1334.341.0915.1489.35
26 May 2015500050.1334.341.3615.1489.36
26 May 2015520050.1334.361.3615.1489.36
The student can view the LabVIEW interface for interpretation of results and also the data that is written to a text file at the end of each experiment (200 samples taken at an interval of 200 ms). An example of a small part of this text file is given in Table 2. The student can use the data in this file to complete his/her report. The number of samples and the sample interval can be changed in the LabVIEW software. The light intensity is measured with a light dependent resistor (LDR) and is a relative indication of light intensity.

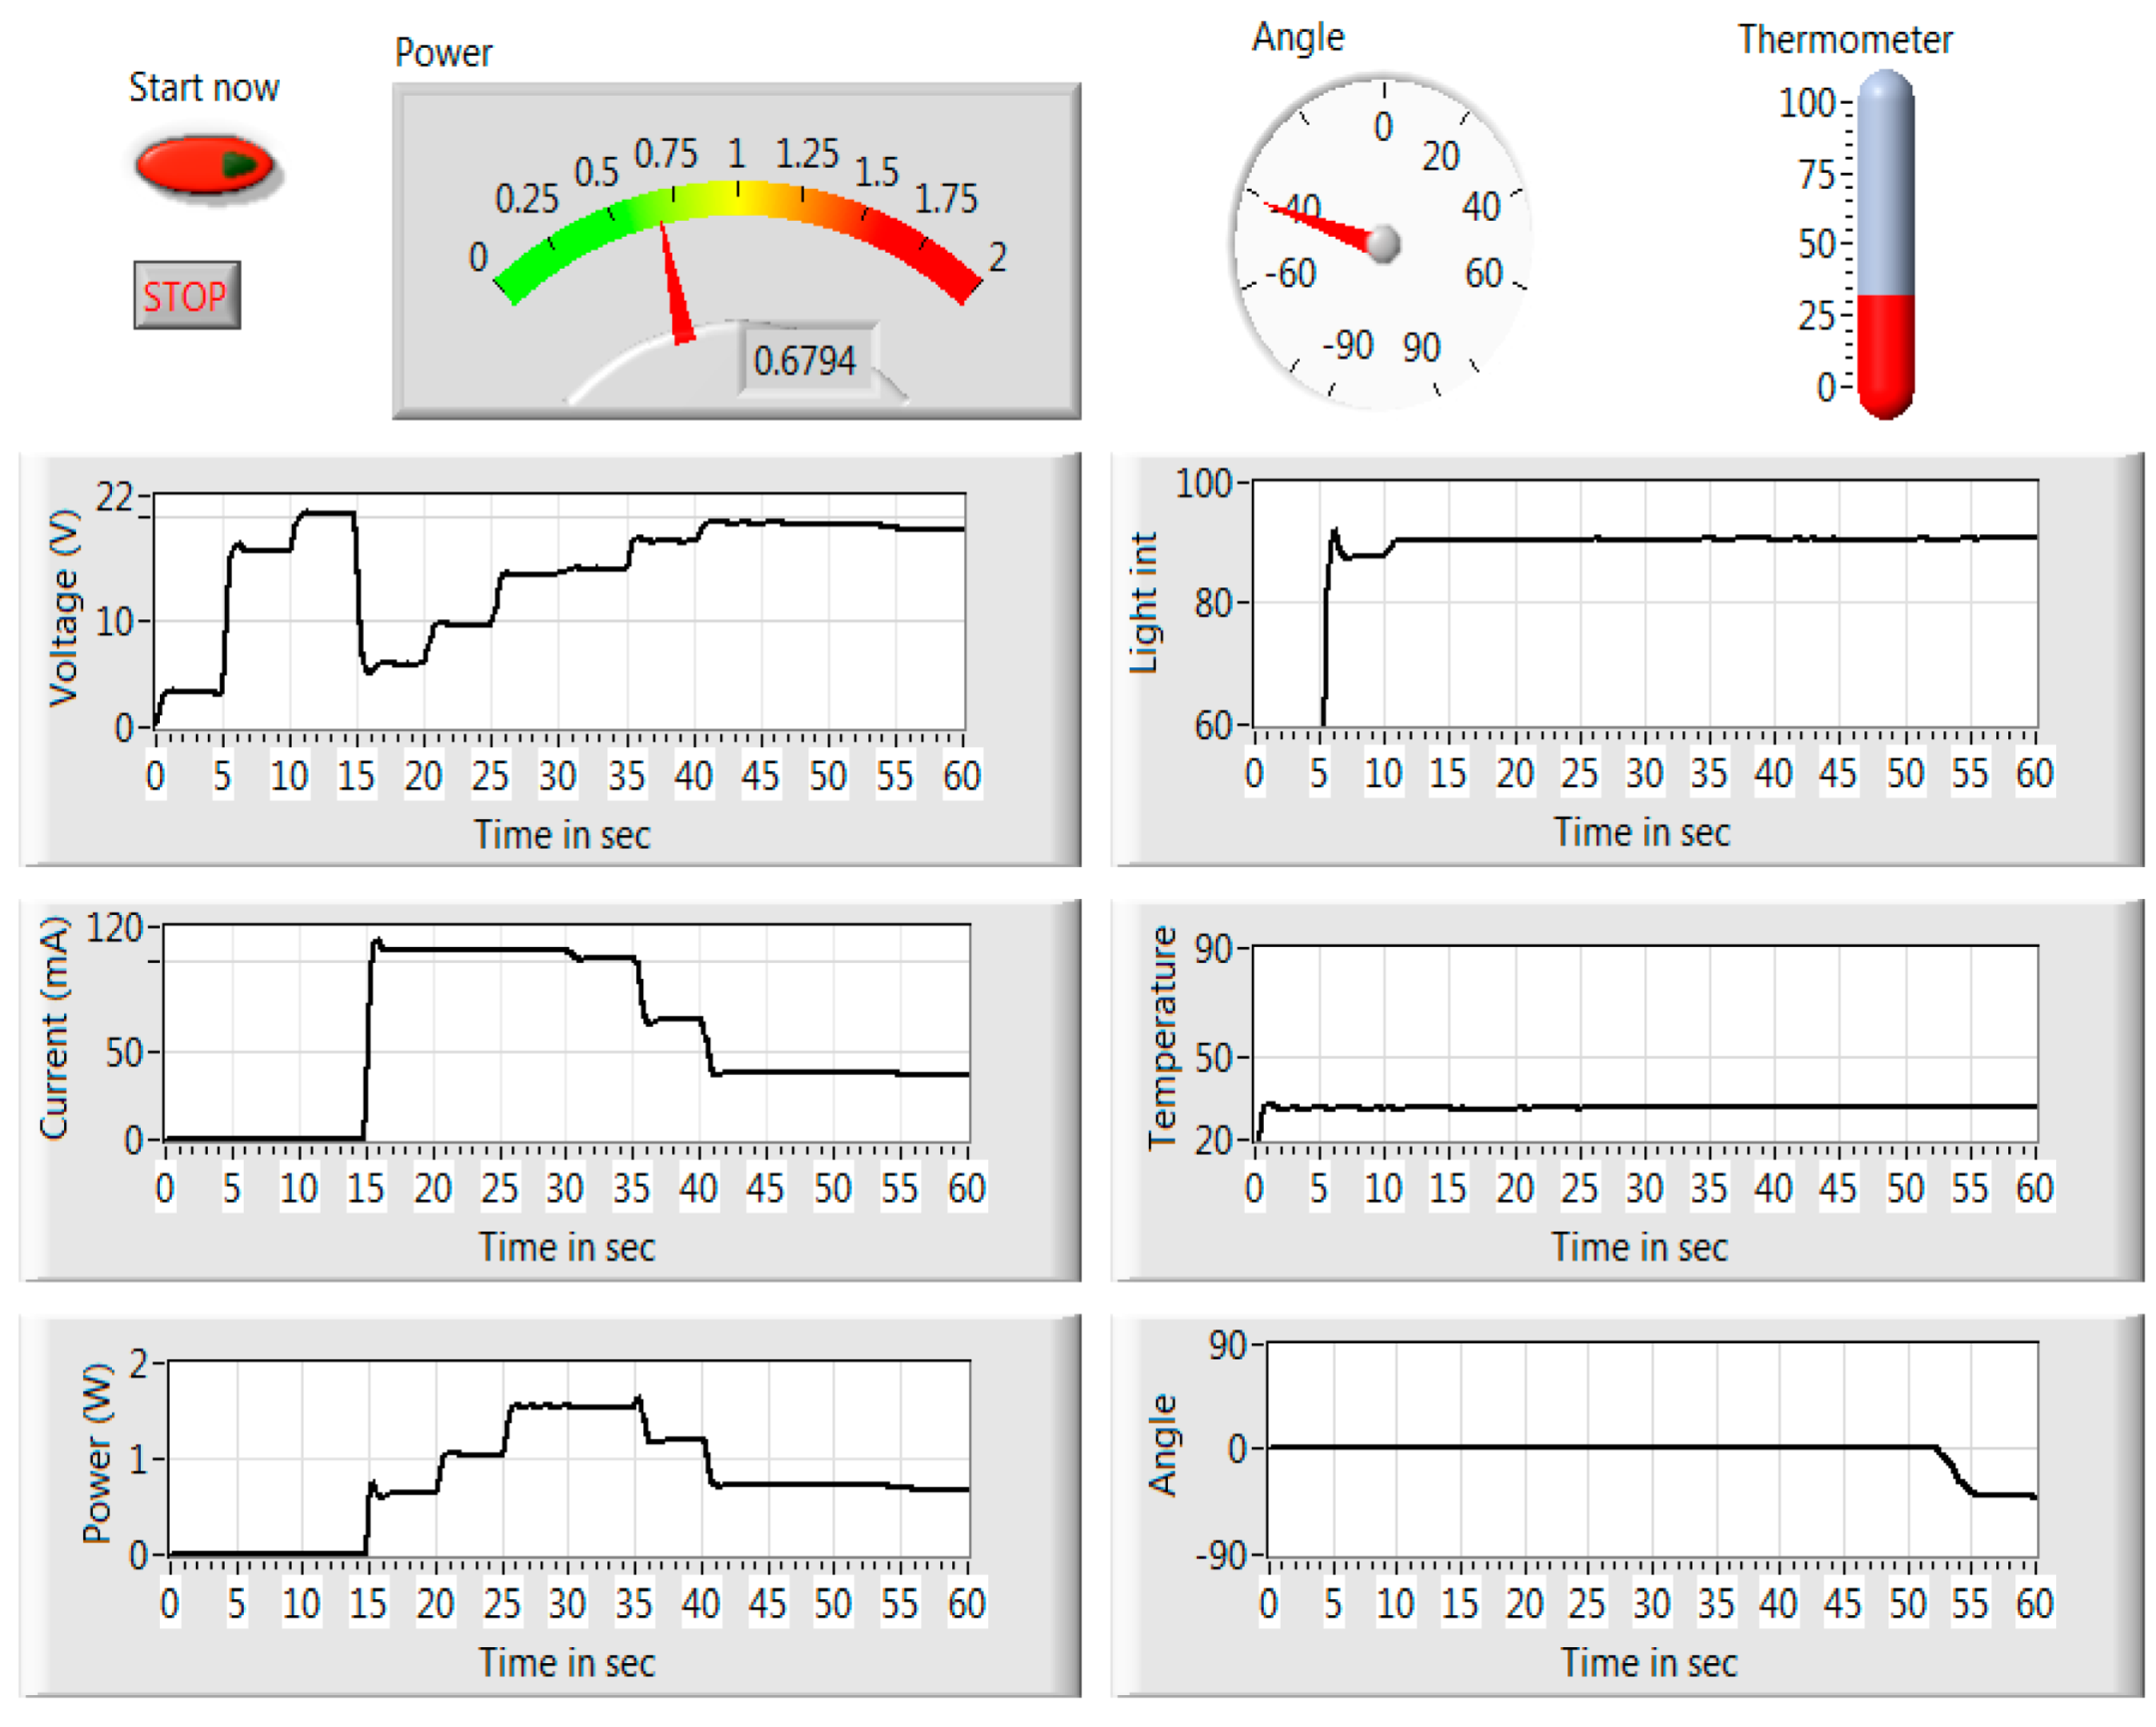
4. Practical Experiments and Their Associated Visual Results

This section presents some of the practical experiments that were carried out in a laboratory using the innovative jig. It must be stated that the use of this computer-based learning activity, or educational technology, facilitates consistent delivery, proof of completion and increased retention of information [21]. It exposes each student to the same practical experiment and affords each one the opportunity to provide a practical report of the results, which helps to prove that the student has completed the practical experiment successfully [22]. Other advantages to the student include self-pacing, interactivity, and data storage via USB flash disk for future reference. Furthermore, using electronic equipment within the teaching and learning environment supports the development of high-level thinking in the following two ways [23]:
  • It provides students with opportunities to develop their problem-solving skills and
  • It may serve as a tool for thinking and problem solving.

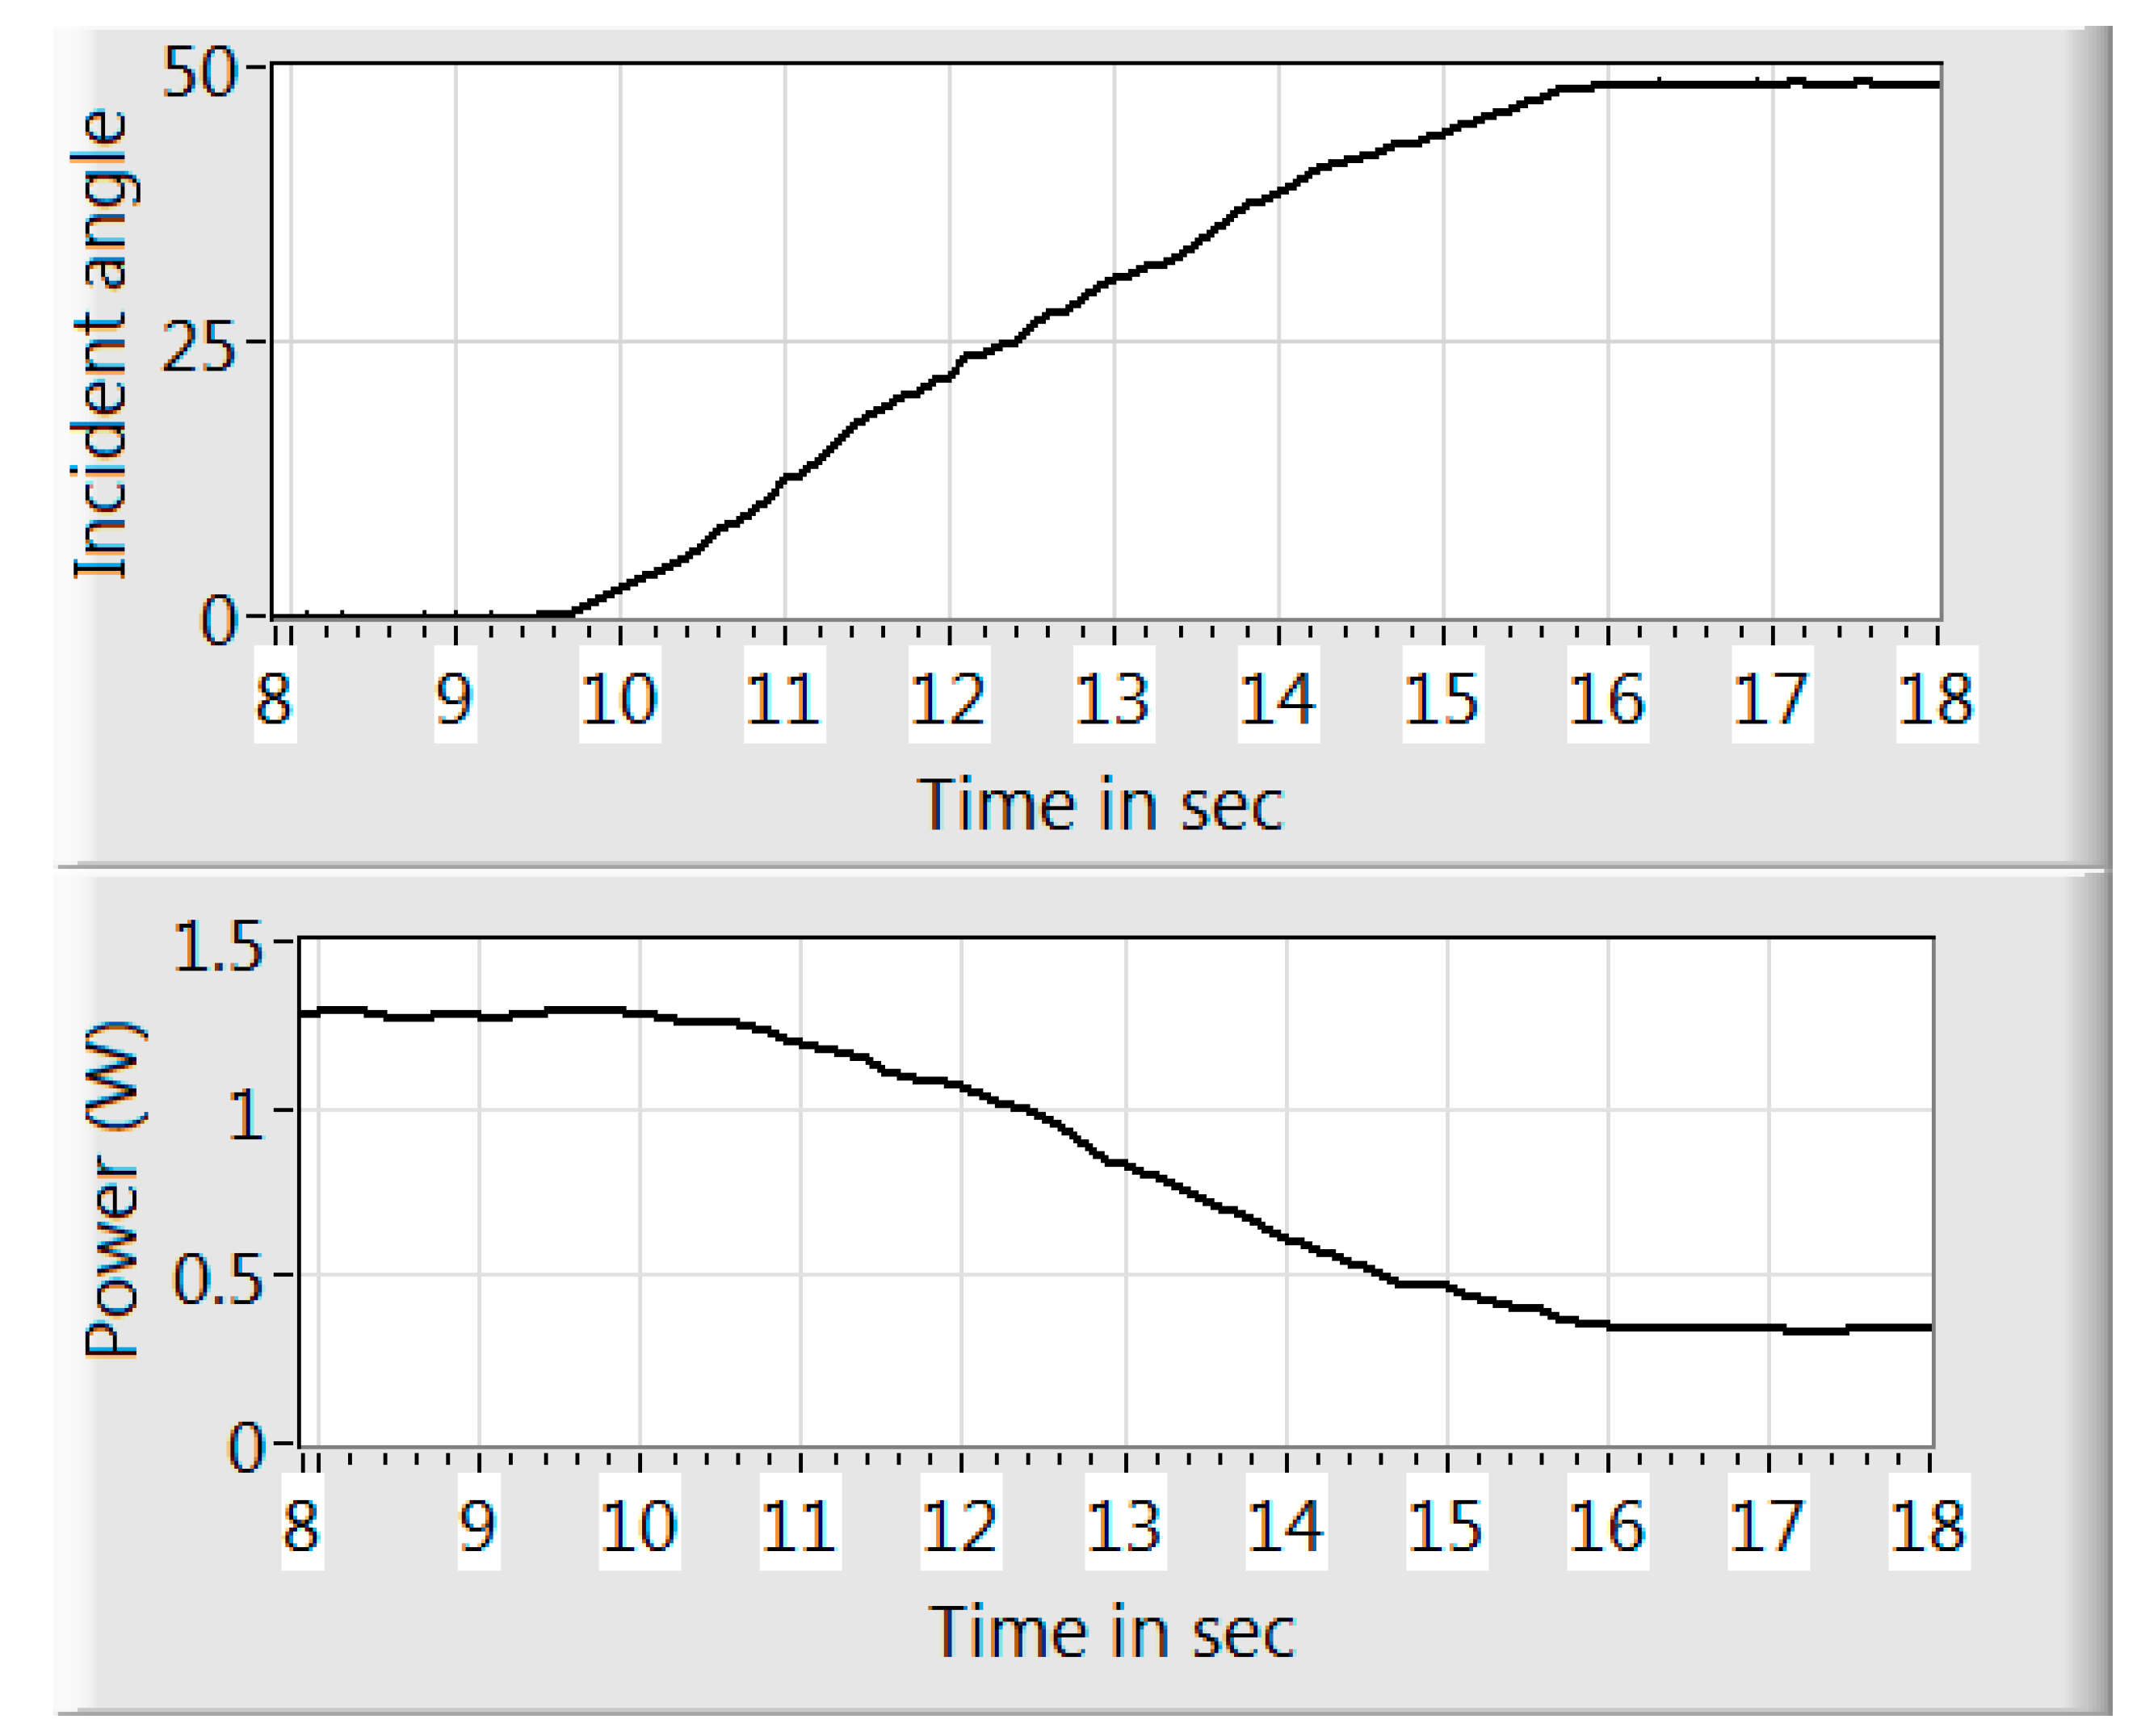
4.1. Incident Angle of Illumination

The incident angle of illumination influences the amount of energy collected by a PV module [10]. The incident angle experiment may be done with the artificial light sources for demonstration purposes. However, more accurate practical results are obtained when the sun is used as a light source for the system. Figure 5 illustrates the influence that various incident angles of illumination exert on the output power of a PV module, where an incident angle of 0° results in maximum output power. However, when the surface of the PV module is turned away from the light source to a 49° incident angle, an associated drop in output power is observed. This configuration is very effective in demonstrating this important fundamental principle. However, the short distance between the artificial light and the PV module, as well as the uneven distribution of light, may affect the accuracy of the quantitative results.
A more accurate way of completing this experiment is to use the sun as a light source. In order to do this, the artificial light is removed and the jig is used in direct sun light. An example of the experiment that was done in direct sunlight is given in Figure 6. The experiment was done in Bloemfontein in South Africa and thus in the southern hemisphere. Literature indicates that PV modules should be installed at a tilt angle that is equal to latitude or at latitude −10° for summer months, or at latitude +10° for winter months (Table 3 highlights the exact tilt angles for Bloemfontein). The experiment was done in winter on the 26 May 2015 at 12H30 in the afternoon. It is, therefore, expected that latitude +10° will yield a higher output power than a tilt angle that is set to a lower value. It must be kept in mind that the specific instantaneous output power of a PV module is not only dependent on the tilt angle, but also on various other factors, such as solar irradiation, size and type of module, temperature, and also the associated load [24,25].
Figure 5. Influence of the incident angle of illumination on the output power of the PV module as seen on the LabVIEW interface.
Sustainability 07 09100 g005
Figure 6. Results from tilt the angle experiment for the 26 May 2015 at 12:30 p.m.
Sustainability 07 09100 g006
Figure 6 indicates that the output power (left hand side of the sketch) increases as the tilt angle increases (right hand side of the sketch). However, the output power does not increase significantly beyond a tilt angle of 40°, thereby indicating the optimum tilt angle for this PV module. As expected the output power is higher at a tilt angle equal to latitude +10° for this winter day in Bloemfontein. As the seasons change, students will be able to correlate the output power of the PV module to that of the tilt angle, thereby confirming published literature in this regard. This in turn contributes to the principles of constructivism, as students construct their own meaning about PV module operation from what they visually see and experience.
Table 3. Three different tilt angles based on research done by Heywood [26] and Chinnery [27,28].
AuthorLatitudeTilt angle for BloemfonteinTime Period Used
Heywoodφ − 10°29° − 10° = 19°Summer
Heywoodφ29°Autumn/Spring
Chinneryφ + 10°29° + 10° = 39°Winter

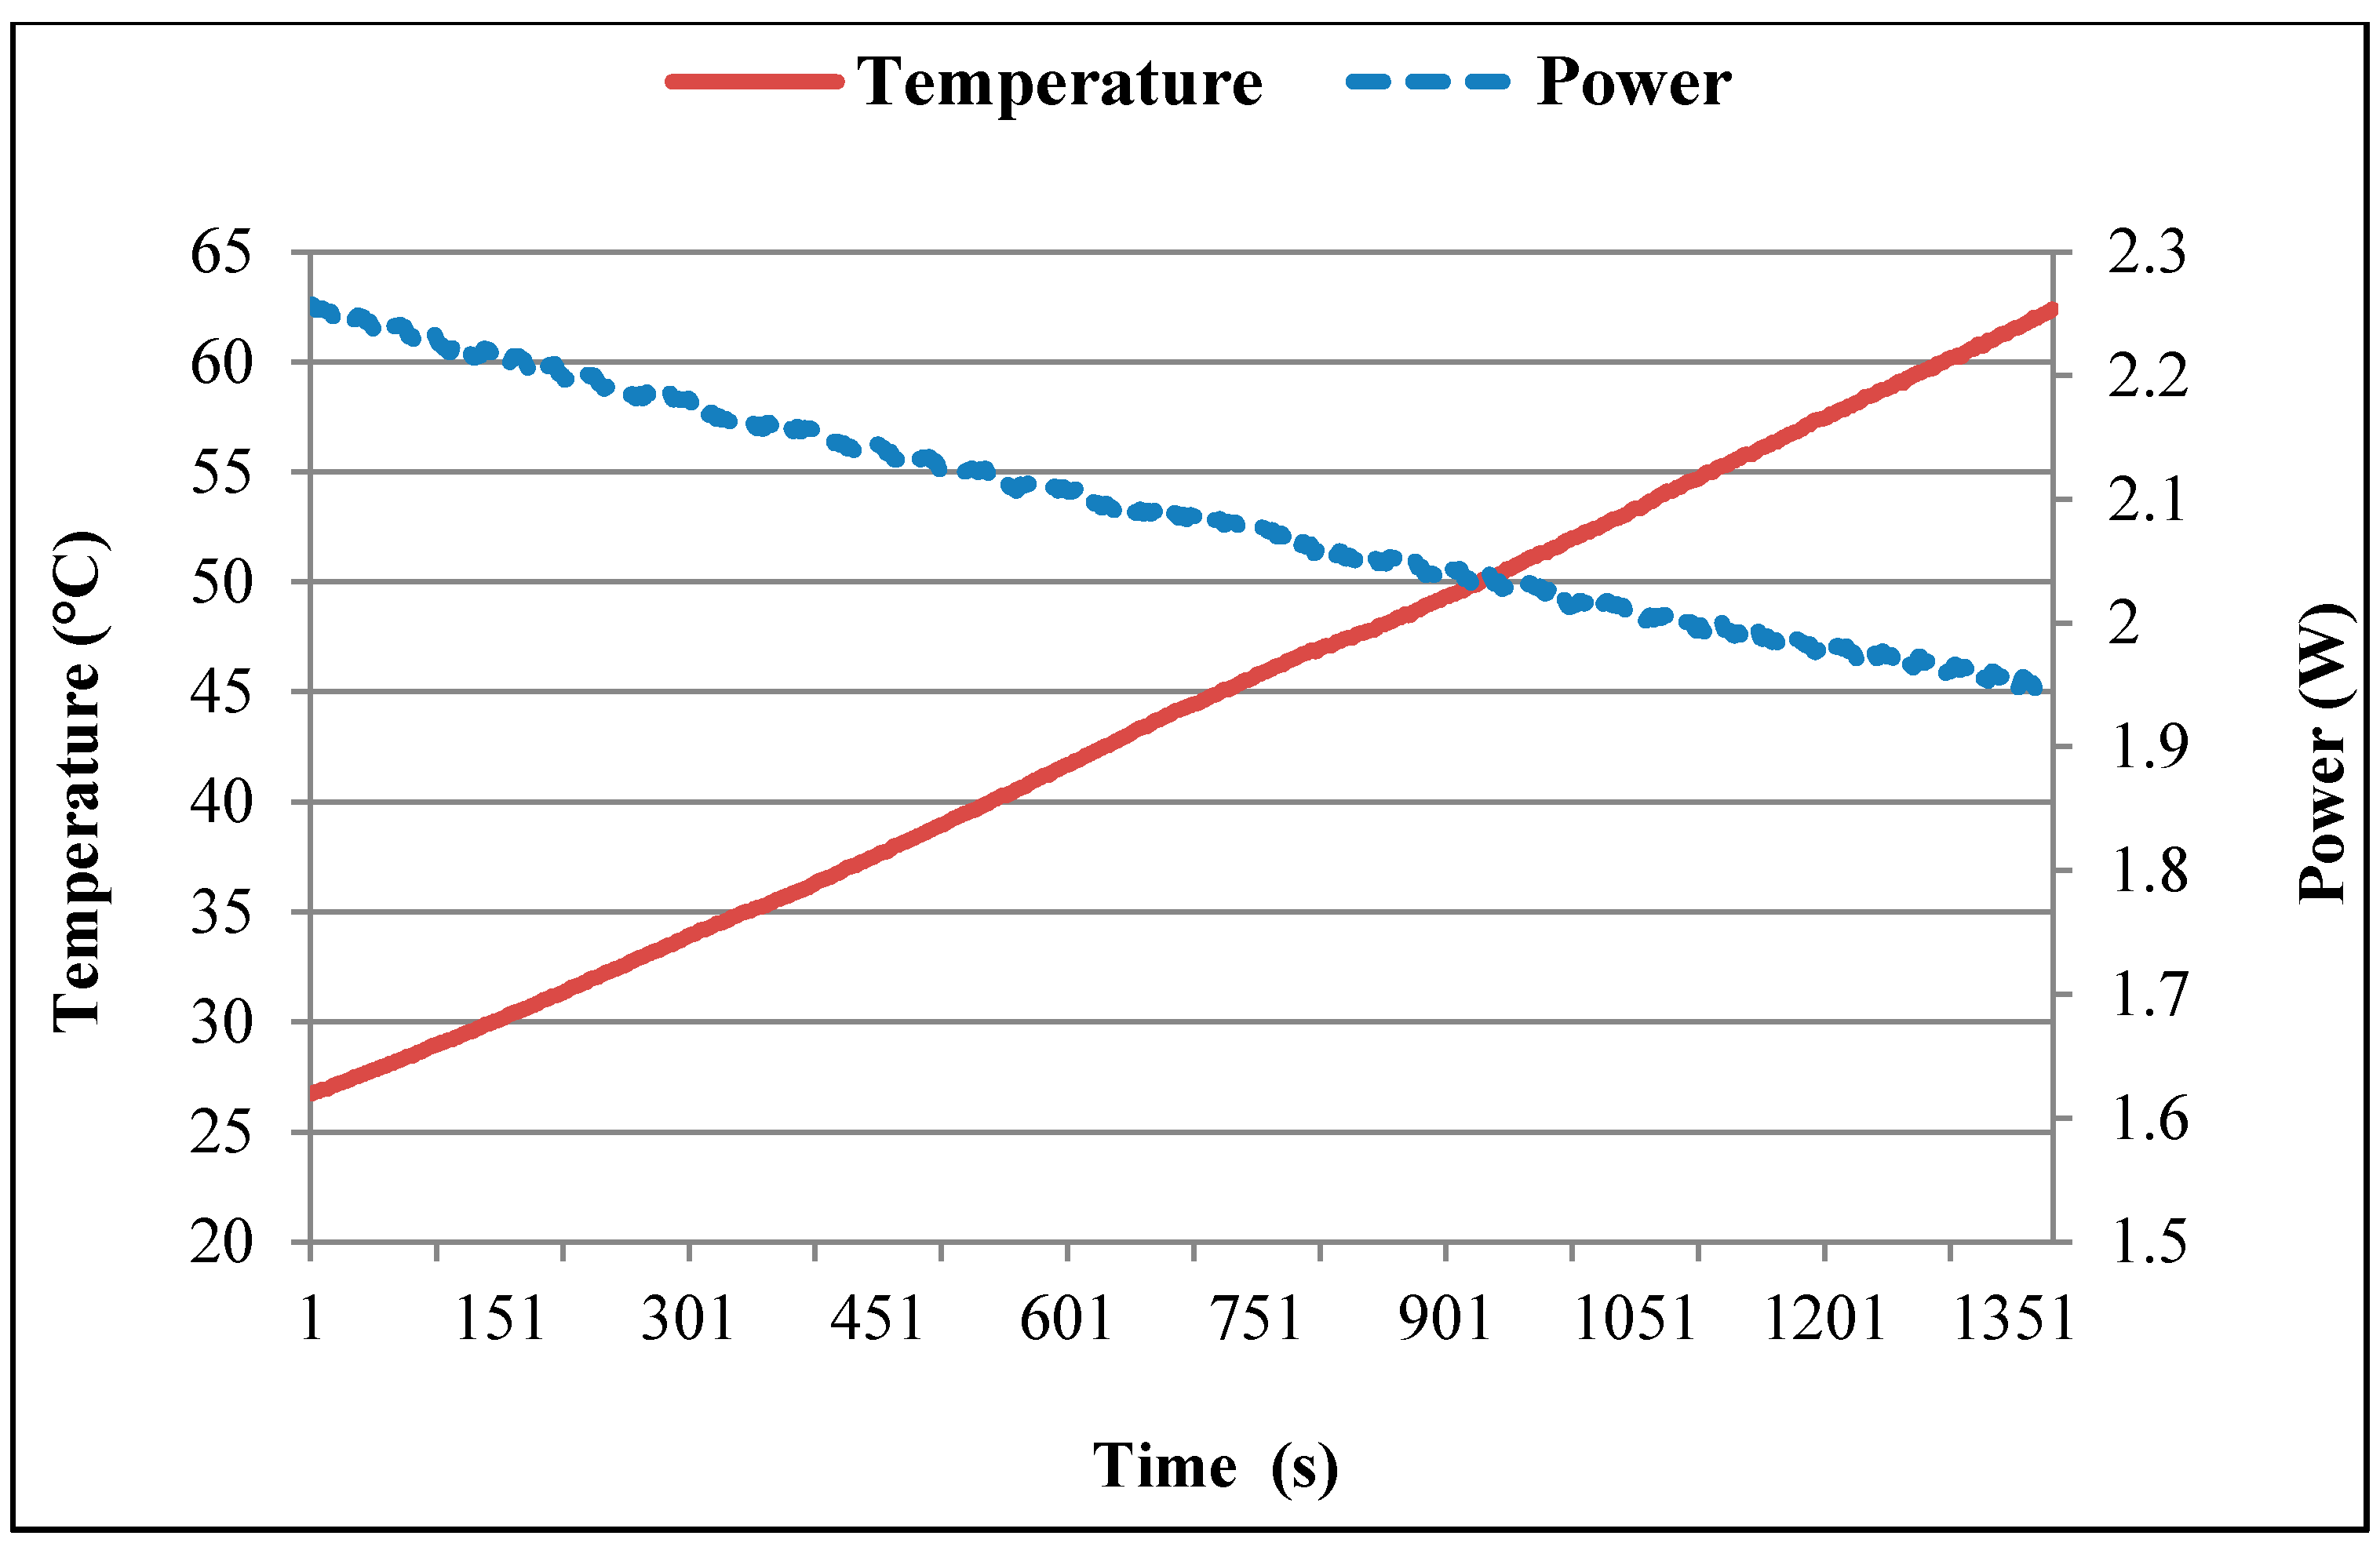
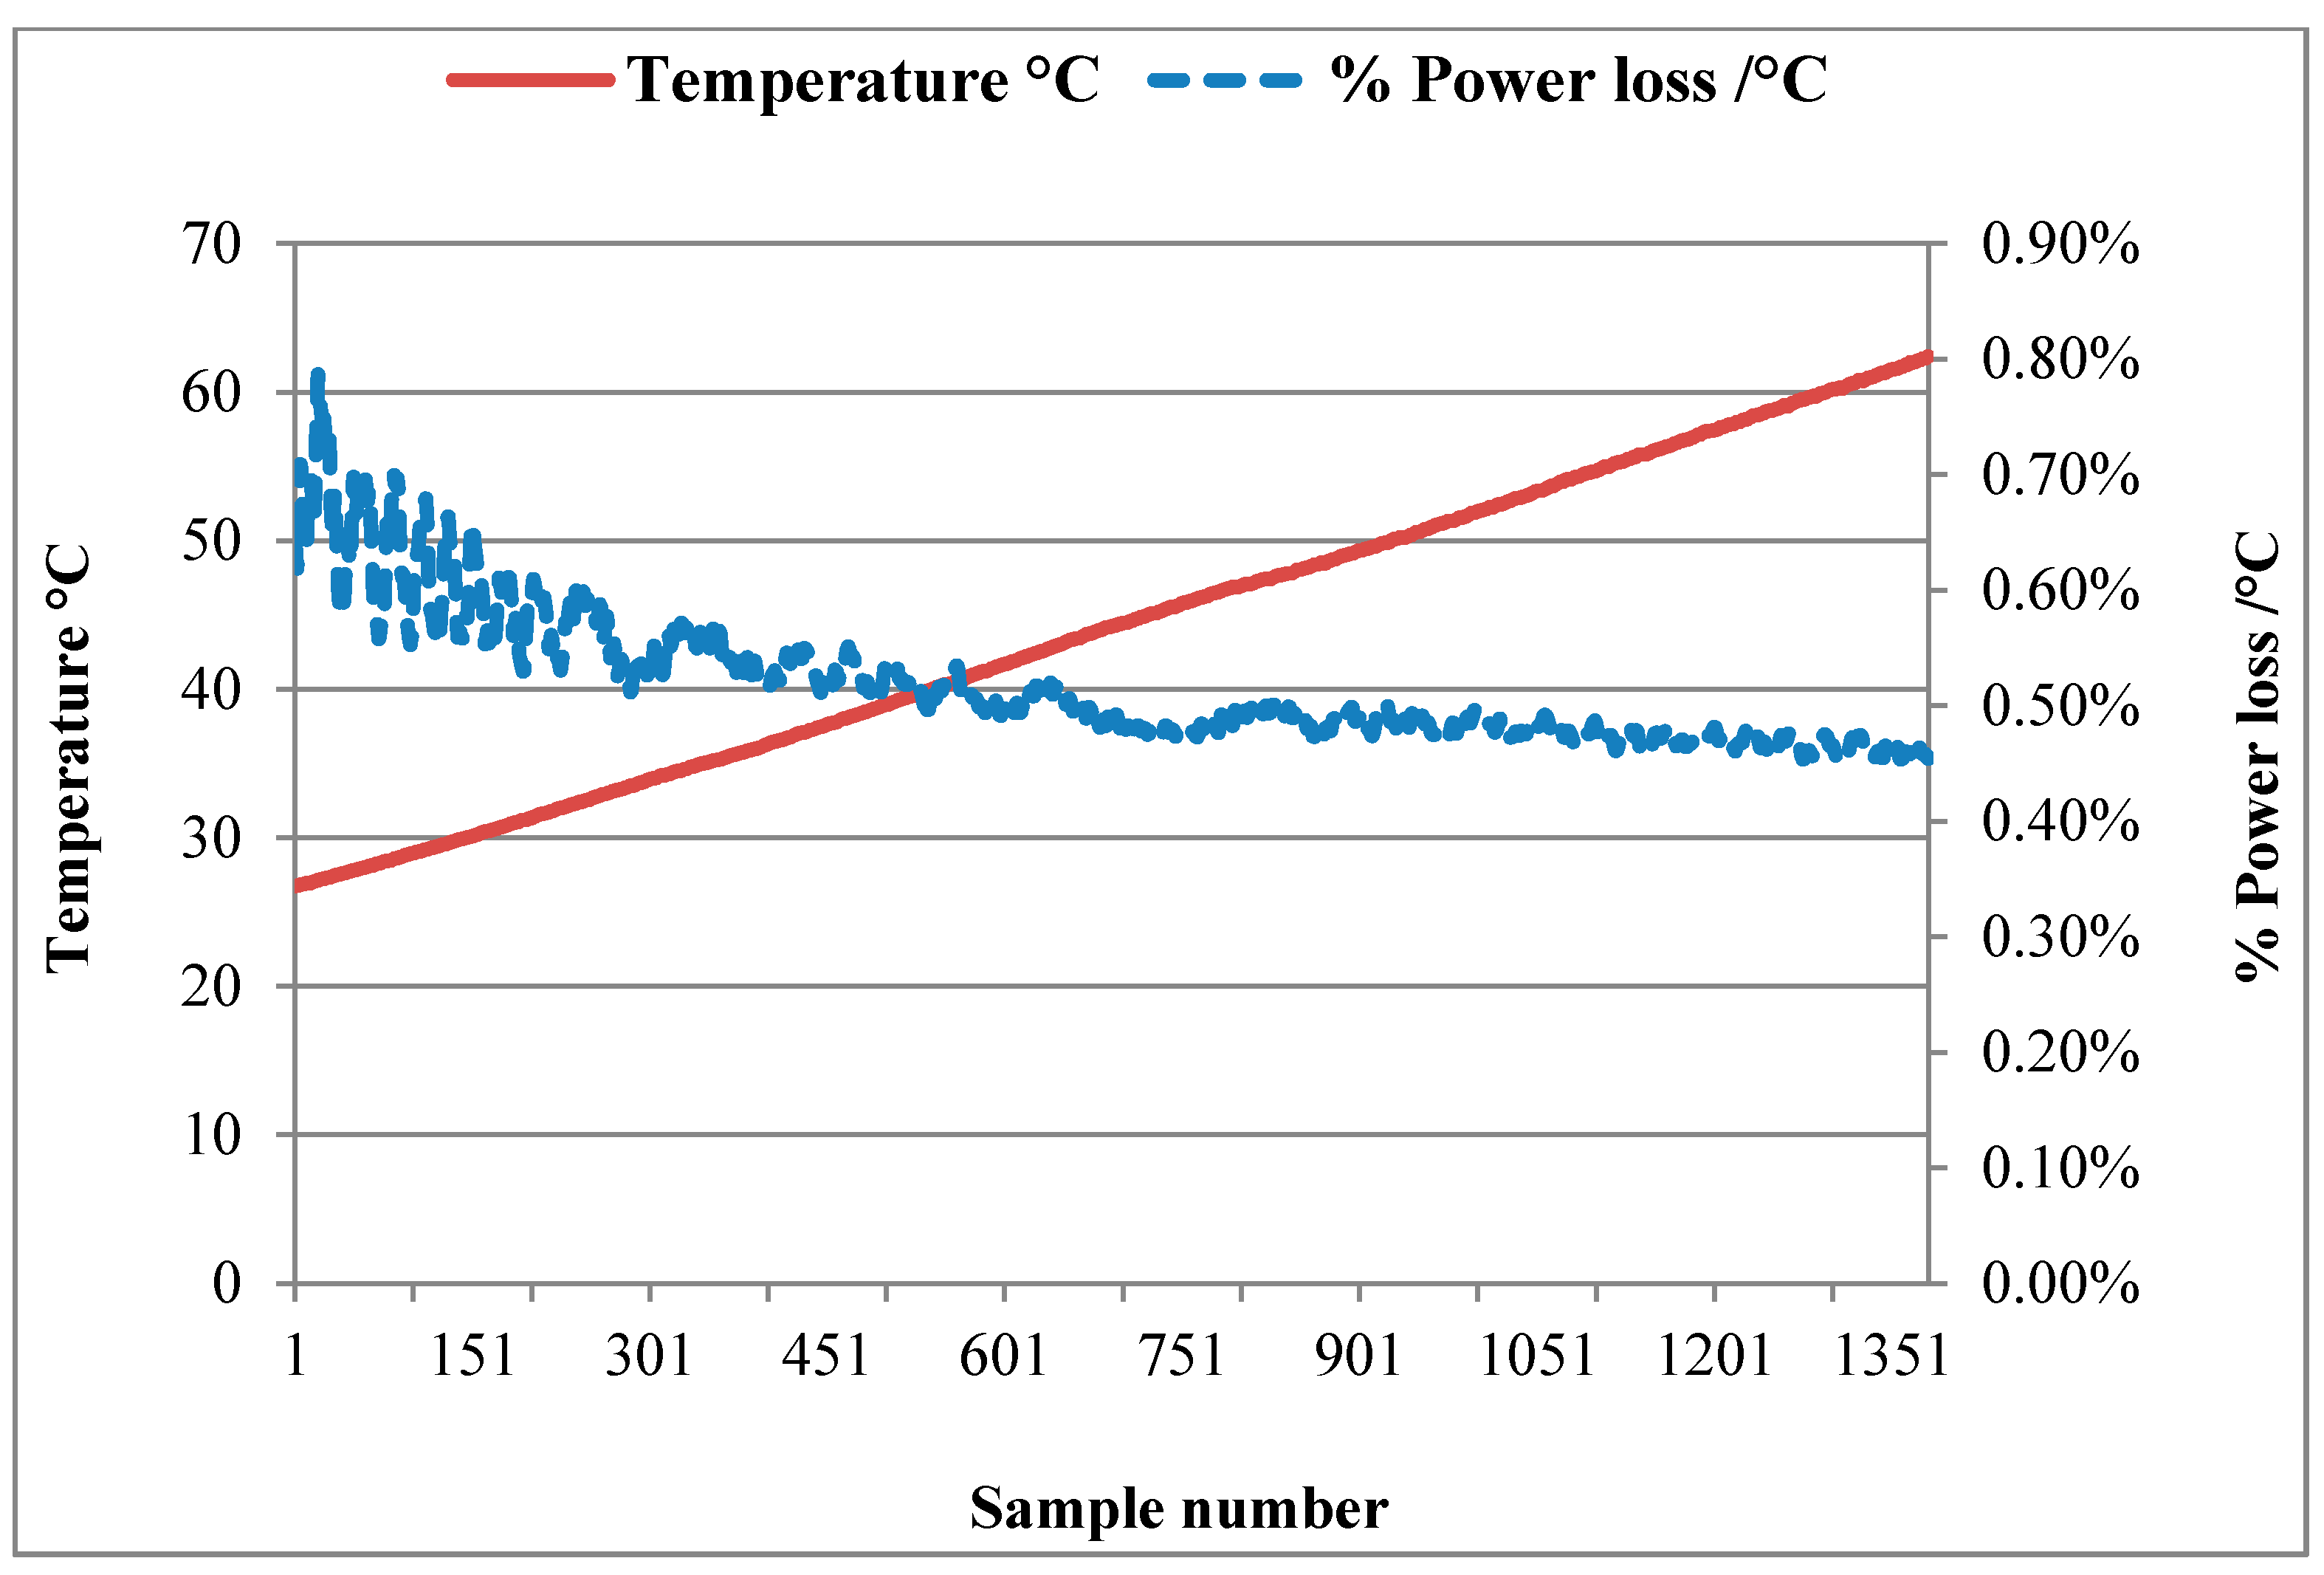
4.2. Temperature of the Module
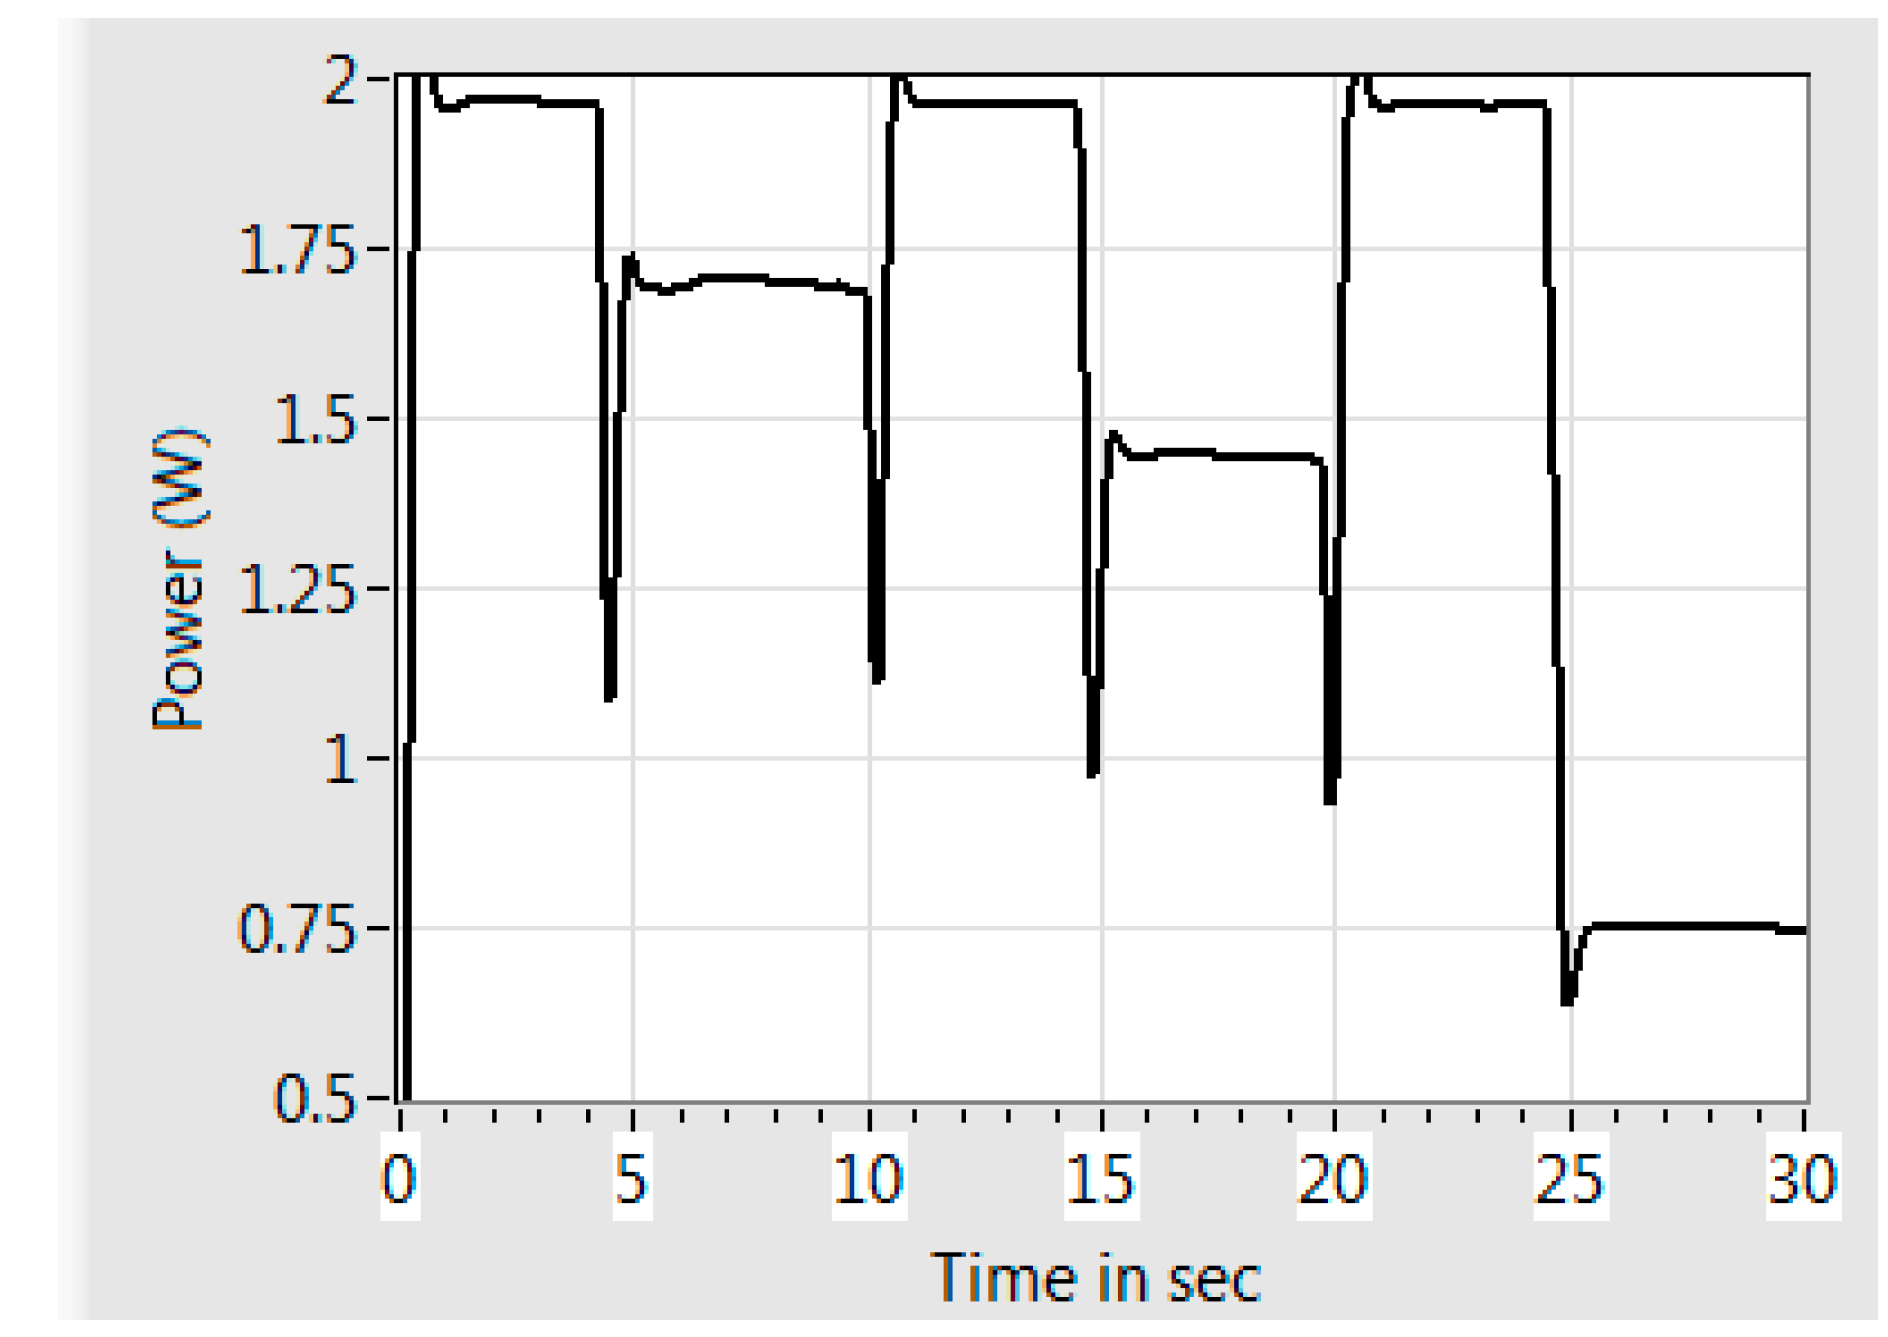
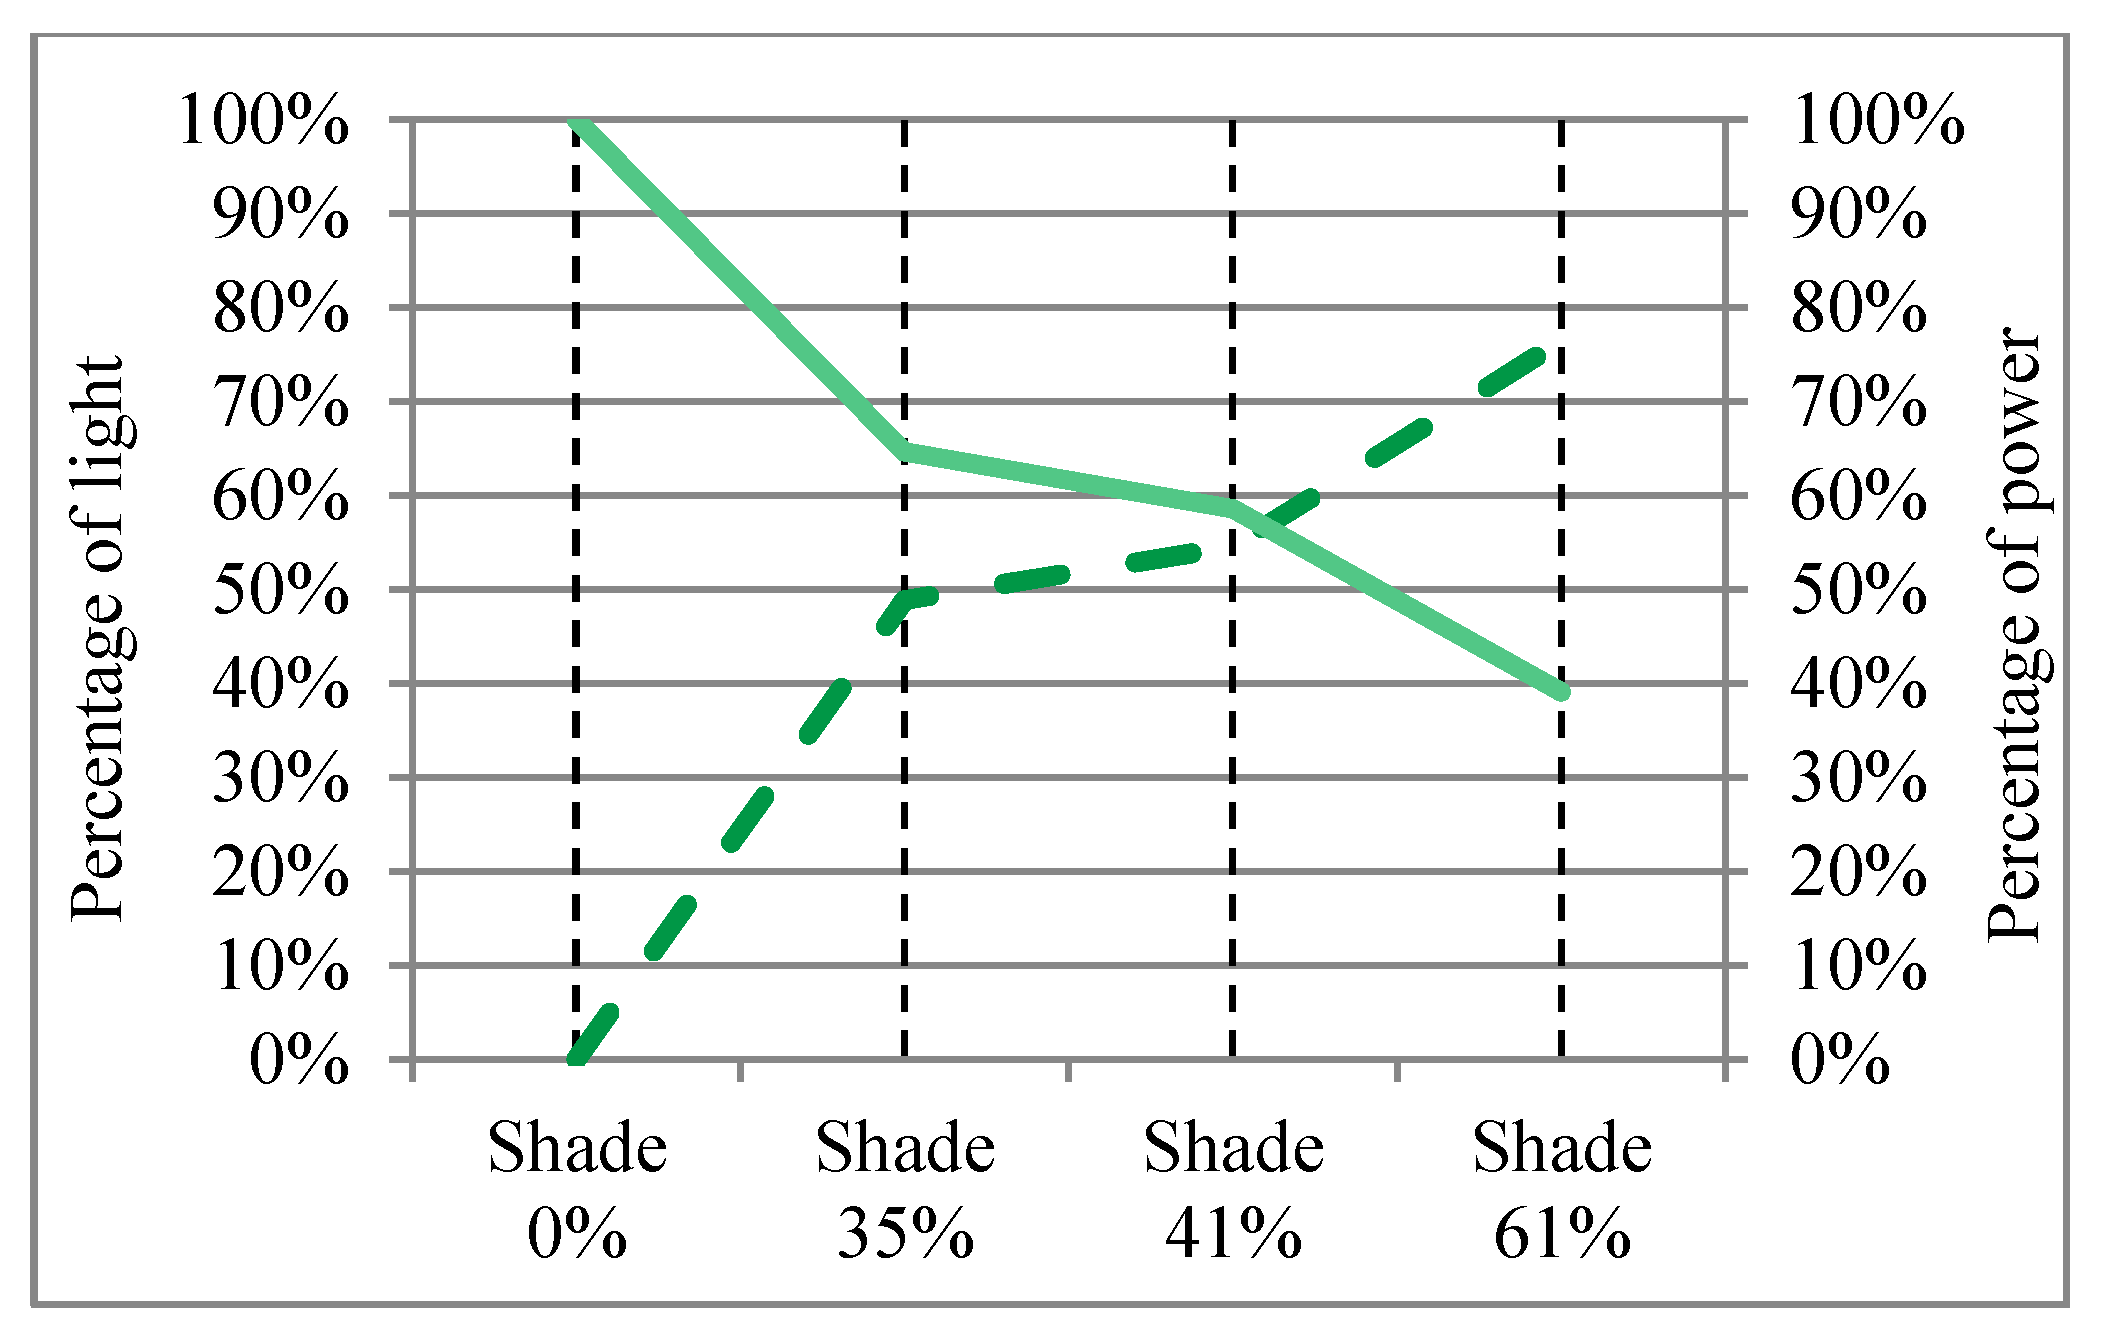
A rise in surface temperature of a PV module negatively affects its output power [11,29]. Figure 7 illustrates this negative influence, where the output power of the PV module decreases as the module’s surface temperature increases due to the heat that is generated by the close proximity of the two 500 W halogen lights. Please note that it takes a few seconds for the system to stabilize before results can be interpreted. The temperature sensor that was used is a thermistor that was mounted on the back of the PV module.
Figure 7. Negative influence of surface temperature rise on the output power of the PV module.
Sustainability 07 09100 g007
The module that was used in the experimental setup is a 10 W polycrystalline silicon module. Literature suggests a power loss of 0.19% to 0.56% per °C for temperatures above 25 °C [30]. This is in line with the results obtained from the experimental data where an average power loss of 0.54% per °C for temperatures above 25 °C was obtained. Figure 8 indicates the percentage power loss/°C above 25 °C that was derived from using the innovative jig.
Figure 8. Percentage power loss/°C above 25 °C calculated from experimental results.
Sustainability 07 09100 g008

4.3. Shading

The negative impact of shading on the output power of a PV module has been established [13,31]. However, this shading can be classified into two categories, namely soft shading and hard shading. Partial hard shading, as well as full soft shading, can be done using shade nets in conjunction with the innovative jig. Only full soft shading with irradiation from the sun is covered in this article. Figure 9 illustrates how the output power rises from 0 W to a maximum output power of 2 W when the system is placed in full sunlight.
Figure 9. Indication of output power with a 20%, 35% and 60% shade net between the module and the sun.
Sustainability 07 09100 g009
A 20% shade net results in a decrease of output power from 2 to 1.7 W (time period between 5 and 10 s). A 35% shade net results in an output power of 1.4 W (time period between 15 and 20 s). Finally, a 60% shade net results in an output power of 0.75 W (time period between 25 and 30 s), equating to a 62.5% reduction from the maximum output power (being 2 W). The results from the 35% and 60% shade nets may be correlated to previous published research in this regard (see Figure 10 for previous research results). Research reports a 36% reduction in output power for a 35% shade net [31] that correlates well with the 30% found in this experiment. Research further reports a 60% reduction in output power for a 61% shade net [31] that correlates to the 62.5% reduction established with the help of this innovative jig.
Figure 10. Previous research showing power reduction in accordance with full soft shading [32].
Sustainability 07 09100 g010

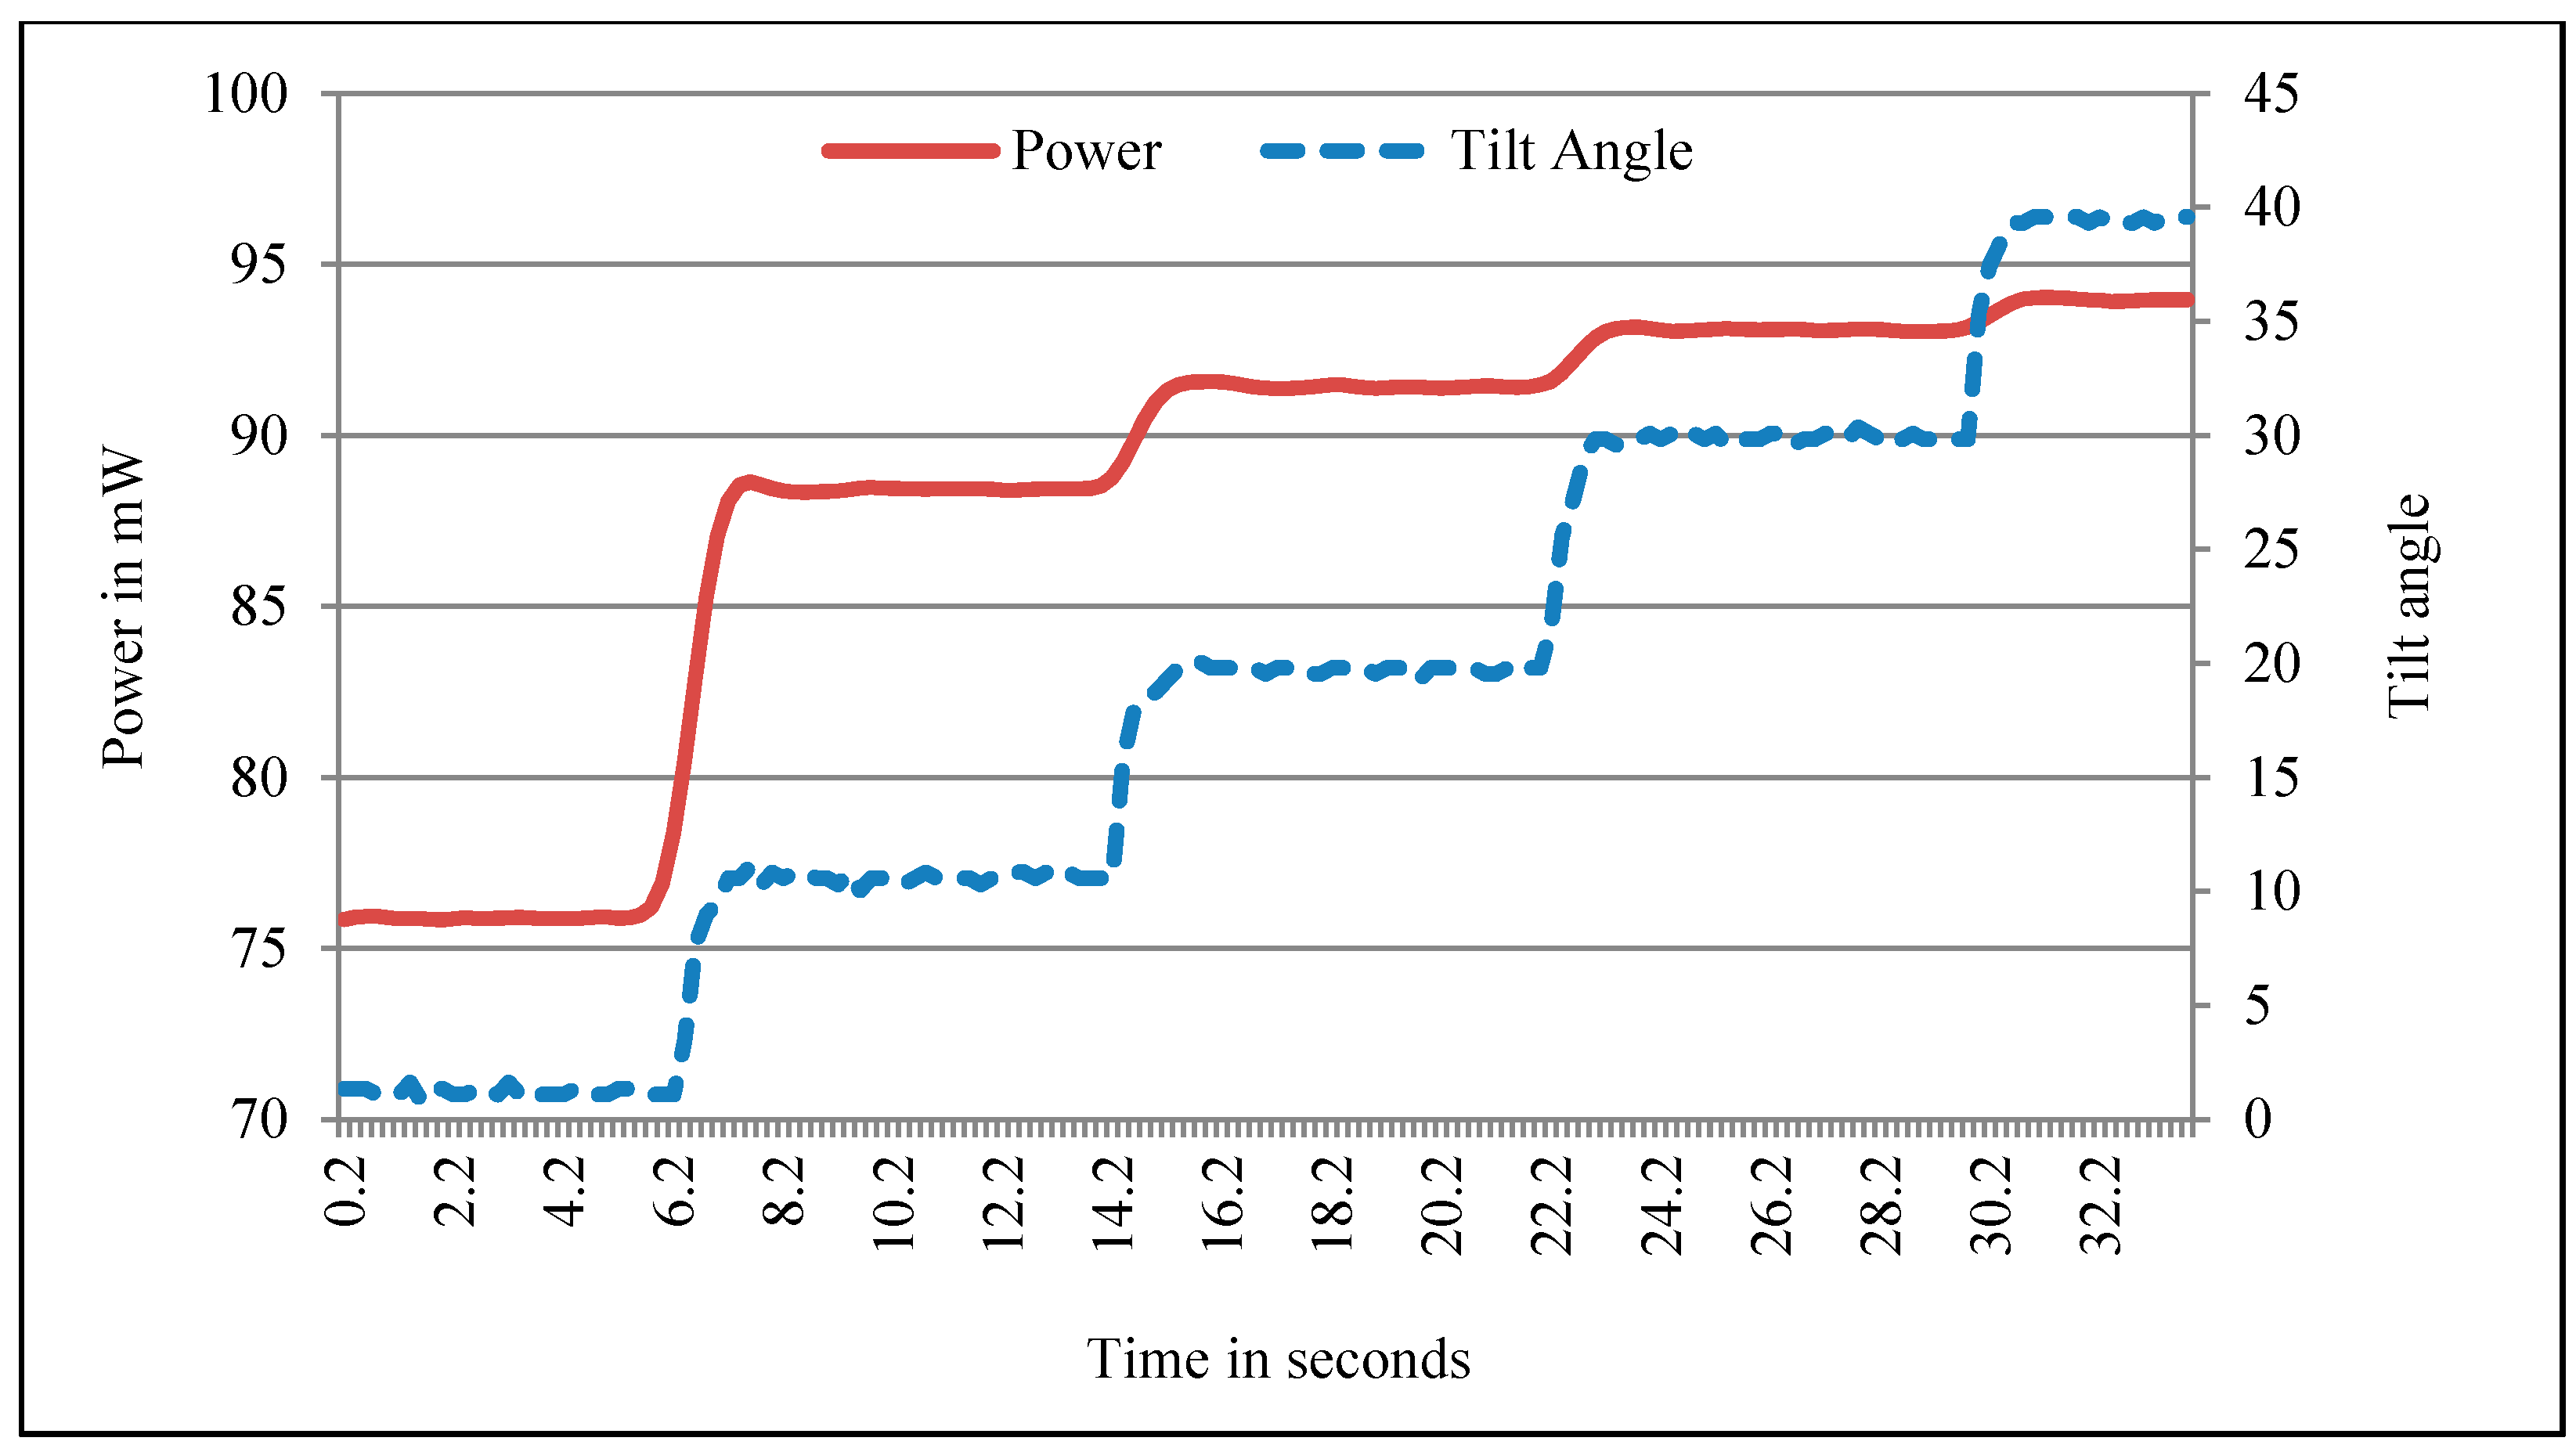
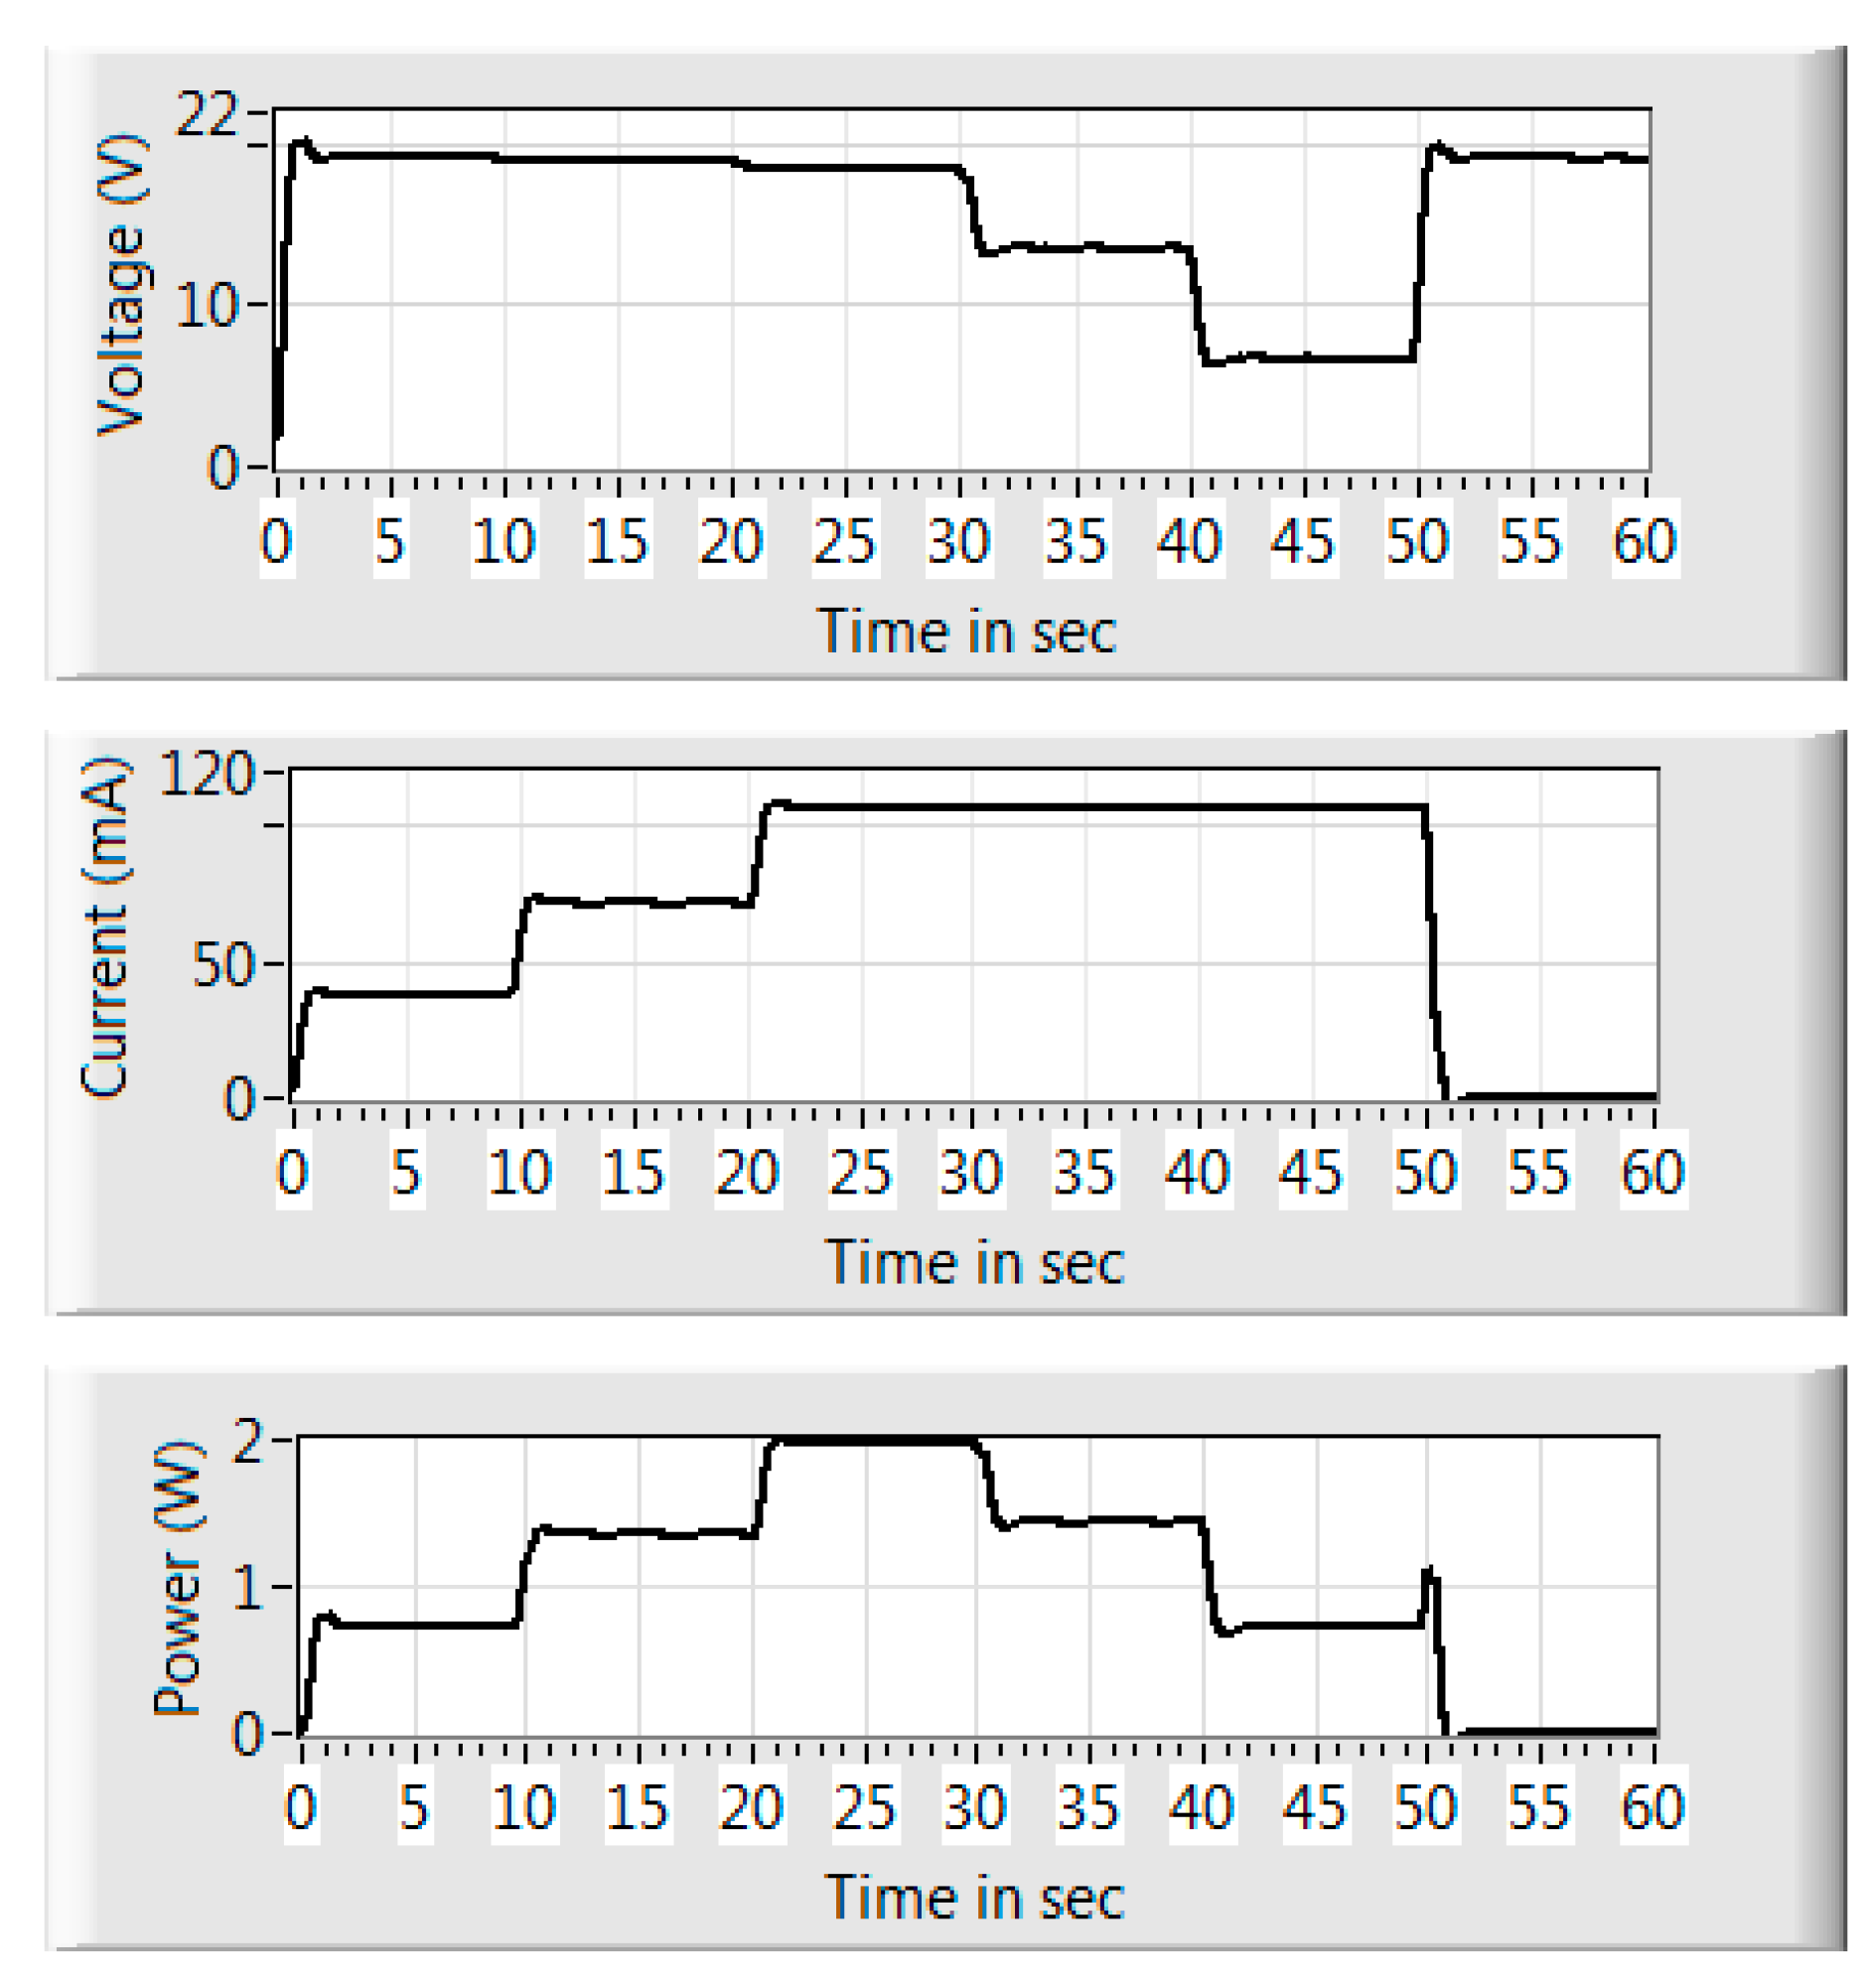
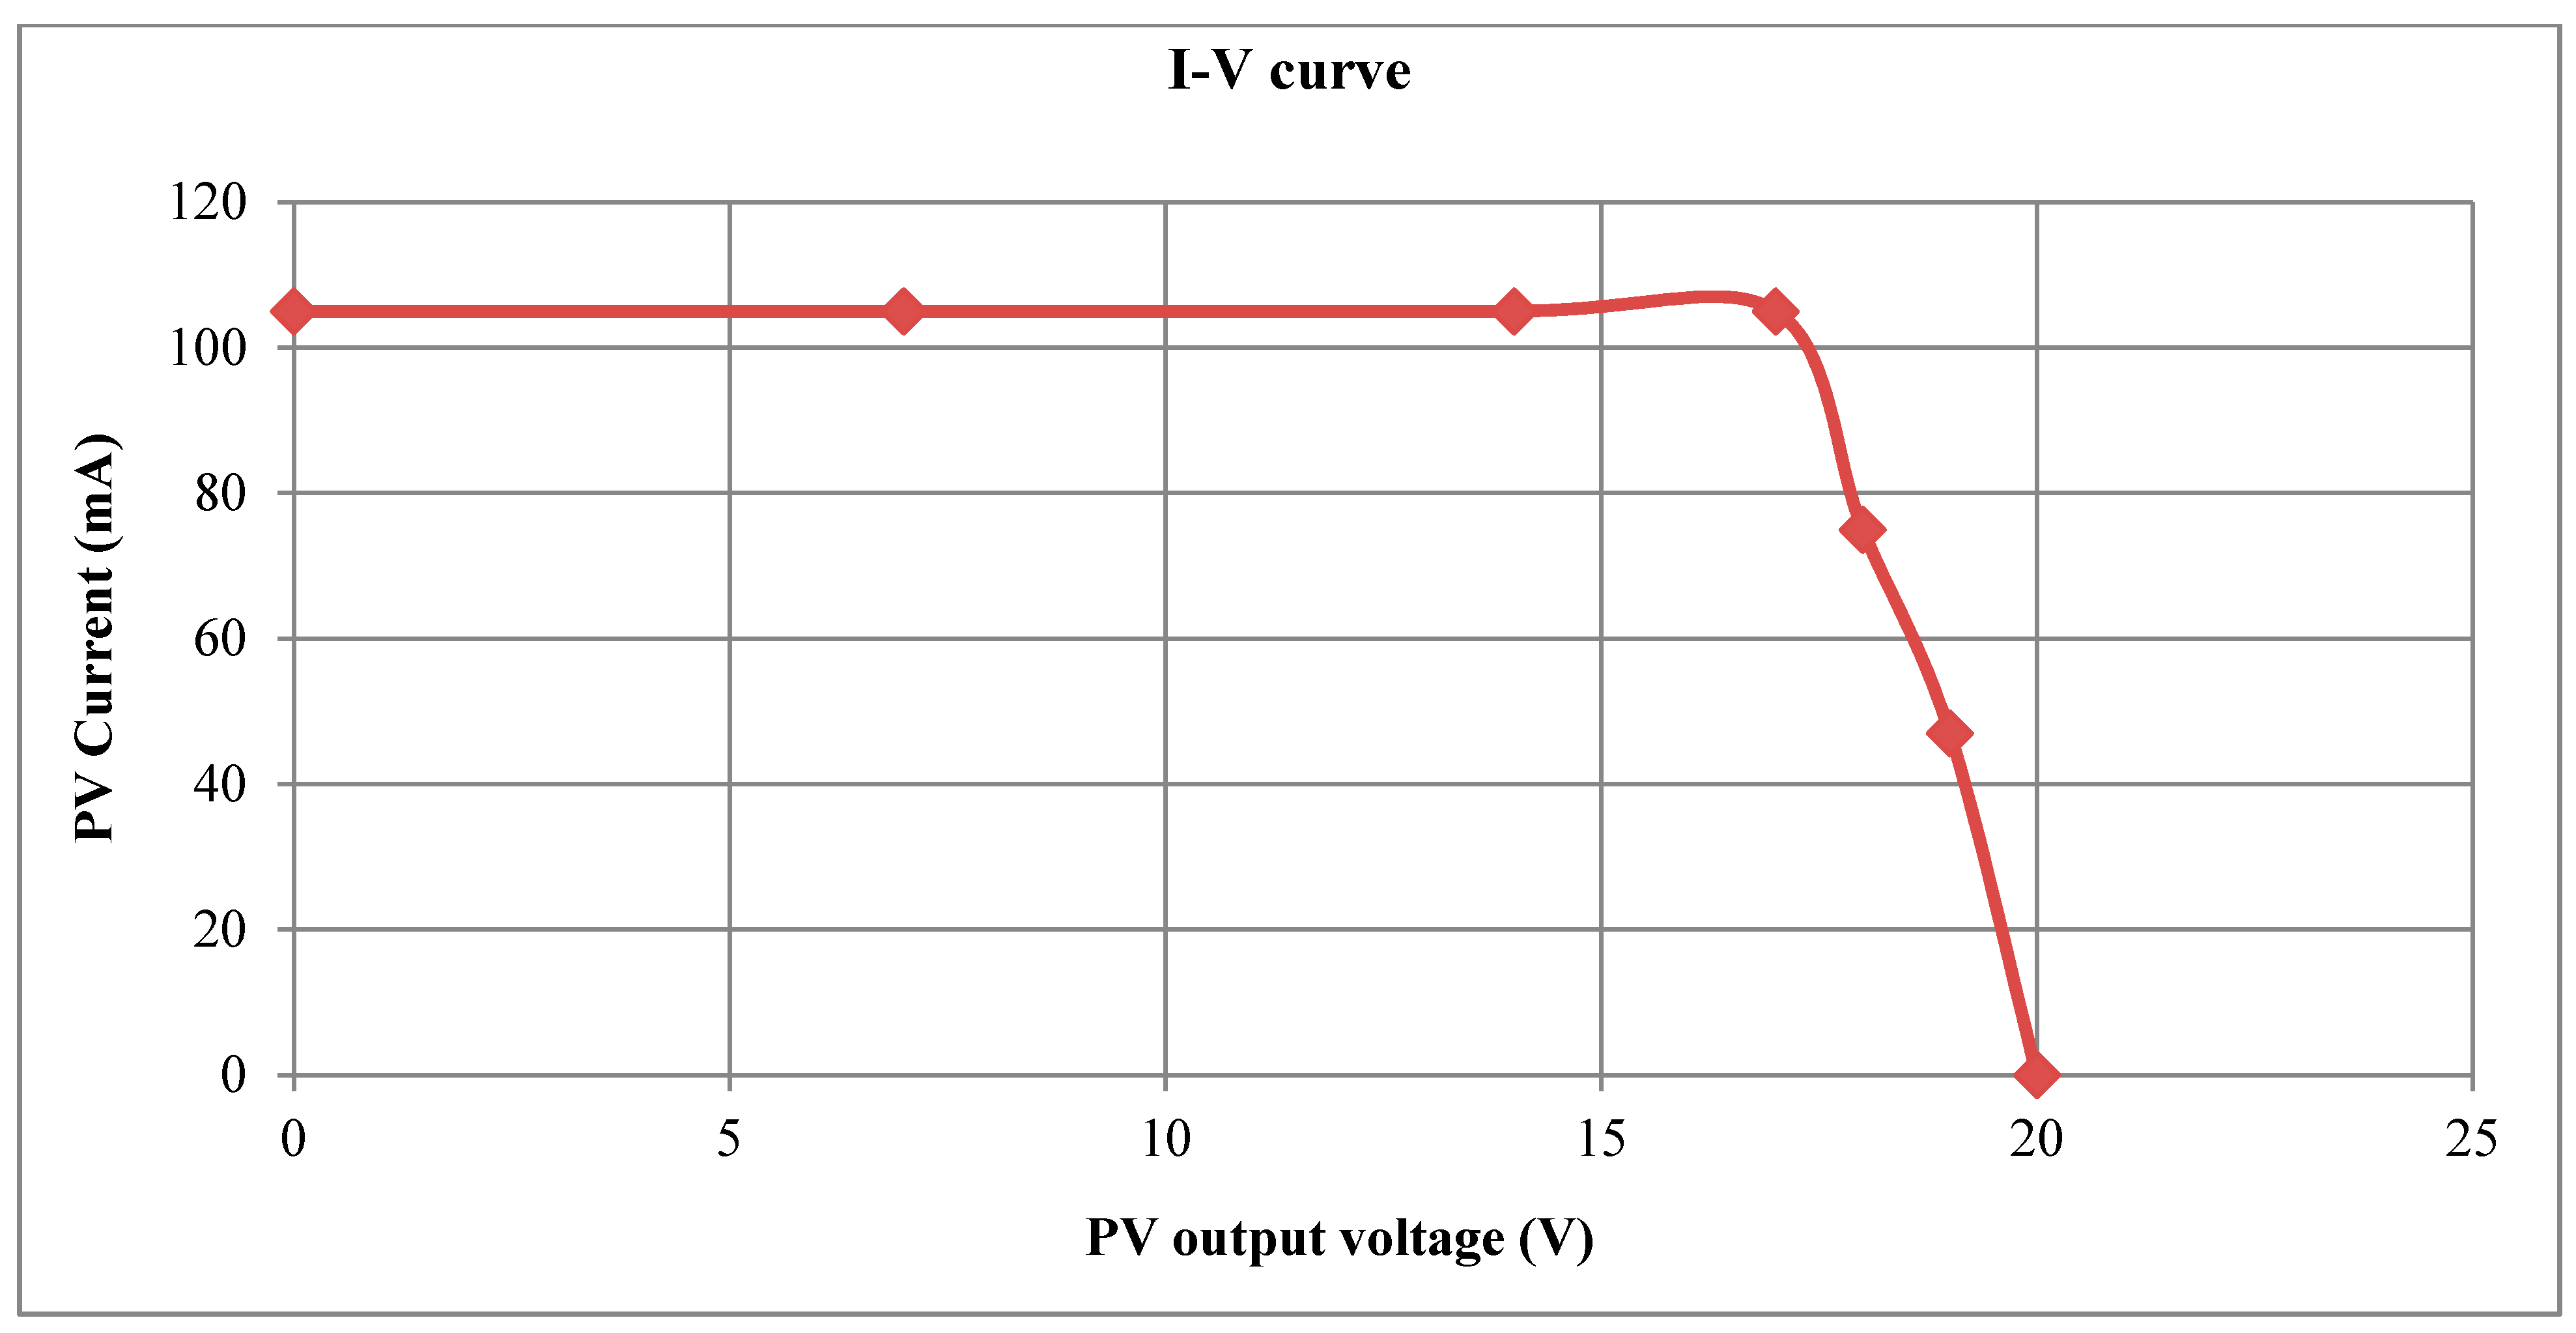
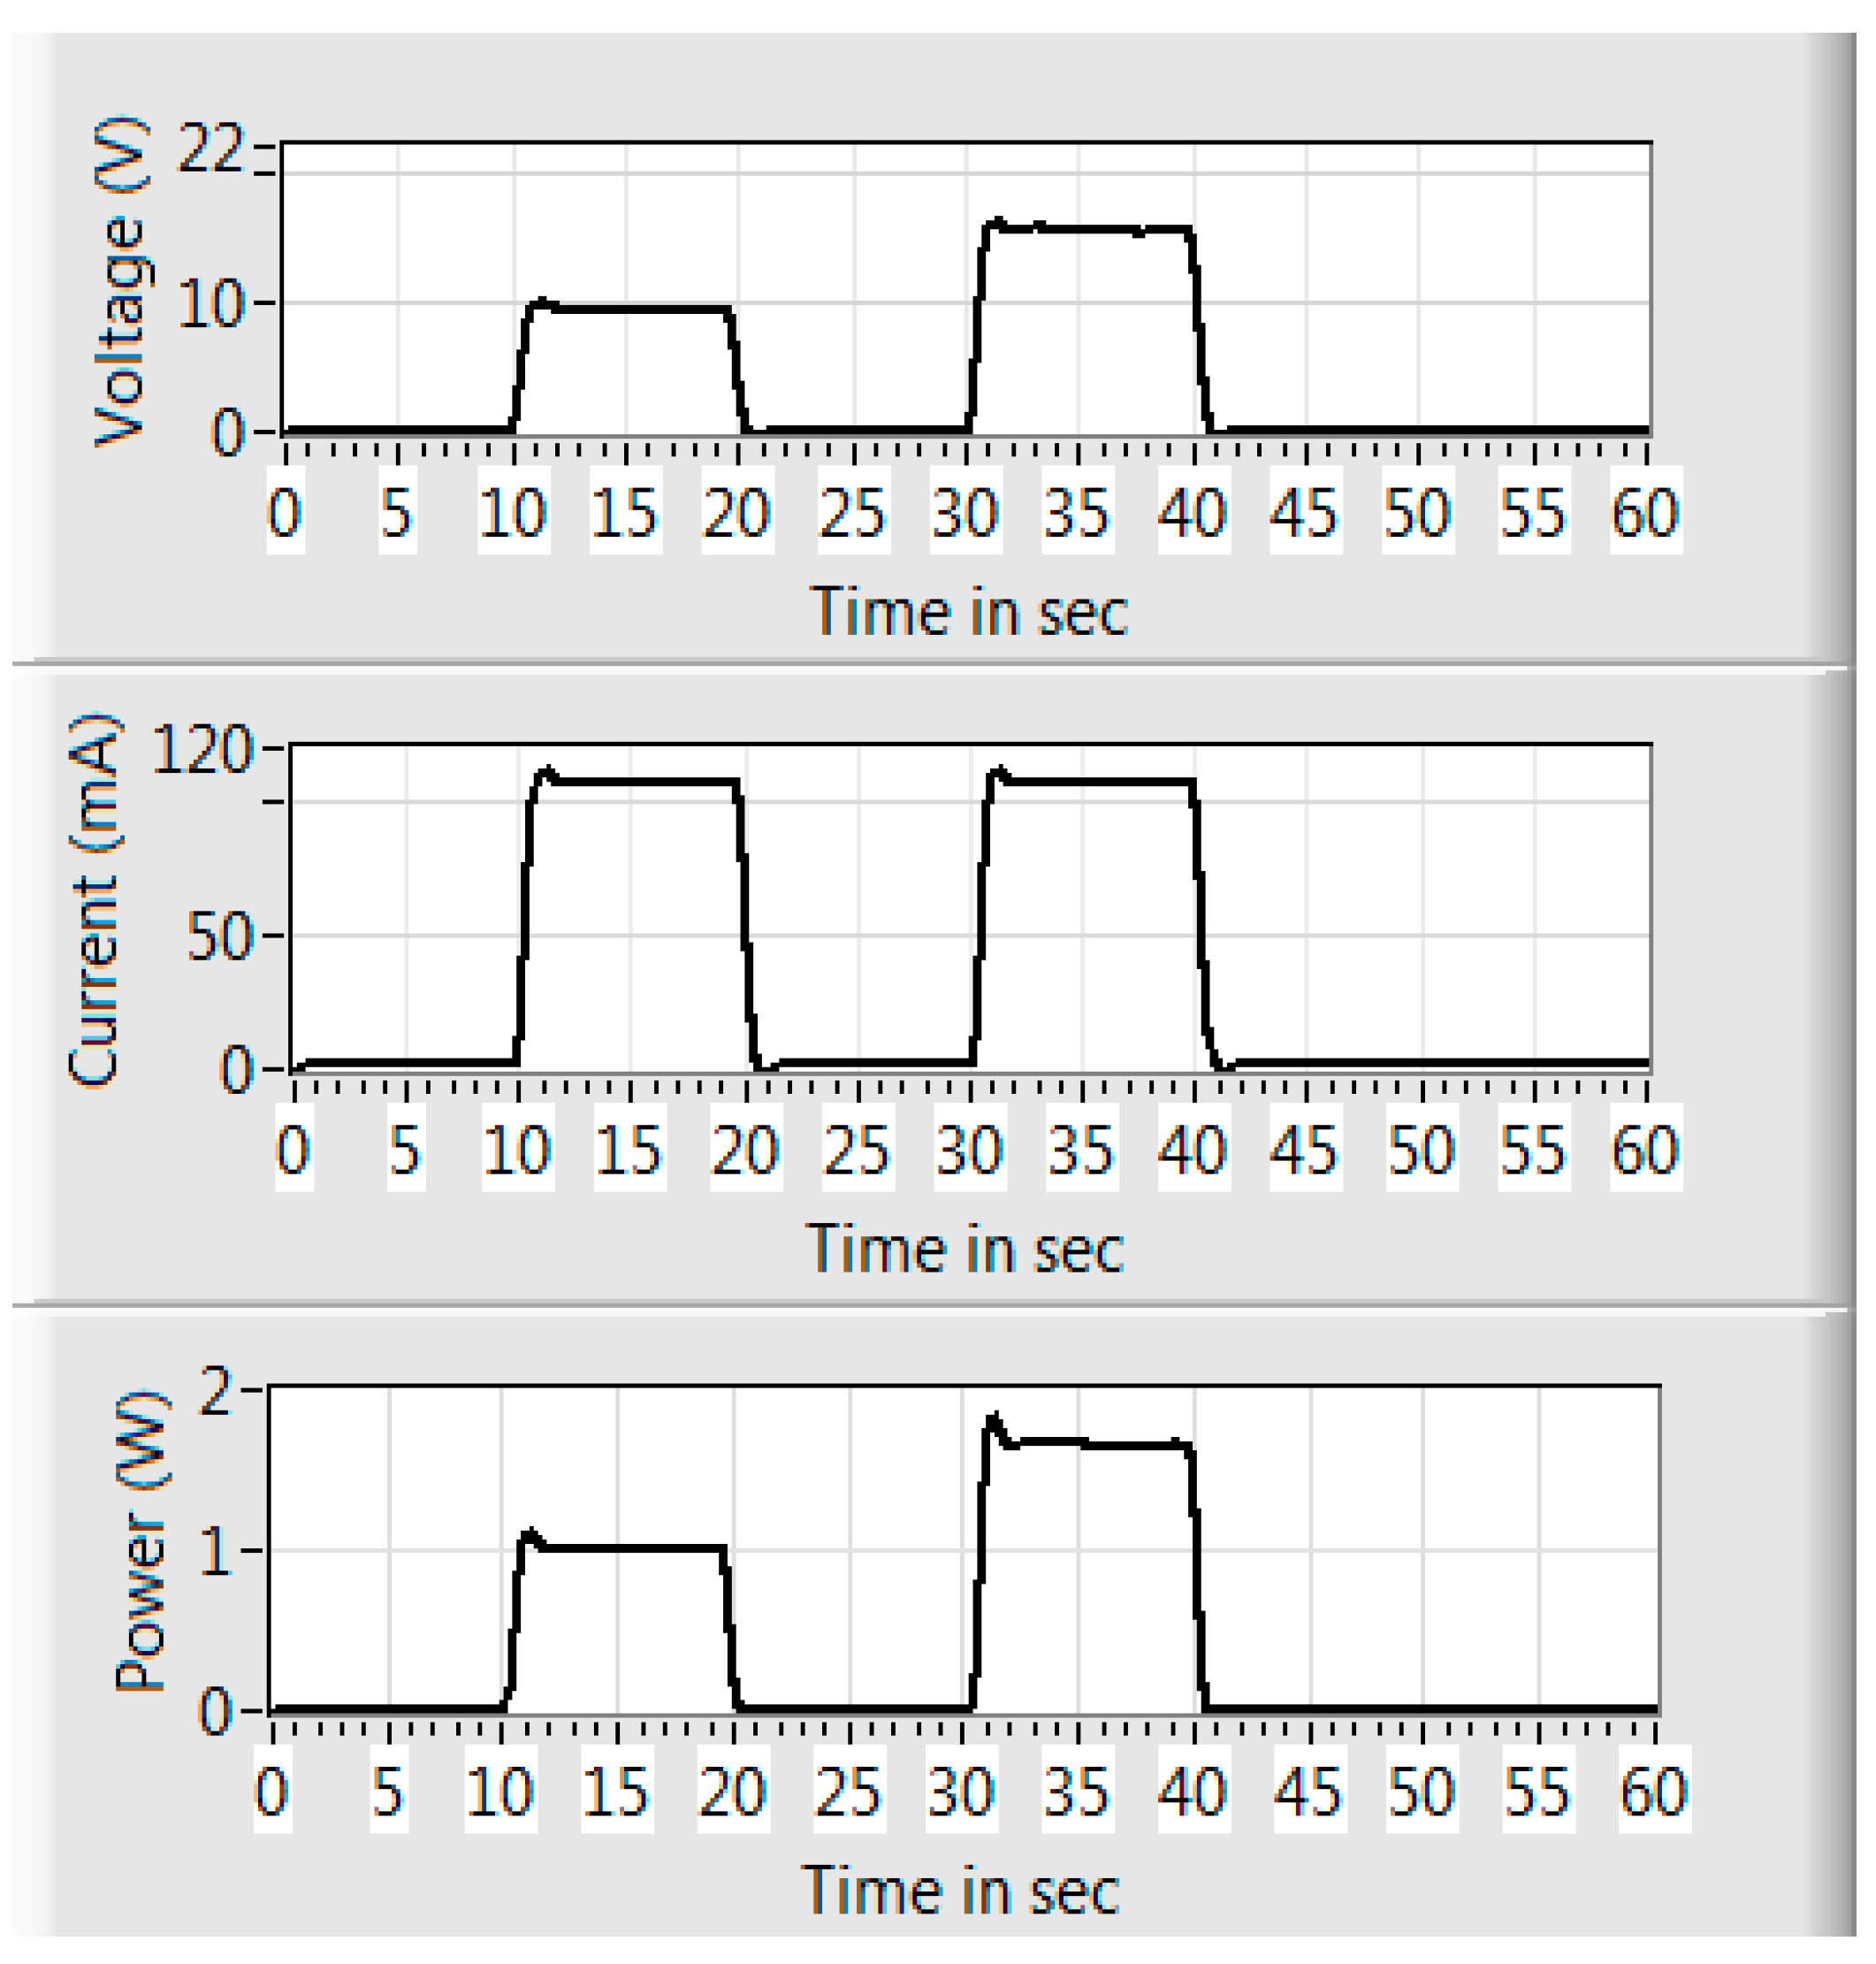
4.4. Maximum Power Point of a PV Module

In most cases, solar cells are not operated at the maximum power point due to the load characteristics of a solar cell, a problem that can be resolved via a maximum power point tracking (MPPT) approach [33]. This maximum power point is the point where maximum energy is harvested from the sun [34], and may be visually represented by an I-V curve. Data obtained from the innovative jig, which may be used to sketch the I-V curve, are shown in Figure 11, while the actual sketch is shown in Figure 12. This I-V curve is obtained by plotting the corresponding current and voltage values obtained from the innovative jig where different load resistors are used (see Figure 4 for the actual values).
Figure 11. Influence of different resistive loads on the output power of the PV module.
Sustainability 07 09100 g011
The load was initially set to 470 Ω resulting in an output power of 0.8 W (time period from 0 to 10 s). The load was then decreased to 260 Ω resulting in an output power increase to about 1.4 W (time period between 10 and 20 s). The maximum power point (2 W) was found to exist when the load was set to 180 Ω (time period between 20 and 30 s). The load was then decreased to 120 Ω resulting in an output power decrease to about 1.4 W (time period between 30 and 40 s). A further decrease in the load to 68 Ω causes the output power to decrease to 0.81 W (time period between 40 and 50 s). With no load applied to the module there was no output power generated (time period between 50 and 60 s). Voltages and currents used to calculate these load values where then used to sketch the I-V curve shown in Figure 12.
Figure 12. I-V curve sketched using the data derived from Figure 11.
Sustainability 07 09100 g012

4.5. Light Intensity

Different light intensities impact on the output power of a PV module [16,35,36]. Varying the light intensity on the PV module can be achieved by switching on or off the 500 W halogen lights (see Figure 13). Figure 13 represents the influence of light intensity on the output power of the PV module when switching one of the halogen lights on or off. Switching both lights on yields an output power of 1.8 W (time period 30 to 40 s) while only one light yields an output power of 1 W (time period 10 to 20 s).
Figure 13. Light intensity versus output power.
Sustainability 07 09100 g013

5. Student Perceptions

Student perceptions of the practical experiments were obtained at the end of the course using a questionnaire survey that was administered using an electronic response system. Student perceptions may often be gathered to determine whether student academic satisfaction exists with regard to the quality of engineering education being offered. The anonymous responses of the students indicated that the use of this innovative jig was indeed enjoyable (see Table 4). The practical experiments were relevant to the theory and helped the students to apply their newly acquired knowledge in a sustainable energy laboratory.
Table 4. Summary of student perceptions (n = 33).
ModuleSolar Energy II
The following represents the percentage of students who agreed that the practical experiments:
Were enjoyable92%
Were relevant to the theory83%
Helped them to apply their new knowledge84%

6. Conclusions

The purpose of this article was to outline a practical innovative jig and its related practical experiments which were developed to assist freshman engineering students to better grasp the operating principles of PV modules. Electronic measurements from this innovative jig where obtained using an ARDUINO UNO board which interfaced with LabVIEW.
The use of this innovative jig along with computer-assisted equipment and software provides a single experience that accommodates two distinct learning styles of visual and kinesthetic learners [37]. Visual learners comprehend and remember material most effectively when they see it demonstrated on the computer’s monitor in relation to other related electronic equipment. Kinesthetic learners comprehend and remember material most effectively when they physically interact with it by turning the PV module’s tilt angle, adjusting the distance of the light source and switching on and off the halogen lights. These practical experiments have been enjoyed by the freshman electrical engineering students, enabling them to achieve the desired learning outcomes, thereby contributing to their having an educated mind and a positive attitude towards sustainable technologies.

Acknowledgments

The authors wish to acknowledge the Department of Academic Development and Support at the Central University of Technology for their financial aid.

Author Contributions

Both authors contributed equally to this work.

Conflicts of Interest

The authors declare no conflict of interest.

References

  1. Hertzog, P.; Vermaak, H.; Raath, J. Design and implementation of a Higher Certificate in Renewable Energy Technologies at the Central University of Technology (CUT), Free State. Available online: http://www.researchgate.net/publication/271965690_Design_and_implementation_of_a_Higher_Certificate_in_Renewable_Energy_Technologies_at_the_Central_University_of_Technology_%28CUT%29_Free_State (accessed on 8 July 2015).
  2. Swart, J.; Olwagen, L.; Britz, C.; Luwes, N. Reflecting on the balance between the practical and theoretical success of African engineering students—A case study from the Central University of Technology. In Proceedings of the HELTASA 2014, University of the Free State, Bloemfontein, South Africa, 18–21 November 2014.
  3. Hertzog, P.; Swart, A. Enhancing freshman engineering student’s experiences of photovoltaic module operation using educational technologies. In Proceedings of the 11th International Conference on Educational Technologies, Dubai, UAE, 22–24 February 2015.
  4. Gabbasa, M.; Sopian, K. Potential and Status of the Renewable Energy Technologies for Sustainable Energy Development in Organization of Islamic Conference (OIC) Countries. WSEAS Trans. Environ. Dev. 2013, 9, 254–262. [Google Scholar]
  5. Uduma, K.; Arciszewski, T. Sustainable Energy Development: The Key to a Stable Nigeria. Sustainability 2010, 2, 1558–1570. [Google Scholar] [CrossRef]
  6. Yang, Q.; Chen, G.; Liao, S.; Zhao, Y.; Peng, H.; Chen, H. Environmental sustainability of wind power: An emergy analysis of a Chinese wind farm. Renew. Sustain. Energy Rev. 2013, 25, 229–239. [Google Scholar] [CrossRef]
  7. Garmsiri, S.; Rosen, M.; Smith, G. Integration of Wind Energy, Hydrogen and Natural Gas Pipeline Systems to Meet Community and Transportation Energy Needs: A Parametric Study. Sustainability 2014, 6, 2506–2526. [Google Scholar] [CrossRef]
  8. Koroneos, C.J.; Piperodos, S.; Tatatzikidis, C.A.; Rovas, D.C. Life cycle assessment of a solar thermal concentrating system. In Proceedings of the Selected Papers from the WSEAS Conferences, Cantabria, Spain, 23–25 September 2008.
  9. Ferdaus, R.A.; Mohammed, M.A.; Rahman, S.; Salehin, S.; Mannan, M.A. Energy Efficient Hybrid Dual Axis Solar Tracking System. J. Renew. Energy 2014. [CrossRef]
  10. Asowata, O.; Swart, A.J.; Pienaar, H.C. Optimum tilt and orientation angles for photovoltaic panels in the Vaal Triangle. In Proceedings of the APPEEC 2012, Grand Mercure Baolong Hotel, Shanghai, China, 27–29 March 2012.
  11. Ozemoya, A.; Swart, J.; Pienaar, C. Poster: Controlling the ambient temperature of a PV panel to maintain high conversion efficiency. In Proceedings of the SATNAC 2012, George, South Africa, 2–5 September 2012.
  12. Moubayed, N.; El-Ali, A.; Outbib, R. Control of an hybrid solar-wind system with acid battery for storage. WSEAS Trans. Power Syst. 2009, 4, 307–318. [Google Scholar]
  13. Swart, A.J.; Hertzog, P.E. Quantifying the Effect of Varying Percentages of Full Uniform Shading on the Output Power of a PV Module in a Controlled Environment. In Proceedings of the SATNAC 2014, Boardwalk Conference Centre, Port Elizabeth, South Africa, 31 August–3 September 2014.
  14. Mathews, S.; Peshek, T.; Hu, Y.; French, R.H. Photovoltaic Degradation Analysis and Simulated Models; Case Western Reserve University: Cleveland, OH, USA, 2014. [Google Scholar]
  15. Quamruzzaman, M.; Rahman, K. A Modified Perturb and Observe Maximum Power Point Tracking Technique for Single-Stage Grid-Connected Photovoltaic Inverter. WSEAS Trans. Power Syst. 2014, 9, 111–118. [Google Scholar]
  16. Moradi, M.H.; Reisi, A.R. A hybrid maximum power point tracking method for photovoltaic systems. Sol. Energy 2011, 85, 2965–2976. [Google Scholar] [CrossRef]
  17. Martins, A.; Lourenço, J.; Patrício, T.; de Alexandria, A. Sensor Kinect in a telepresence application. In Computational Vision and Medical Image Processing IV: VIPIMAGE 2013; CRC Press: Boca Raton, FL, USA, 2013; p. 151. [Google Scholar]
  18. Woodruff, A.; Görmez, B. Laser Music System: Implemented Using Lasers, Infrared Sensors, Photocells and a Arduino Microcontroller. Bachelor’s Thesis, School of Information Science, Computer and Electrical Engineering, Halmstad University, Halmstad, Sweden, 2012. [Google Scholar]
  19. Elliott, C.; Vijayakumar, V.; Zink, W.; Hansen, R. National instruments LabVIEW: A programming environment for laboratory automation and measurement. J. Assoc. Lab. Autom. 2007, 12, 17–24. [Google Scholar] [CrossRef]
  20. Jamaluddin, A.; Sihombing, L.; Supriyanto, A.; Purwanto, A.; Nizam, M. Design real time Battery Monitoring System using LabVIEW Interface for Arduino (LIFA). In Proceedings of the 2013 Joint International Conference on Rural Information & Communication Technology and Electric-Vehicle Technology, Bandung, Indonesia, 26–28 November 2013; pp. 1–4.
  21. Kruse, K.; Keil, J. Technology-Based Training—The Art and Science of Design, Development, and Delivery; Jossey-Bass Pfeiffer: San Francisco, CA, USA, 2000. [Google Scholar]
  22. Swart, A.J. Enhancing students’ perception of single-sideband suppressed-carrier principles by using cooperative and computer-based learning. CAEE Comput. Appl. Eng. Educ. 2012, 20, 332–338. [Google Scholar] [CrossRef]
  23. McCown, R.; Driscoll, M.; Roop, P.G. Educational Psychology A Learning-centered Approach to Classroom Practice, 2nd ed.; Allyn & Bacon: Boston, MA, USA, 1996. [Google Scholar]
  24. Pelland, S.; Galanis, G.; Kallos, G. Solar and photovoltaic forecasting through post-processing of the Global Environmental Multiscale numerical weather prediction model. Prog. Photovolt. Res. Appl. 2013, 21, 284–296. [Google Scholar] [CrossRef]
  25. Janjal, C.S.; Khanchandani, K. Design and Development Model of Solar Grid Tied Photovoltaic Power Inverter for Nagpur. Int. J. Adv. Res. Comput. Sci. Electron. Eng. (IJARCSEE) 2012, 1, 146–148. [Google Scholar]
  26. Heywood, H. Operating experiences with solar water heating. J. Install. Heat Vent. Energy 1971, 39, 63–69. [Google Scholar]
  27. Chinnery, D.N.W. Solar heating in South Africa. In Pretoria CSIR-Research Report 248; National Building Research Institute: Roorkee, India, 1981. [Google Scholar]
  28. Hertzog, P.; Swart, A. Determining the optimum tilt angles for PV modules in a semi-arid region of South Africa for the summer season. In Proceedings of the Southern Africa Telecommunication Networks and Applications Conference (SATNAC) 2015 Kogelberg Biosphere Reserve near Hermanus, Western Cape, South Africa, 6–9 September 2015.
  29. Ma, T.; Yang, H.; Lu, L. Performance evaluation of a stand-alone photovoltaic system on an isolated island in Hong Kong. Appl. Energy 2013, 112, 663–667. [Google Scholar] [CrossRef]
  30. Makrides, G.; Zinsser, B.; Phinikarides, A.; Schubert, M.; Georghiou, G.E. Temperature and thermal annealing effects on different photovoltaic technologies. Renew. Energy 2012, 43, 407–417. [Google Scholar] [CrossRef]
  31. Bataineh, K.; Hamzeh, A. Efficient maximum power point tracking algorithm for photovoltaic cells. In Proceedings of the 1st WSEAS International Conference on Industrial and Manufacturing Technologies, Athens, Greece, 14–16 May 2013.
  32. Hertzog, P.; Swart, A. Quantifying the effect of varying percentages of full uniform shading on the output power of a PV module in a controlled environment. In Proceedings of the SATNAC 2014, Port Elizabeth, South Africa, 31 August–3 September 2014.
  33. Yau, H.-T.; Wu, C.-H. Comparison of Extremum-Seeking Control Techniques for Maximum Power Point Tracking in Photovoltaic Systems. Energies 2011, 4, 2180–2195. [Google Scholar] [CrossRef]
  34. Kharb, R.K.; Shimi, S.; Chatterji, S.; Ansari, M.F. Modeling of solar PV module and maximum power point tracking using ANFIS. Renew. Sustain. Energy Rev. 2014, 33, 602–612. [Google Scholar] [CrossRef]
  35. Ma, T.; Yang, H.; Lu, L. A feasibility study of a stand-alone hybrid solar–wind–battery system for a remote island. Appl. Energy 2014, 121, 149–158. [Google Scholar] [CrossRef]
  36. Ma, T.; Yang, H.; Lu, L. Feasibility study and economic analysis of pumped hydro storage and battery storage for a renewable energy powered island. Energy Convers. Manag. 2014, 79, 387–397. [Google Scholar] [CrossRef]
  37. Swart, A.J.; de Jager, H. Utilizing computer aided equipment in conveying Amplitude Modulation principles to senior engineering students. In Proceedings of the ARCEE 2006, African Regional Conference on Engineering Education, University of Pretoria, Pretoria, South Africa, 26–29 September 2006.

