1. Introduction
At present, lean and green practices are being implemented in manufacturing companies in a variety of industries. The elimination of non-value-adding activities is a central tenet of lean manufacturing. It reduces costs and production times, and improves process and product quality, as well as offering other benefits. However, companies also face legal requirements that necessitate a degree of environmentally conscientious practices, leading companies to adopt green practices. As a consequence, many companies have integrated these practices; nonetheless, these companies still require indicators that can provide data to inform decision-making. In fact, Ioppolo
et al. [
1] observed difficulties in the integration and implantation of these lean and green concepts. In this context, it would be useful to address these challenges by focusing on an indicator that is currently used in lean manufacturing, the Overall Equipment Effectiveness (OEE). This is understood as a measure for representing the effectiveness of equipment utilization in a simple and intuitive way [
2]. The relationship between availability, performance and quality established in the OEE is key to its usefulness, and has resulted in its employ as an indicator in businesses’ decision-making processes. If we also take a parallel look at the green manufacturing, the analysis is primarily related to environmental impacts. However, standardized indicators have also been developed, such as Ecoindicator-99, which agglomerates all emissions under a single unit millipoint [
3]. Nevertheless, the academic literature does not reveal a common indicator that allows the evaluation of all improvements achieved with respect to both lean and green practices. Aguado
et al. [
4] present a model of efficient and sustainable improvements in a lean production system through processes of environmental innovation, which was successfully applied to a company. However, the results are not related to the OEE and do not also differentiate the improvements obtained due to sustainable outcomes from each workstation of the manufacturing process. This paper is an extension of the work carried out by Aguado
et al. [
4] but focuses on the identification of the improvements obtained within each manufacturing process of an industrial plant in terms of availability, performance, quality and sustainability, to determine the overall progress achieved by applying lean and green techniques. A new metric based on the OEE, the Overall Environmental Equipment Effectiveness (OEEE), is defined and applied to the action research of Aguado
et al. [
4].
2. Literature Review
This section reviews the existing literature related to the implementation of a lean and green manufacturing system, the benefits and difficulties of achieving the common objectives and the approaches for measuring the progresses on sustainability. In addition, the possibilities for measuring the OEE and the integration of parameters into the OEE are reviewed, and the environmental impact measurement is analyzed.
2.1. Lean and Green Practices
The terms “lean” and “green” are well known to most, but a review of both will aid in understanding the proposals put forth by other authors. Lean products can be described as a result of both a philosophy and a set of tools and techniques for identifying and eliminating all waste in manufacturing operations [
5]. Meanwhile, the term “green” is also used to describe products with the potential to aggregate long-term benefits, reducing consumer stress and ameliorating customer environmental responsibility while maintaining the positive qualities of the product [
6]. As a consequence of these two assumptions, lean and green products are reached through a lean and green production. Consumer interest in achieving sustainable development is not new [
7,
8]. Furthermore, superior product performance is a means of obtaining consumer loyalty for a specific brand and/or product [
9], and in this case, declaring a product to be green and lean is relevant to the value the consumer assigns to the product [
10].
Pujari
et al. [
11] attempt to integrate New Product Development (NPD) and environmental management philosophies to develop and empirically test a theoretical method for the development of new environmental products (Environmental New Product Development, ENPD). This study contributes to the discussion of green and competitive possibilities by examining the relationships between the ENPD activities, the market and the eco-performance of new environmental products. The results suggest a synergy between the paradigms of conventional and environmental product development.
The authors note two important considerations. First, consumers today exhibit increasingly rapid changes in taste, shortening product life cycles and, thereby, an increasing importance of NPD for business success. Second, responding adequately to concerns regarding environmental impacts remains a challenge for many enterprises and has become an essential component of corporate strategies.
More recently, Pujari [
12] has identified a lack of eco-friendly manufacturing processes and approaches in the existing literature and therefore a need for empirical studies, to explore how to increase the product market success achievement. This work also expounds upon the ENPD process, which is defined as an analysis of life cycle that includes new activities, such as designing for the environment and the participation of suppliers in an environmentally sensitive manner. This approach uses hierarchical regression to identify the related and incremental impacts of the activities of eco-innovation projects for ENPD and their performance in the market. Thus, the factors that influence the market for greener products are considered by the developers of new products, environmental specialists, and suppliers based on the market approach and life cycle analysis.
Bergmiller and McCright [
13] investigate factories visited by the Shingo Prize between the years 2000 and 2005 to relate sustainable green practices with lean practices. These authors draw two main conclusions:
- (1)
Among the visited factories, the lean plants have a better sustainable result than the average.
- (2)
Further research into the synergy between lean and sustainable systems will offer the greatest potential to improve their effectiveness.
Yang
et al. [
14] explore the relationship between lean manufacturing practices, environmental management and business performance. The results of this research propose that lean manufacturing experiences are positively related to environmental management practices but also that the implementation of environmental management practices alone has a negative effect on competitiveness in the market and on financial performance. The study provides empirical evidence (based on a large sample) to suggest that environmental management practices are an important tool for resolving conflicts between lean manufacturing and environmental performance. The authors underline two observations derived from their empirical results:
- (1)
Lean manufacturing and environmental management practices are different approaches and have different impacts on business performance outcomes.
- (2)
It is essential that companies understand the consequences of their actions on environmental management, spurred by the existing discussion about their environmental and economic objectives.
In the same way, and continuing the revision of the literature through the years, Azevedo
et al. [
15] show that lean and green practices improve economic, social, and environmental performance, with the case of a Portuguese automaker used as an example. The authors conclude that, although there are relationships between these practices, future studies must define comprehensive metrics to link all these aspects together.
Gunasekaran and Spalanzani [
16] assert that Sustainable Business Development (SBD) in manufacturing and service industries has become a crucial issue in recent years due to increased global awareness among consumers. It is evident that the future quality of the environment is in question, generating great concern for the welfare of future generations. As a result, the authors affirm that the success of a business depends on the preservation of the environment, the safety and well-being of those living today and the safety and well-being of future generations. According to the authors, sustainability is focused on protecting natural resources from exploitation, with the ultimate goal of maintaining or increasing productivity and competitiveness. Thus, the pressure to promote sustainable practices is both external (public policies and nonprofit organizations) and internal (strategic goals, employee safety and satisfaction, cost savings, productivity and quality). The researchers also note that many companies around the world have already incorporated corporate, economic, social and environmental responsibilities into their strategic plans.
Smith and Ball [
17] are also of the opinion that a sustainable society cannot be established without more efficient manufacturing approaches and technologies and that these must be provided by the manufacturer. The authors indicate that the available literature covers the principles of green manufacturing but not how to apply these principles. Low-level guidelines are required to evaluate manufacturing facilities, and to make possible the identification and selection of opportunities for improvement. New methodologies should provide detailed guidance on approaches for the systematic analysis of manufacturing processes as well. In their study, the authors created guidelines for defining Material, Energy, and Waste (MEW) flows, and their efforts support the search for green production practices. The proposal presented in their work is based on an installation case and the use of flow maps of qualitative processes. The collected data were used to create a spreadsheet guide, which was then applied to each of the MEW flow processes within the system. Accordingly, this proposal facilitates the identification and selection of practices intended to improve environmental efficiency. The key points identified during the so-called analysis of learning generate a set of guidelines for the analysis of a system. Similarly, to reduce CO
2 emissions, Wu
et al. [
18] propose a methodology, based on lean tools, for the identification of activities that do not add value to the production process.
Dües
et al. [
19] focus on the relationship between lean and green. Their analysis of the literature identified how lean practices can serve as both a catalyst of and a synergistic approach for achieving green practices. In other words, lean manufacturing is beneficial for green practices, and the implementation of green practices also positively affects current businesses. Moreover, Dües
et al. [
19] also note the difficulty in finding studies that relate lean and green aspects. They indicate that the existing documentation lacks explanations for approaches that can be used to integrate green methodologies into current lean practices.
Diaz-Elsayed
et al. [
20] discuss the integration of lean and green practices within parts production in the automotive industry, ultimately achieving an important reduction in production costs. Meanwhile, Manzouri
et al. [
21] find that many companies, especially small enterprises, are unaware of lean tools and their potential to eliminate waste. Thus, Ioppolo
et al. [
1] propose integrating environmental aspects into lean manufacturing, identifying both opportunities and barriers. The authors report on the current difficultly of locating information on approaches for changing existing production practices from the perspective of the manufacturer. Finally, Pampanelli
et al. [
22] offer an integrated lean and green approach, providing information about the synergy between lean and green practices. They report that implementing these changes can reduce operational costs by 5%–10% through waste minimization when both principles are applied in a production cell.
These studies develop several interesting points for further consideration.
- (1)
Synergy exists between the paradigms of conventional and environmental product development and green and lean manufacturing.
- (2)
The challenge of responding adequately to environmental concerns affects many aspects of enterprises and has become an essential component of corporate strategies. Companies must measure their environmental performance as an indicator of the effect of their environmental impact management practices on other business performance results.
- (3)
The existing literature lacks empirical studies on approaches for increasing the eco-friendliness of products and their success in the market. The available literature covers the principles of sustainable manufacturing, but there is little to no information on how these principles can be applied. New methodologies should provide detailed guidance on approaches for the systematic analysis of manufacturing practices as well as assistance with the identification and selection of improvement opportunities.
- (4)
The future of the Earth, and, therefore, the health and well-being of future generations, is of concern. Sustainability is focused on protecting natural resources from exploitation while maintaining productivity and competitiveness. The pressure to promote sustainable practices is both external and internal.
2.2. Overall Equipment Effectiveness and Environmental Impact
Since the OEE indicator for measuring the implementation of Total Productive Maintenance (TPM), was defined by Nakajima [
23], who also later explained its implementation [
24], and it has been included as one of the six techniques used by the lean production [
25]. In general, OEE is determined according to each machine used in a production process to identify its availability, quality and performance contributions and to observe the possible relationships between the different parameters of influence, as seen in Borkowski
et al. [
26]. The OEE has been applied as a measurement tool and decision-making aid for improving productivity by improving equipment [
27], and its utility as an indicator in the aerospace industry has been demonstrated [
28]. The high potential of OEE has supported its consideration as a basis for analyzing equipment reliability [
29]. For these reasons, studies have been conducted to analyze the convenience of its adaptation to and incorporation into other indicators. For example, Wudhikarn [
30] attempts to improve the OEE to assess equipment losses by normalizing the units of measure as monetary units and thereby considering the quality costs.
Wang and Pan [
31] propose the simultaneous use of OEE and unit-per-hour machine rates to obtain complete data for the analysis of equipment processing rates. Oechsner
et al. [
32] introduce additional parameters into the OEE to find a metric for the entire factory and collect productivity data. Other studies have focused on determining the proper weight of each overall equipment effectiveness element [
33]. Another modification of the OEE is focused on the overall throughput effectiveness metric, which cannot be identified as appropriate or inappropriate in general because it depends on the specific product or process [
34]. Applications of this indicator can be found in very different industries, including nougat fabrication [
35] and intelligent manufacturing systems [
36].
As noted, the literature includes attempts to improve the OEE, although amongst these a relationship with sustainability has not been established. Thus, the new parameter presented in this paper, the OEEE, is intended to initiate an open discussion to address the four points identified in
Subsection 2.1. The result is highly representative of the existing synergies between lean and green and provides an intuitive and easy means of assessing the progress made at each workstation. The intuitive nature and easiness means of the results lead to one of the goals of this new parameter OEEE, to allow individuals who are not experts in green and lean manufacturing to make appropriate business decisions, taking into account also sustainable facts.
The OEEE depends on initial and final environmental assessments, which can be conducted by any valid method to identify the environmental impact of each step in the process, interconnecting the related environmental aspects [
37]. The indicator most commonly used to measure the environmental impact is the equivalent CO
2 emission for all greenhouse gas emissions, such as methane and nitrous oxide. Even so, it has previously been shown that the parameters of industrial processes determine not only the outcomes of manufacturing but also the CO
2 emissions [
38]. Many different methodologies can be used to calculate environmental impact, such as Ecotax [
39], Ecovalue08 [
40], Ecoindicator-99 [
41] and Ecoinvent 3 [
42], each of which has unique advantages and disadvantages [
43]. A case study carried out by Aguado
et al. [
4] used Ecoindicator-99 [
44], which is also applied in the analysis presented in this paper. Ecoindicator-99 [
44] provides a measure of the environmental impact calculated by millipoints [
3] at each step in the production line, taking into account the product’s entire life cycle.
In this way, the concept of sustainable production in an organization is interpreted appropriately by relying on measurable indicators, which serve to improve the performance of lean and green manufacturing systems.
Before conducting the environmental impact analysis, it is important to set the criteria that will be accepted and applied throughout the process. Any change in these criteria requires a re-evaluation of the initial status to maintain the coherence of the results. If the criteria change and the initial state is not re-evaluated, a degree of confusion related to the final results could arise, reducing the representativeness of the conclusion with respect to actuality.
3. Overall Environmental Equipment Effectiveness
As noted in
Subsection 2.2, the new metric Overall Environmental Equipment Effectiveness (OEEE) presented in this paper is based on the OEE [
1,
23,
45] (see Equation (1)).
The OEEE is the result of perceptual indicators used to represent the capacity of a workstation, taking into account its availability, performance, quality and sustainability. The aim of this new parameter, OEEE, is to identify the losses due to sustainability and establish a complete understanding of the production process in terms of availability, performance, quality and sustainability. The identification and measurement of these inefficiencies will allow the company to implement the necessary corrective actions to improve the production process (see Equation (2)).
Availability refers to the amount of real time in which a work unit is operational and actively producing material, beginning with the set-up time of the post [
28]. This term takes into account the time lost due to machine adjustments, configuration of the workstation, and other unexpected breaks in production. The planned time for production does not include the organized stops and non-working times, such as workers’ pauses during production.
Performance takes into account the unrecorded downtime, comparing the real against the theoretical quantity of produced parts, which should have been produced during the ideal cycle time [
28]. The ideal cycle time is the minimum period of production time expected in optimal circumstances of work. Performance includes speed losses due to small stops and other issues. If a
takt time, which is the time needed to obtain a part according to the market requirements [
45], is defined, then this value will be taken as the ideal cycle time.
The quality rate captures the time lost due to the rejection of parts during production and the losses from the time between initial start-up to process stabilization [
28]. Quality refers to the good pieces produced as a proportion of the total pieces produced.
In addition to these three terms, which are already included in the OEE, a new factor related to sustainability is added to the equation to represent the environmental efficiency of the workstation (see Equation (3)).
Note that in Equation (3), the environmental impact of the workstation state is referred to the moment of analysis: initial or final. The environmental impact can be measured using any method, some of them already identified in
Subsection 2.2. The only requirement is that the correct unit demanded by each method be used at this step. In this case study, the millipoint was chosen, but any other unit of environmental impact could have been used, as, for example, the equivalent CO
2. The fact of identifying the relevant parameter (unit measure) for each company or production process is another advantage of this new tool. Once this unit has been chosen, it must be kept during the whole process, in order to maintain the coherence of the results between the initial and final status.
The Sustainability parameter is always referred to the total environmental impact measured at the initial status, so this is the first value to calculate. Once this value is identified, it is compared to the value of each workstation. It means that we are comparing the environmental impact state of each workstation against the total initial environmental impact state. This approach provides two interesting advantages:
- -
When compared the final state, the improvement achieved by each workstation is provided, referred to the initial state.
- -
When compared the initial or final state, the worst workstation, in which improvements would be most beneficial, can be easily identified, because it has the worst value of Sustainability.
However, the relationship between this factor and the initial number of environmental impact could create confusion because the definition of this parameter will never allow 100% effectiveness at all the workstations. This fact is important when defining the optimal ranges that can be achieved by the OEEE. Besides, the complementarity of the previous result, between the environmental impact of each workstation and the total environmental impact of the initial state, is needed to retain the effectiveness criteria used in the other parameters already included in the OEE.
Joint analysis of availability, performance, quality and sustainability provides a fast and easy-to-understand representation of the OEEE of a functional workstation. A more in-depth analysis can reveal which of the four parameters should be improved to increase the capacity of the functional unit. The introduction of a new OEEE metric for each workstation will allow the optimal decisions to be made in terms of availability, performance, quality and sustainability. It could be considered that the competitiveness begins within the company between the different functional units.
Hansen [
46] classifies the OEE degrees of optimization. This paper suggests the following OEEE categories, taking into account the effect of sustainability on the ranges defined by Hansen. The objective of surpassing 85%, gives excellent competitive functionality. Values between 85% and 70% are considered good, while those from 70% to 60% are considered only acceptable, indicating a manufacturing process with slight economic losses and low competitiveness. A value of 60% should be considered the minimum allowable for a functional unit in a company that wants to stay in the market in the long run.
Table 1 presents the ranges for the different OEEE measures. Due to a lack of contrast with the sustainability parameter, the proposed OEEE scale requires a more exhaustive analysis to achieve a contrasting perspective, which is reserved for future study.
Table 1.
Interpretation of the ranges for Overall Environmental Equipment Effectiveness (OEEE) measures.
Table 1.
Interpretation of the ranges for Overall Environmental Equipment Effectiveness (OEEE) measures.
| OEEE | Result | Status |
|---|
| OEEE < 60% | Bad | Low competitiveness |
| 60% < OEEE < 70% | Acceptable | |
| 70% < OEEE < 85% | Good | |
| 85% < OEEE | Excellent | High competitiveness |
The OEEE parameter challenges companies to quantify improvements to availability, performance, quality and sustainability achieved after improving the initial state. The objective of the OEEE is to show where losses occur, checking and understanding the value OEEE of each workstation. These losses may result from problems with availability (unexpected stops), performance (bottlenecks), quality (defects or scraps) and/or sustainability (millipoints). This metric can inform decisions intended to correct or improve each situation.
Finally, the OEEE aims to chase “waste” produced by millipoints stops, faults, preparation of machines, loss of productivity and rejections together, using a single working tool. Considering all of the aforementioned points, the OEEE is a promising approach for improving the synergy between a lean and green manufacturing system based on sustainability.
4. Methodology
To demonstrate the advantages of the OEEE, an action-based research approach has been developed. Since Lewin [
47] established the concept of action research, this methodology has been used in the academic literature, including in studies related to the environment [
48]. In action research, the researcher must be present and participates in the organization’s development and implementation of process modifications and improvements [
49].
The new parameter OEEE proposed is aimed at companies in the secondary sector with flexible manufacturing processes depending on the demand and harmonized distribution of resources along the production line. As a result, for the primary and tertiary sectors some adjustments should be included. In addition, some corrections related to the size of the company could be needed.
The measures required in the availability, performance and quality calculations were collected using a structured questionnaire administered through interviews at a tube manufacturing plant, at which the researcher analyzed the measures and helped to implement the actions recommended by the conclusions.
This kind of audit was focused on four main aspects: green contribution, social responsibility, economical development and public policies. Each one of these aspects is divided into six different fields: social necessities, material supply, manufacturing, distribution, product and waste. On this way, the complete structure of the organization is analyzed, included all the production steps following a “pull” direction, from the desire of the customer to the entry of raw materials.
In this particular study, the material analyzed is galvanized steel. This material is altered during the manufacturing process; the initial galvanized steel has a zinc coating of 275 g/mm
2 (DX53D + Z275), while the final material has a zinc coating of 120 g/mm
2 (DX51D + Z120). Note that the designation of the material is according to the standard EN 10346 [
50].
The environmental impact has been determined using the method Ecoindicator-99 [
44] through the whole life cycle of the product. SimaPro software was utilized [
51] to get the millipoints values of each workstation.
5. Results and Discussion
Aguado
et al. [
4] present a case study based on a tube fabrication company, where a model of efficient and sustainable improvements in a lean production system is implemented through processes of environmental innovation. The Ecoindicator-99 [
44] metric was used in the aforementioned study and will also be used in the analysis in this paper to identify the effect of sustainability, as measured in millipoints. The use of the same metric will guarantee that the same criteria are maintained, allowing meaningful comparison.
The following criteria should also be considered:
- -
One single reference part represents all of the producible parts.
- -
Only the reference part is produced.
- -
Each machine can only be adjusted a pre-defined number of times per day depending on the parts requested.
- -
The analysis includes the millipoints due to the re-utility or recovery of raw material.
- -
The takt time is used to define the performance of the final state.
In the case study of the tube fabrication company, nine steps are identified at the initial status of the analysis, each of which has its own millipoints account. Applying the model proposed by Aguado
et al. [
4], eight steps remain, as the control and labeling is done in a single workstation, instead of using two different working steps.
Table 2 presents the environmental impact, in millipoints (mPt), of the initial and final states of this case study of a tube fabrication company.
Table 2.
Environmental impact.
Table 2.
Environmental impact.
| Production Process | Initial Environmental Impact (mPt) | Final Environmental Impact (mPt) |
|---|
| Reception | 103.4737 | 56.3370 |
| Cutting | 16.6578 | 0.033 |
| Closing | 0.0001 | 0.001 |
| Welding | 6.8732 | 6.8732 |
| Punching | 0.0073 | 0.0073 |
| Bending | 1.7530 | 1.7530 |
| Control | 0.0001 | 0.0001 |
| Labeling | 0.0001 |
| Shipping | 16.015 | 16.015 |
| TOTAL | 144.78 | 81.02 |
The data from the initial situation related to the factors of the OEEE are presented in
Table 3.
Table 3.
Initial sustainability, availability, performance and quality results.
Table 3.
Initial sustainability, availability, performance and quality results.
| Process | Receiving | Cutting | Closing | Welding | Punching | Bending | Control | Labeling | Shipping |
|---|
| Initial | |
|---|
| Sustainability (%) | 28.53 | 88.49 | 100.00 | 95.25 | 99.99 | 98.79 | 100.00 | 100.00 | 88.94 |
| Availability (%) | 16.13 | 41.71 | 99.95 | 97.55 | 93.61 | 89.41 | 69.63 | 50.71 | 63.64 |
| Performance (%) | 66.67 | 84.21 | 97.90 | 89.89 | 88.89 | 93.02 | 95.52 | 94.12 | 25.00 |
| Quality (%) | 100.00 | 99.43 | 99.82 | 94.89 | 99.86 | 99.86 | 95.69 | 100.00 | 100.00 |
The data for the final state, where control and labeling have been unified, are shown in
Table 4.
Table 4.
Final sustainability, availability, performance and quality results.
Table 4.
Final sustainability, availability, performance and quality results.
| Process | Receiving | Cutting | Closing | Welding | Punching | Bending | Control Labeling | Shipping |
|---|
| Final | |
|---|
| Sustainability (%) | 61.09 | 99.98 | 100.00 | 95.25 | 99.99 | 98.79 | 100.00 | 88.94 |
| Availability (%) | 5.46 | 73.13 | 85.31 | 90.63 | 90.52 | 72.34 | 90.34 | 72.76 |
| Performance (%) | 100.00 | 100.00 | 100.00 | 100.00 | 100.00 | 100.00 | 100.00 | 100.00 |
| Quality (%) | 100.00 | 99.27 | 99.86 | 99.88 | 99.90 | 99.90 | 99.19 | 100.00 |
Raw material is only received two days per week in the initial state, whereas it is received daily in the final state. The two situations are not easily compared because the same criteria are not used. Therefore, the analysis can proceed in one of two possible ways:
- (a)
The two processes can be analyzed independently, as shown in the figures above, by conducting the analysis for one of the two days per week on which materials are delivered in the initial state.
- (b)
The initial state can be distributed over five days. This approach will be used hereafter.
According to these results, a significant improvement is obtained between the initial and final states after implementing the model for efficient and sustainable improvements in a lean production system according to processes of environmental innovation. A step-by-step comparison reveals the improvements to each term.
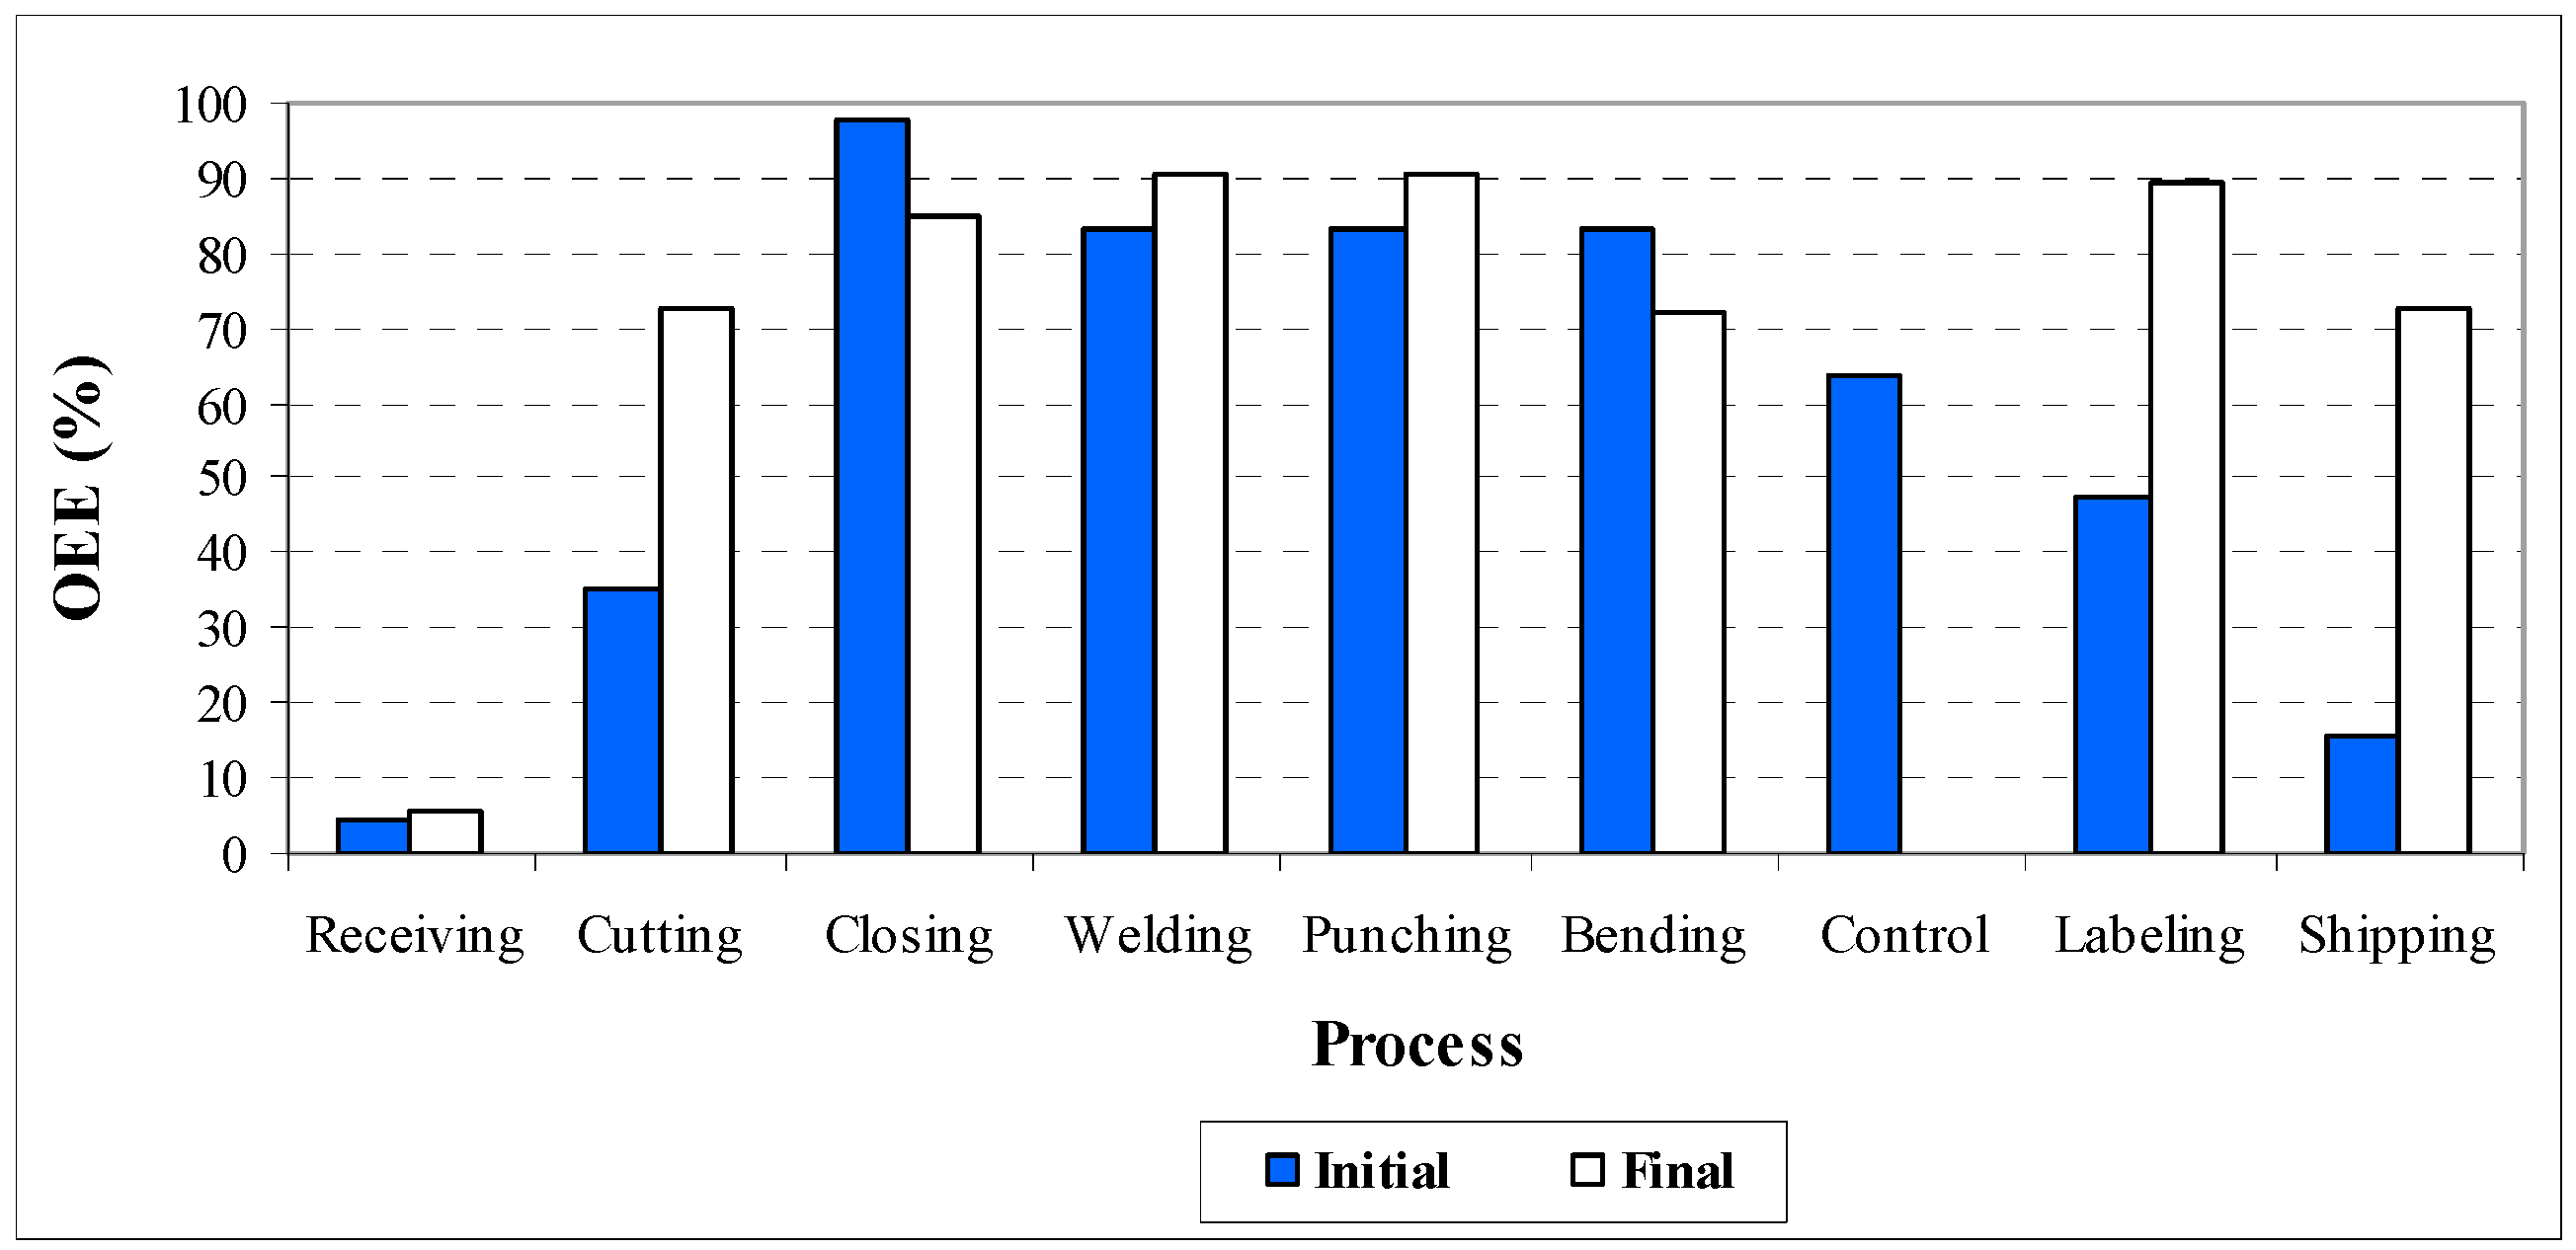
Figure 1 and
Figure 2 correspond to the OEE and OEEE, respectively and according to the values of the
Table 3 and
Table 4 (see Equations (1) and (2)). Remarks, as previously explained, thanks to the improvements made, the control and labeling processes are done in the same workstation at the final state.
Figure 1.
OEE of each production process.
Figure 1.
OEE of each production process.
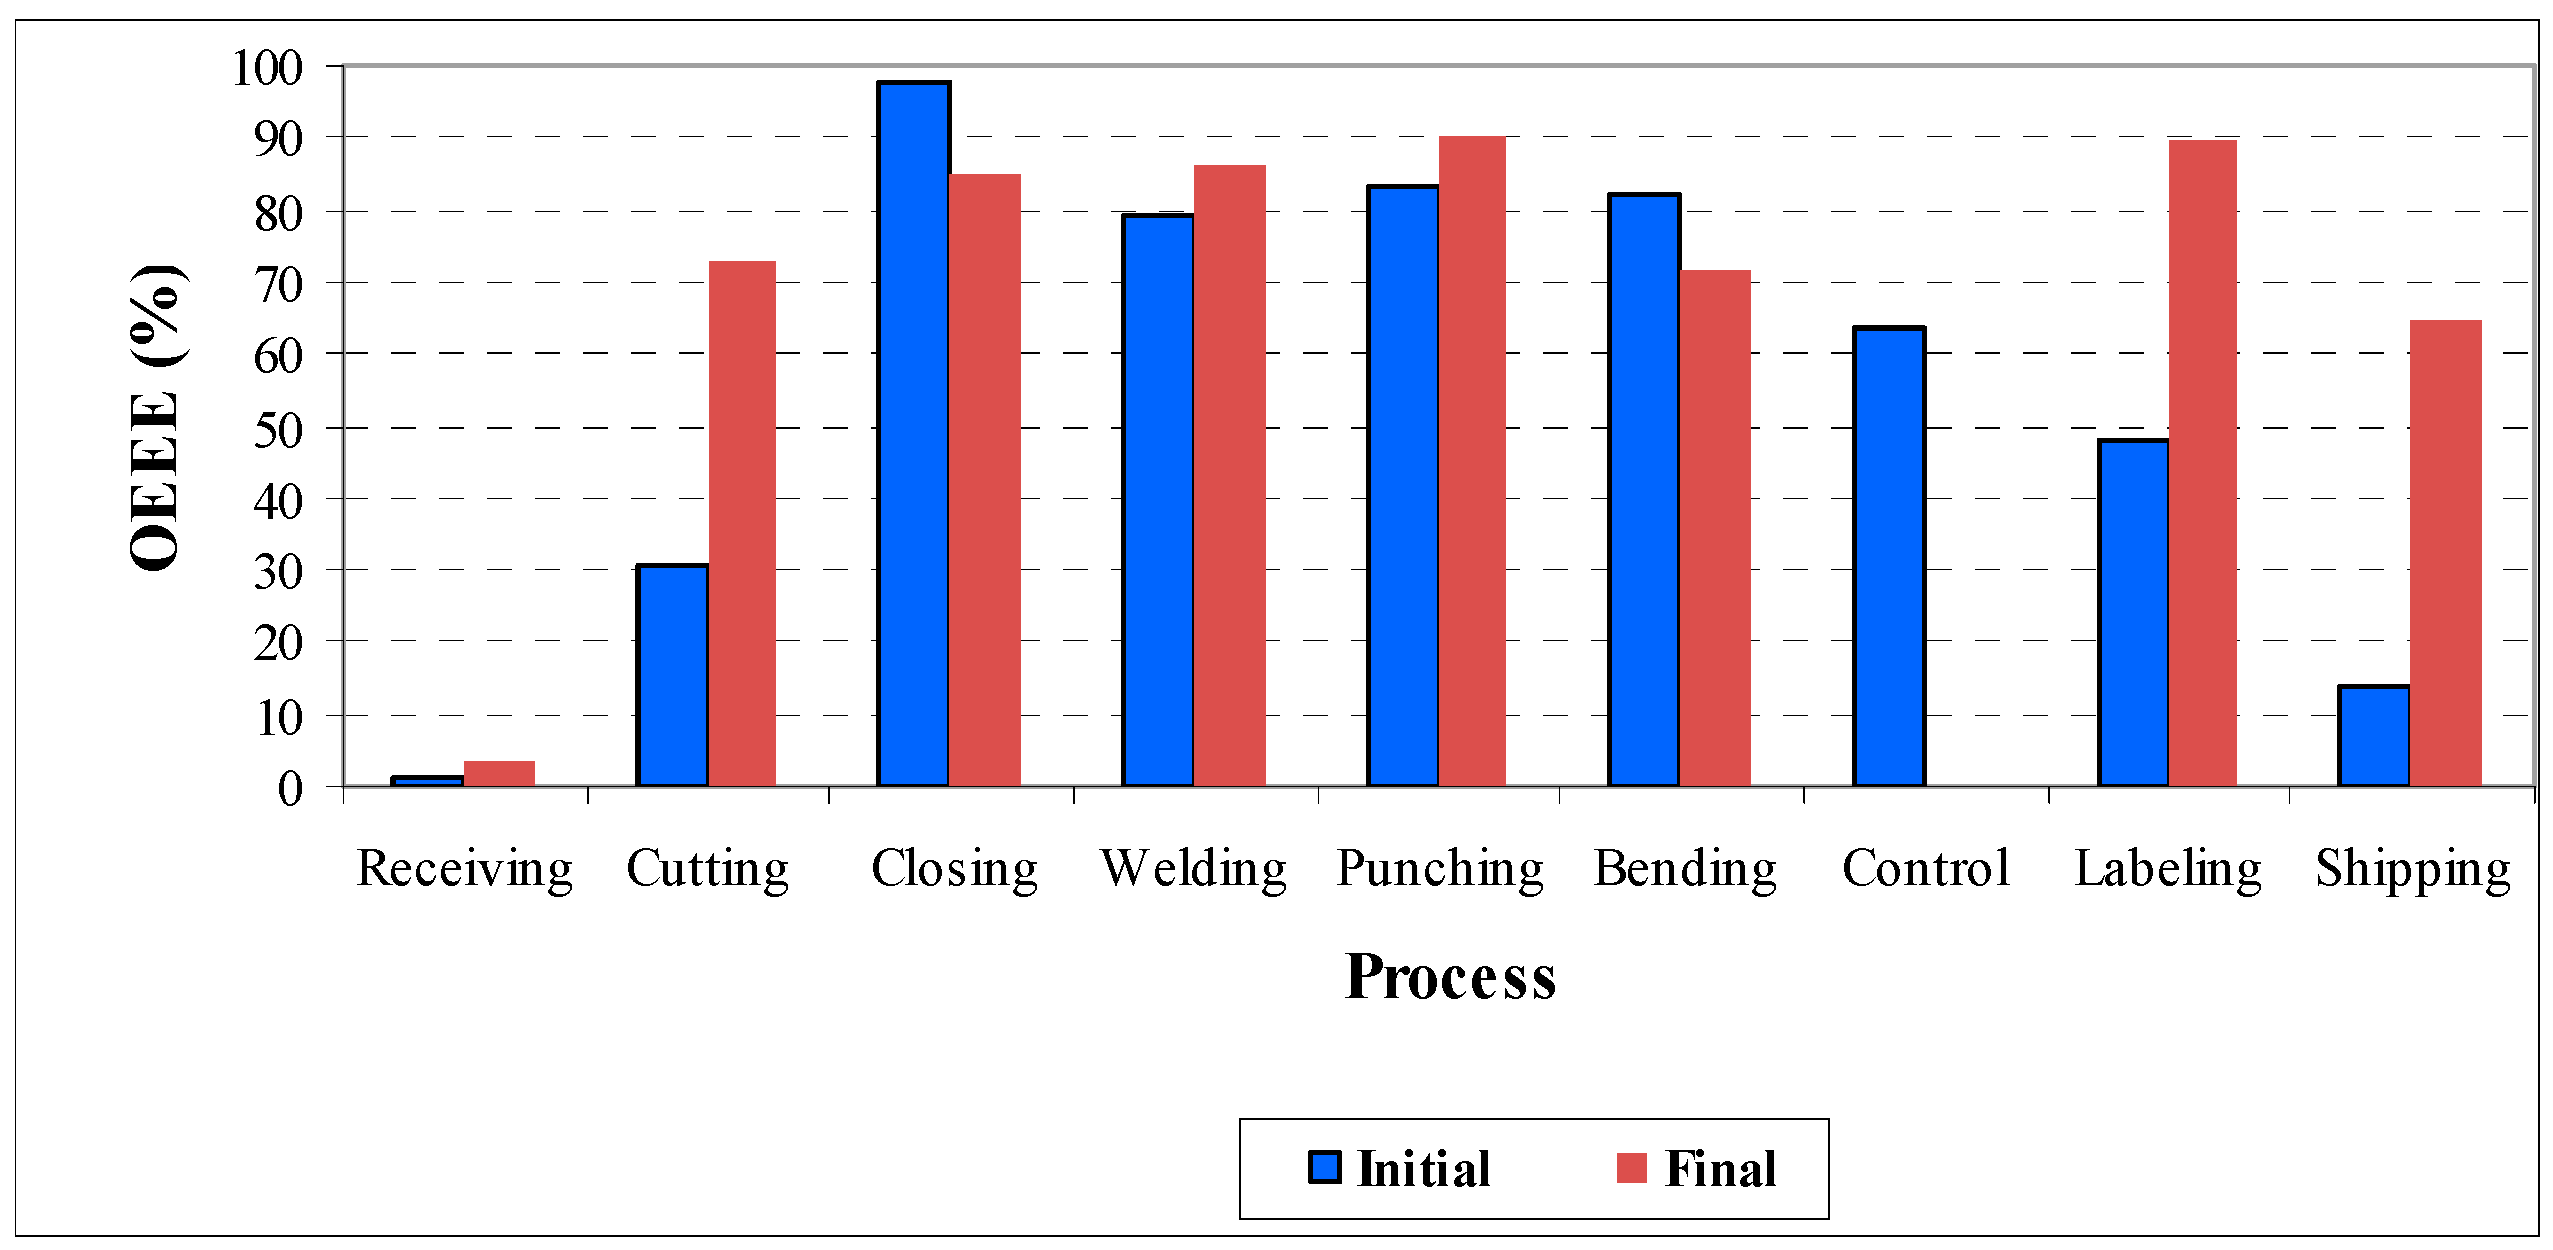
Figure 1 and
Figure 2 look similar, but
Figure 2 includes extra information related to the sustainability factor, as shown in
Table 3 and
Table 4. This detailed sustainability information helps identify the greatest opportunities for environmental improvements. It is evident that the next decision should be to improve the material receiving step of the process, which is the only workstation under acceptable 60% OEEE, even if the sustainability value of this step has been improved. This improvement can only be identified if the OEEE is correctly analyzed.
Figure 2.
OEEE of each production process.
Figure 2.
OEEE of each production process.
Changes in product development were begun at the point of material receiving. The sustainability indicator for receiving is improved from 28.53% to 61.09%; this finding is in concordance with the Ecoindicator-99 result, which decreased from 144.78 millipoints to 81.02 millipoints. This result was obtained by changing the raw material (from DX53D + Z275 to DX51D + Z120), which a deeper analysis identified as more beneficial and for which a lower market price could be established. The decision to change the raw material was motivated by the improvement in sustainability. The environmental impact of the new material is lower than the original one. As a consequence of this, the value of millipoints in the final Receiving workstation is lower than in its initial state, and the final result of the Sustainability parameter of the Receiving workstation improves. This change was the starting point for all other modifications to the production line. A lean adaptation was required according to the takt time, and a focus on the customer was key for the company’s success. This sentiment was integrated inside the company by considering the subsequent production step as the customer of the previous step and was integrated outside the company with the suppliers, who adopted just-in-time delivery (e.g., the delivery of tubes five times per week instead of two).
The consequences of the synergies between green and lean can be pointed out in the
Figure 1 and
Figure 2, where the columns of the final state are more harmonized. It means that there are no big gaps between workstations. Initially, the closing was higher than 90%, but four other workstations were under 50%. At the final state, excepting the receiving workstation, all the others have values between 57% and 91%. Comparing the results OEE and OEEE, these ones are a little bit lower, so the initial suggestion to classify the OEEE ranges based on the OEE could be accepted till further researches. The stockpiles between workstations disappeared or were greatly reduced; the production batches decreased; new investments allowed for quick adjustments to the machines; and the layout was defined according to the production needs. All of the modifications were implemented based on the information obtained from the OEEE, thanks to change the raw material of the tube. Here, the sustainability analysis was the starting point for all the improvements undertaken.
In terms of business results, each of these improvements had a positive effect. The removal of stockpiles eliminated unnecessary materials and prevented money from being tied up inside the factory (between workstations and in the incoming and shipping warehouses). Small batches and quick adjustments provide the flexibility to respond to the customers’ requirements (the time needed for the first part produced was reduced from 2.301 to 685 s), and the overall production process runs smoothly (no bottlenecks or quality breaks).
Finally, the costs for each step of production in the initial and final states are compared in
Table 5. The final cost of the reference product is 6.2% cheaper.
Table 5.
Costs in the initial and final states.
Table 5.
Costs in the initial and final states.
| Production Process | Initial Cost (€/unit) | Final Cost (€/unit) |
|---|
| Reception | 0.010 | 0.010 |
| Cutting | 0.134 | 0.243 |
| Closing | 0.401 | 0.286 |
| Welding | 0.312 | 0.303 |
| Punching | 0.315 | 0.304 |
| Bending | 0.301 | 0.243 |
| Control | 0.235 | 0.304 |
| Labeling | 0.179 |
| Shipping | 0.112 | 0.182 |
| TOTAL | 1.999 | 1.875 |
As a consequence of the internal progress made, the final product is more competitive in terms of price, flexibility and sustainability while maintaining the quality required by the customer [
4]. This is a step toward securing customer loyalty. Although the improvement processes in the case study are not yet finished, new efforts to improve the final state are being defined based on these results.


