2.1. Framework Weighting
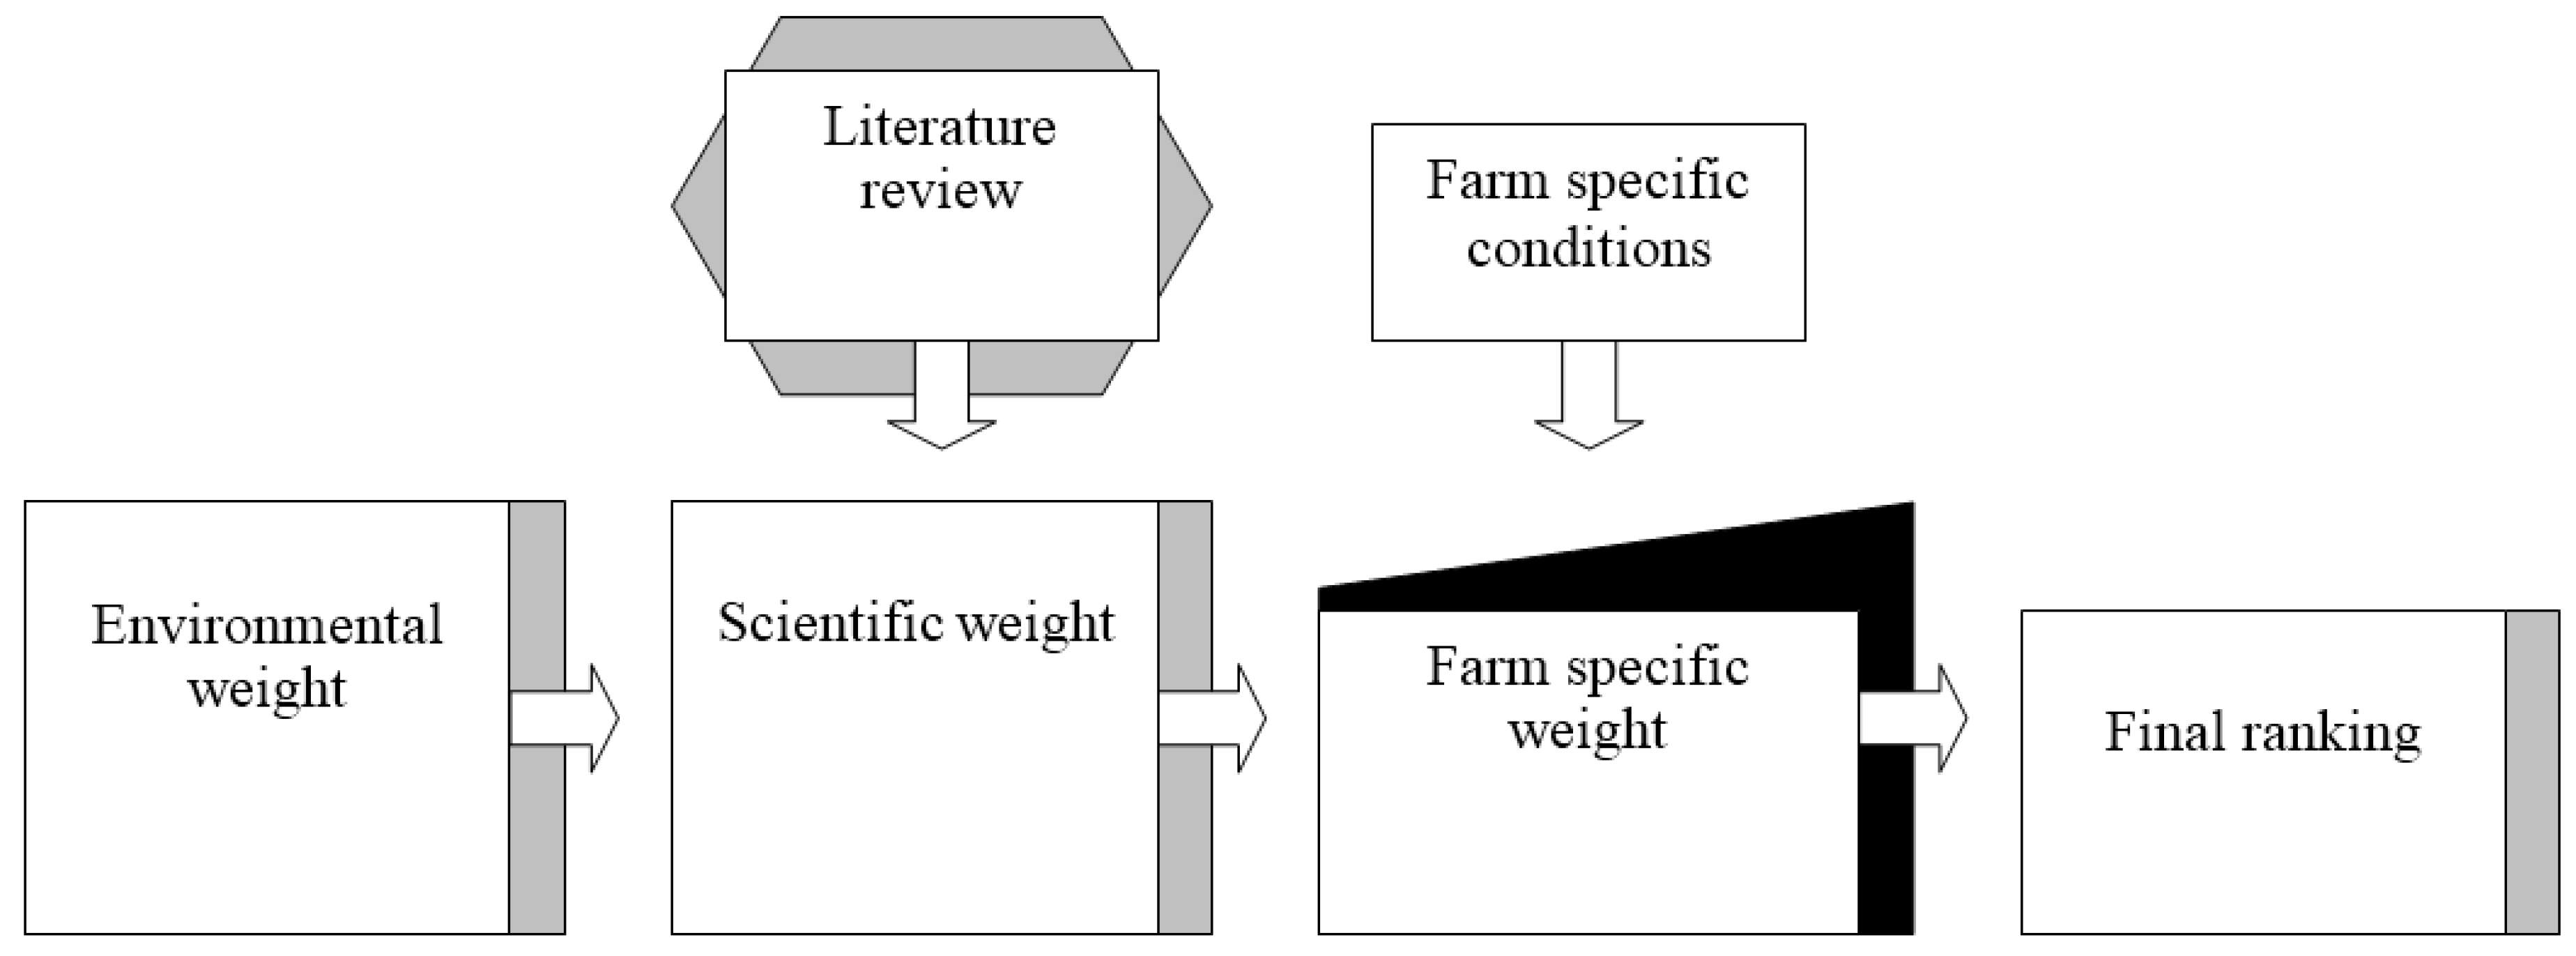
When establishing the prediction framework to rank the environmental benefits of CTF, several environmental threats were identified as key threats needed for the successful development of the matrix. The development of the prediction framework was based on three weighting systems, namely, environmental, scientific, and farm specific parameters (
Figure 1). The framework was established based on a number of assumptions:
Environmental weight: Here 75% of weighting was assigned to soil threats and 25% for secondary issues. The importance of each of the soil threats was obtained from answers to a survey questionnaire carried out by the EU.
Scientific weight: Here also 75% of weighting was assigned to soil threats and 25% for secondary issues. The importance of each soil threat was evaluated based on the number of studies found in the literature confirming the positive or negative influence of the CTF relative to the random traffic. The magnitude of CTF benefit was calculated based on the % of benefit (e.g., in energy saving), as compared to random traffic.
Probability of occurrence and scale of problem is estimated by ten parameters, which are given two levels of internal weight/influence.
Figure 1.
The general structure of the framework for the calculation of the environmental benefits of controlled traffic farming (CTF).
Figure 1.
The general structure of the framework for the calculation of the environmental benefits of controlled traffic farming (CTF).
The framework was built using Microsoft Excel, to ensure that the framework was flexible and easily amendable, as a complex model is harder to develop, understand, and validate [
34].
Furthermore, a critical requirement when developing scoring functions in functional models is to document why a particular value was chosen as baseline or threshold value. Therefore, a thorough search and documentation of farm specific parameters and their ranges to be considered in this framework was undertaken.
Environmental Weighting. Under the Thematic Strategy for Soil Protection, a soil framework directive prepared by the European Commission (EU Framework Directive 232, 2006) [
35] identified nine soil threats, namely, soil compaction, soil erosion, organic matter decline, contamination, salinisation, soil biodiversity loss, sealing, landslides, and flooding. It was prepared after a web survey provided by soil scientists and research organisations. In this study, only environmental threats that are directly affected by implementing CTF were considered. These were ranked in the Framework Directive in dissenting order as; soil compaction, soil erosion, soil biodiversity loss, and soil organic matter decline. This ranking system was incorporated into the framework, and these soil threats were considered as the main environmental parameters.
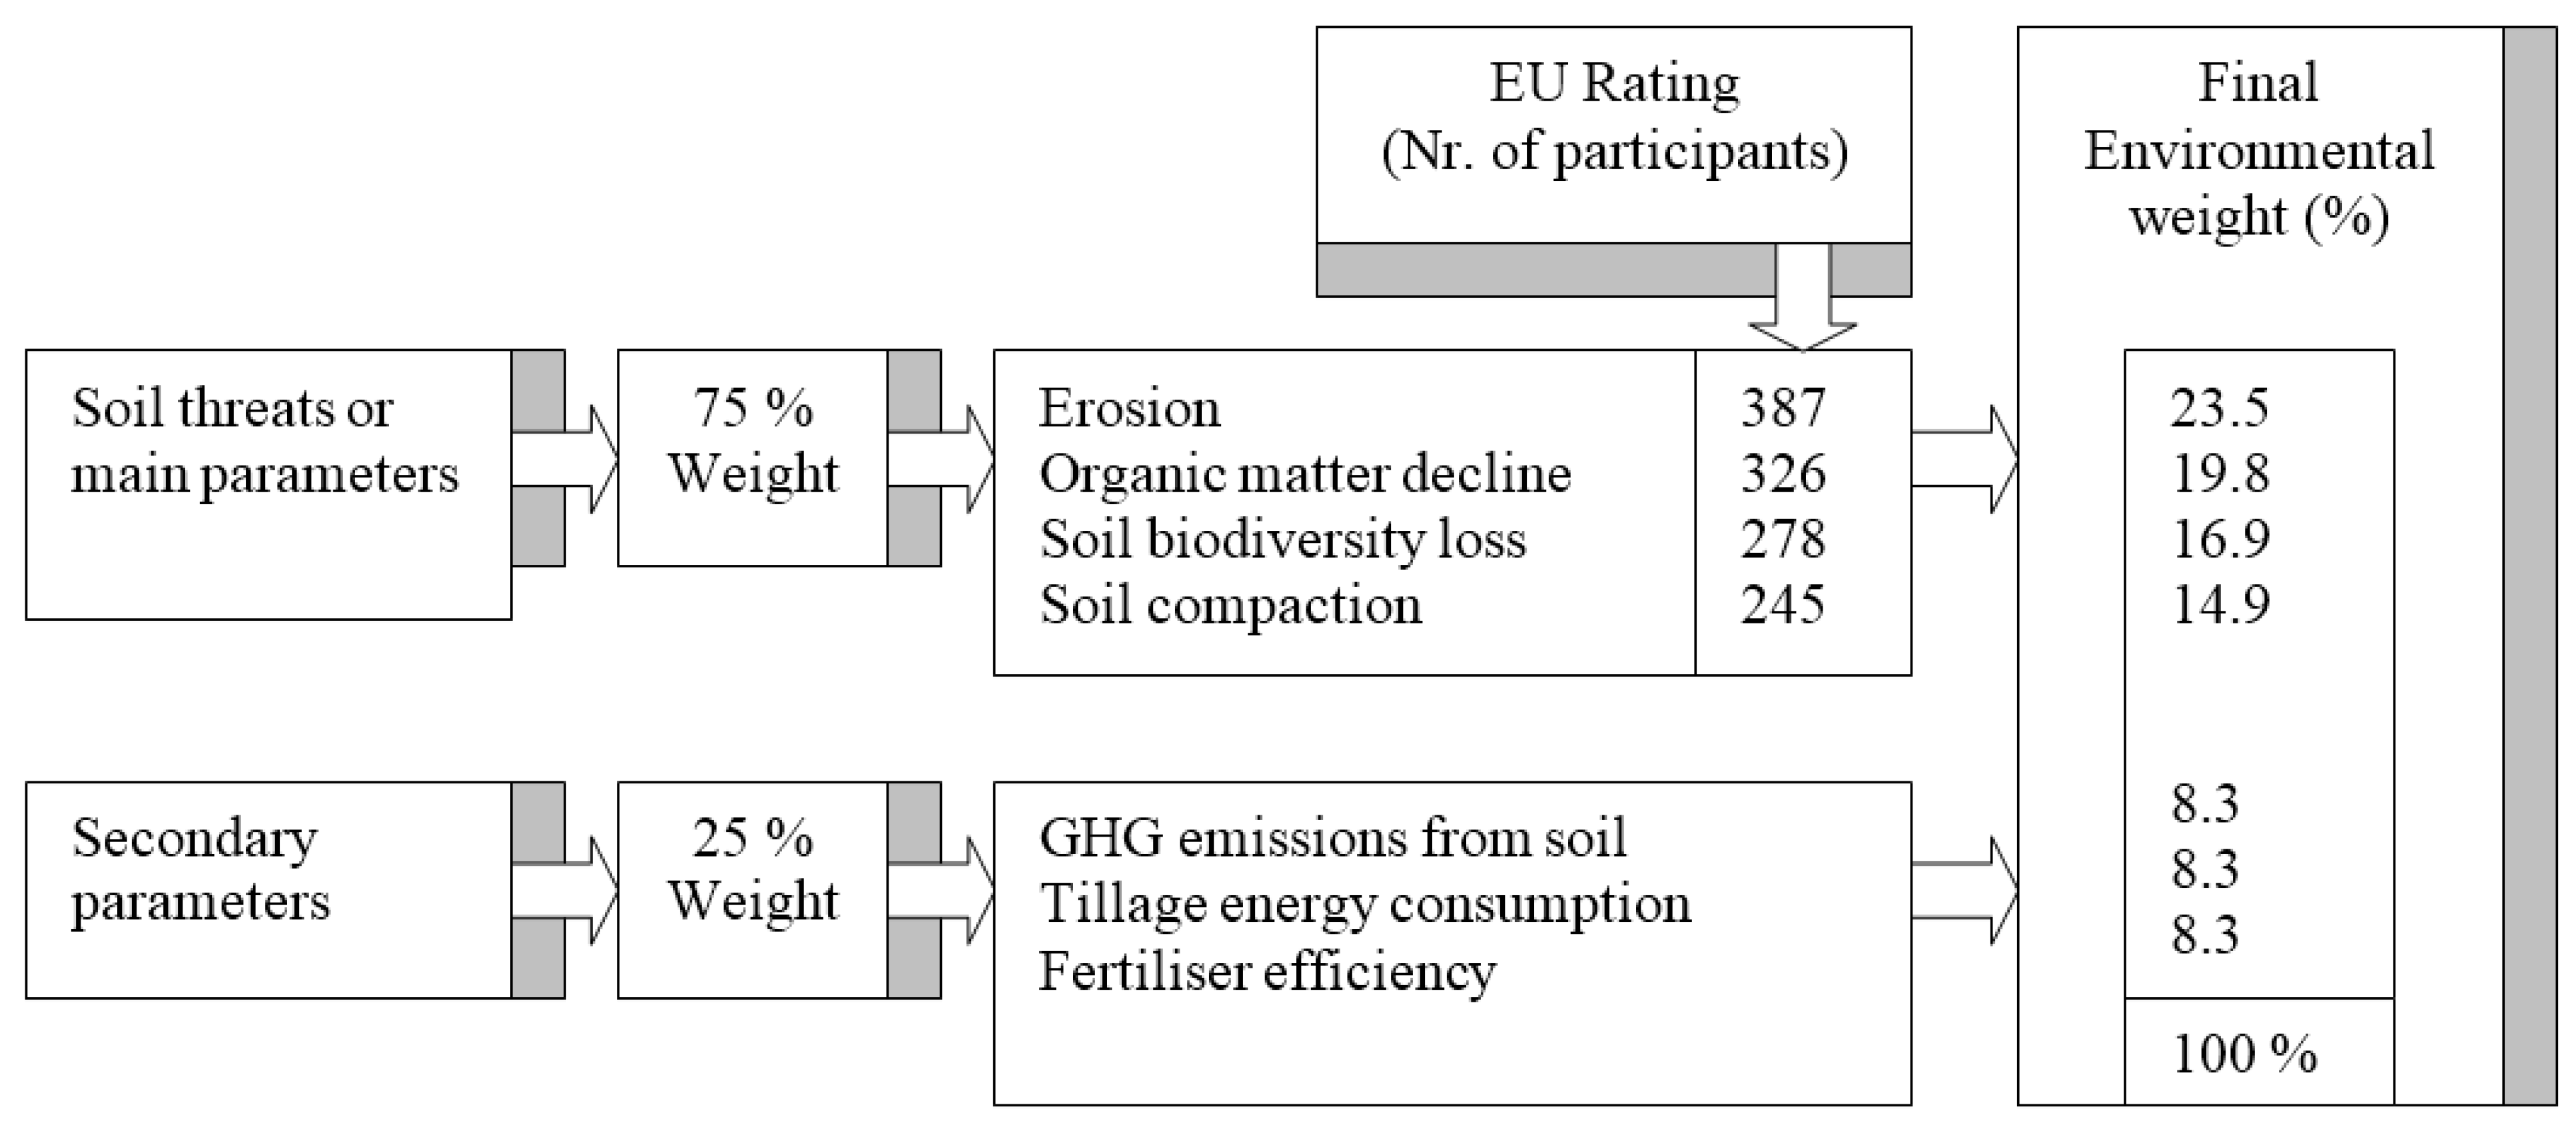
Other parameters with indirect environmental benefits of CTF were identified as secondary environmental parameters, such as reduced GHG emissions from soil, reduced energy requirement of tillage, and increased fertiliser efficiency. However, these secondary parameters were not included in the EC Soil Framework Directive. The secondary parameters were assigned a weighting of 25% of the total environmental weighting to be divided equally among them, whereas the remaining 75% weighting was assigned to the main environmental parameters (soil threats). The structure of the environmental weighting part of the framework is illustrated in
Figure 2.
Figure 2.
Environmental weighing system of prediction framework of environmental benefits of controlled traffic farming (CTF).
Figure 2.
Environmental weighing system of prediction framework of environmental benefits of controlled traffic farming (CTF).
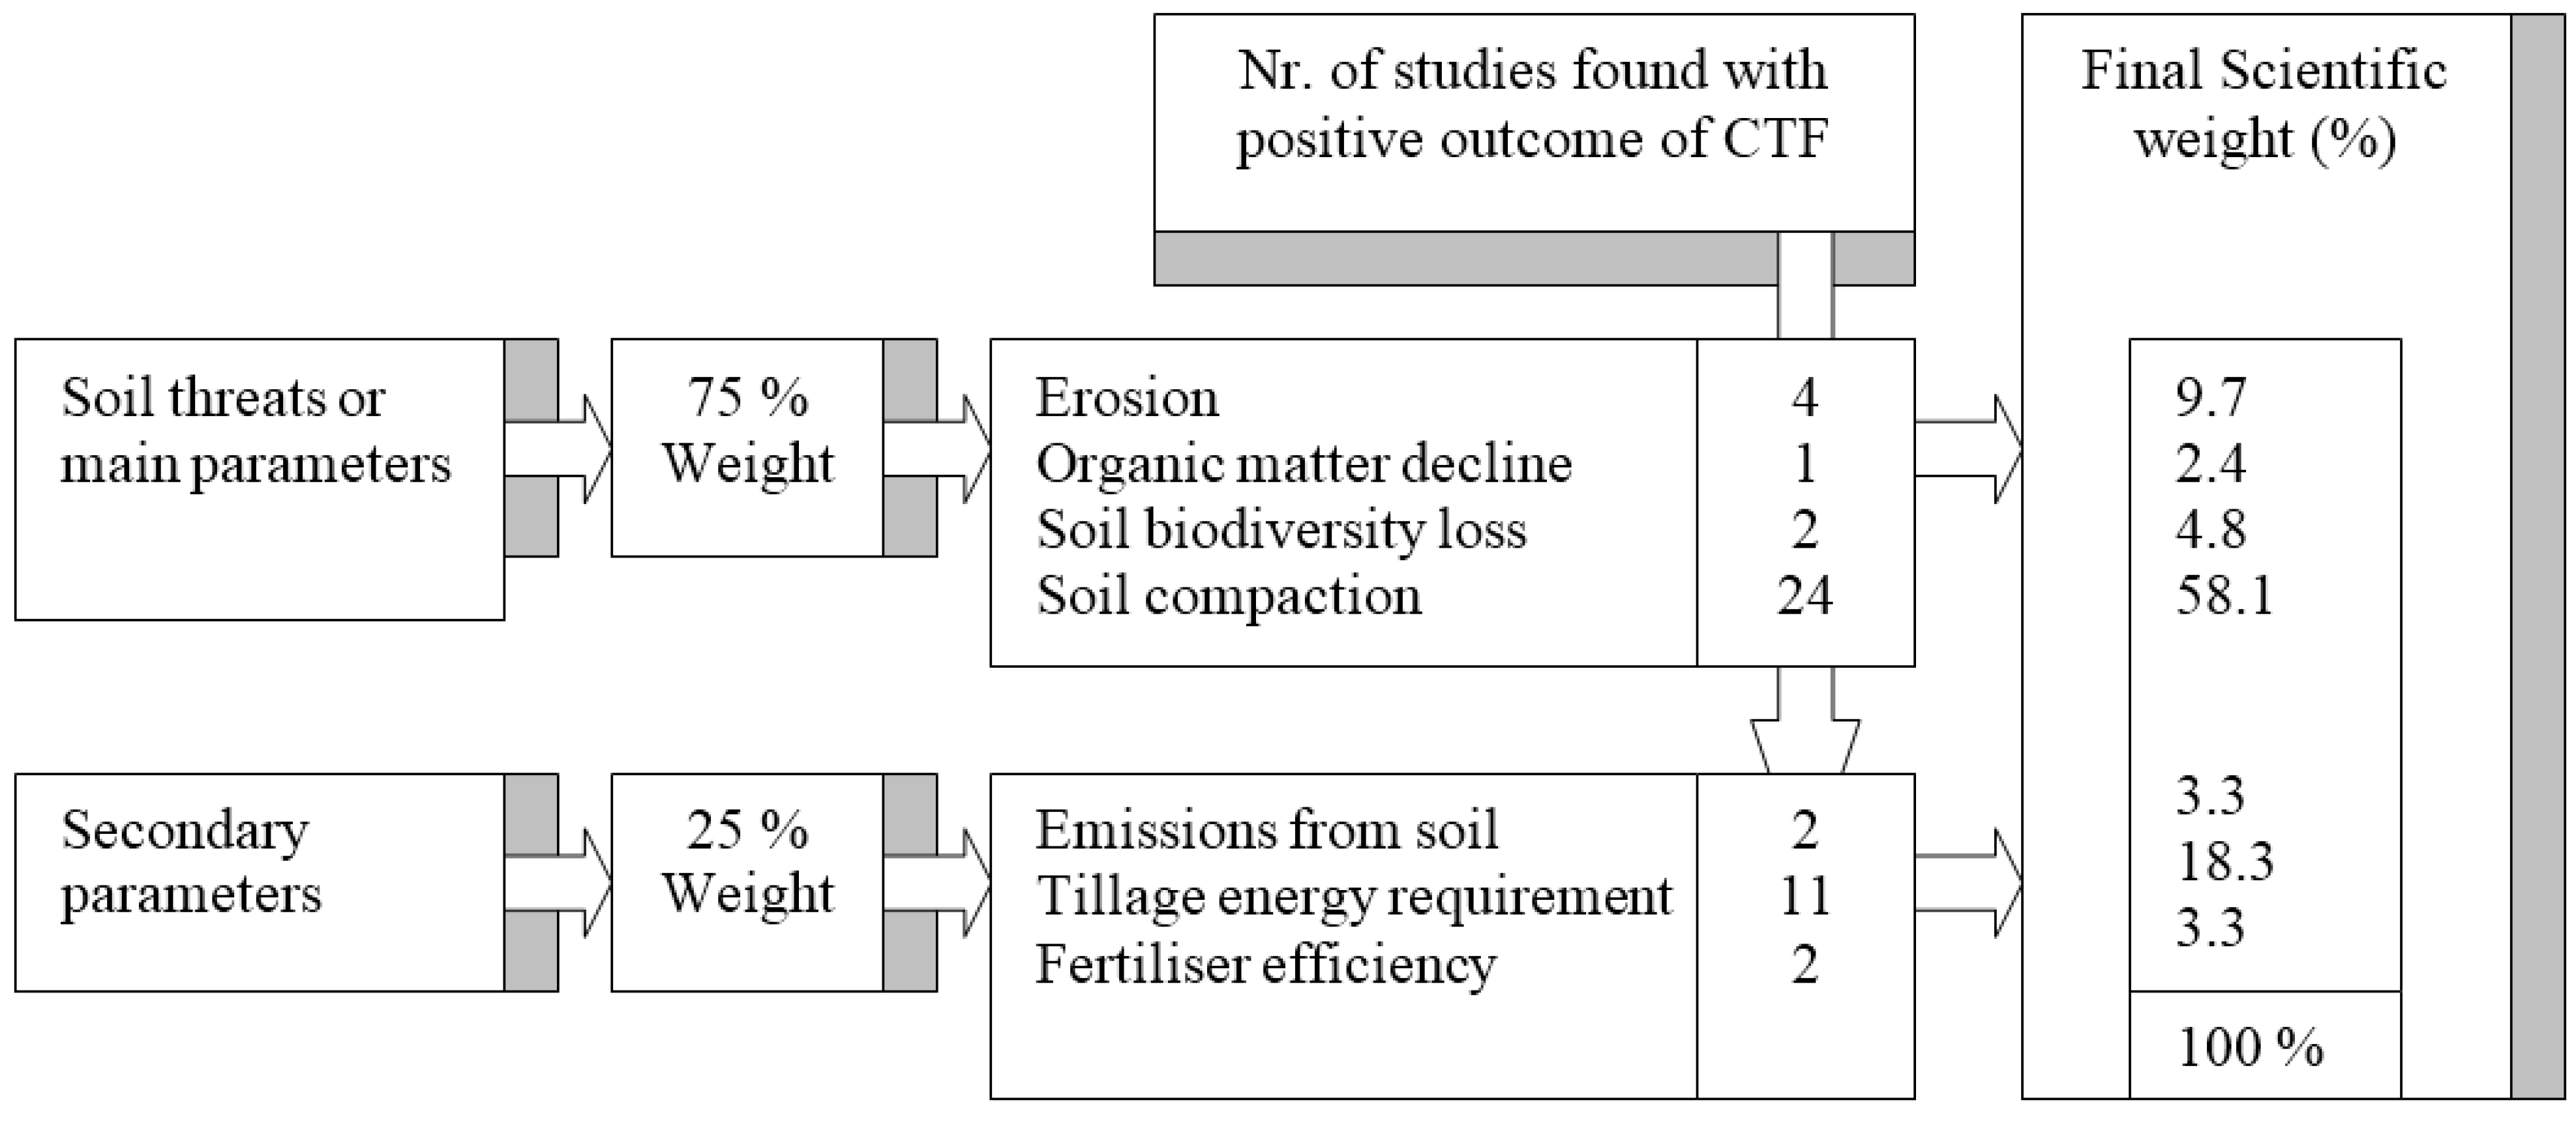
Scientific Weighting. A comprehensive literature review on CTF has been carried out to evaluate the scientific weighting based on the number of studies reported with positive effect in reducing the level of any of the main or secondary environmental parameters. Many journal papers, reports, and books on CTF were closely examined. However, a much larger number of studies available on e.g., soil compaction under RT can be found in the literature, which was not included in the scientific weighting of the framework. The reader is referred to the
Appendix for more details about the studies used to calculate the weighting factors.
Studies about the environmental benefits of CTF were categorised under one soil threat and/or secondary parameter. The number of studies reported about a parameter was adopted to determine the scientific weight of that parameter. Some studies considered different parameters to represent a threat, e.g., soil compaction was indicated by BD, PR and/or infiltration rate. When the same study considered multiple compaction measures, the study was weighted once in the framework to eliminate double or triple weighting of a given parameter. Again the main environmental parameters were given 75% of the total scientific weighting, whereas the secondary parameters were given a total weighting of 25%. The structure of the scientific weighting part of the framework is illustrated in
Figure 3.
Figure 3.
Scientific weighing system of prediction framework of environmental benefits of controlled traffic farming (CTF).
Figure 3.
Scientific weighing system of prediction framework of environmental benefits of controlled traffic farming (CTF).
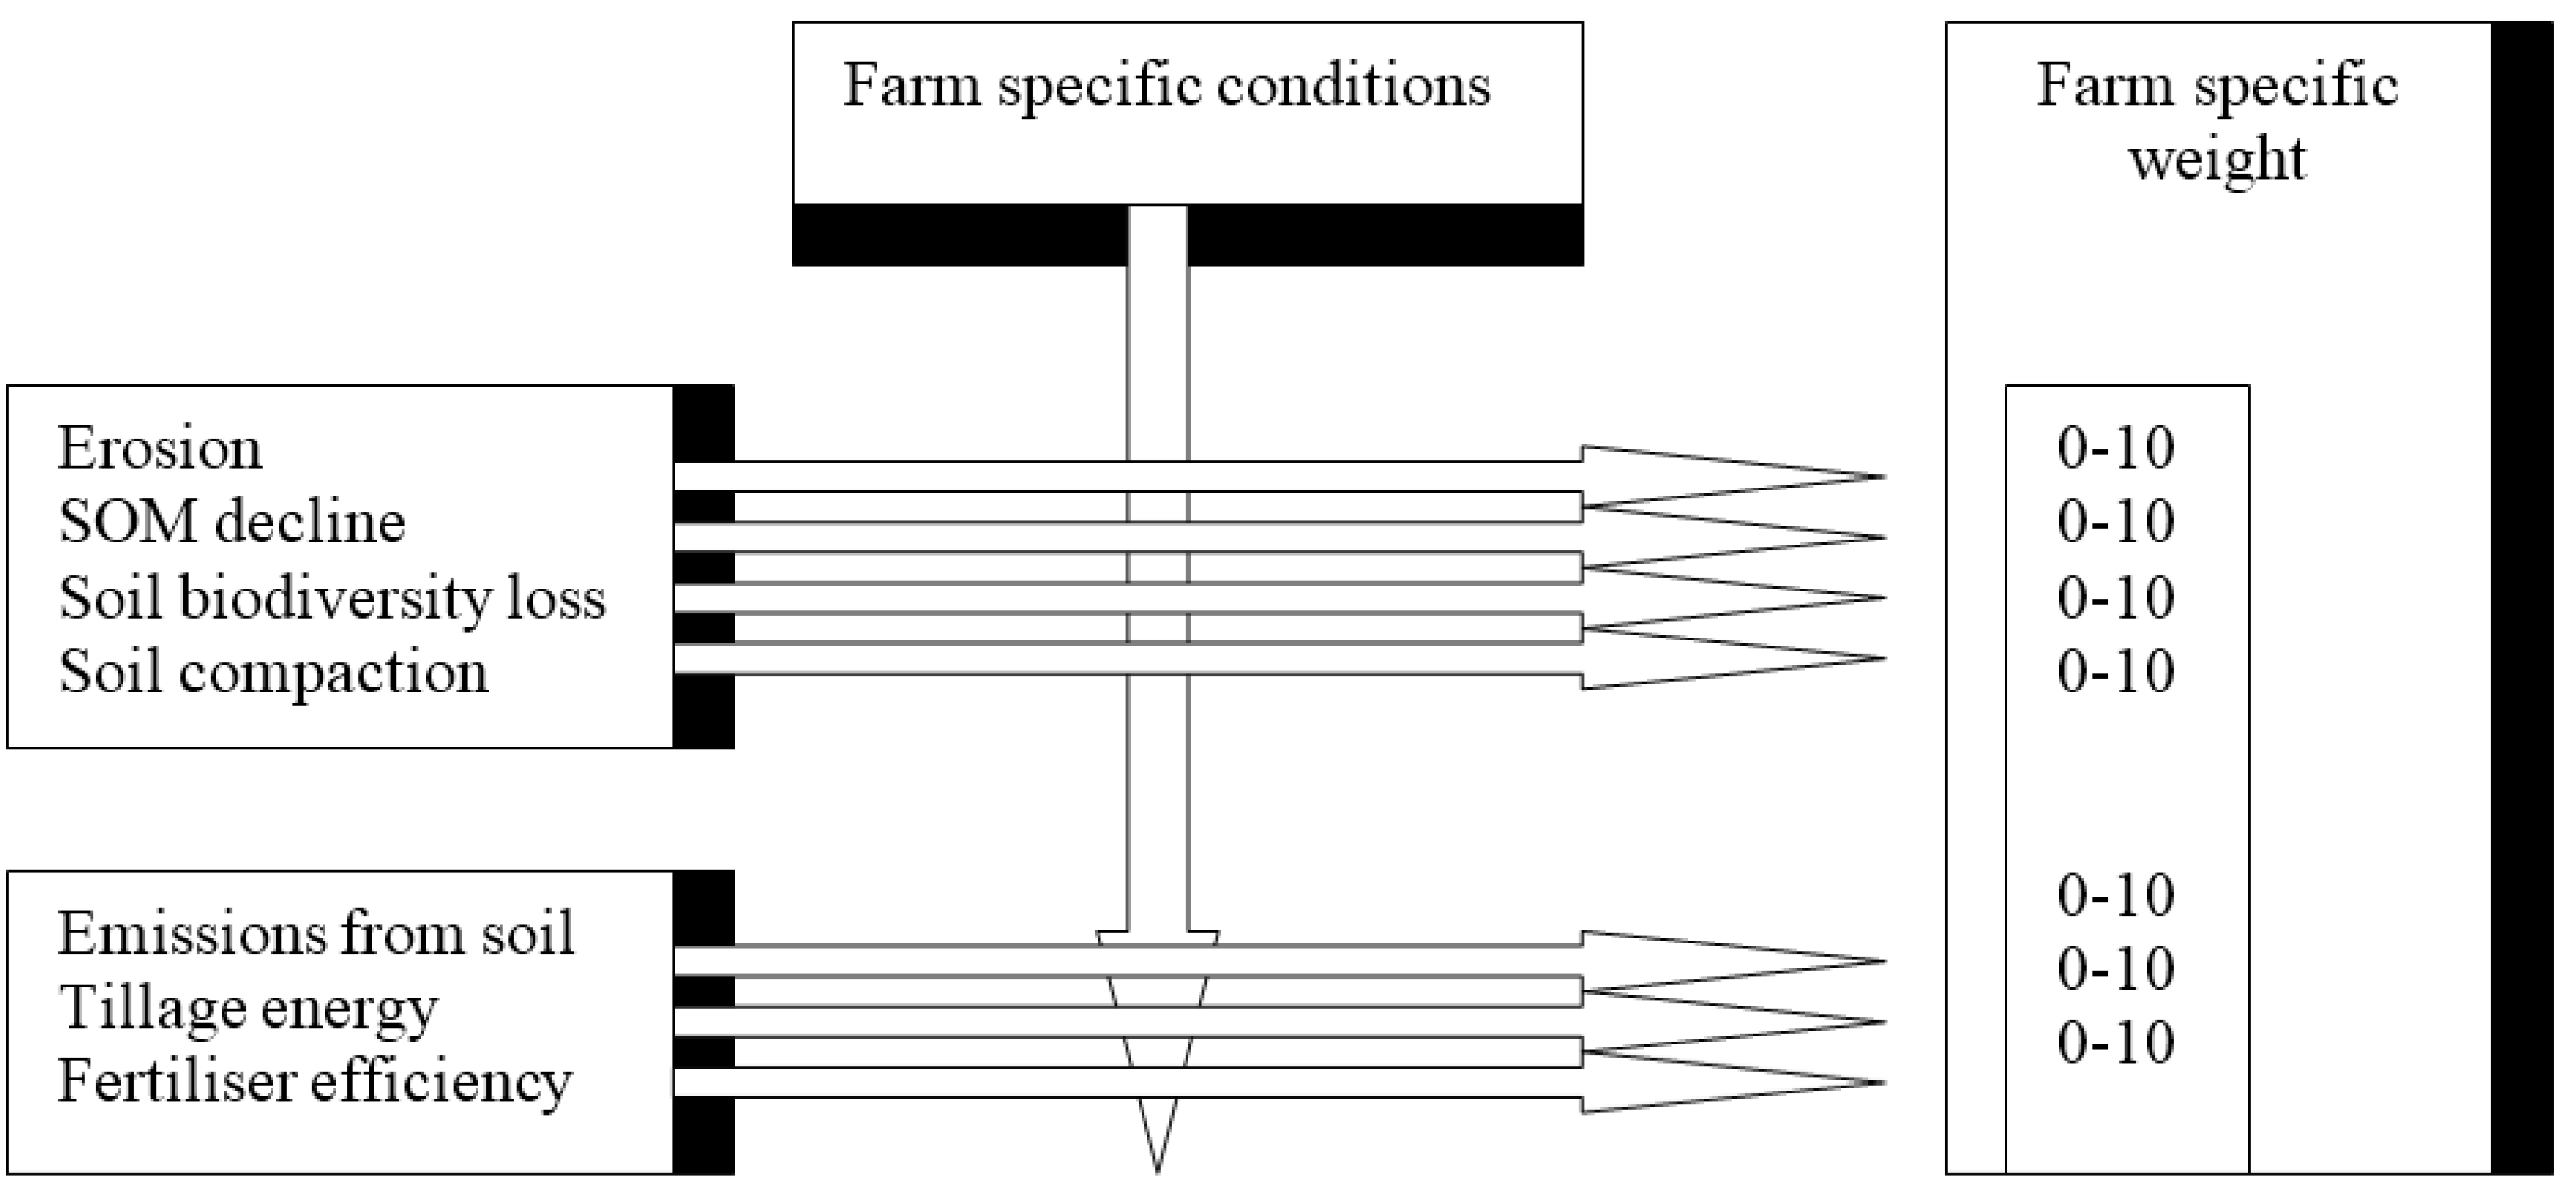
Weighting of Farm Specific Parameters. The parameters considered as farm specific parameters were those related to selected soil properties, climate conditions, topography, and existing machinery system in the farm. These were soil moisture content at traffic and at tillage, annual rainfall, slope length and steepness, machine parameters, present tillage system (no tillage, reduced tillage and conventional tillage), soil texture, BD at traffic and at tillage, and SOM content. Each parameter was given a weighting factor ranged between 0 and 10, which affects the final ranking of the environmental benefits. The structure of the farm specific part of the framework is illustrated in
Figure 4. Each farm specific parameter was assigned one or two +, based on its impact on soil threats and on secondary parameters (
Table 1).
Figure 4.
The structure of framework part related to farm specific parameters.
Figure 4.
The structure of framework part related to farm specific parameters.
Table 1.
Impact of farm specific parameters.
Table 1.
Impact of farm specific parameters.
| Item | Moisture at traffic | Moisture at tillage | Rainfall | Slope | Machine parameter | Present tillage system | Soil texture | Bulk density in traffic zones | Bulk density in tillage zones | Soil organic matter |
|---|
| Soil erosion | | | + 1 | + | | + | + | | | + |
| soil organic matter decline | | | | | | + | + | | | |
| Soil biodiversity loss | | | | | | ++ 2 | + | | | + |
| Soil compaction | ++ | | | | ++ | | + | + | | + |
| Emissions from soil | | | ++ | | | | | ++ | | |
| Tillage energy | | ++ | | | | ++ | + | | ++ | |
| Fertiliser effeciency 3 | | | | | | | | | | |
A parameter having a major influence scored two +, whereas a parameter having minor influence scored one + only. This impact categorisation was based on information available in the literature concerning CTF, as described here below.
Moisture Content at Traffic and at Tillage. The effect of soil moisture content on compaction occurrence is difficult to predict, since this is also dependent on soil texture, BD, and organic matter content. Based on the Proctor test, literature has shown optimal moisture contents for compaction occurrence, which varies with soil texture [
36]. For simplicity, gravimetric soil moisture content was classified, with a linear scale into four different categories. In general, the wetter the soil at traffic, the lower is the soil resistance to compaction occurrence. Also, the dryer the soil at tillage, the higher is the draught and energy requirement of tillage. Based on these four categories a simple classification system of the framework impact points for moisture content, similar to that proposed by Spoor
et al., 2003 [
37] was adopted (
Table 2).
Table 2.
Impact points of moisture content.
Table 2.
Impact points of moisture content.
| Wetness Condition | Impact Points |
|---|
| Wet (close to field capacity) | 10 |
| Moist | 7 |
| Dry (approaching permanent wilting point) | 4 |
| Very dry | 0 |
If the framework is to be more precise in defining the exact trend of compaction occurrence according to soil moisture content during traffic for different soil textures, a more complicated function that correlates soil compaction occurrence with moisture content has to be adopted based on experimental data. Nonetheless, both moisture contents at traffic and at tillage are classified according to
Table 2, with the moisture content at traffic has a negative effect on soil compaction occurrence, whereas soil moisture content at tillage has a positive effect on energy consumption due to tillage operations.
Rainfall. The mean annual precipitation was considered in the framework as the factor affecting erosion. High precipitation can also lead to increased soil moisture content, which in turn leads to increased GHG emission under anaerobic conditions. The scale of conversion proposed was linear with the exception of a smaller step at the lowest precipitation to distinguish the places with very low rainfall (
Table 3).
Table 3.
Impact points of rainfall.
Table 3.
Impact points of rainfall.
| Mean annual Precipitation (mm) | Impact Points |
|---|
| >2000 | 10 |
| 15,000–2000 | 8 |
| 1000–1500 | 6 |
| 500–1000 | 4 |
| 250–500 | 2 |
| Under 250 | 0 |
Slope. The impact points for slope (SL) designated as slope factor (SF) were calculated in a similar way to that of the universal soil loss equation (USLE) method, by substituting the values of average slope steepness and length into Equation (1).
where: SF is slope factor, S is slope steepness (%), L is slope length (m) and n is a constant calculated according to the slope value (
Table 4).
Table 4.
Values of constant n for different values of slope.
Table 4.
Values of constant n for different values of slope.
| Slope (%) | <1 | 1 < Slope < 3 | 3 < Slope < 5 | >5 |
|---|
| n | 0.2 | 0.3 | 0.4 | 0.5 |
The final weighting scale was transformed into a framework of impact points using SF values calculated from Equation (1), and reported in
Table 5.
Table 5.
Impact points of slope.
Table 5.
Impact points of slope.
| Slope Factor | Impact Points |
|---|
| > 1.5 | 10 |
| 1.0–1.5 | 7 |
| 0.5–1.0 | 4 |
| < 0.5 | 0 |
Machine Parameters. No precise relationship between axle load and soil compaction exists, probably because of the fact that there are many other factors affecting soil compaction occurrence. However, practical experience (thanks to the anonymous reviewer) showed a large axle load of 18 Mg to cause severe yield losses (at least 10%), whereas a 9 Mg load caused only short term damage to the soil and minor yield loss. Therefore, farms with light loads are less likely to benefit from CTF and less likely to adopt it regardless of environmental benefits.
The relative importance of tyre inflation pressure and axel load has been disputed for a long time [
38]. The combination determines the compaction level, although the severity of compaction declines with depth. However, it is a challenge to create a simple model that can predict the actual level of compaction, as related to axle load and inflation pressure, since there is still an inter-correlation between those factors and other factors [
38]. In the framework, the impact of the axle load and tyre inflation pressure during one crop cycle was considered.
The scale for this framework was based on a simple “rule of thumb” that the soil can withstand compaction damage from axle loads up to 6 Mg and 7.5 Mg at inflation pressure values of 150 kPa and 100 KPa, respectively [
39]. From those two values, a linear regression was carried out to derive a matrix (not shown) about the impact of both tyre inflation pressure and axle load, which was used to derive the framework impact points.
Present Tillage System. The tillage system affects several soil threats and secondary parameters in the framework. In general, the higher the tillage intensity, the larger is the effect.
Table 6 shows the framework impact points considered for different tillage systems. Conventional tillage represents primary tillage by mouldboard or disc plough followed by discs and/or tine harrows
etc. and drilling with at least three passages. Reduced tillage involves shallow tillage followed by drilling, whereas no tillage consists of only direct drilling of soil.
Texture. The classification of texture considered in this study was based on FAO standard triangle soil texture classification. A scale of soil vulnerability to compaction proposed by Spoor
et al., 2003 [
37] formed the basis to establish impact points of different textures (
Table 7). For example, clay soils were considered less vulnerable to compaction when compared to sandy soils at a same moisture content level.
Table 6.
Impact points of tillage system.
Table 6.
Impact points of tillage system.
| Tillage System | Impact Points |
|---|
| Conventional tillage | 10 |
| Reduced tillage | 5 |
| No tillage | 0 |
Table 7.
Impact points of soil texture.
Table 7.
Impact points of soil texture.
| Texture (FAO–UNESCO) | Impact Points |
|---|
| Light soils | Coarse
Medium (<18% clay)
Medium fine (<18% clay) | 10 |
| Medium soils | Medium (>18% clay)
Medium fine (>18% clay) | 5 |
| Heavy soils | Fine
Very fine | 0 |
Bulk Density at Traffic and at Tillage. Soil BD is a measure of soil compaction, which unlike PR is independent on moisture content at sampling [
40]. Therefore, BD was adopted, since it is a more reliable measurement for establishing the scale of impact points. Furthermore, soil texture had to be taken into account, since BD is a function of soil texture [
41]. The impact points scale, provided in
Table 8 was based on a guideline for seedbed compaction [
42], where BD has a different impact depending on the soil type considered. The limiting BD for root growth generally ranges from 1.45 Mg m
−3 for clay soils to 1.85 Mg m
−3 for loamy sands [
41], which proves that
Table 8 is of the correct magnitude.
Table 8.
Impact points of bulk density (BD).
Table 8.
Impact points of bulk density (BD).
| Bulk Density (Mg m−3) | Impact Points |
|---|
| Light (Sandy) Soils | Medium (Loams) | Heavy (Clay) Soils |
|---|
| > 1.8 | 10 | - | - |
| 1.6–1.8 | 8 | 10 | 10 |
| 1.4–1.6 | 5 | 5 | 8 |
| 1.2–1.4 | 1 | 3 | 5 |
| < 1.2 | 0 | 1 | 3 |
Soil Organic Matter. The “base limit” of SOM was correlated with clay content, so that the minimal SOM content tended to rise with clay content [
43]. However, very limited data are available to make a texture based scale for SOM, and hence a simple linear scale was proposed (
Table 9).
Table 9.
Impact points of soil organic matter (SOM).
Table 9.
Impact points of soil organic matter (SOM).
| Soil Organic Matter Content (%) | <0.5 | 0.5–1.5 | 1.5–2.5 | 2.5–3.5 | 3.5–4.5 | 4.5< |
|---|
| Impact points | 10 | 8 | 6 | 4 | 2 | 0 |
Erosion Factor Using USLE. The USLE is an empirical model to calculate soil erodability as a function of dimension and dimensionless factors. However, if metric units are used to obtain the rainfall erosivity factor, a metrical value of soil loss will be derived according to the following equation [
44].
where: E is the mean annual soil loss according to USLE (Mg ha
−1), R is the rainfall erosivity factor (MJ ha
−1 mm h
−1), K is the soil erodibility factor, L × S is the slope factor, C is the crop management factor and P is the erosion control practice factor.
A USLE value estimating soil loss for a site or a field can be transformed into a framework point, as shown in
Table 10, which was constructed after a classification proposed by Morgan (2005) [
44]. When USLE is to be considered, the individual weight of the other factors involved in the calculation of the erosion factor has to be omitted from the matrix. This included rainfall, slope, soil organic matter and texture. In this case, the impact of moisture content at traffic and at tillage, machine parameters, present tillage system, bulk density at traffic and at tillage, and erosion factor using USLE were only considered.
Table 10.
Impact points of universal soil loss equation (USLE).
Table 10.
Impact points of universal soil loss equation (USLE).
| Soil Loss According to USLE (t ha−1) | Impact Points |
|---|
| >10 High | 10 |
| 5–10 Moderate | 7 |
| 2–5 Slight | 4 |
| <2 Very slight | 0 |
2.2. Effect of Farm Specific Parameters on Environmental Threats and Secondary Parameters
Soil Erosion. Erosion is a complicated environmental threat, whose occurrence is affected by many parameters. Morgan (2005) [
44] identified a number of parameters affecting soil erosion, namely, rainfall amount and intensity, soil structure and texture, SOM, permeability, slope length and steepness, land use, and land cover. In the framework presented in this paper, all farm specific parameters, were considered equally to have a minor influence (one +) on erosion. However, since there already existed models on erosion prediction e.g., USLE [
44] it would probably be more scientifically sound to use the USLE model, expressed as an erosion factor. This is particularly because of the fact that the internal weighting of parameters in USLE is more advanced and precise than that proposed for the specific farm parameters considered in the framework. Therefore, the calculation of erosion occurrence in the excel sheet matrix allowed for the use of both either the farm specific parameters or the erosion factor based on the USLE model. However, due to its relative simplicity the former option might be a better option for farmers.
Soil Organic Matter Decline. It is a challenge to find consistent data on factors affecting SOM decline. This is because some researchers suggested that no tillage systems might increase SOM content [
45], whereas others stated that SOM is just relocated with depth [
46,
47]. However, the predominant result after a comprehensive evaluation of a large number of studies worldwide suggested that no tillage and reduced tillage systems, in descending order, increase SOM [
48]. In conclusion, the present tillage system was regarded in the present study to have a minor influence (one +) on SOM decline. Even though, no literature about a high declining rate of SOM was found for any soil texture, texture was regarded as having a minor effect on SOM decline in the framework. This is because of the important water holding capacity and aggregate building capability and stability of SOM, which is particularly important for sandy soils. In fact, SOM decline is a larger problem on sandy than on clayey soils.
Soil Biodiversity. The incidence of occurrence of earthworms was studied by Pangnakorn
et al., 2003 [
24], who found that absence of tillage had a large positive effect on the occurrence. Also, fungal and bacterial biomasses were higher in surface soil when less disturbed by tillage [
49]. Thus, the present tillage system was regarded as being a major influencing factor on soil biodiversity. In a model used by Fox
et al., 2004 [
50], the number of earthworms was positively correlated with increasing SOM and clay content. Consequently, soil biodiversity decline can be regarded as being a bigger problem in sandy soils with low organic matter. Therefore, texture and SOM were considered to have a minor influence on soil biodiversity in the framework.
Soil Compaction. The fact that soil compaction is, to a large extent, affected by the moisture content of the soil during traffic and by machine parameters (size, tyre inflation pressure,
etc.) is well accepted and also supported by researchers [
33]. Therefore, these parameters were regarded to have the major effect (two +) on soil compaction. Since SOM has marginal influence on compaction [
33] it was considered to have only a minor effect in the framework. The vulnerability to soil compaction is also, to some extent, affected by soil texture [
37,
51]. However, texture was considered to have a minor effect in the framework. Initial BD at traffic also affects the degree of soil compaction occurrence. Furthermore, a low BD at traffic that occurs after tillage makes soil more vulnerable to compaction [
52]. Therefore, BD at traffic was considered to have a minor influence (one +) in the framework. The same arguments apply to the present tillage system. The higher the intensity of tillage the higher is the soil vulnerability to compaction. However, it is not common to use these three tillage systems worldwide. For instance, Munkholm
et al., 2003 [
53] indicated the low adoption of reduced tillage systems and no tillage in Scandinavia, which was partly attributed to major problems associated with compaction of the topsoil. Therefore, no influence of the tillage system on soil compaction occurrence was assigned in the framework.
Greenhouse Gas (GHG) Emission from Soil. Since soil compaction and soil moisture content have a large effect on N
2O emissions from soil [
29], soil BD at traffic and annual rainfall were regarded as having a major influence (two +) on GHG emissions from soil. The relationship between emissions and tillage practices is not clear and rather complicated. The common idea is that a no tillage system sequesters carbon but this might be offset by a higher level of N
2O emissions [
29,
54]. Therefore, no influence of the tillage system on GHG emission was assigned in the framework.
Energy Requirement of Tillage. Since a positive correlation between draught requirement and BD exists [
55], BD at traffic was regarded as a major factor affecting energy consumption of tillage in the framework. The tillage system has also a major influence on the energy required [
56], since more intensive tillage requires higher energy. It has been demonstrated that a higher moisture content resulted in a lower draught [
55,
57]. Thus, soil moisture content at tillage was considered to be a major influencing factor. Since clay soils (heavy soils) require higher energy to break up during tillage than sandy soils (light soils) [
43], soil texture was considered to have a minor effect on energy consumption by tillage.
Fertiliser Use Efficiency. The benefit of fertiliser use efficiency was given an average value of five, which means that the benefit of CTF is regarded equally high regardless of how the user specifies the other parameters.
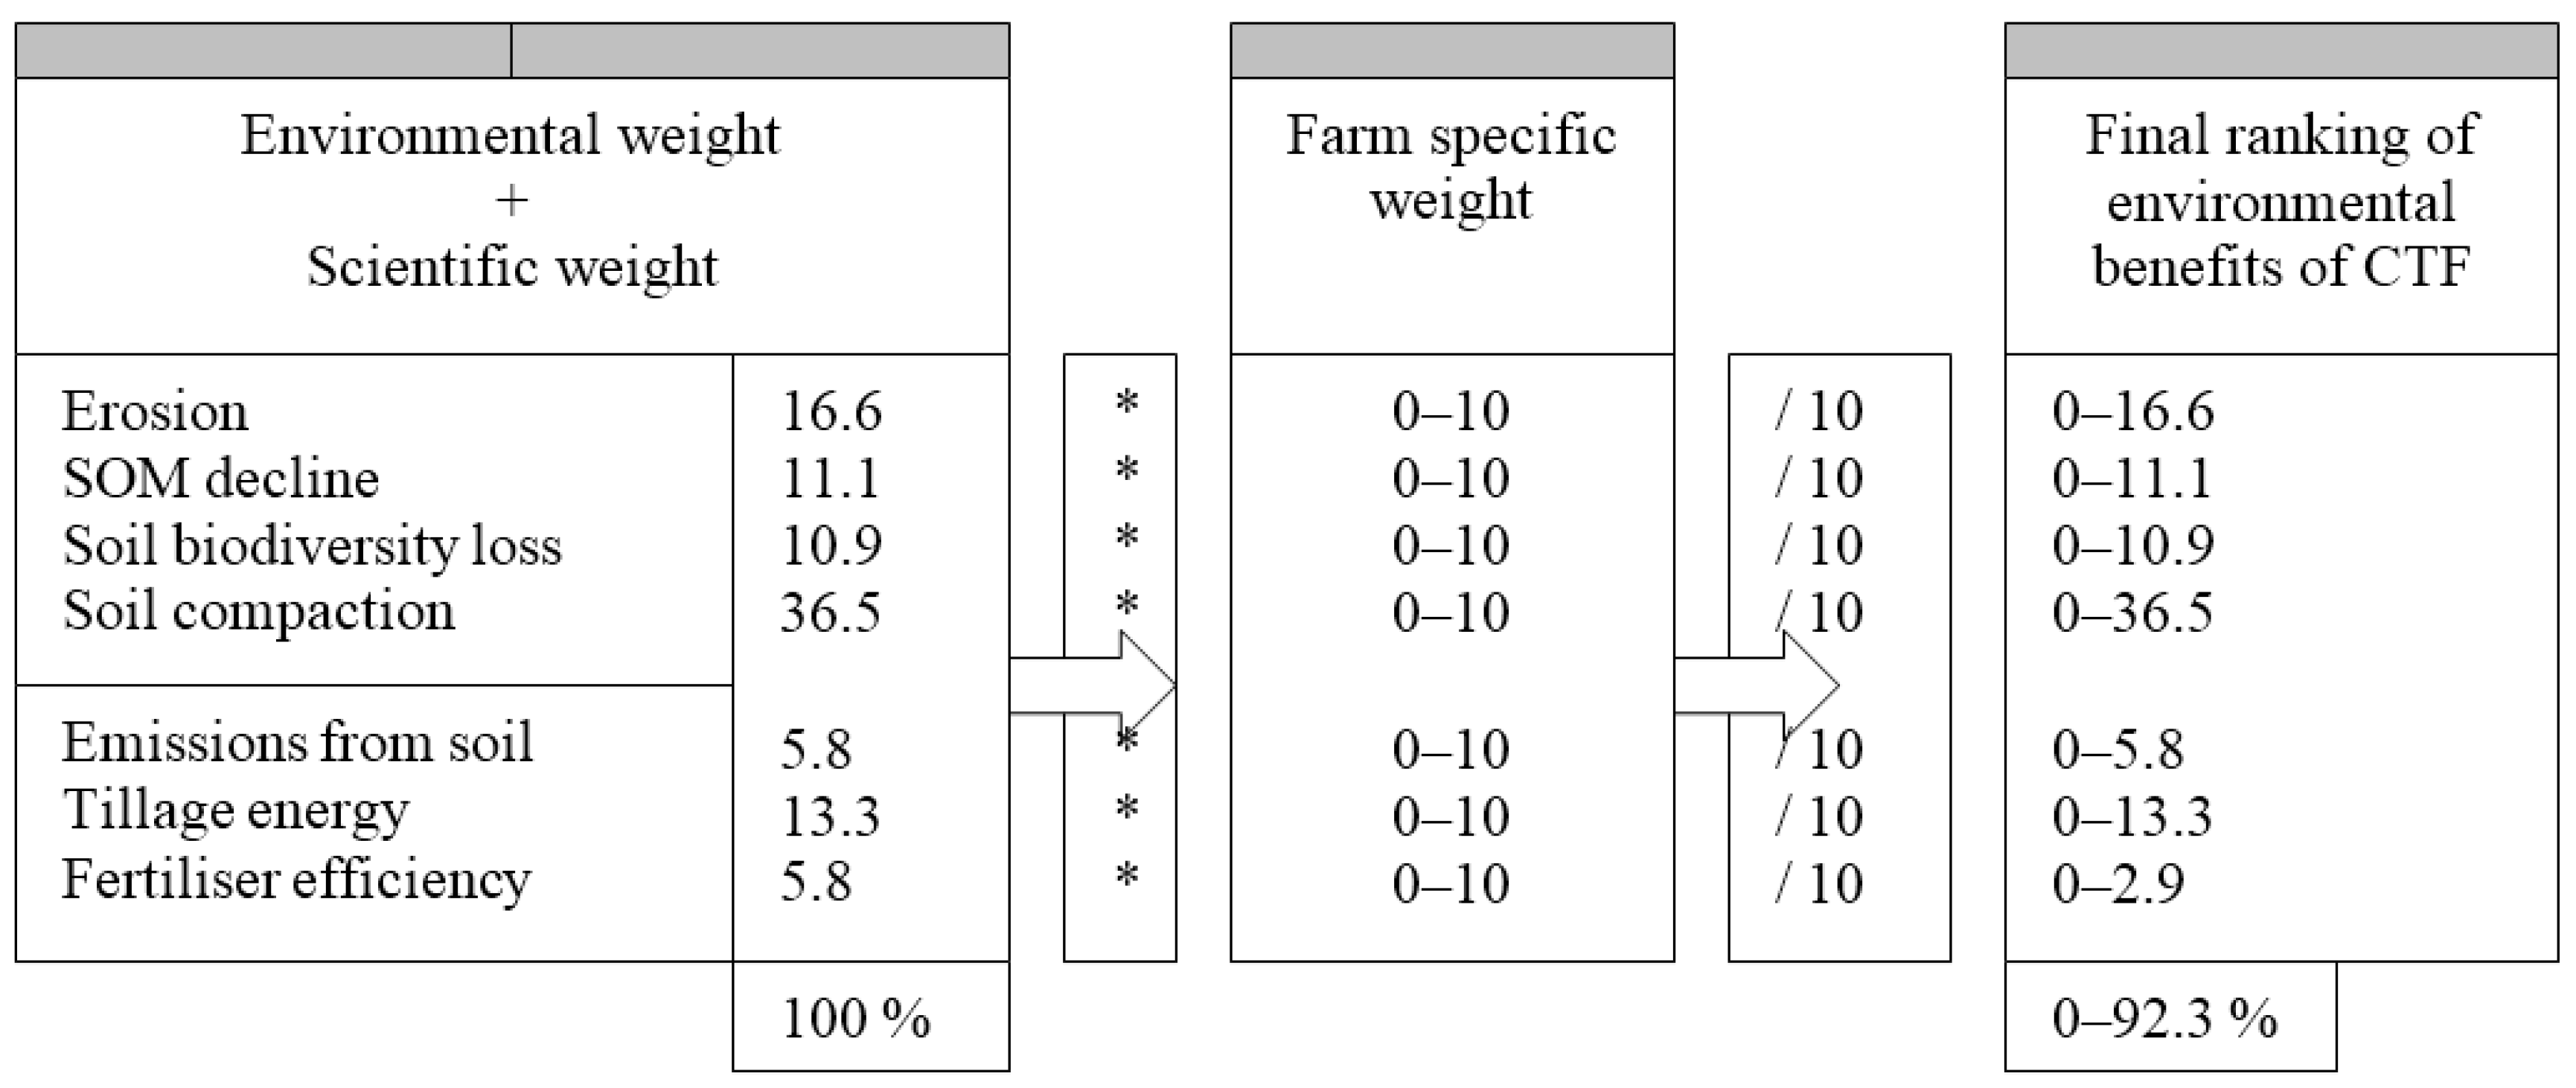
Construction of the Framework. The two different weighting parts, namely, environmental and scientific were combined in the excel-sheet framework, as shown in
Figure 5. The percentage for each individual benefit was then multiplied by the weighting of the farm specific parameters (0–10). The sum of the individual values after dividing by 10 becomes 92.3%.
Figure 5.
Calculation of the overall ranking of the framework.
Figure 5.
Calculation of the overall ranking of the framework.
This percentage was considered to be the maximum achievable environmental benefit at optimal soil and climate conditions, for topography and machinery systems for eliminating or reducing probability of occurrence of soil threats, and for secondary environmental parameters. For example, light rain, small slopes, small size agricultural machinery, stable aggregate soils and texture, etc. would result in reducing the probability of the occurrence of soil threats (e.g., soil erosion or compaction). However, the prevention of occurrence of soil threats is not practically possible and thus the maximum benefit level of 92.3% is not achievable. Therefore, this maximum benefit level was designated as “the theoretical maximum environmental benefit of CTF”.
The constant impact points assigned to the fertiliser efficiency (5), and the contradictory positive and negative impacts of soil moisture content during tillage and compaction is the reason for having a theoretical maximum of 92.3% instead of 100%. To overcome this issue, each individual benefit was rescaled in order to have the final evaluation presented to 100%, allowing the evaluation to range between 0 and 100%.


