
Comparison Analysis and Evaluation of Urban Competitiveness in Chinese Urban Clusters

Abstract
:1. Introduction
2. An Evaluation Index System for Urban Competitiveness
2.1. Urban Competitiveness Model
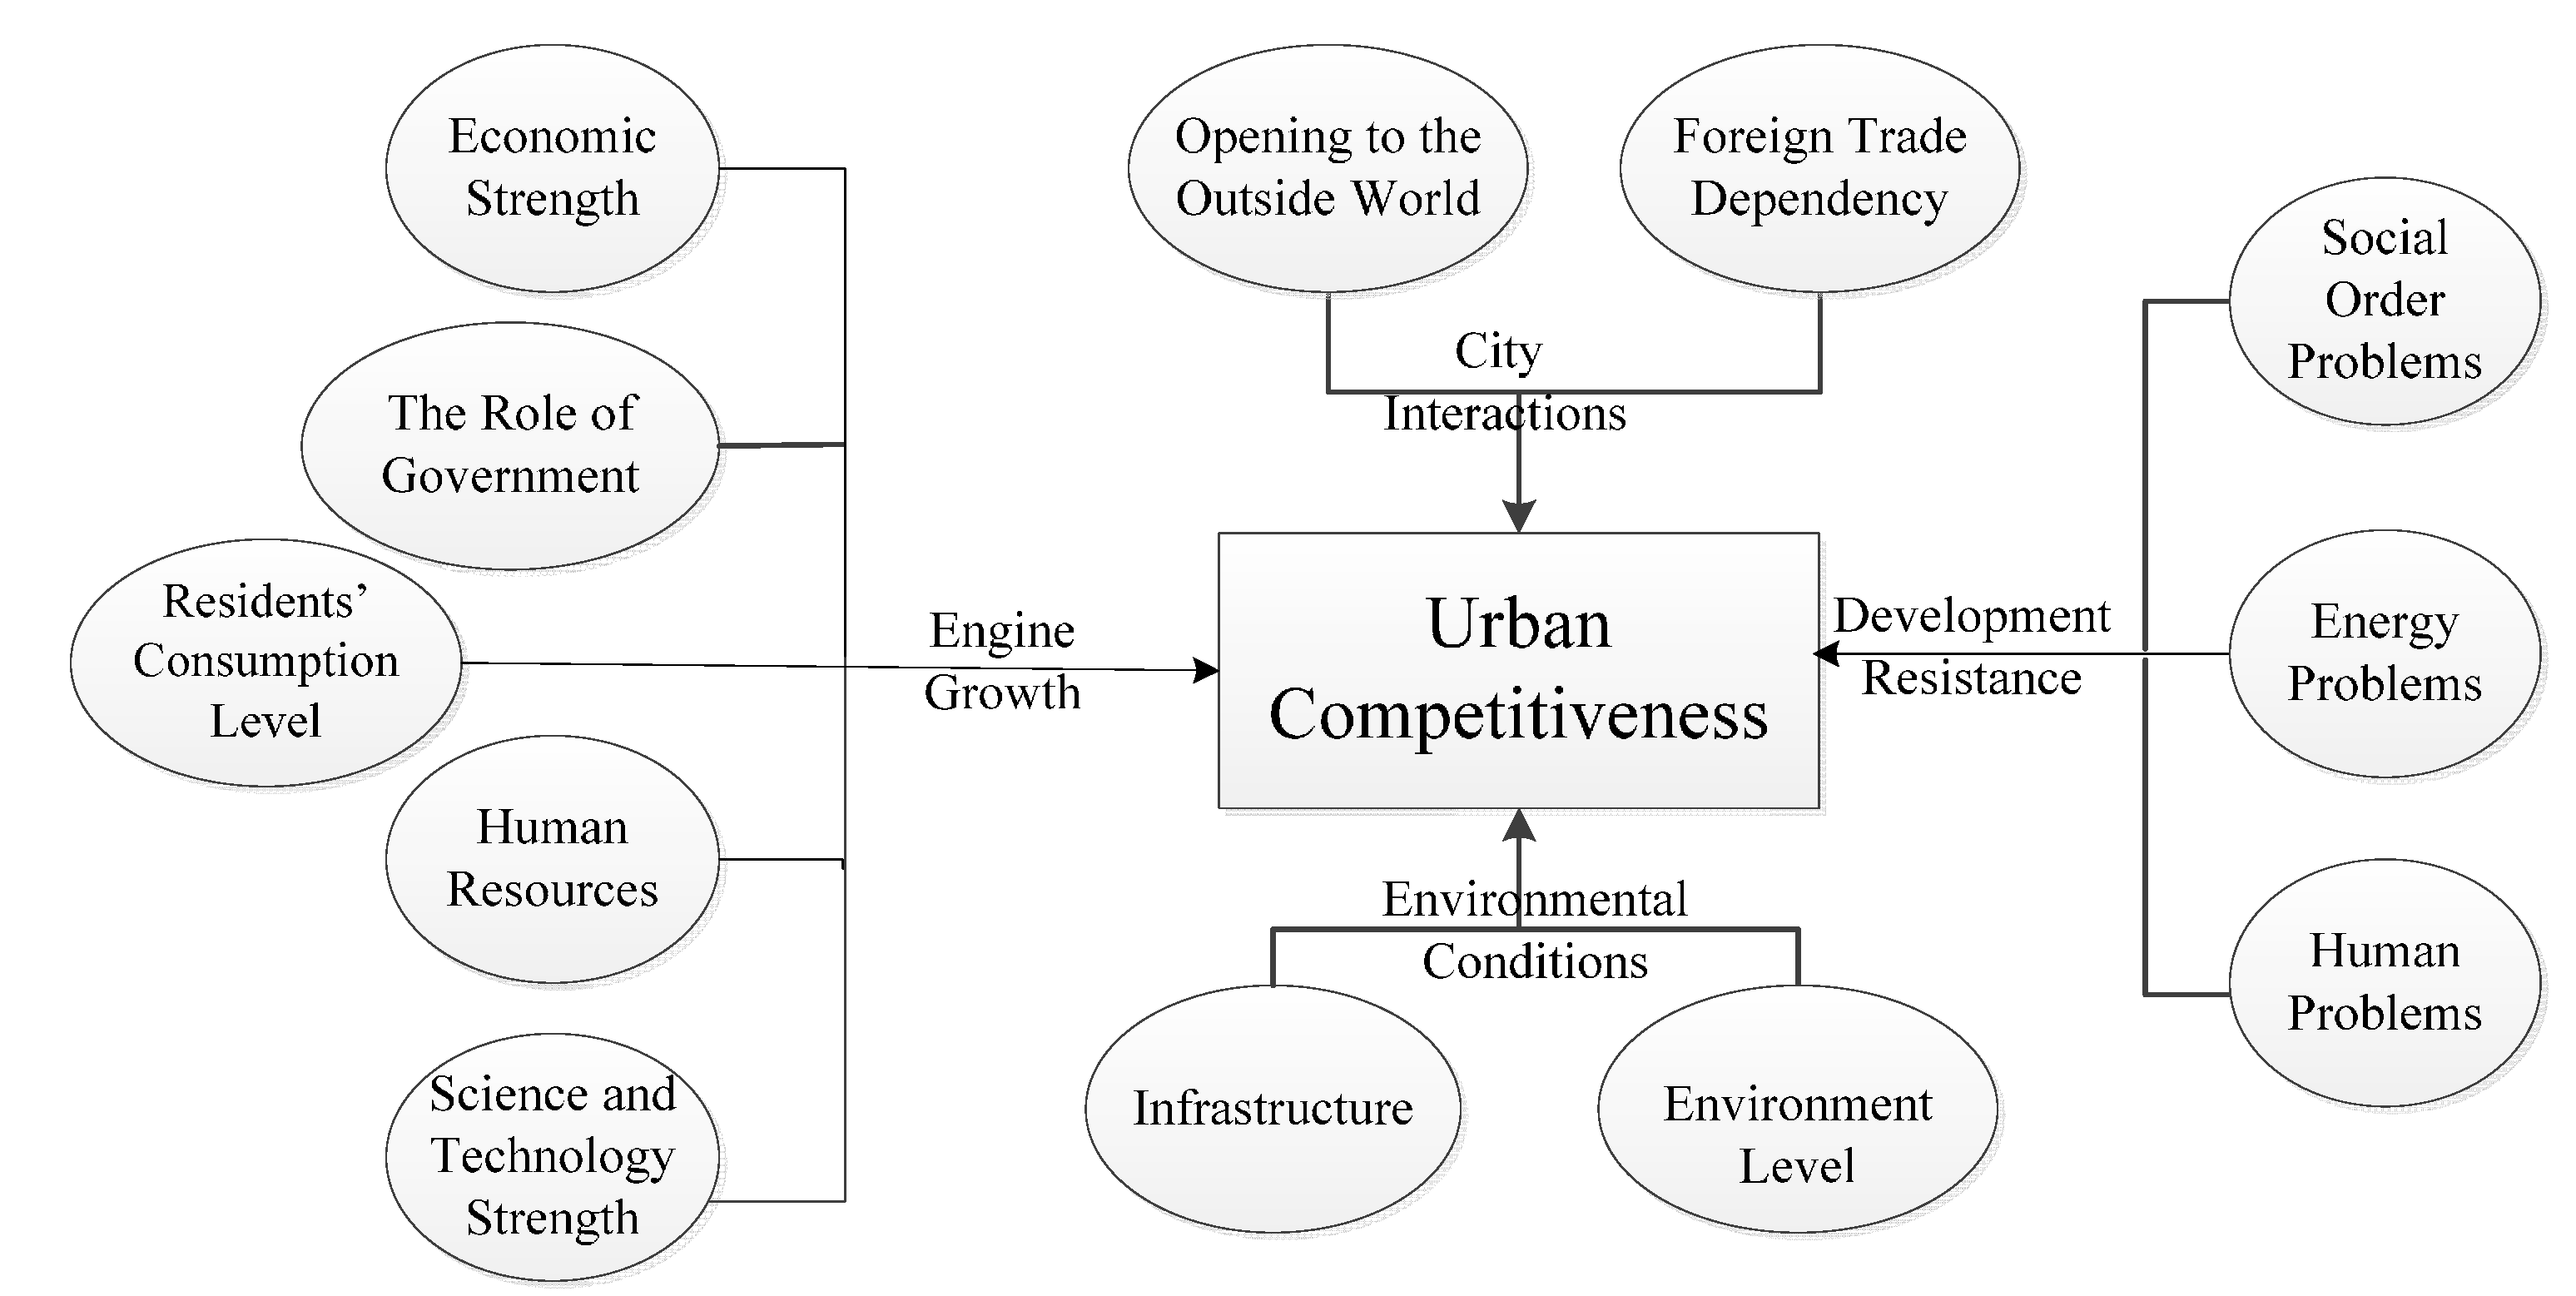
2.2. Construction of Urban Competitiveness Evaluation Indicator System

| Destination layer | Subsystem layer | Element layer | Basic Index layer |
|---|---|---|---|
| UC | EG | ES | GDP (x1); GDP growth rate (x2); GDP per capita (x3); Share of secondary sector in GDP (x4); Share of tertiary sector in GDP (x5); total industrial output value (x6) |
| RG | Financial revenue of local government per capita (x7); Financial expenditure of local government per capita (x8); Retail price index of commodities (x9); Housing sales price index (x10); Local financial revenue growth rate (x11); Local financial expenditure growth rate (x12); The ruling government satisfaction (x13) | ||
| RCL | Average wage of staff and workers (x14); Urban consumer price index (x15); Per capita disposable income of urban residents (x16); Per capita consumption expenditure of urban residents (x17); Engel coefficient of urban households (x18); Total retail sales of social consumer goods (x19); Total retail sales of social consumer goods per capita (x20); Total transaction amount of commodity trading market (x21) | ||
| HR | The second industry employment proportion (x22); The third industry employment proportion (x23); On-the-job workers proportion (x24); Number of on-the-job workers at end of the year (x25) | ||
| S&T | Number of colleges and universities (x26); Number of teachers in colleges and universities (x27); Number of patent applications (x28); Number of authorized patents and technology projects (x29); Number of all types of professional and technical personnel per 10 thousands persons (x30); Number of undergraduate students per 10 thousands persons (x31) | ||
| DR | SOP | Number of fire and traffic accidents (x32); Number of civil cases (x33); Number of criminal cases (x34) | |
| EP | Annual energy gap (x35); Annual power gap (x36) | ||
| HP | Illiteracy rate (x37); Unemployment rate (x38) | ||
| CI | OOW | Unban imports (x39); Unban exports (x40); Domestic and international tourism income per year (x41); Number of domestic and foreign tourists per year (x42) | |
| FTD | Total amount of actual domestic and international investment (x43); Actually utilized domestic and international investment (x44); Urban economic concentration and diffusion ability (x45) | ||
| EC | IFT | Length of paved roads per capita (x46); Electricity consumption per capita (x47); Water consumption per capita (x48); Number of public transportation vehicles per 10 thousand persons (x49); Number of public library books per hundred persons (x50); Number of doctors per 10 thousand persons (x51); Number of telephones per 10 thousand persons (x52) | |
| EL | Area of green land per capita (x53); Percentage of greenery coverage in the built-up area (x54); Percentage of industrial sewage discharged meeting national standard (x55); Number of fine air days per year (x56); Solid waste comprehensive utilization rate (x57); Output of products that comprehensively utilized the “three wastes” (x58) |
2.3. Calculation of Index Weight
| Judgment Criteria | Quantization | Familiarity | Quantization |
|---|---|---|---|
| Practical experience | 0.8 | Very familiar | 1.0 |
| Theoretical analysis | 0.6 | Familiar | 0.8 |
| Basic understanding | 0.4 | Not very familiar | 0.4 |
| Intuition | 0.2 | Minimally familiar | 0.2 |
| Unfamiliar | 0 |
| Region | Num | Region | Num | Region | Num | Region | Num |
|---|---|---|---|---|---|---|---|
| Henan | 4 | Shanxi | 2 | Hunan | 1 | Yunnan | 1 |
| Shandong | 3 | Inner-Mongolia | 2 | Guangxi | 1 | Ningxia | 1 |
| Anhui | 3 | Jilin | 1 | Hainan | 1 | Gansu | 1 |
| Guangdong | 3 | Heilongjiang | 1 | Sichuan | 1 | Qinghai | 1 |
| Hebei | 3 | Fujian | 1 | Chongqing | 1 | Shaanxi | 1 |
| Jiangsu | 2 | Shanghai | 1 | Fujian | 1 | Guizhou | 1 |
| Zhejiang | 2 | Beijing | 1 | Tianjin | 1 | Liaoning | 1 |
| Hubei | 2 | Tibet | 0 | Xinjiang | 0 |
3. Evaluation of City Competitiveness
3.1. Data Sample
3.2. Data Preprocessing
| Index | Source and calculation method |
|---|---|
| Population | The total population at the end of the year in the statistics yearbook |
| Financial revenue (expenditure) of local government per capita | Local financial revenue (expenditure)/the total population in the end of the year |
| KLocal financial revenue growth rate | (Local financial revenue this year − Local financial revenue last year)/Local fiscal last year × 100% |
| Engel coefficient of urban residents family | Food spending amount/The amount of consumer spending × 100% |
| Commodity trading market clinches a deal amount | The wholesale of the total retail sales of consumer goods, retail sales in the statistics yearbook |
| The actual total investment of the abroad | The amount of foreign capital of the contract in statistics yearbook |
| Number of fire and traffic accidents | The number of known fire accidents × unknown urban land area/Known city land area |
| Number of civil/criminal cases | Known criminal/the number of civil cases × unknown urban population/Known urban population |
| Annual energy/power gap | Known annual energy/Power gap × Unknown urban GDP/Known urban GDP |
| Illiteracy rate | 1-Primary school enrollment |
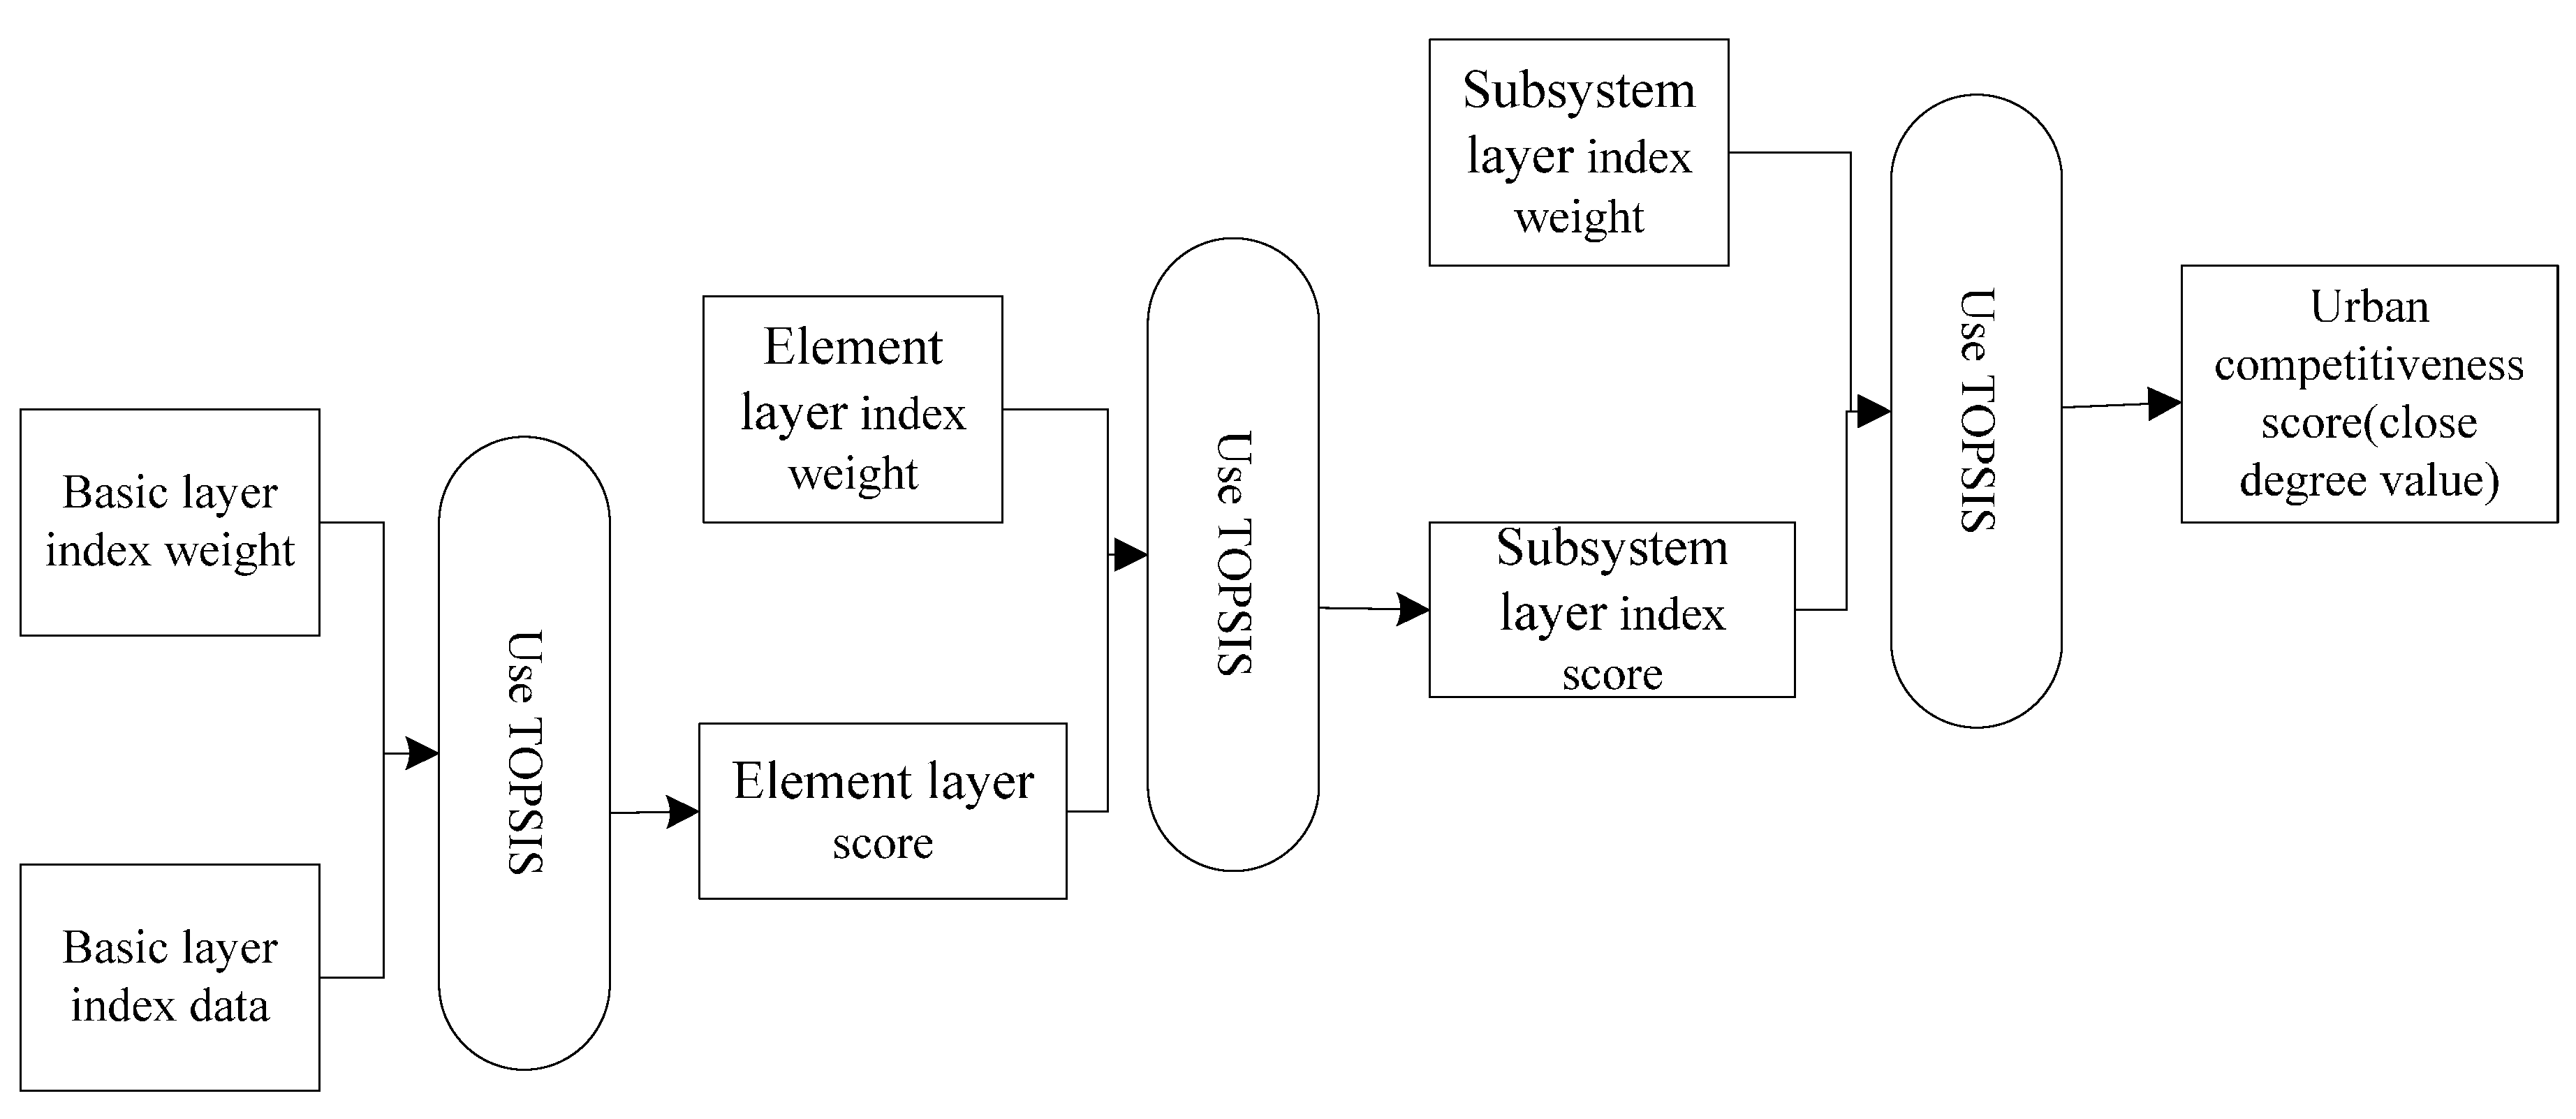
3.3. TOPSIS Method

3.4. The Ranking Results
4. Comparative Analysis of Calculation Results
4.1. Overview of Urban Competitiveness

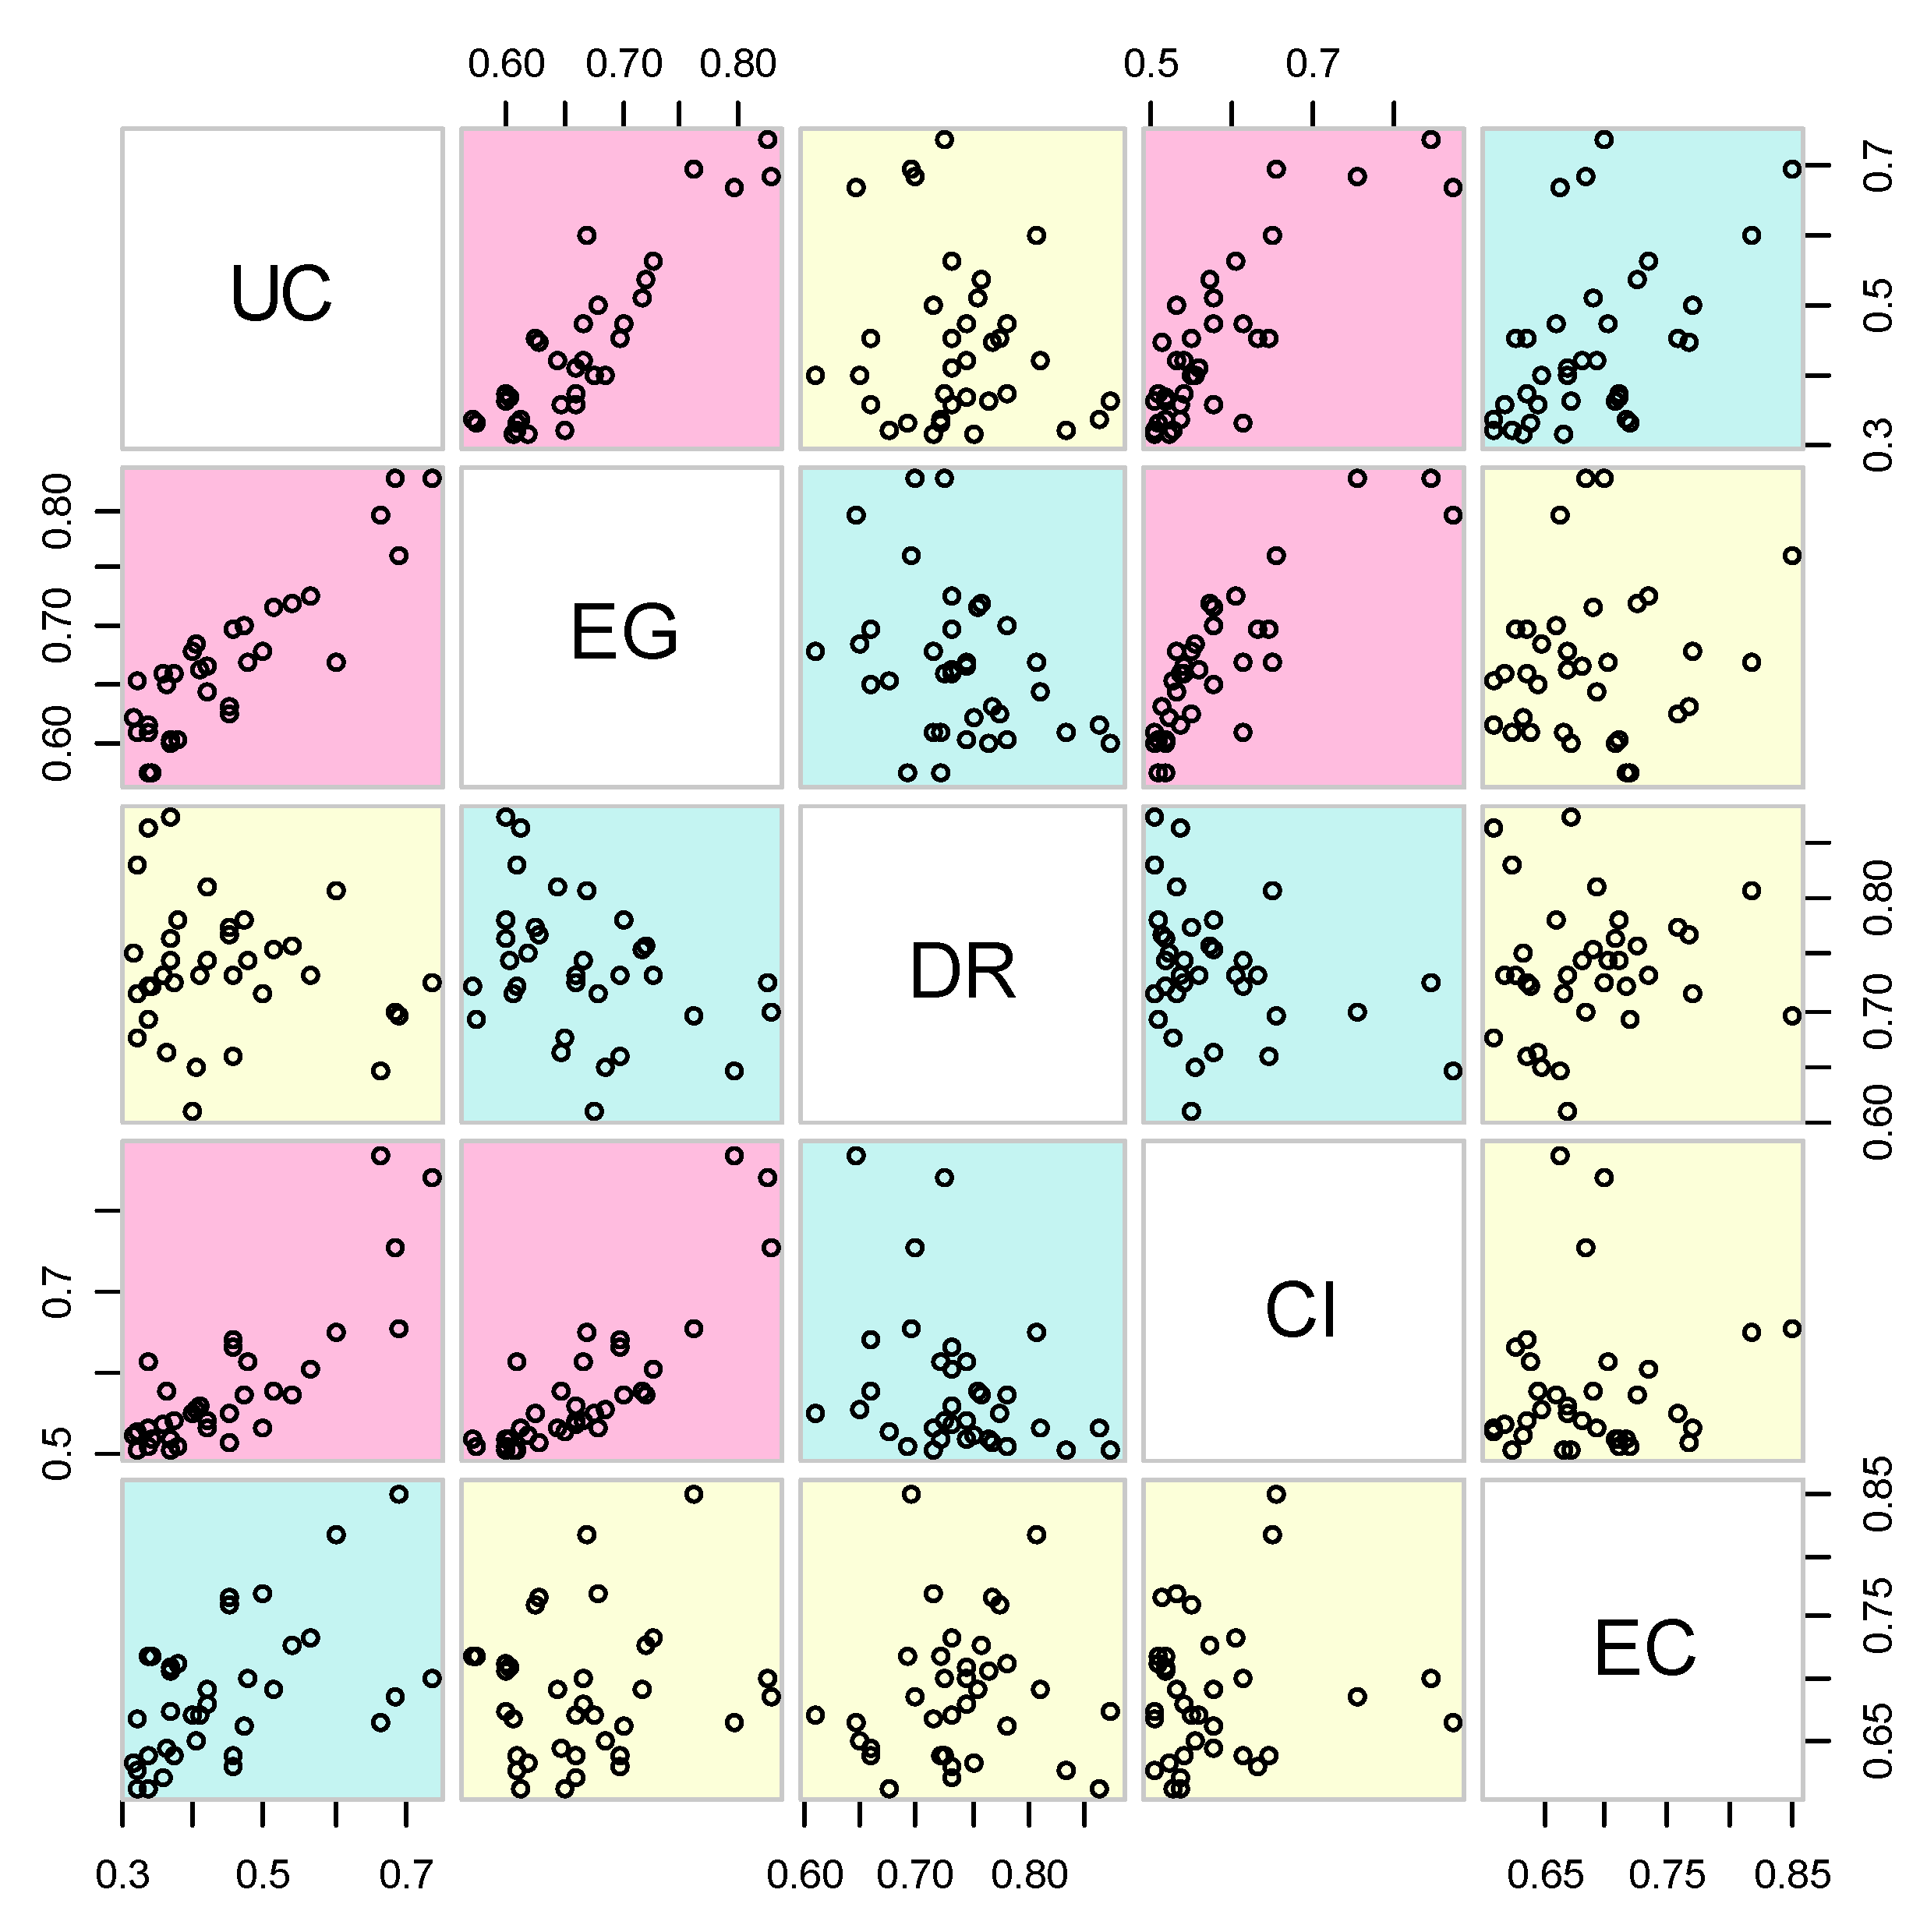
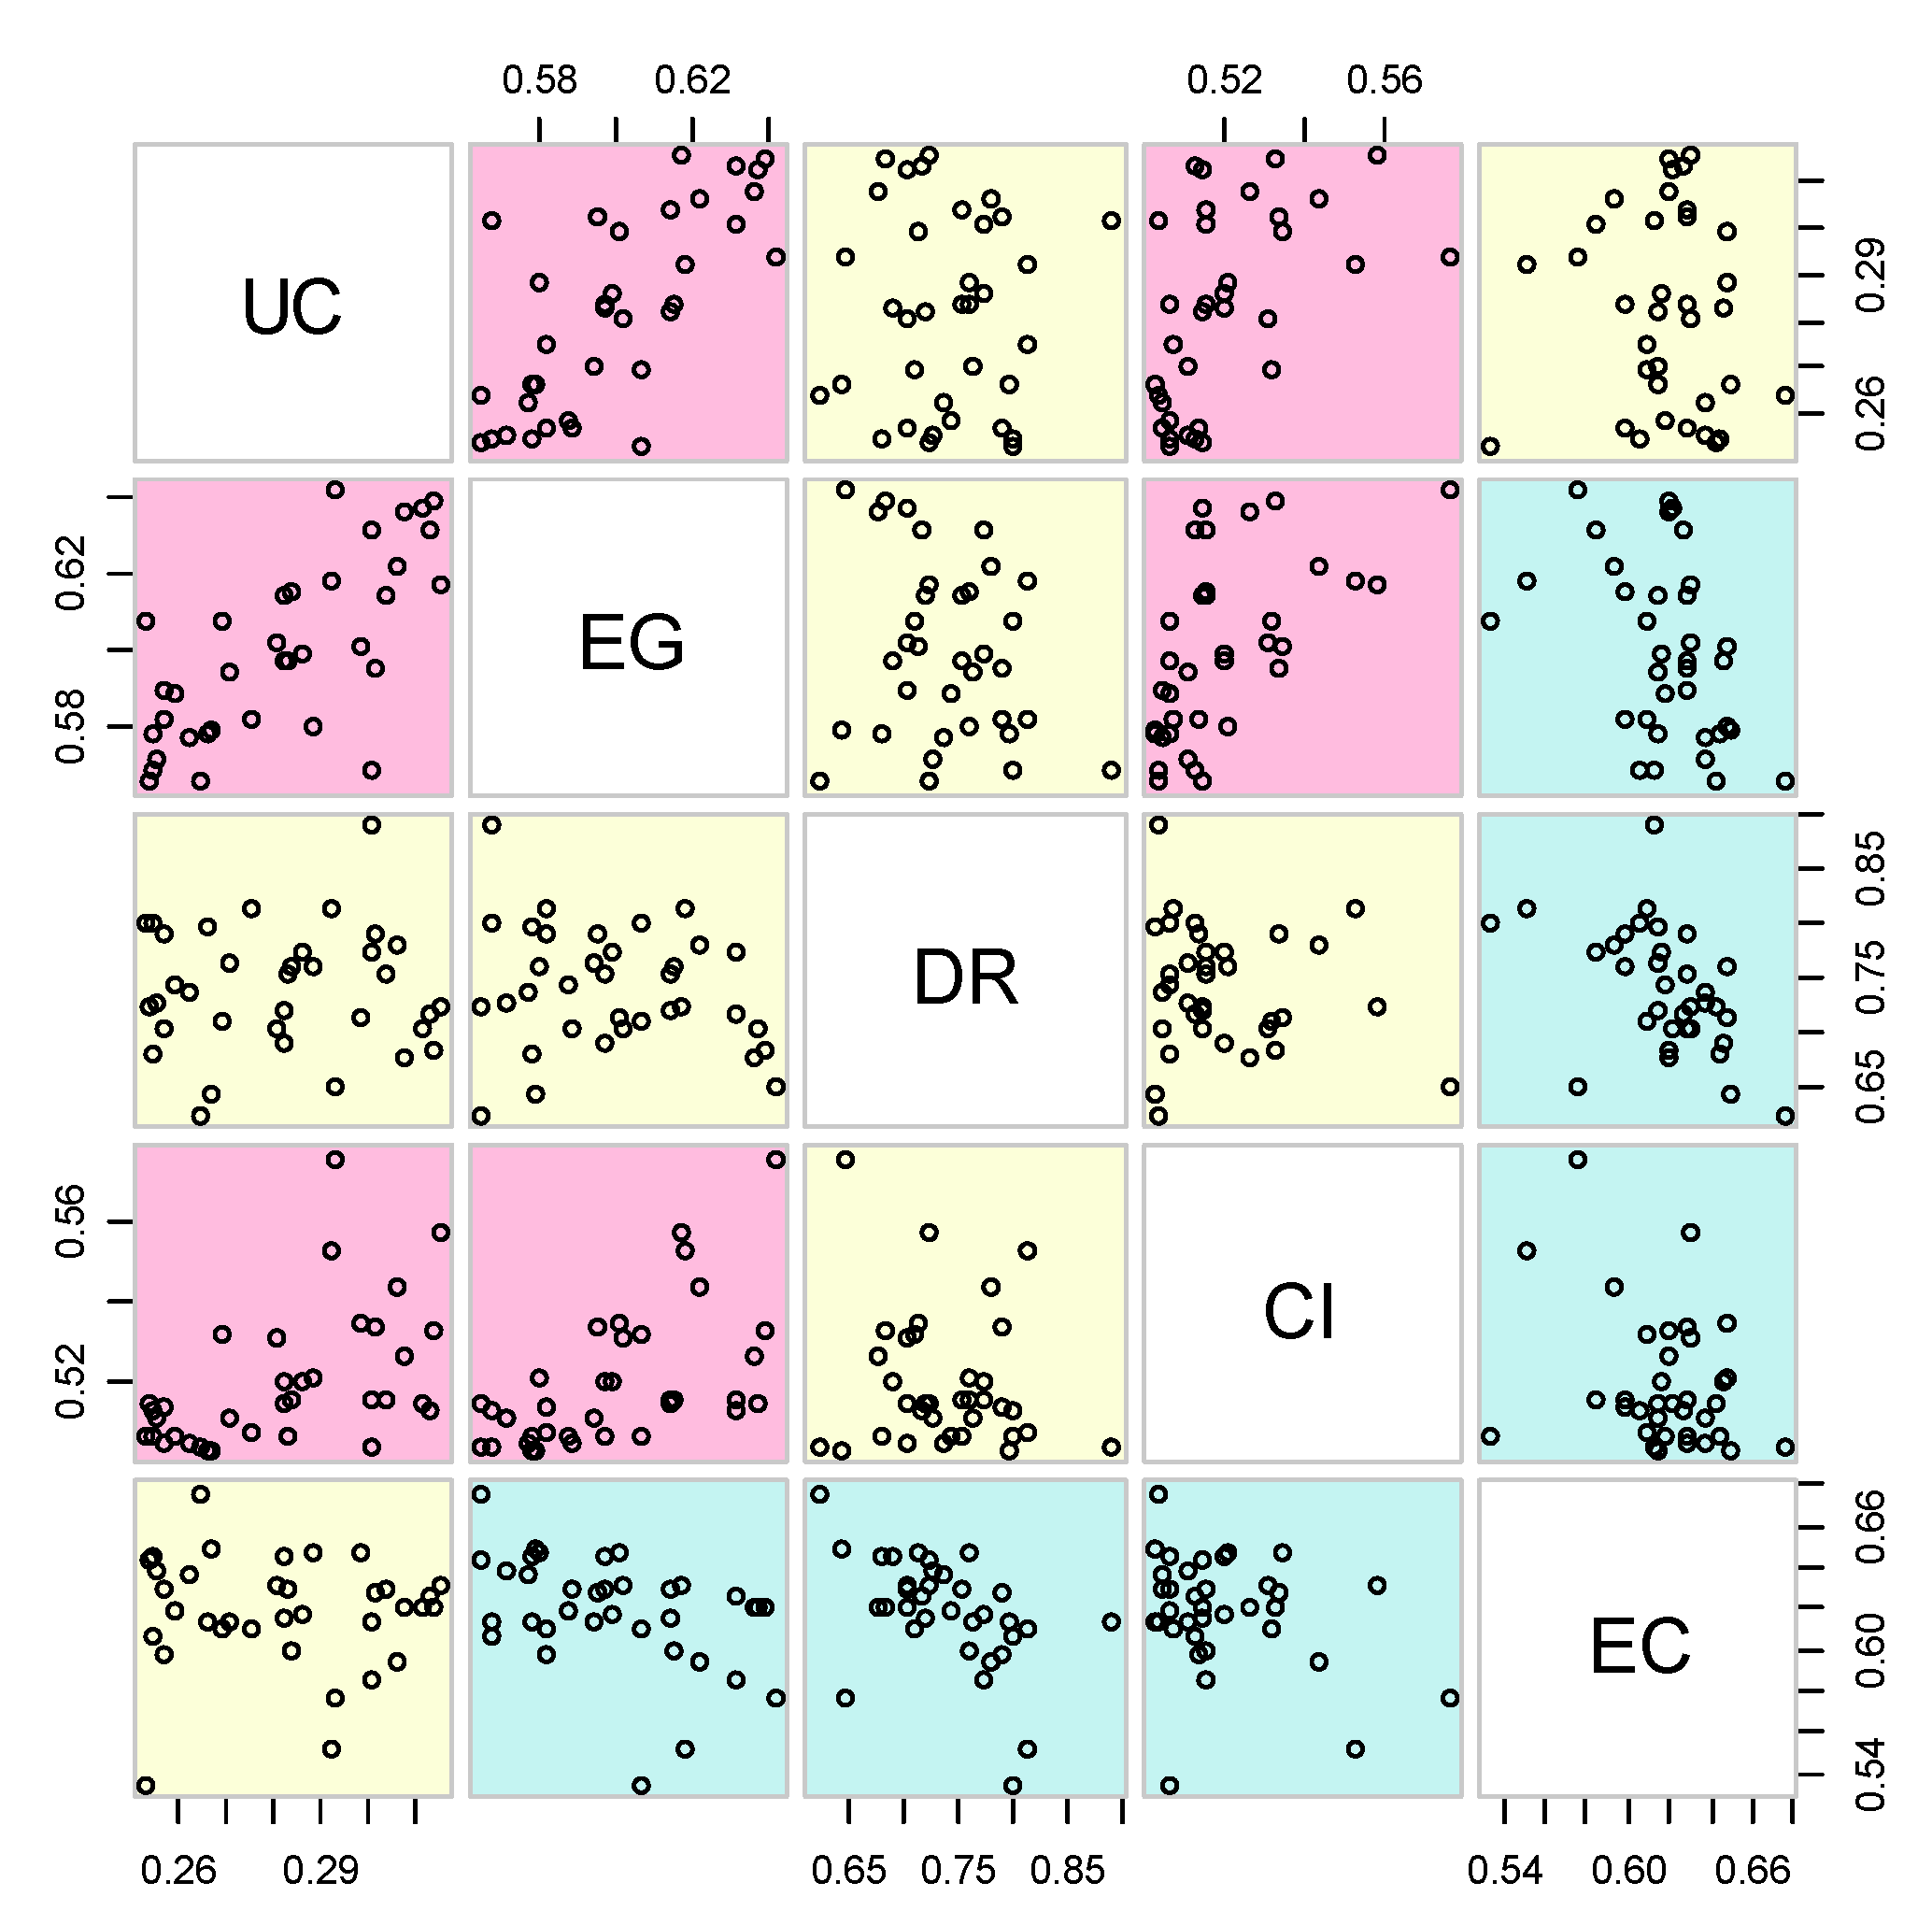
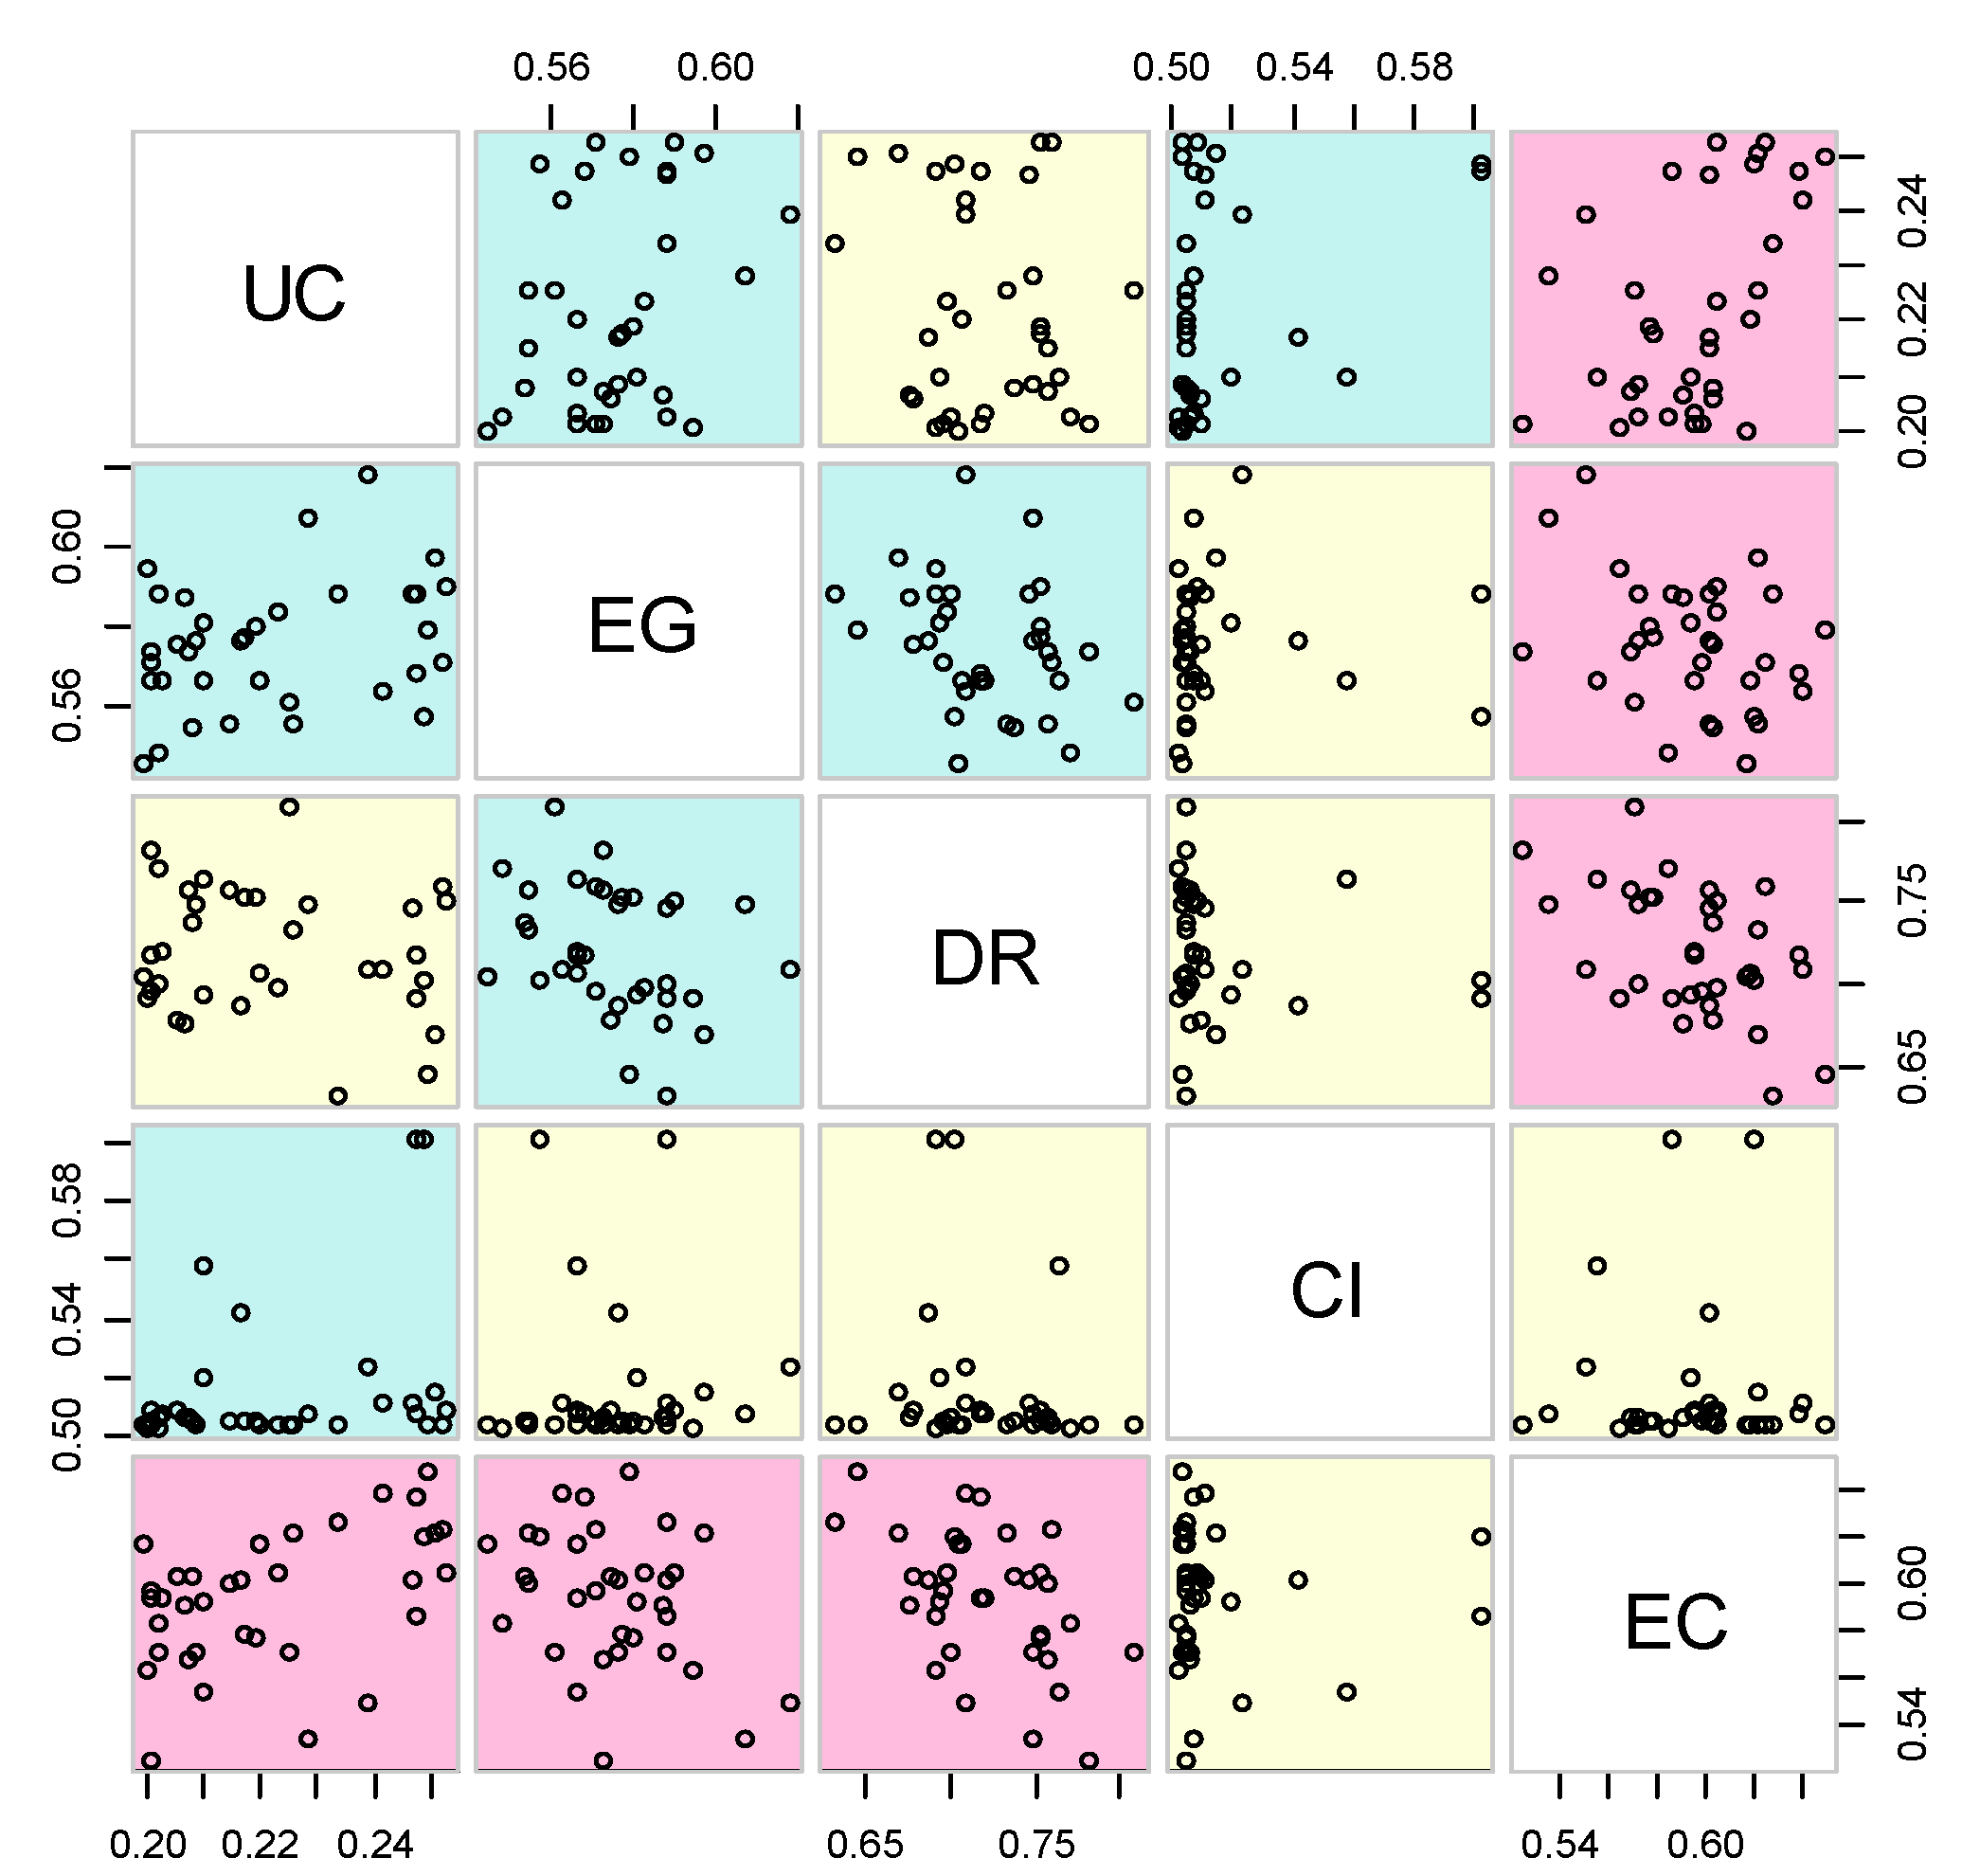
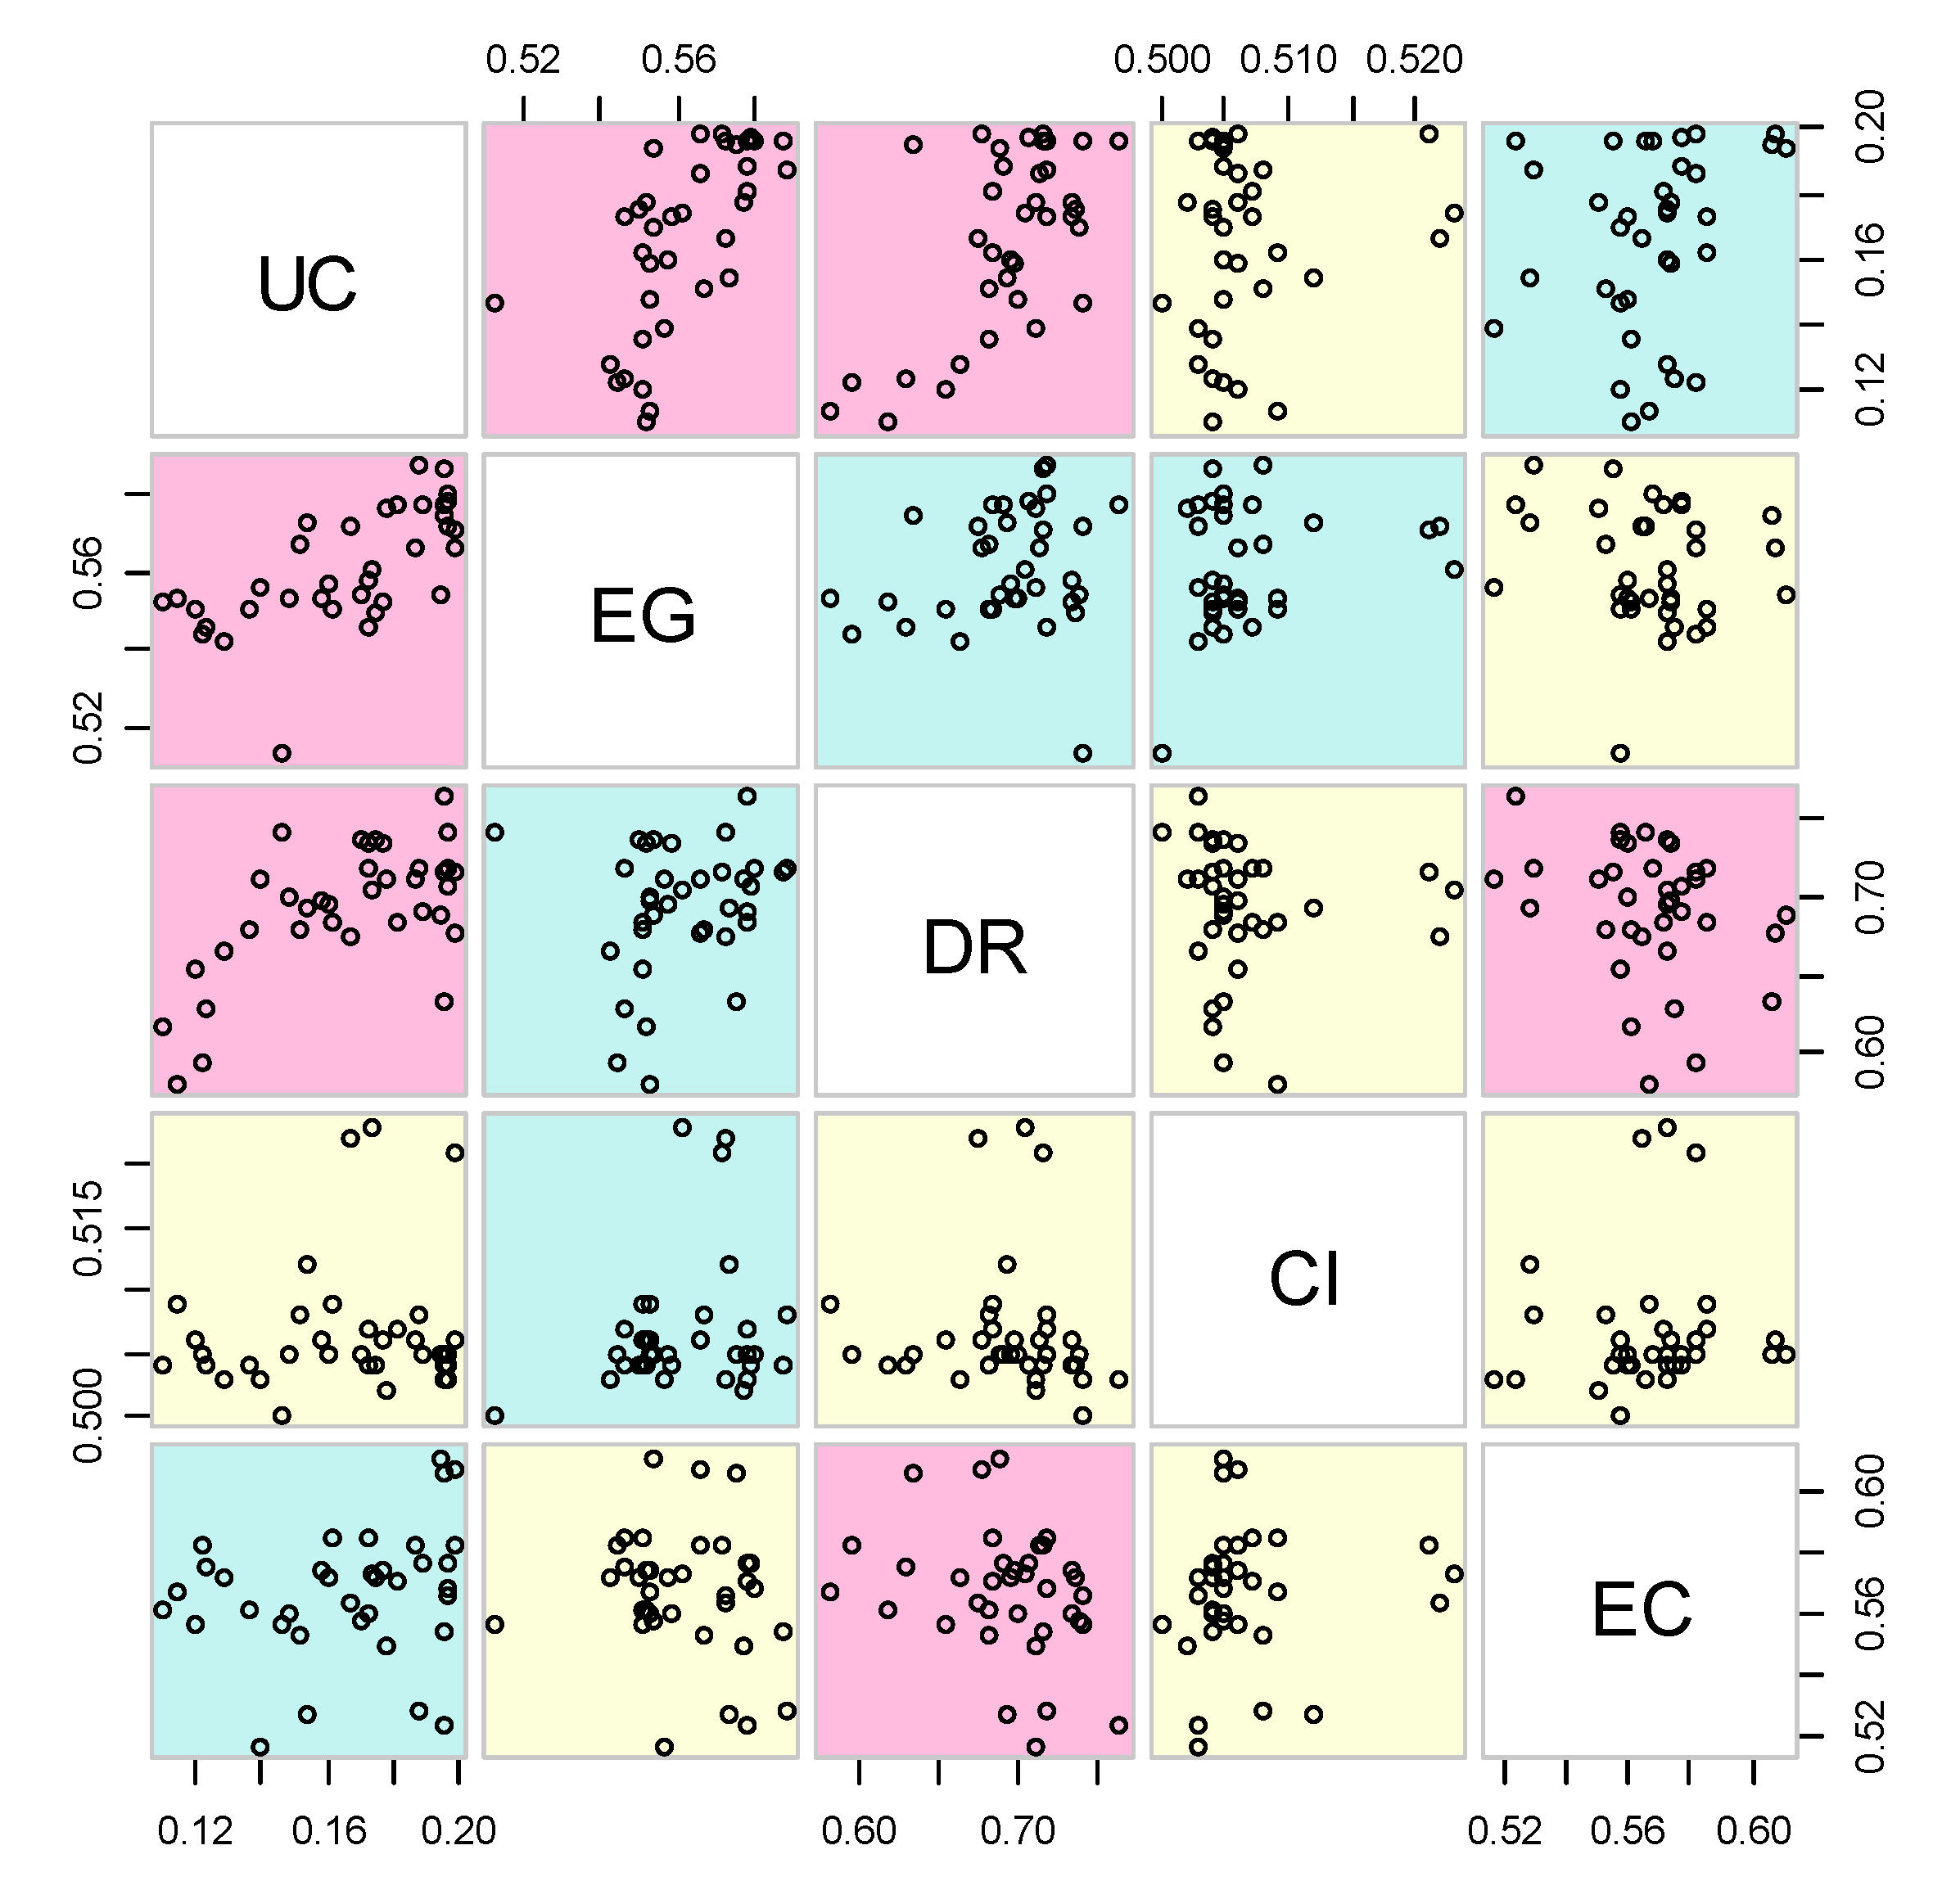
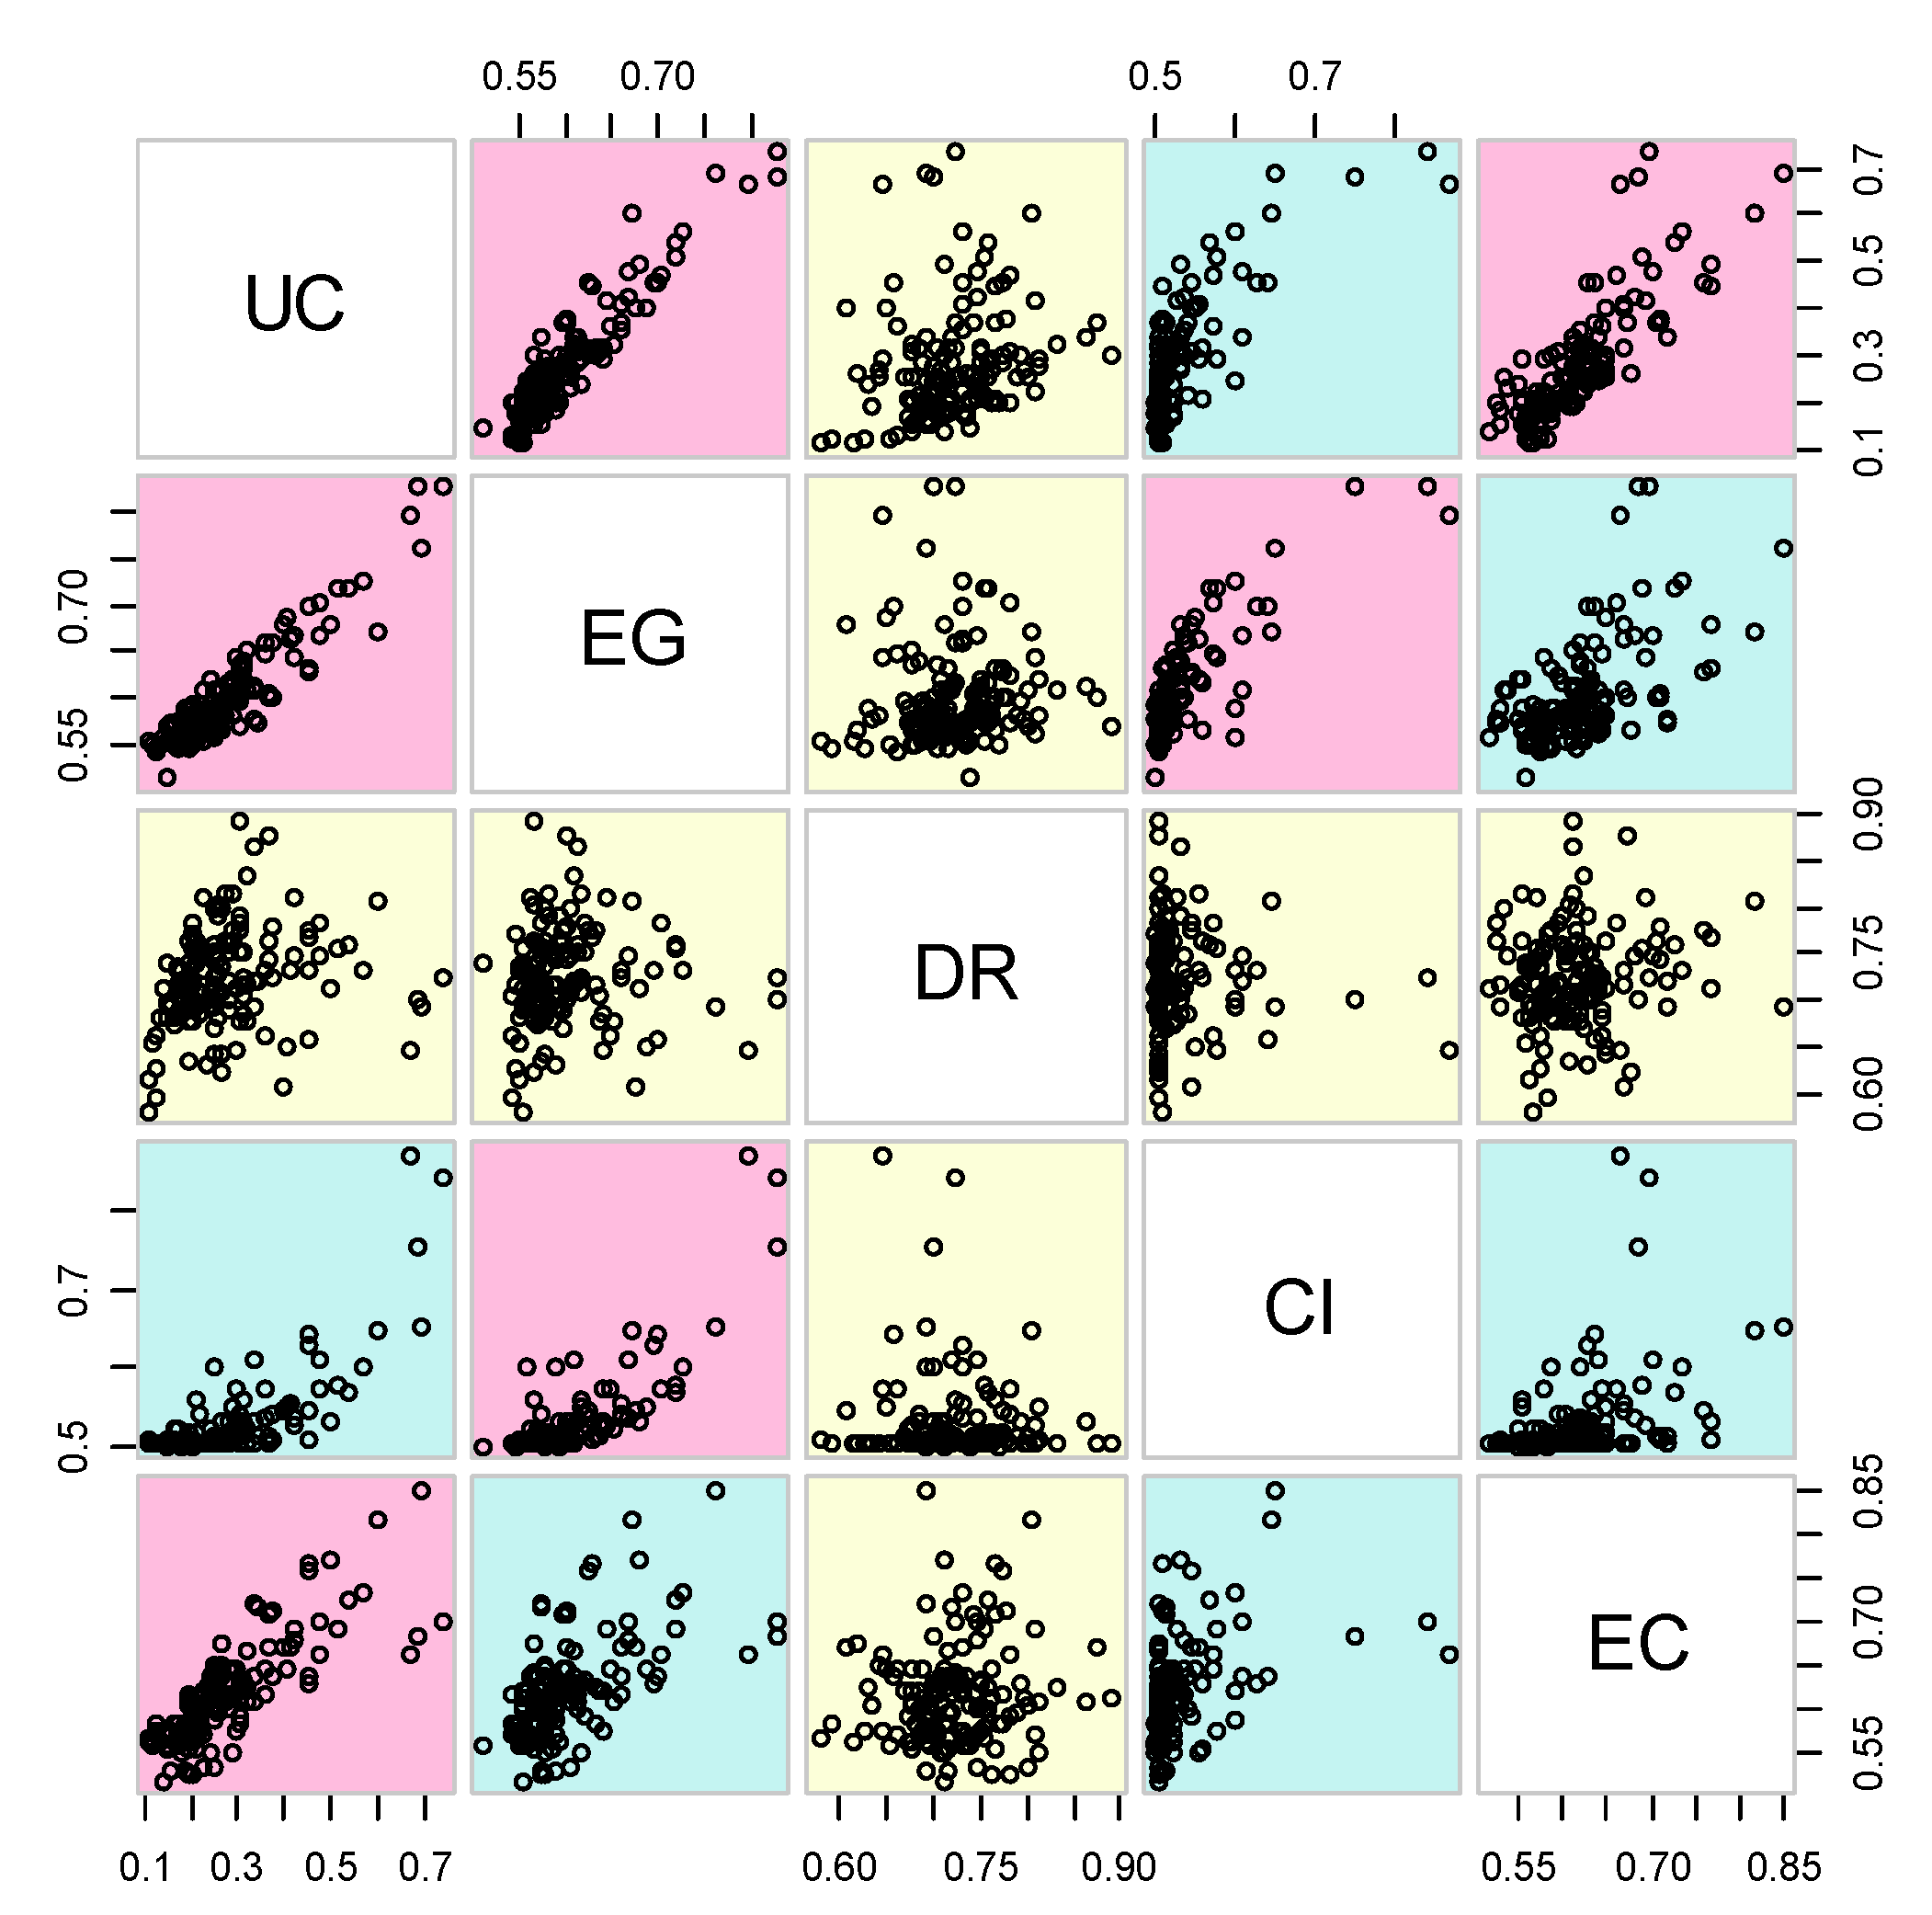
4.2. Relationship among the Four Dimensions of Urban Competitiveness


5. Conclusions
Acknowledgments
Author Contributions
Appendix I
| Subsystem layer | Element layer | Basic index layer | Subsystem layer | Element layer | Basic index layer | ||
|---|---|---|---|---|---|---|---|
| EG (0.33) | ES (0.223) | x1 | 0.1606 | DR (0.15) | SOP (0.325) | x32 | 0.2783 |
| x2 | 0.1647 | x33 | 0.4261 | ||||
| x3 | 0.1847 | x34 | 0.2957 | ||||
| x4 | 0.1647 | EP (0.360) | x35 | 0.4848 | |||
| x5 | 0.1727 | x36 | 0.5152 | ||||
| x6 | 0.1526 | HP (0.315) | x37 | 0.4000 | |||
| RG (0.188) | x7 | 0.1497 | x38 | 0.6000 | |||
| x8 | 0.1395 | CI (0.23) | OOW (0.537) | x39 | 0.2453 | ||
| x9 | 0.1497 | x40 | 0.2767 | ||||
| x10 | 0.1599 | x41 | 0.2516 | ||||
| x11 | 0.1224 | FTD 0.463 | x42 | 0.2264 | |||
| x12 | 0.1224 | x43 | 0.3382 | ||||
| x13 | 0.1565 | x44 | 0.3235 | ||||
| RCL (0.198) | x14 | 0.1589 | x45 | 0.3382 | |||
| x15 | 0.1246 | EC (0.29) | IFT (0.500) | x46 | 0.1515 | ||
| x16 | 0.1526 | x47 | 0.1515 | ||||
| x17 | 0.1340 | x48 | 0.1414 | ||||
| x18 | 0.1402 | x49 | 0.1549 | ||||
| x19 | 0.0935 | x50 | 0.1380 | ||||
| x20 | 0.0997 | x51 | 0.1414 | ||||
| x21 | 0.0966 | x52 | 0.1212 | ||||
| EG (0.33) | HR (0.178) | x22 | 0.2806 | EC (0.29) | EI (0.500) | x53 | 0.1707 |
| x23 | 0.2950 | x54 | 0.1672 | ||||
| x24 | 0.2158 | x55 | 0.1742 | ||||
| x25 | 0.2086 | x56 | 0.1847 | ||||
| S&T (0.213) | x26 | 0.1435 | x57 | 0.1498 | |||
| x27 | 0.1390 | x58 | 0.1533 | ||||
| x28 | 0.1973 | ||||||
| x29 | 0.2108 | ||||||
| x30 | 0.1749 | ||||||
| x31 | 0.1345 | ||||||
Appendix II
| Regions | Urban clusters | Cities |
|---|---|---|
| The southeast region | Yangtze River Delta | Nanjing, Wuxi, Hangzhou, Suzhou, Huzhou, Changzhou, Zhoushan, Taizhou, Shaoxing, Ningbo |
| Pearl River Delta | Zhongshan, Shenzhen, Dongguan, Jiangmen, Guangzhou, Foshan, Zhuhai, Zhoqing, Huizhou | |
| Qionghai | Zhanjiang, Maoming, Yangjiang, Sanya, Haikou | |
| Xuzhou | Xuzhou, Lianyungang, Suqian, Huaibei, Suzhou, Zaozhuang, Jining, Linyi | |
| Shantou | Chaozhou, Shanwei, Jieyang, Shantou | |
| West Strait | Ningde, Xiamen, Putian, Quanzhou, Zhangzhou | |
| East Zhejiang | Taizhou, Wenzhou, Lishui | |
| The central region | Hube-Henan | Suizhou, Xiangfan, Nanyang |
| Circle of the Poyang Lake | Fuzhou, Jingdezhen, Jiujiang, Nanchang, Yingtan, Shangrao | |
| Anhui-Jianghuai | Huainan, Maanshan, Liuan, Chuzhou, Bengbu, Anqing, Hefei, Xuancheng, Tongling, Chizhou, Chaohu | |
| Wuhan | Huangshi, Ezhou, Wuhan, Huanggang | |
| Hebei-Shandong-Henan | Puyang, Handan, Liaocheng, Hebi | |
| Henan-Anhui | Fuyang, Bozhou, Shangqiu, Zhoukou | |
| Chang-Zhu-Tan | Changsha, Zhuzhou, Xiangtan | |
| Central Plains | Pingdingshan, Xinxiang, Xucang, Luoyang, Kaifeng, Zhengzhou | |
| The west region | Yinchuan | Yinchuan, Wuzhong, Wuhai |
| Hohhot-Baotou-Ordos | Baotou, Hohhot, Ordos | |
| Central Shaanxi | Xi’an, Xianyang, Baoji, Tongchuan | |
| Central Guizhou | Guiyang, Zunyi, Liupanshu | |
| Lanzhou | Lanzhou, Wuwei, Xining | |
| Chengdu-Chongqing | Chongqing, Chengdu, Nanchong, Mianyang, Deyang, Deyang, Leshan, Suining, Guang’an | |
| Nanning | Nanning, Beihai, Fangchenggang, Qinzhou | |
| The northeast and Bohai Rim region | Shijiazhuang | Yangquan, Hengshui, Cangzhou, Langfang, Xingtai, Baoding |
| Shandong Peninsula | Rizhao, Qingdao, Dingying, Weifang, Yantai | |
| Beijing-Tianjing-Tangshan | Tangshan, Tianjin, Zhangjiakou, Beijing, Qinhuangdao | |
| Harbin | Tsitsihar, Daqing, Harbin, Shuangyashan | |
| Changchun | Changchun, Songyuan, Siping | |
| Central-southern of Liaoning | Fuxin, Shenyang, Dandong, Daqing, Anshan |
Appendix III
| City | Level | Rank of UC | Score of UC | Rank of EG | Score of EG | Rank of DR | Score of DR | Rank of CI | Score of CI | Rank of EC | Score of EC |
|---|---|---|---|---|---|---|---|---|---|---|---|
| Suzhou | A | 1 | 0.7367 | 2 | 0.826 | 64 | 0.724 | 2 | 0.841 | 14 | 0.699 |
| Guangzhou | A | 2 | 0.6922 | 4 | 0.762 | 101 | 0.695 | 4 | 0.652 | 1 | 0.851 |
| Shenzhen | A | 3 | 0.6844 | 1 | 0.828 | 96 | 0.700 | 3 | 0.753 | 17 | 0.684 |
| Beijing | A | 4 | 0.6659 | 3 | 0.795 | 131 | 0.646 | 1 | 0.869 | 24 | 0.664 |
| Dongguan | A | 5 | 0.6020 | 14 | 0.670 | 9 | 0.807 | 5 | 0.648 | 2 | 0.818 |
| Hangzhou | A | 6 | 0.5658 | 5 | 0.726 | 59 | 0.731 | 10 | 0.603 | 6 | 0.734 |
| Nanjing | A | 7 | 0.5396 | 6 | 0.719 | 30 | 0.759 | 17 | 0.570 | 7 | 0.726 |
| Wu’xi | A | 8 | 0.5137 | 7 | 0.718 | 34 | 0.756 | 13 | 0.578 | 16 | 0.691 |
| Xiamen | A | 9 | 0.4982 | 12 | 0.678 | 79 | 0.714 | 35 | 0.531 | 3 | 0.769 |
| Qingdao | A | 10 | 0.4758 | 15 | 0.668 | 44 | 0.746 | 9 | 0.611 | 13 | 0.701 |
| Foshan | A | 11 | 0.4732 | 8 | 0.702 | 15 | 0.782 | 16 | 0.574 | 25 | 0.661 |
| Tianjin | A | 12 | 0.4545 | 9 | 0.699 | 127 | 0.660 | 6 | 0.642 | 39 | 0.637 |
| Ningbo | A | 13 | 0.4544 | 10 | 0.697 | 58 | 0.732 | 7 | 0.629 | 48 | 0.628 |
| Zhuhai | A | 14 | 0.4539 | 30 | 0.626 | 21 | 0.773 | 24 | 0.547 | 5 | 0.759 |
| Edos | A | 15 | 0.4493 | 29 | 0.630 | 23 | 0.767 | 63 | 0.511 | 4 | 0.767 |
| Changzhou | A | 16 | 0.4226 | 16 | 0.667 | 45 | 0.746 | 28 | 0.539 | 18 | 0.680 |
| Zhongshan | A | 17 | 0.4199 | 22 | 0.645 | 7 | 0.810 | 37 | 0.530 | 15 | 0.692 |
| Dalian | A | 18 | 0.4108 | 17 | 0.662 | 56 | 0.733 | 20 | 0.556 | 21 | 0.670 |
| Chengdu | A | 19 | 0.4022 | 11 | 0.686 | 129 | 0.650 | 22 | 0.552 | 28 | 0.648 |
| Wuhan | A | 20 | 0.3998 | 13 | 0.677 | 139 | 0.609 | 23 | 0.548 | 22 | 0.669 |
| Haikou | A | 21 | 0.3769 | 47 | 0.602 | 18 | 0.780 | 68 | 0.510 | 10 | 0.712 |
| Shenyang | A | 22 | 0.3733 | 18 | 0.661 | 62 | 0.726 | 27 | 0.541 | 40 | 0.637 |
| Linyi | A | 23 | 0.3674 | 46 | 0.603 | 46 | 0.744 | 54 | 0.515 | 11 | 0.710 |
| Sanya | A | 24 | 0.3667 | 50 | 0.600 | 2 | 0.874 | 111 | 0.504 | 20 | 0.672 |
| Xuzhou | A | 25 | 0.3664 | 51 | 0.599 | 24 | 0.765 | 50 | 0.516 | 12 | 0.707 |
| Changsha | A | 26 | 0.3614 | 21 | 0.649 | 126 | 0.661 | 15 | 0.575 | 33 | 0.644 |
| Shaoxing | A | 27 | 0.3576 | 19 | 0.661 | 60 | 0.731 | 29 | 0.536 | 60 | 0.619 |
| Jining | A | 28 | 0.3403 | 92 | 0.573 | 68 | 0.721 | 53 | 0.516 | 9 | 0.717 |
| Quanzhou | A | 29 | 0.3365 | 37 | 0.614 | 3 | 0.863 | 32 | 0.533 | 70 | 0.610 |
| Zhoushan | A | 30 | 0.3353 | 41 | 0.609 | 67 | 0.721 | 8 | 0.612 | 36 | 0.638 |
| Xiangfan | A | 31 | 0.3351 | 89 | 0.575 | 106 | 0.692 | 91 | 0.506 | 8 | 0.719 |
| Ezhou | A | 32 | 0.3227 | 40 | 0.610 | 4 | 0.832 | 127 | 0.503 | 52 | 0.625 |
| Xi’an | A | 33 | 0.3207 | 20 | 0.652 | 120 | 0.677 | 39 | 0.525 | 72 | 0.610 |
| Yinchuan | A | 34 | 0.3190 | 42 | 0.608 | 78 | 0.715 | 132 | 0.503 | 23 | 0.667 |
| Nanchang | A | 35 | 0.3157 | 32 | 0.620 | 38 | 0.752 | 46 | 0.520 | 42 | 0.632 |
| Yantai | B | 36 | 0.3156 | 35 | 0.617 | 63 | 0.725 | 19 | 0.558 | 43 | 0.631 |
| Changchun | B | 37 | 0.3144 | 24 | 0.639 | 112 | 0.684 | 33 | 0.533 | 58 | 0.620 |
| Hohhot | B | 38 | 0.3131 | 27 | 0.631 | 70 | 0.717 | 61 | 0.513 | 51 | 0.626 |
| Baotou | B | 39 | 0.3122 | 25 | 0.637 | 89 | 0.704 | 57 | 0.515 | 56 | 0.621 |
| Zhengzhou | B | 40 | 0.3080 | 26 | 0.636 | 118 | 0.678 | 38 | 0.527 | 59 | 0.620 |
| Harbin | B | 41 | 0.3061 | 31 | 0.622 | 16 | 0.782 | 25 | 0.544 | 89 | 0.594 |
| Huzhou | B | 42 | 0.3042 | 38 | 0.614 | 39 | 0.752 | 52 | 0.516 | 45 | 0.629 |
| Huizhou | B | 43 | 0.3021 | 56 | 0.595 | 13 | 0.792 | 31 | 0.534 | 49 | 0.628 |
| Suizhou | B | 44 | 0.3013 | 102 | 0.568 | 1 | 0.892 | 110 | 0.504 | 68 | 0.613 |
| Wenzhou | B | 45 | 0.3007 | 28 | 0.631 | 19 | 0.775 | 49 | 0.516 | 93 | 0.585 |
| Daqing | B | 46 | 0.2989 | 49 | 0.601 | 80 | 0.713 | 30 | 0.535 | 29 | 0.647 |
| Chongqing | B | 47 | 0.2936 | 23 | 0.642 | 130 | 0.648 | 14 | 0.576 | 104 | 0.576 |
| Dongying | B | 48 | 0.2924 | 33 | 0.618 | 5 | 0.815 | 21 | 0.553 | 132 | 0.552 |
| Lianyungang | B | 49 | 0.2886 | 73 | 0.580 | 28 | 0.762 | 43 | 0.521 | 30 | 0.647 |
| Jiangmen | B | 50 | 0.2861 | 52 | 0.599 | 20 | 0.775 | 45 | 0.520 | 63 | 0.617 |
| Taizhou | B | 51 | 0.2838 | 36 | 0.615 | 29 | 0.761 | 51 | 0.516 | 84 | 0.599 |
| Shantou | B | 52 | 0.2832 | 54 | 0.597 | 36 | 0.753 | 78 | 0.507 | 46 | 0.629 |
| Hefei | B | 53 | 0.2824 | 55 | 0.597 | 108 | 0.691 | 48 | 0.520 | 31 | 0.646 |
| Taizhou | B | 54 | 0.2822 | 39 | 0.614 | 66 | 0.721 | 56 | 0.515 | 65 | 0.615 |
| Guiyang | B | 55 | 0.2805 | 48 | 0.602 | 93 | 0.703 | 36 | 0.531 | 44 | 0.631 |
| Langfang | B | 56 | 0.2751 | 70 | 0.582 | 6 | 0.813 | 73 | 0.508 | 73 | 0.610 |
| Zhangzhou | B | 57 | 0.2705 | 57 | 0.594 | 27 | 0.763 | 64 | 0.511 | 66 | 0.614 |
| Weifang | B | 58 | 0.2693 | 43 | 0.607 | 84 | 0.710 | 34 | 0.532 | 71 | 0.610 |
| Rizhao | B | 59 | 0.2665 | 76 | 0.579 | 132 | 0.644 | 136 | 0.503 | 26 | 0.649 |
| Chaozhou | B | 60 | 0.2664 | 79 | 0.578 | 12 | 0.797 | 128 | 0.503 | 67 | 0.614 |
| Xingtai | B | 61 | 0.2644 | 112 | 0.565 | 137 | 0.622 | 124 | 0.504 | 19 | 0.676 |
| Jingdezhen | B | 62 | 0.2622 | 84 | 0.577 | 52 | 0.736 | 101 | 0.505 | 41 | 0.637 |
| Liaocheng | B | 63 | 0.2589 | 61 | 0.588 | 47 | 0.744 | 80 | 0.507 | 61 | 0.618 |
| Putian | B | 64 | 0.2569 | 71 | 0.582 | 14 | 0.791 | 59 | 0.514 | 85 | 0.598 |
| Tongling | B | 65 | 0.2567 | 60 | 0.589 | 90 | 0.704 | 103 | 0.505 | 47 | 0.629 |
| Deyang | B | 66 | 0.2555 | 99 | 0.571 | 61 | 0.727 | 66 | 0.511 | 37 | 0.638 |
| Handan | B | 67 | 0.2546 | 80 | 0.578 | 115 | 0.680 | 85 | 0.507 | 32 | 0.645 |
| Zhaoqing | B | 68 | 0.2544 | 103 | 0.568 | 10 | 0.801 | 60 | 0.513 | 75 | 0.606 |
| Qinhuangdao | B | 69 | 0.2538 | 113 | 0.565 | 65 | 0.723 | 55 | 0.515 | 34 | 0.643 |
| Wuzhong | B | 70 | 0.2528 | 44 | 0.607 | 11 | 0.800 | 77 | 0.507 | 136 | 0.534 |
| Ma’anshan | C | 71 | 0.2526 | 59 | 0.590 | 40 | 0.752 | 74 | 0.508 | 77 | 0.605 |
| Suqian | C | 72 | 0.2524 | 98 | 0.571 | 31 | 0.759 | 126 | 0.503 | 53 | 0.624 |
| baoding | C | 73 | 0.2508 | 53 | 0.597 | 124 | 0.669 | 58 | 0.515 | 54 | 0.622 |
| Hengshui | C | 74 | 0.2497 | 77 | 0.579 | 133 | 0.644 | 137 | 0.503 | 27 | 0.649 |
| Leshan | C | 75 | 0.2487 | 118 | 0.557 | 94 | 0.703 | 11 | 0.602 | 57 | 0.620 |
| Xiangtan | C | 76 | 0.2476 | 62 | 0.588 | 105 | 0.692 | 12 | 0.602 | 92 | 0.586 |
| Huaibei | C | 77 | 0.2475 | 104 | 0.568 | 73 | 0.717 | 82 | 0.507 | 38 | 0.638 |
| Zaozhuang | C | 78 | 0.2467 | 63 | 0.588 | 43 | 0.747 | 65 | 0.511 | 82 | 0.602 |
| Nanning | C | 79 | 0.2418 | 114 | 0.563 | 86 | 0.709 | 67 | 0.511 | 35 | 0.639 |
| Anshan | C | 80 | 0.2393 | 34 | 0.618 | 85 | 0.709 | 40 | 0.523 | 133 | 0.550 |
| Cangzhou | C | 81 | 0.2339 | 64 | 0.588 | 135 | 0.631 | 122 | 0.504 | 50 | 0.627 |
| Lanzhou | C | 82 | 0.2283 | 45 | 0.607 | 42 | 0.748 | 79 | 0.507 | 135 | 0.535 |
| Chuzhou | C | 83 | 0.2257 | 121 | 0.555 | 57 | 0.733 | 116 | 0.504 | 55 | 0.622 |
| Maoming | C | 84 | 0.2254 | 115 | 0.561 | 8 | 0.809 | 112 | 0.504 | 115 | 0.571 |
| Huainan | C | 85 | 0.2233 | 69 | 0.583 | 98 | 0.698 | 120 | 0.504 | 78 | 0.605 |
| Xuchang | C | 86 | 0.2200 | 106 | 0.566 | 88 | 0.707 | 119 | 0.504 | 62 | 0.618 |
| Chizhou | C | 87 | 0.2192 | 74 | 0.580 | 37 | 0.753 | 98 | 0.505 | 101 | 0.577 |
| Hebi | C | 88 | 0.2174 | 85 | 0.577 | 35 | 0.754 | 97 | 0.505 | 100 | 0.579 |
| Tangshan | C | 89 | 0.2170 | 87 | 0.576 | 111 | 0.687 | 26 | 0.542 | 81 | 0.602 |
| Zhanjiang | C | 90 | 0.2149 | 122 | 0.555 | 33 | 0.757 | 96 | 0.505 | 83 | 0.601 |
| Yangjiang | C | 91 | 0.2099 | 107 | 0.566 | 25 | 0.765 | 18 | 0.558 | 129 | 0.555 |
| Zhuzhou | C | 92 | 0.2098 | 72 | 0.581 | 102 | 0.694 | 47 | 0.520 | 90 | 0.593 |
| Beihai | C | 93 | 0.2086 | 88 | 0.576 | 41 | 0.749 | 130 | 0.503 | 112 | 0.572 |
| Yingtan | C | 94 | 0.2079 | 123 | 0.554 | 50 | 0.738 | 99 | 0.505 | 80 | 0.603 |
| Jieyang | C | 95 | 0.2074 | 93 | 0.573 | 32 | 0.757 | 86 | 0.506 | 116 | 0.569 |
| Anqing | C | 96 | 0.2066 | 67 | 0.587 | 122 | 0.676 | 93 | 0.506 | 91 | 0.591 |
| Jiujiang | C | 97 | 0.2057 | 90 | 0.575 | 119 | 0.678 | 71 | 0.509 | 79 | 0.603 |
| Lishui | C | 98 | 0.2031 | 108 | 0.566 | 69 | 0.720 | 81 | 0.507 | 88 | 0.595 |
| Songyuan | C | 99 | 0.2023 | 135 | 0.548 | 22 | 0.770 | 138 | 0.502 | 96 | 0.584 |
| Xining | C | 100 | 0.2022 | 65 | 0.588 | 95 | 0.701 | 89 | 0.506 | 109 | 0.572 |
| Mianyang | C | 101 | 0.2012 | 109 | 0.566 | 74 | 0.717 | 69 | 0.509 | 87 | 0.595 |
| Shanwei | C | 102 | 0.2011 | 94 | 0.573 | 17 | 0.782 | 113 | 0.504 | 139 | 0.525 |
| Huangshi | C | 103 | 0.2010 | 100 | 0.571 | 100 | 0.696 | 105 | 0.505 | 86 | 0.598 |
| Wuhai | C | 104 | 0.2006 | 58 | 0.594 | 104 | 0.692 | 140 | 0.502 | 121 | 0.564 |
| Suzhou | C | 105 | 0.1996 | 138 | 0.545 | 92 | 0.704 | 134 | 0.503 | 64 | 0.617 |
| Ningde | D | 106 | 0.1981 | 101 | 0.571 | 77 | 0.716 | 44 | 0.521 | 97 | 0.582 |
| Xinxiang | D | 107 | 0.1980 | 110 | 0.566 | 121 | 0.677 | 92 | 0.506 | 74 | 0.607 |
| Tongchuan | D | 108 | 0.1964 | 78 | 0.579 | 87 | 0.707 | 118 | 0.504 | 103 | 0.577 |
| Fangchenggang | D | 109 | 0.1963 | 96 | 0.572 | 48 | 0.741 | 131 | 0.503 | 119 | 0.566 |
| Guangan | D | 110 | 0.1961 | 75 | 0.580 | 72 | 0.717 | 102 | 0.505 | 117 | 0.568 |
| Fuxin | D | 111 | 0.1956 | 81 | 0.578 | 26 | 0.764 | 129 | 0.503 | 140 | 0.524 |
| Shuangyashan | D | 112 | 0.1954 | 68 | 0.587 | 76 | 0.716 | 117 | 0.504 | 130 | 0.555 |
| Huanggang | D | 113 | 0.1946 | 91 | 0.575 | 134 | 0.634 | 108 | 0.505 | 76 | 0.606 |
| Bengbu | D | 114 | 0.1937 | 125 | 0.554 | 110 | 0.689 | 95 | 0.505 | 69 | 0.611 |
| Pingdingshan | D | 115 | 0.1883 | 82 | 0.578 | 109 | 0.690 | 107 | 0.505 | 102 | 0.577 |
| Baoji | D | 116 | 0.1870 | 66 | 0.588 | 71 | 0.717 | 75 | 0.508 | 137 | 0.529 |
| Puyang | D | 117 | 0.1863 | 111 | 0.566 | 81 | 0.712 | 88 | 0.506 | 98 | 0.582 |
| Xianyang | D | 118 | 0.1806 | 83 | 0.578 | 113 | 0.684 | 84 | 0.507 | 114 | 0.571 |
| Siping | D | 119 | 0.1773 | 86 | 0.577 | 82 | 0.711 | 139 | 0.502 | 134 | 0.550 |
| Zunyi | D | 120 | 0.1770 | 129 | 0.552 | 55 | 0.734 | 87 | 0.506 | 106 | 0.574 |
| Xuancheng | D | 121 | 0.1746 | 134 | 0.550 | 53 | 0.735 | 114 | 0.504 | 111 | 0.572 |
| Suining | D | 122 | 0.1735 | 116 | 0.561 | 91 | 0.704 | 41 | 0.523 | 108 | 0.573 |
| Tsitsihar | D | 123 | 0.1726 | 136 | 0.546 | 75 | 0.717 | 83 | 0.507 | 95 | 0.585 |
| Fuzhou | D | 124 | 0.1725 | 117 | 0.558 | 54 | 0.734 | 115 | 0.504 | 125 | 0.560 |
| Qinzhou | D | 125 | 0.1697 | 124 | 0.554 | 51 | 0.737 | 100 | 0.505 | 126 | 0.558 |
| Luoyang | D | 126 | 0.1669 | 97 | 0.572 | 123 | 0.675 | 42 | 0.522 | 120 | 0.564 |
| Kaifeng | D | 127 | 0.1616 | 131 | 0.551 | 114 | 0.683 | 70 | 0.509 | 94 | 0.585 |
| Zhangjiakou | D | 128 | 0.1601 | 119 | 0.557 | 103 | 0.694 | 106 | 0.505 | 110 | 0.572 |
| Nanchong | D | 129 | 0.1584 | 126 | 0.553 | 99 | 0.697 | 90 | 0.506 | 107 | 0.574 |
| Dandong | D | 130 | 0.1539 | 95 | 0.573 | 107 | 0.692 | 62 | 0.512 | 138 | 0.528 |
| Shangrao | D | 131 | 0.1512 | 105 | 0.567 | 116 | 0.680 | 76 | 0.508 | 131 | 0.553 |
| Chaohu | D | 132 | 0.1483 | 127 | 0.553 | 97 | 0.699 | 104 | 0.505 | 124 | 0.560 |
| Wuwei | D | 133 | 0.1467 | 141 | 0.513 | 49 | 0.741 | 141 | 0.500 | 128 | 0.557 |
| Liupanshui | D | 134 | 0.1392 | 120 | 0.556 | 83 | 0.711 | 133 | 0.503 | 141 | 0.517 |
| Liu’an | D | 135 | 0.1362 | 132 | 0.551 | 117 | 0.680 | 121 | 0.504 | 122 | 0.561 |
| Bozhou | D | 136 | 0.1287 | 140 | 0.542 | 125 | 0.664 | 135 | 0.503 | 113 | 0.572 |
| Shangqiu | D | 137 | 0.1237 | 137 | 0.546 | 136 | 0.628 | 123 | 0.504 | 105 | 0.575 |
| Zhoukou | D | 138 | 0.1226 | 139 | 0.544 | 140 | 0.595 | 109 | 0.505 | 99 | 0.582 |
| Nanyang | D | 139 | 0.1201 | 133 | 0.551 | 128 | 0.653 | 94 | 0.506 | 127 | 0.557 |
| Yangquan | D | 140 | 0.1142 | 128 | 0.553 | 141 | 0.580 | 72 | 0.509 | 118 | 0.567 |
| Fuyang | D | 141 | 0.1103 | 130 | 0.552 | 138 | 0.617 | 125 | 0.504 | 123 | 0.561 |
Conflicts of Interest
References
- Allen, J.S. Global City-Regions: Trends, Theory, Policy; Oxford University Press: Oxford, UK, 2001. [Google Scholar]
- Fang, C.L.; Yao, S.M.; Liu, S.H. China’s Urban Agglomeration Development Report 2010; Science Press: Beijing, China, 2010. [Google Scholar]
- Liu, H. Comprehensive carrying capacity of the urban agglomeration in the Yangtze River Delta, China. Habitat Int. 2012, 36, 462–470. [Google Scholar] [CrossRef]
- Sun, Y. The Analysis of urban competitiveness of the Three Largest Urban Clusters in China. Econ. Soc. Dev. 2006, 12, 43–52. [Google Scholar]
- Xu, X.Q.; Cheng, Y.H. Spatial-temporal Changes of Urban Competitiveness in Urban Cluster of Pearl River Delta. Sci. Geogr. Sinica 2006, 3, 257–265. [Google Scholar]
- Guo, H.X.; Chen, L. Comparative Analysis on Urban Competitiveness Based on TOPSIS Method—A Case Study of Pearl River Delta City Group. East China Econ. Manag. 2013, 1, 69–74. [Google Scholar]
- Shi, Y.S.; Zhang, H.Y. An Analysis of Urban Comprehensive Competitiveness and Regional Advantages of the Yangtze River Delta. Urban Plan. Forum 2002, 1, 17–21. [Google Scholar]
- Yu, L.Y.; Guo, H.J. The Evaluation Index System Research of Urban Competitiveness of Yangtze River Delta under City Cooperation framework. Sci. Technol. Manag. Res. 2010, 11, 95–98. [Google Scholar]
- Porter, M.E. The Competitive Advantage of Nation; The Free Press: New York, NY, USA, 1990; pp. 13–20. [Google Scholar]
- Gordon, L.R.; Cheshire, P.C. Location Advantage and the Lessons of Territorial Competition in Europe; Springer-Berlin-Heidelberg: Berlin, Germany, 1998. [Google Scholar]
- Webster, D. Urban Competitiveness Assessment in Developing Country Urban Regions: The Road Forward; Paper Prepared for Urban Group; The World Bank: Washington, DC, USA, 2000. [Google Scholar]
- Iain, B. Cities and competitiveness. Urban Stud. 1999, 36, 795–809. [Google Scholar] [CrossRef]
- Ning, Y.M.; Tang, L.Z. The Concept and Indicator System of Urban Competitive Capacity. Urban Res. 2001, 3, 19–22. [Google Scholar]
- Schwab, K.; Porter, M. The Global Competitiveness Report 2008–2009; World Economic Forum: Geneva, Switzerland, 2006. [Google Scholar]
- Hutton, T.A. Trajectories of the new economy: Regeneration and dislocation in the inner city. Urban Stud. 2009, 46, 987–1001. [Google Scholar] [CrossRef]
- Kresl, P.K.; Singh, B. Competitiveness and the urban economy: Twenty-four large US metropolitan areas. Urban Stud. 1999, 36, 1017–1028. [Google Scholar] [CrossRef]
- Tong, Q. Northwest Area Center Urban Competitiveness Comparative Study from 1990; Xi’an University of Architecture &Technology: Xi’an, China, 2004. [Google Scholar]
- Jiang, Y.; Shen, J. Measuring the urban competitiveness of Chinese cities in 2000. Cities 2010, 27, 307–314. [Google Scholar] [CrossRef]
- Singhal, S.; McGreal, S.; Berry, J. An evaluative model for city competitiveness: Application to UK cities. Land Use Policy 2013, 30, 214–222. [Google Scholar] [CrossRef]
- Porter, M.E.; Sachs, J.; Schwab, K. Global Competitiveness Report; Oxford University Press: Oxford, UK, 2002; pp. 16–25. [Google Scholar]
- Lopez-Claros, A.; Schwab, K.; Michael, E. The Global Competitiveness Report 2006–2007; World Economic Forum: Geneva, Switzerland, 2006. [Google Scholar]
- Ni, P.; Kresl, P.K. Global Urban Competitiveness Report 2007–2008; Social Sciences Academic Press: Beijing, China, 2009. [Google Scholar]
- Porter, M.E. The Competitive Advantage of Nations; Huaxia Press: Beijing, China, 2002. [Google Scholar]
- Rondinelli, D.A.; Vastag, G. Urban Economic Growth in the 21st Century: Assessing the International Competitiveness of Metropolitan Areas. In Migration, Urbanization and Development: New Directions and Issues; United Nations Population Fund and Kluwer Academic Publishers: New York, NY, USA, 1998. [Google Scholar]
- Ni, P. Annual Report on Urban Competitiveness; Social Science Academic Press: Beijing, China, 2008. [Google Scholar]
- Lin, B.; Feng, Y. A Survey of Urban Competitiveness Theory. Econ. Perspect. 2003, 1, 56–59. [Google Scholar]
- Chinese Academy of Social Sciences. Blue Book of Urban Competitiveness in 2007; Social Sciences Academic Press: Beijing, China, 2007. [Google Scholar]
- China City Statistical Yearbook; Chinese Statistical Bureau Press: Beijing, China, 2010.
- China Statistical Yearbook on Environment; Chinese Statistical Bureau Press: Beijing, China, 2010.
- China Energy Statistical Yearbook; Chinese Statistical Bureau Press: Beijing, China, 2010.
- Hwang, C.L.; Yoon, K. Multiple Attribute Decision Making: Methods and Applications; Springer: Berlin, Germany, 1981. [Google Scholar]
© 2015 by the authors; licensee MDPI, Basel, Switzerland. This article is an open access article distributed under the terms and conditions of the Creative Commons Attribution license (http://creativecommons.org/licenses/by/4.0/).
Share and Cite
Guo, H.; Liu, X.; Li, Y.; Wang, D.; Chen, X. Comparison Analysis and Evaluation of Urban Competitiveness in Chinese Urban Clusters. Sustainability 2015, 7, 4425-4447. https://doi.org/10.3390/su7044425
Guo H, Liu X, Li Y, Wang D, Chen X. Comparison Analysis and Evaluation of Urban Competitiveness in Chinese Urban Clusters. Sustainability. 2015; 7(4):4425-4447. https://doi.org/10.3390/su7044425
Chicago/Turabian StyleGuo, Haixiang, Xiao Liu, Yijing Li, Deyun Wang, and Xiaohong Chen. 2015. "Comparison Analysis and Evaluation of Urban Competitiveness in Chinese Urban Clusters" Sustainability 7, no. 4: 4425-4447. https://doi.org/10.3390/su7044425