Article

The Economic Costs of Climate Change: A Multi-Sector Impact Assessment for Vietnam

1
United Nations University World Institute for Development Economics Research, Katajanokanlaituri 6 B, 00160 Helsinki, Finland
2
University of Copenhagen, Øster Farimagsgade 5, building 35, DK-1353 Copenhagen K, Denmark
3
International Food Policy Research Institute, 2033 K Str. NW, Washington, DC 20006, USA
*
Author to whom correspondence should be addressed.
Sustainability 2015, 7(4), 4131-4145; https://doi.org/10.3390/su7044131
Submission received: 1 February 2015 / Revised: 24 March 2015 / Accepted: 25 March 2015 / Published: 9 April 2015

Abstract

:
We adopt a multi-sectoral approach and consider the full range of climate projections. Biophysical damages are translated into economic costs using a dynamic economy-wide model. Our results indicate that the negative impacts on agriculture and roads are modest to 2050. Larger costs are caused by rising sea levels and cyclone strikes. Overall, climate change is likely to reduce national income by between one and two percent by 2050 (relative to a historical baseline). Damages double under more extreme projections. Our findings suggest that there are net benefits from selected pre-emptive actions though careful consideration of opportunity costs is required.
JEL:
O13; O21; Q51; Q54

1. Introduction

Vietnam is often said to be particularly vulnerable to anthropogenic climate change (see, for example, Mendelsohn et al. [1]. This is due to at least three of the country’s characteristics. First, despite rapid economic growth and transformation, much of Vietnam’s population still depends on agriculture. Second, Vietnam’s position at the end of trans-boundary river basins, including the Red and Mekong Rivers, exposes the country to inland flooding. Third, Vietnam’s long, low-lying coastline is vulnerable to cyclone strike. Rising sea levels provide a literal platform for cyclone induced storm surges. This combination substantially increases the area at risk to storm surge, particularly in low lying river deltas, even if the intensity of cyclones remains unchanged. Consequently, a changing climate could jeopardize farm revenues and rural livelihoods [2,3,4,5]. Inundation from flooding events, sea level rise (SLR), and cyclone strike could displace large populations and damage or destroy capital including valuable transport and energy infrastructure [6,7,8,9]. Together, these characteristics mean that crucial economic sectors, i.e., agriculture, energy and infrastructure, are exposed to climate risks that could influence Vietnam’s long-term development prospects.
Climate change studies in Vietnam have tended to focus on specific impact channels (i.e., agriculture or sea level rise) or certain regions (i.e., river deltas). Most of the studies cited above conclude that climate change will have detrimental effects on Vietnam. For example, Yu et al. [5] conclude that rice yields “are likely to severely compromised” (p. v) while Adger [2] points to heightened social vulnerability in coastal zones due to the combination of climate change and an erosion of collective action on protection from extreme events as a consequence of the transition from central planning. However, it is difficult to integrate sector level findings in order to identify the main transmission channels, or to evaluate how sector level impacts might compound or offset each other (i.e., via economy-wide linkages or adaptation mechanisms, see Adger et al. [10]). This information is needed for prioritizing policy responses and adaptation investments, especially over the long run. Moreover, most quantitative studies consider only a few global climate change projections representing a small share of potential future outcomes. Knowledge of the full range of potential outcomes and risk is obviously desirable in the elaboration of robust development strategies.
This article is one of four in this special issue that consider climate change’s biophysical and economic impacts on Vietnam using an integrated or multi-sector modeling framework. Sector level impact channels include water, agriculture and hydropower [4], road infrastructure [6], and cyclones and storm surge [8]. This article combines these sectoral impact channels to provide an economy-wide assessment of climate change for Vietnam. The paper is structured as follows. Section 2 describes the climate change projections for Vietnam and summarizes those results from the sector level studies that feed directly into the economic analysis. Section 3 describes the economy-wide modeling framework and the baseline and climate change scenarios. Section 4 discusses the simulation results, and the concluding section summarizes our findings and discusses their implications for adaptation policy.

2. Climate Change in Vietnam

2.1. Climate Change Projections

There is much uncertainty surrounding climate change projections. General circulation models (GCMs) produce a wide range of possible future climates, especially at the country level. This is partly due to differences in modeling earth-atmosphere relationships. It is also unclear how the global economy will evolve over the next century. This means that different emission scenarios are identified and modeled based on projected populations, economic growth and technological progress. In order to capture the distribution of possible climate realizations, we employ the results from 22 GCMs and 3 special report emissions scenarios (SRES) (see Arnell et al. [11]). This gives 56 future scenarios since not every GCM simulates every SRES.
Assuming each GCM/SRES scenario is “equally unlikely”, the projections suggest that Vietnam’s temperature will rise by a median value of 1.5 °C above a historical baseline by the 2040s, with most projections clustered around this value. Precipitation projections are more uncertain. Precipitation declines slightly, as reflected by the median projection, but dryer conditions are only somewhat less likely than wetter conditions at the national level. This uncertainty extends to all regions, where both rising and falling precipitation levels are projected.
Figure 1 shows projected changes in Vietnam’s climate moisture index (CMI), which is a composite indicator of temperature and precipitation outcomes by decade (for 56 GCMs) and by emissions scenario [12]. The CMI is calculated using annual precipitation and potential evapotranspiration. A climate is classified as becoming more arid (humid) when potential evapotranspiration increases (decreases) relative to precipitation (i.e., a CMI of −1 is very arid whereas +1 is very humid).
Figure 1. Deviations in average national climate moisture index from baseline due to climate change. Note: Authors’ calculations using results from Gebretsadik et al. [4]. The decadal box and whisker plots employ results from all 56 GCMs employed for the associated decade. The plots labelled A1b, A2 and B1 show results across all decades for GCMs associated with these emission scenarios. Dots show outliers.
Sustainability 07 04131 g001
Vietnam’s already high levels of humidity limit changes in potential evapotranspiration (PET). Nevertheless, PET tends to rise by more than precipitation in most regions. The CMI suggests that Vietnam’s climate conditions will tend to become more arid as a result of climate change, though the median change is not dramatic. There is, again, considerable uncertainty, especially at the regional level.

2.2. Biophysical Impacts

Climate projections are translated into biophysical impacts via a series of specialized sector models. Figure 2 shows the flow of information through the river basin and water resource models down to the sector models that are used to estimate impacts on agriculture, energy and infrastructure. River basin models determine streamflow for water resource models, which then estimate water availability for hydropower models. The river basin model also predicts flood frequency and severity, which, together with precipitation and temperature, determines road damages in the infrastructure model. Climate projections directly affect production in the crop models. We also capture land inundation from SLR and storm surges from cyclone activity. Finally, the biophysical results are passed down to a multi-sector economic model that estimates the economy-wide impacts of climate change.
Figure 2. Integrated modeling framework.
Sustainability 07 04131 g002
Gebretsadik et al. [4] estimate how climate change affects irrigation demand and yields (both dryland and irrigated) for a variety of crops in each of Vietnam’s eight regions. The authors’ main results are summarized in Figure 3. Irrigation demand is found to generally rise throughout Vietnam in response to climate change, leading to lower irrigation coverage rates. However, deviations from baseline irrigation coverage are fairly small and so the impact of climate change on the production of irrigated rice—Vietnam’s primary staple crop—is modest. Yield impacts on other crops are generally larger. For example, average yields for annual crops fall by more than 10 percent by the late-2040s under the median climate change projection. These averages disguise, to a considerable degree, the impact of extreme drought events in particular years. With 56 future climates and detailed crop modeling, the framework employed is well suited to capturing extreme events such as drought. With higher temperatures, the same rainfall shortage leads to a more severe drought as the plants water needs are greater. Hence, part of the generalized decline in annual (dryland) crop reflects this greater sensitivity to precipitation shortfalls.
Gebretsadik et al. [4] also consider how changes in streamflow due to climate change affect hydropower generation. Their analysis of Vietnam’s 22 river basins shows that national generating capacity in the 2040s remains virtually unchanged from the baseline under the median climate change projection. There is, however, wide variation around the median, with projected national capacity rising or falling by more than 5 percent relative to the baseline in certain extreme climate change projections.
We simulate road infrastructure impacts using the “CLIROAD” model, which includes various stressor-response functions, such as heat and precipitation damage and road losses from severe flooding (see Chinowsky and Arndt [13]). The model also tracks maintenance costs and new road investments. In order to assess impacts, we hold budget allocations to road networks constant as a share of total government expenditure (which in turn is held at a constant share of absorption). With fixed allocations to various road types, total road network becomes the indicator of climate change impact. The principal mechanism at work is that greater allocations to maintenance leave reduced budget for road network expansion. The focus on network length provides a useful link to the literature on road network density and productivity as surveyed in Chinowsky and Arndt [13].
The results shown in Figure 3 indicate that, in some scenarios, road network length actually increases as a result of climate change. Dryer scenarios often favor road network length due to reduced washouts from precipitation and flooding. Nevertheless, most climate projections reduce road network length due to three factors. First, all climate projections indicate higher temperatures. Higher maximum temperatures accelerate the degradation of paved roads unless steps are taken to render roads more robust. These adjustments are not considered “autonomous” adaptation in the road infrastructure model and so rising temperatures lead to higher maintenance costs, which in turn displaces new road investment. Second, even though precipitation at the national level declines slightly, the intensity of precipitation tends to increase, leading to a higher rate of washouts, particularly for unpaved roads. Third, the increase in precipitation intensity leads to, in most scenarios, a small rise in the frequency and intensity of flooding events. In a few climate projections, large scale flooding becomes much more frequent, leading to more substantial declines in the total road stock.
Figure 3. Deviation in composite crop yields, irrigation water demand coverage, and road network length from baseline during 2046–2050 due to climate change. Note: Authors’ calculations using results from Gebretsadik et al. [14]. Dots show outliers.
Sustainability 07 04131 g003
Chinowsky et al. [6] estimate the additional impacts of SLR on coastal road infrastructure in Vietnam. SLR of one meter, which is an extreme scenario, damages almost the entire road-stock in the low-lying Mekong River Delta. Road infrastructure in the Red River Delta and parts of the South East are also vulnerable to SLR, with damages to a fifth of certain districts’ road-stocks. Overall, the authors estimate that one meter SLR causes US$2 billion in road damages.
Finally, Neumann et al. [8] consider the coupled effect of sea level rise (SLR) and storm surges. Cyclones are already a regular occurrence in Vietnam, but SLR will increase the extent to which storm surges are able to reach inland and damage infrastructure. The authors examine a range of SLR from 0.16 to 0.38 m. In the worst scenario, the authors find that the effective frequency of a 100-year event (i.e., a five meter storm surge) almost doubles so that it becomes a 60-year event by 2050. Around 10 percent of Hanoi’s GDP is exposed to 0.38 m SLR, and this rises to more than 40 percent during a 100-year event.
The sector level studies indicate potential losses from climate change, although there is considerable variation across climate projections, with Vietnam benefiting from climate change in some cases. This emphasizes the need to evaluate the full distribution of climate change projections. In the next section we describe the economy-wide model used to translate biophysical into economic impacts.

3. Economy-wide Modeling Framework

The sector level results summarized above are passed down to a dynamic computable general equilibrium (CGE) model of Vietnam, which estimates the economy-wide impact of the baseline and climate change scenarios, including spillovers from the individual sectors to each other and to the rest of the economy (i.e., indirect or economy-wide linkages). Our dynamic CGE model belongs to the structural neoclassical class of models (see Dervis et al. [14]) and is well-suited to analyzing climate change. First, it simulates the functioning of a market economy, including markets for labor, capital and commodities, and therefore can evaluate how changing economic conditions are mediated via prices and markets. Second, the model ensures that all economy-wide constraints are respected, such as foreign exchange and factor resource supply constraints. These are crucial for long-run climate change projections. Finally, the model contains a detailed sector breakdown and provides a “simulation laboratory” for quantitatively examining how the individual impact channels of climate change influence the performance and structure of the whole economy. For these reasons, economy-wide assessments, already a main workhorse for mitigation policies, are increasingly used to consider climate change impacts and adaptations (e.g., [15,16,17,18]).
Diao and Thurlow [19] provide a detailed specification of the core model employed here. Briefly, economic decision-making in the CGE model is the outcome of decentralized optimization by producers and consumers within a coherent economy-wide framework. A variety of substitution mechanisms occur in response to variations in relative prices, including substitution between factors, between imports and domestic goods, and between exports and domestic sales. The Vietnam model contains 30 representative producers or sectors, including electricity generation, transport services and ten agricultural sub-sectors [20]. Eleven factors of production are identified: six types of labor (primary, secondary and tertiary educated in rural and urban areas), agricultural land, three types of farm capital (crop, livestock and fisheries), and non-farm capital. Agricultural activities and their land and capital are distributed across eight sub-national regions (Red River, North East, North West, North Central, South Central, Central Highlands, South East and Mekong River). This sectoral and regional detail captures Vietnam’s economic structure and influences model results.
Climate change affects economic growth and welfare in the CGE model via three principal mechanisms. First, the changes in crop yields and irrigation demand estimated by the water and crop models are imposed on the subsector production functions in the CGE model, which then determines how much of the available resources should be devoted to each crop given their profitability relative to other farm and non-farm activities (i.e., “autonomous adaptation”). Profitability is here defined as the rental rate on fixed sector-specific capital.
Second, the CGE model directly incorporates fluctuations in hydropower production. River flows only affect crop production if the irrigated area available for planting exceeds the maximum potential area that could be irrigated given water availability constraints. Changes in the supply of hydropower will affect all industries and households depending on their energy-intensity of production and consumption.
Third, the length of regional road networks is used in the CGE model to determine the productivity of transport services. As mentioned above, the road infrastructure model explicitly holds constant factors such as road width and the shares of investment allocated to different classes of roads (e.g., paved or unpaved). This implicitly assumes that planners are equally effective at determining where new road construction should take place across climate scenarios. Given that these and other determinants of transport productivity are held constant, a shorter road network is assumed to lower transport productivity and increase the cost of moving goods between producers and consumers.
Finally, the CGE model also incorporates the effects of SLR on road infrastructure and on the changing availability of cultivable land due to land inundation. Capital stocks, reflecting non-road infrastructure and productive assets, are also damaged during randomly determined cyclones and storm surges (discussed in the next section).
Dynamic processes are important given the long time frame over which climate change will unfold. Our CGE model’s recursive dynamics allows it to capture annual changes in the rate of physical and human capital accumulation and technical change. Therefore, for example, if climate change reduces agricultural or hydropower production in a given year, it also reduces income and hence savings. This reduction in savings displaces investment and lowers production potential. Similarly, higher road maintenance costs imply less infrastructure investment and shorter road networks both now and in the future. Extreme events, such as flooding, also destroy infrastructure with lasting effects. Generally, even small differences in accumulation can cause large differences in economic outcomes over long time periods. Our CGE model is well-suited to capture these path-dependent effects.

4. Simulation Results

4.1. Baseline Scenario

In order to estimate the economic impact of climate change for Vietnam it is necessary to first specify a baseline scenario that reflects future development trends, policies and priorities in the absence of climate change. The baseline provides a reasonable trajectory for growth and structural change of the economy for the period 2007–2050 upon which we can overlay the impacts of climate change.
Economic growth in the CGE model is determined by rates of factor accumulation and technical change. For labor supply, we assume that the stock of labor grows at 2.5, 2.0 and 1.5 percent for tertiary, secondary and primary labor categories, respectively. We assume that cultivated crop land is scarce such that growth agricultural production increasingly depends on adopting improved technologies rather than expanding land use. Improvements in the education levels of the workforce are assumed to enhance productivity growth, with productivity rising for tertiary and secondary workers (i.e., at 2.0 and 1.0 percent per year, respectively) compared to no factor specific technical advance for primary educated workers. Baseline annual growth in hydropower generation and regional road networks are determined by the sector models using historical climate data. Under the above assumptions, Vietnam’s economy grows at 5.4 percent per annum, with agriculture’s contribution to GDP falling from 15.7 to 7.5 percent during 2007–2050. This strong growth in per capita GDP leads to significant improvements in average household welfare.

4.2. Climate Change Scenarios

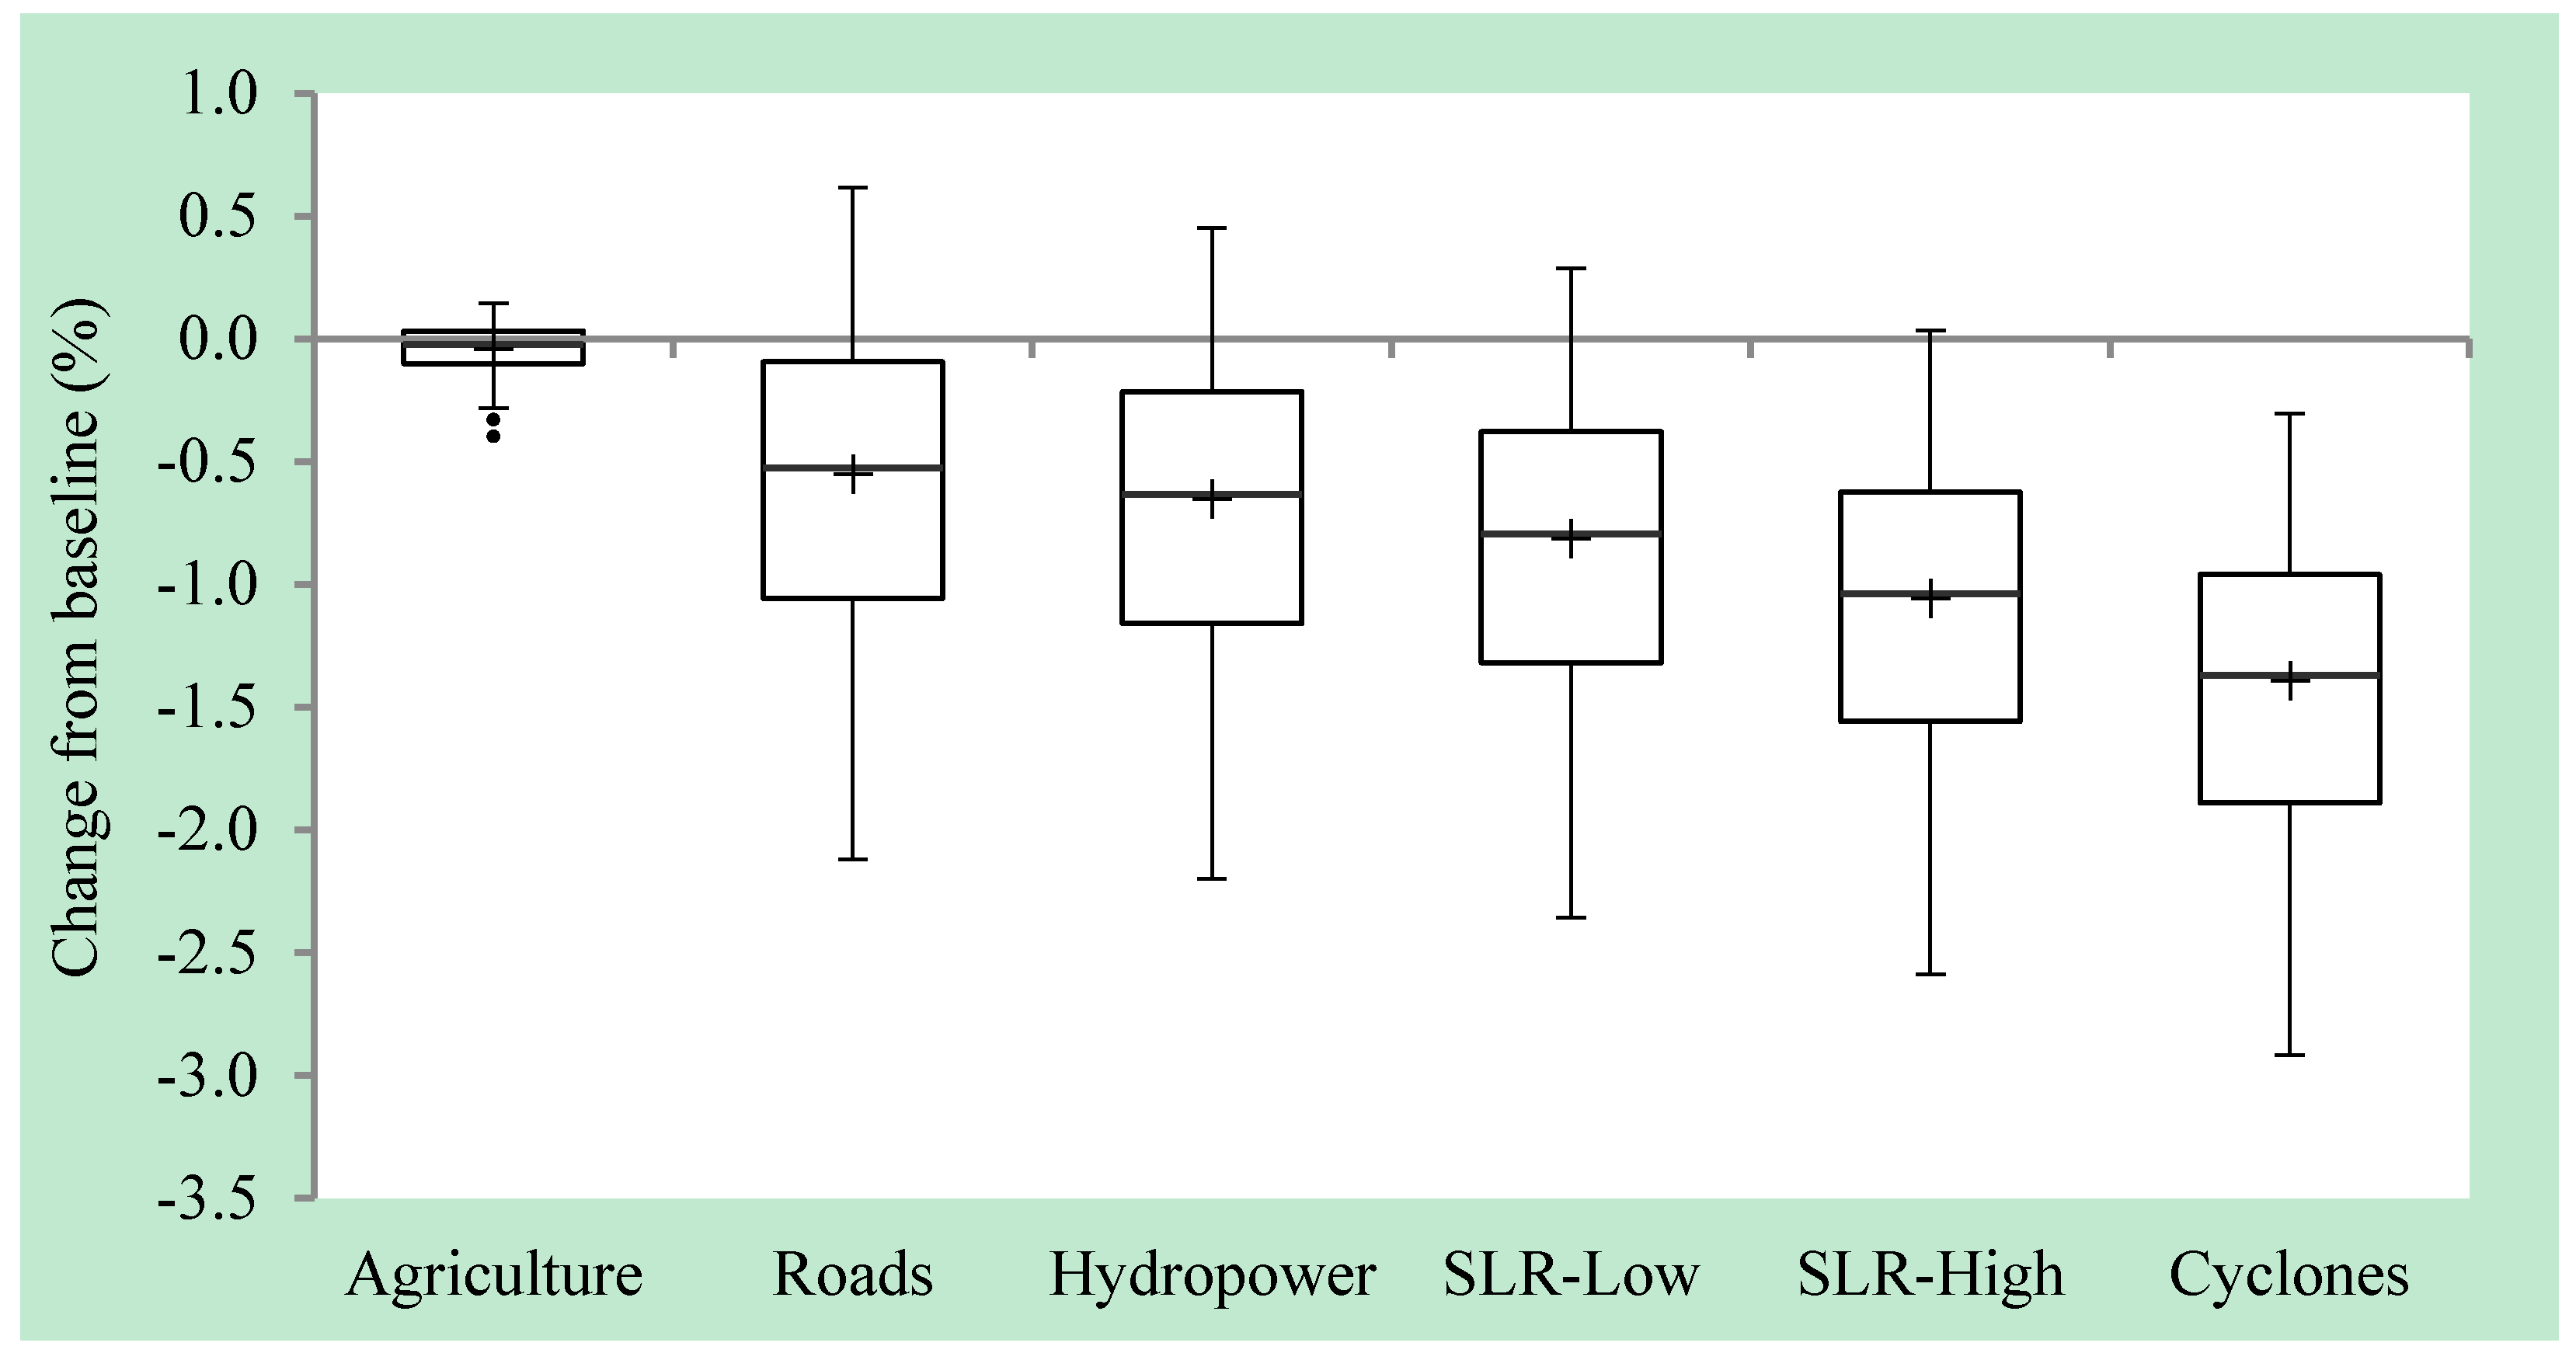
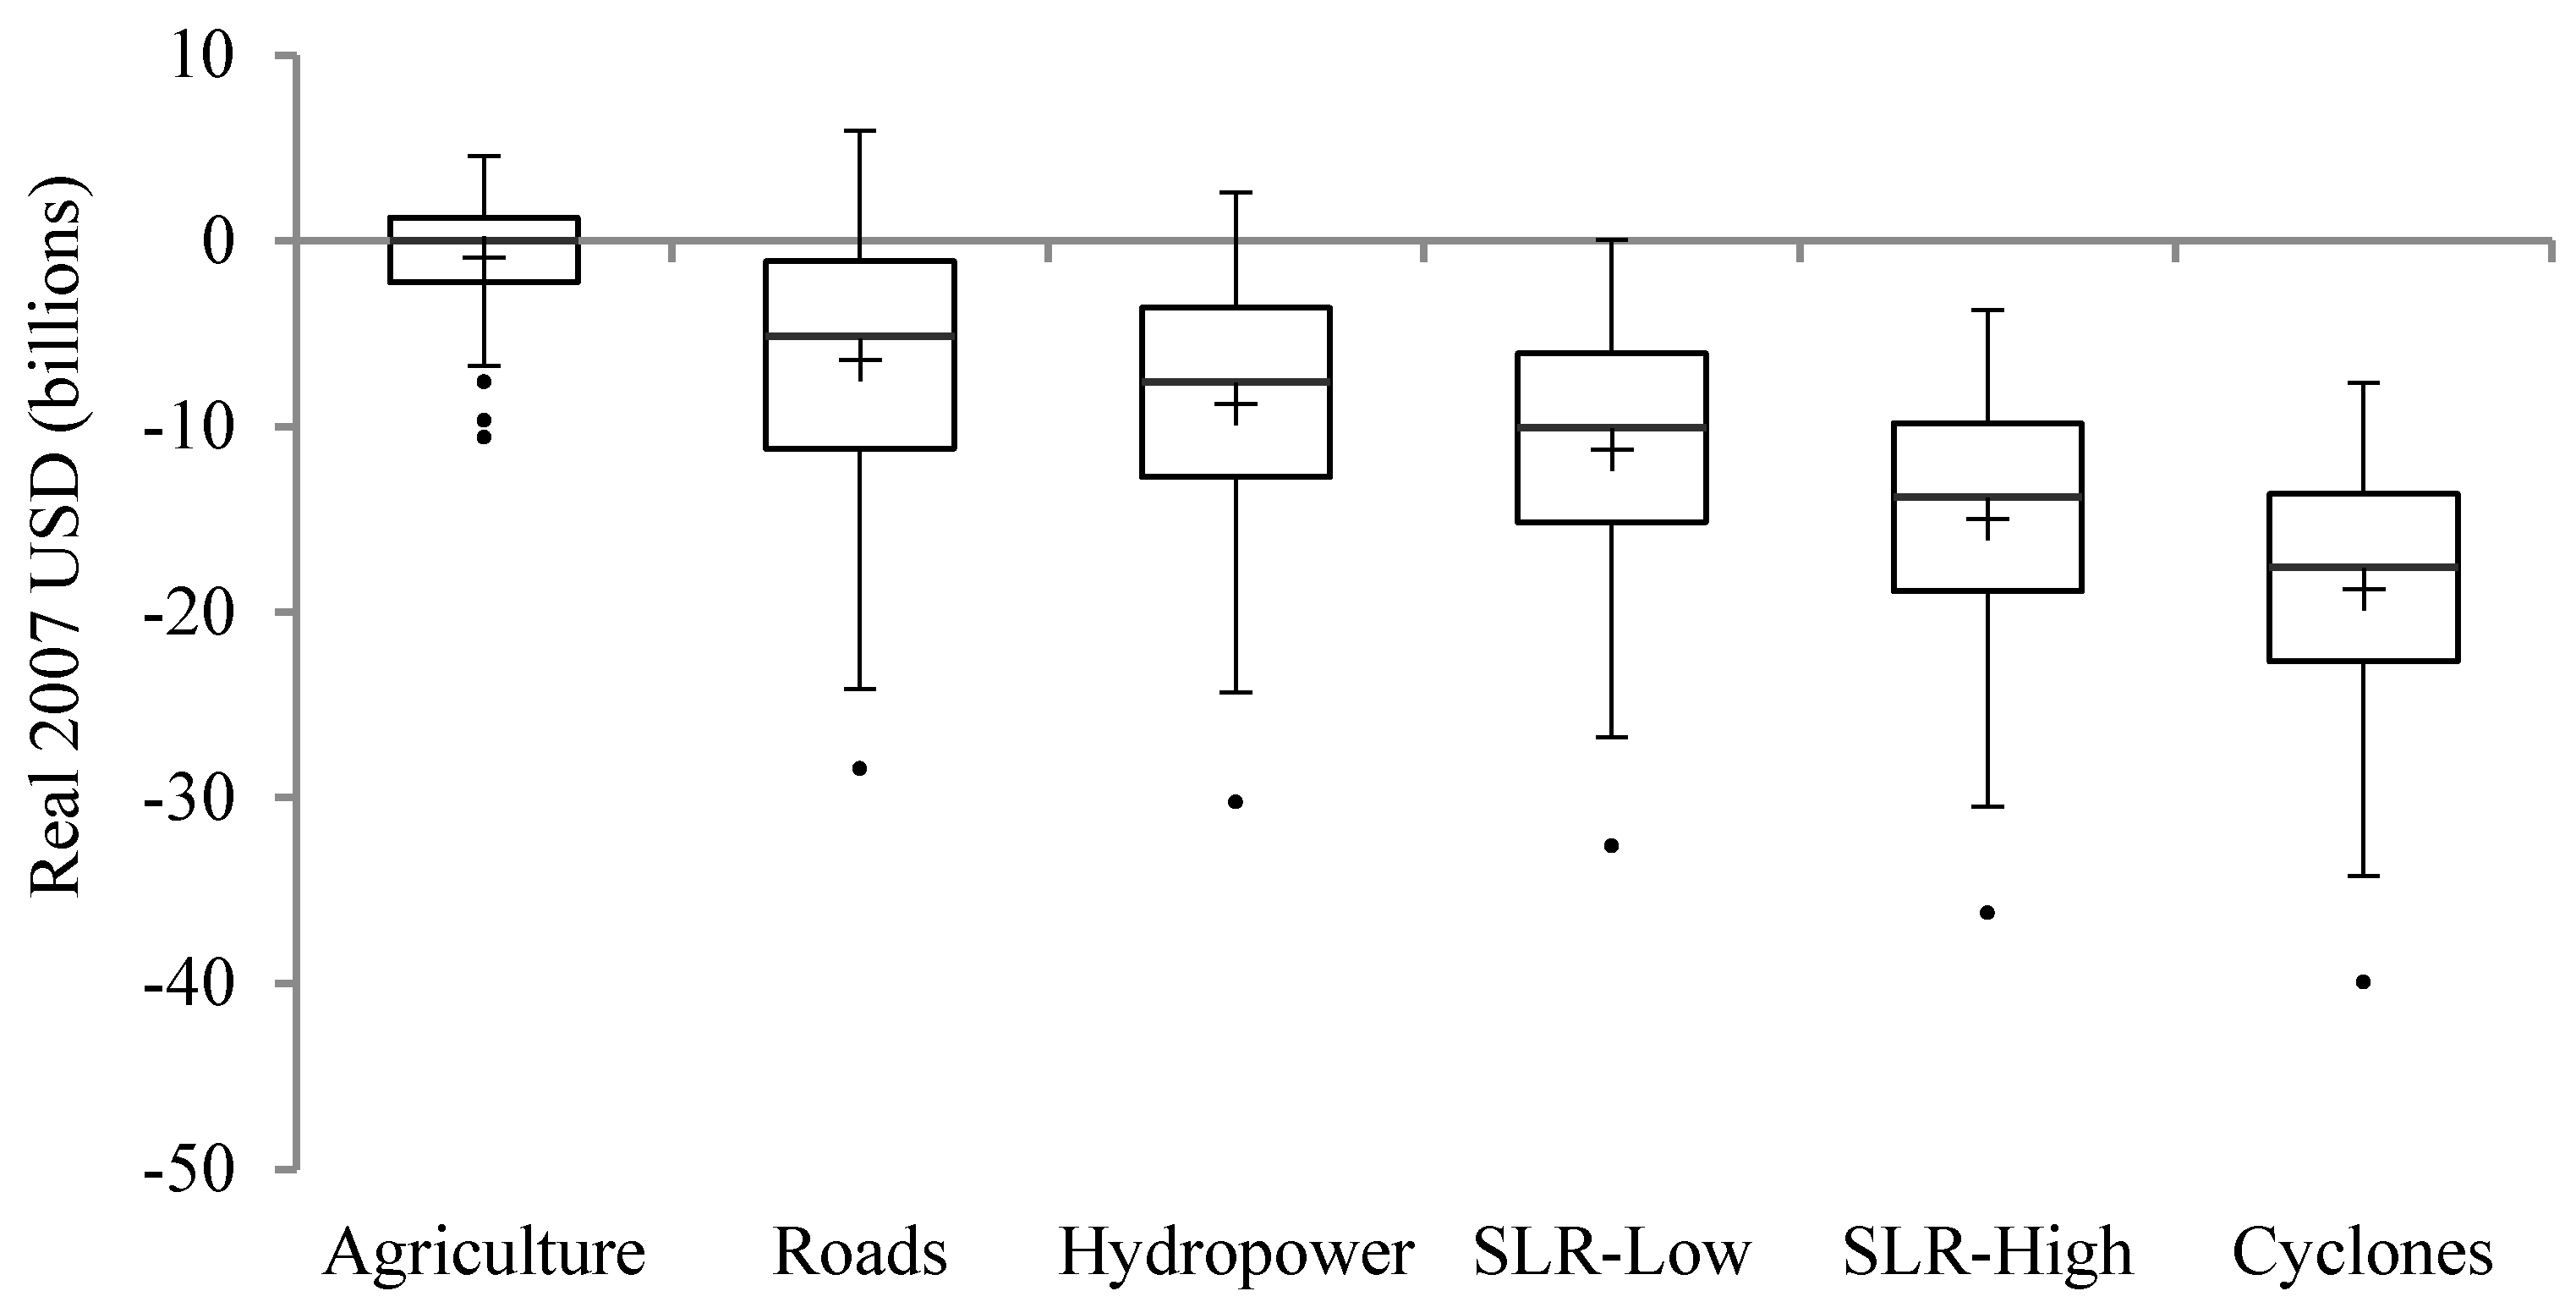
Figure 4 reports the deviation in average real GDP across the climate projections for the period 2046–2050 (relative to the baseline). The average is reported in order to limit the implications of shocks during a particular year. Note that the impacts of each transmission channel are cumulative from left to right in the figure. In other words, the Roads scenario includes the effects of the Agriculture scenario; the Hydropower scenario includes the effects of both the Roads and Agriculture scenarios; and so on until the Cyclone scenario, which includes all transmission channels. The sector level climate change shocks imposed on the CGE model are summarized in Table 1.
Figure 4. Deviation in average real GDP from baseline during 2046–50 due to climate change. Scenarios are cumulative from left to right. Note: CGE model results. Dots show outliers.
Sustainability 07 04131 g004
Table 1. Climate change scenarios.
ScenarioDescription of Impacts
1AgricultureProjected temperature and precipitation changes on crop yields (from CLICROP) combined with changes in irrigated land area based on unmet irrigation demands (from CLIRUN).
2RoadsChanges in temperature and precipitation and flood frequency and severity on road network length (from CLIROAD).
3HydropowerStreamflow changes on the generation capacity of hydropower installations (from IMPEND)
4SLR-LowIncremental crop land losses and infrastructure damages from a linear sea level rise reaching 16 cm by 2050.
5SLR-HighAs above but with sea levels rising by 38 cm by 2050.
6CyclonesProbabilistic cyclone strikes on coastal regions with only the incremental impacts caused by higher sea levels imposed as a climate change shock.
Beginning with the 
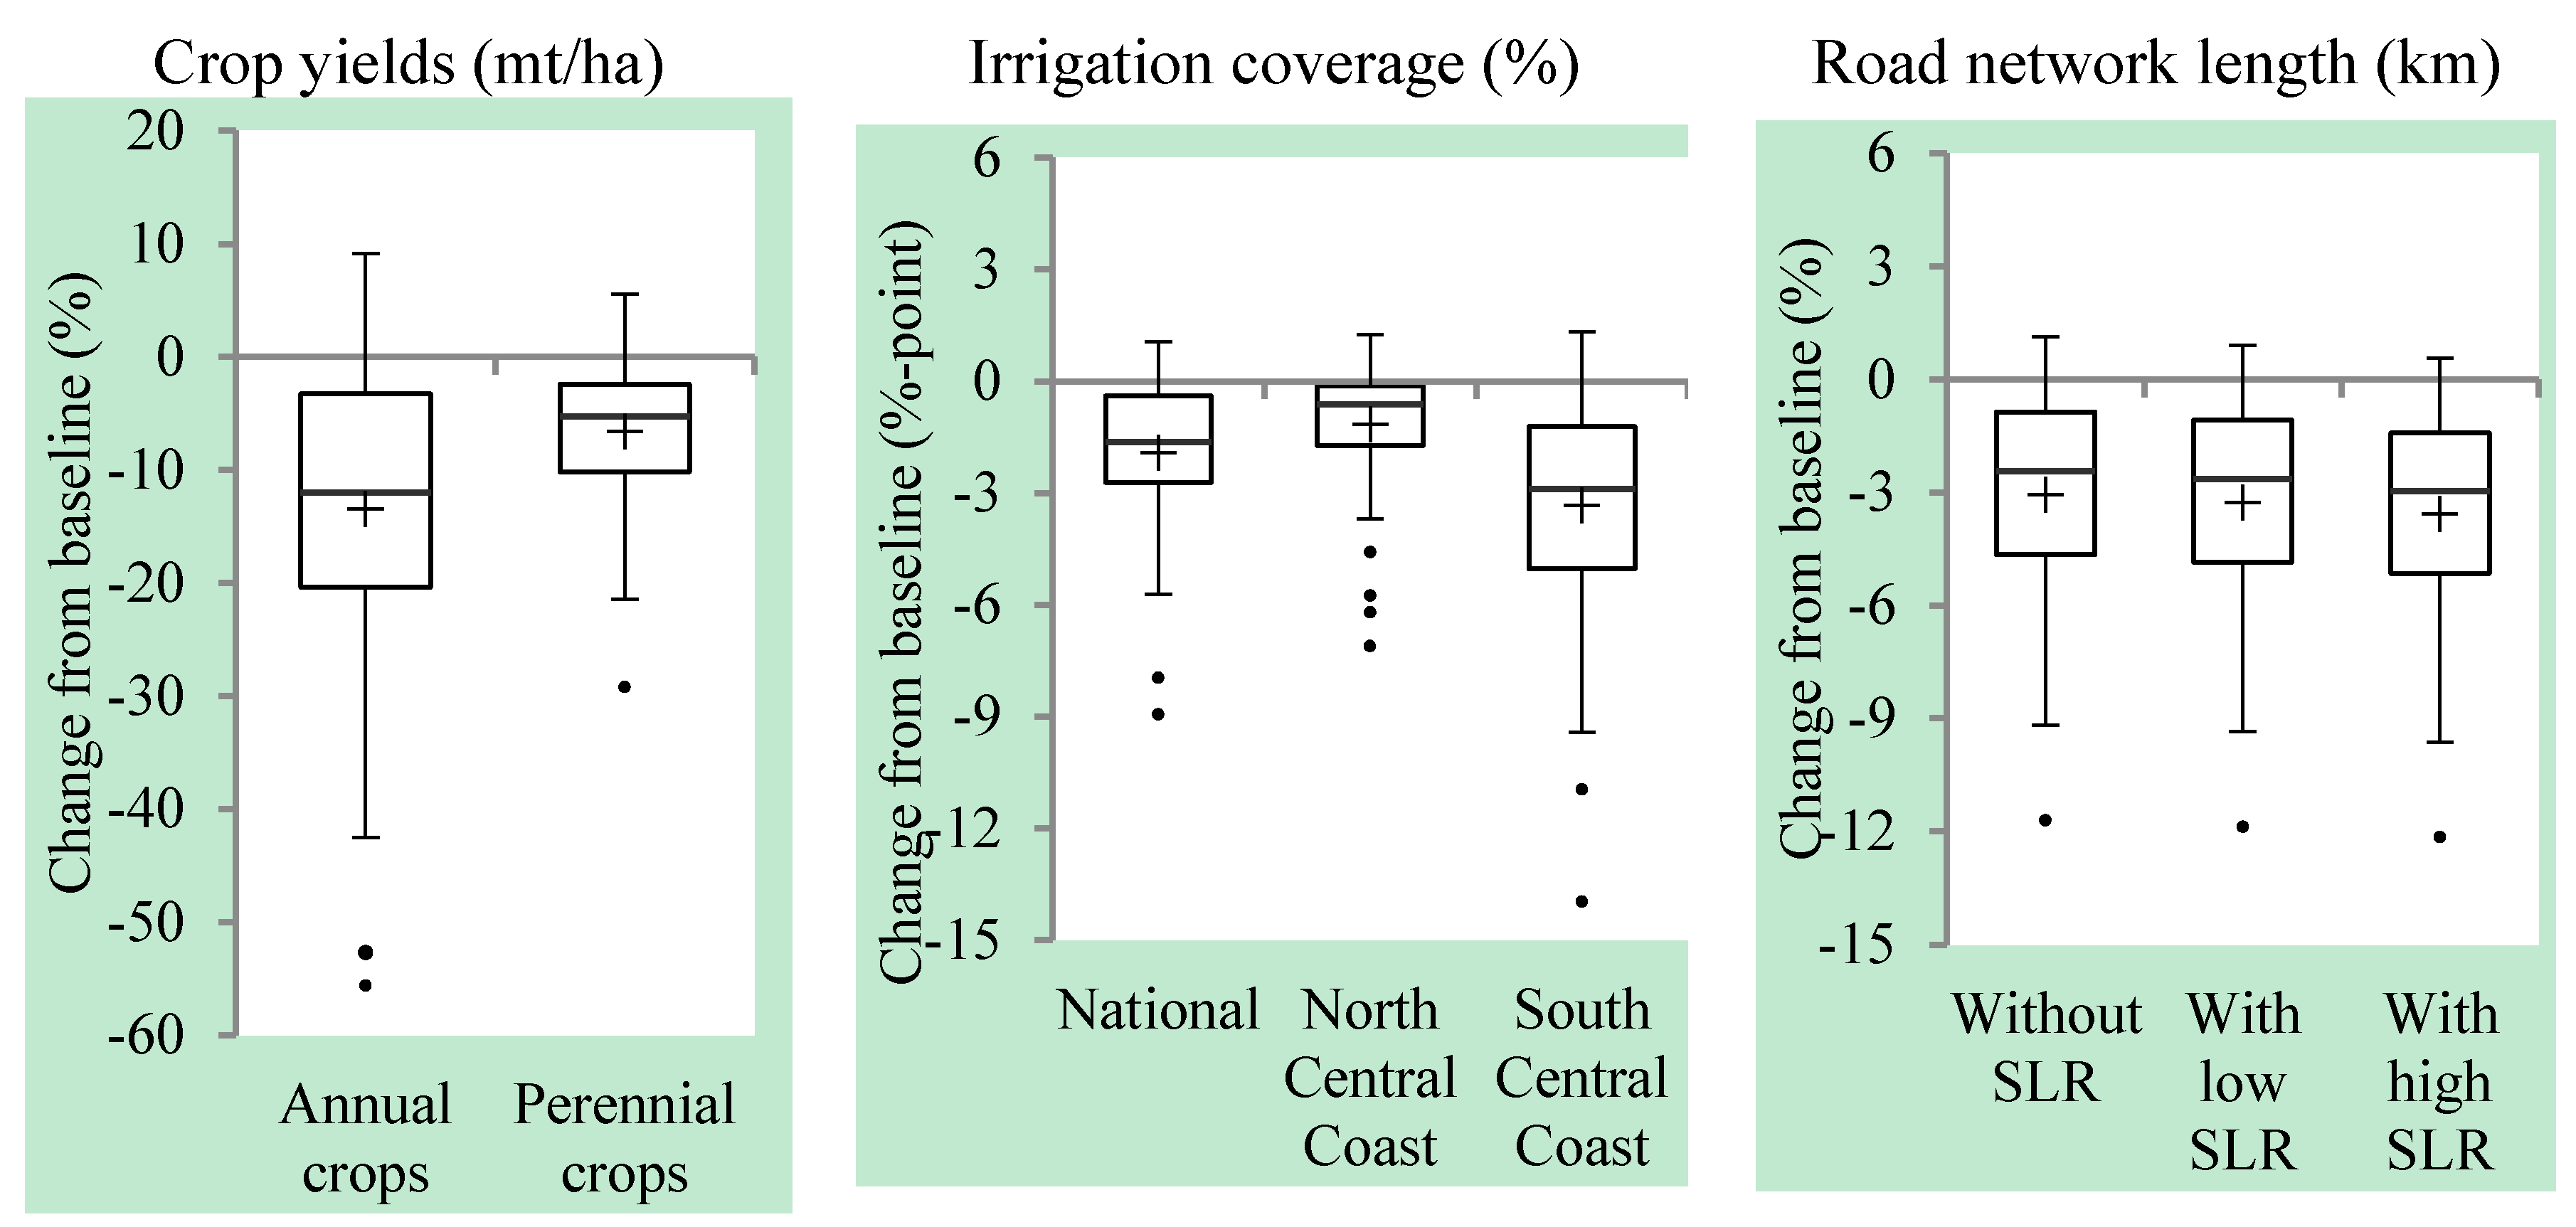
Agriculture scenario, we find the implication of climate change to be fairly small when the land losses caused by SLR are excluded. In other words, only the implications of the yield shocks and unmet irrigation demands are imposed (see Figure 3). The implications of these shocks for the national economy and for growth are modest for two reasons. First, the shocks themselves are not particularly large in most instances. Second and importantly, agriculture’s share of GDP falls in the baseline and remains strictly between 7 and 8 percent of GDP across all climate change projections by about 2050. Since agriculture’s contribution to the economy in the baseline declines regardless of climate change (a strong empirical regularity), variations or reductions in agricultural GDP have an increasingly muted effect on the national economy and overall economic growth rates.
In the Roads scenario depicted in Figure 4, the implications of climate change become more pronounced. Although climate change sometimes produces positive outcomes, they are more likely to be negative at a national scale. These implications are driven by results from the road infrastructure model (excluding infrastructure lost due to SLR). Figure 3 summarized the distribution of changes in road network length relative to the baseline scenario. As indicated earlier, the road infrastructure model is fully integrated within the CGE model, with road network length directly influencing the rate of total factor productivity (TFP) growth for the transport sector. In addition, investment in new roads is assumed to move proportionately with growth in government spending. As a result of these interactions, road network length differs across scenarios.
Degradation or destruction of road infrastructure is different from agricultural yield impacts because the effects on infrastructure endure. Once a road is washed away, the negative effect remains until the road is rebuilt. However, with constant resources allocated to roads, reconstruction of a section of road that is washed away due to heavy rainfall or flooding implies fewer resources available for construction of new roads or regular rehabilitation of existing roads. Hence, climate change influences the rate of accumulation of the road stock, which in turn influences the rate of productivity growth in the transport sector. Because rates of accumulation are influenced, the effects compound over time and can become relatively large. In contrast, for agriculture, climate change influences production in a given year, but not necessarily rates of growth in productive capacity through time. For example, if the temperature rises inherent in climate change intensify the effects of a substantial precipitation shortfall, production will decline, potentially very substantially; however, if, in the subsequent year, growing conditions are favorable, then production will snap back. For these reasons, the incremental impact of climate change is larger for the Roads scenario.
The Hydropower scenario includes changes in electricity generation due to changes in streamflow. As discussed in Section 2, impacts on hydropower production are essentially centered about zero in the 2040s. However, in the 2020s and 2030s, when hydropower represents a larger share of total electricity supply, the impacts tend to be negative. The effect is to slightly reduce growth over the period, resulting in a slight reduction in GDP for the median climate projection during the period 2046–2050. It is interesting to note that maximum GDP across all climate scenarios is reduced in hydropower relative to roads. Recall that dry scenarios are typically favorable to roads, but would not be favorable to hydropower production.
The impacts of SLR are negative across all scenarios and shift the distribution of GDP outcomes downward. We assume that SLR is uncorrelated with particular GCM/SRES pairings (i.e., the same SLR shocks are applied to all climate projections). The two principal drivers of losses from SLR are loss of agricultural land and loss of road infrastructure. As mentioned earlier, one meter SLR is an extreme scenario for climate projections until 2050 (but perhaps a less extreme one for 2100). Following Neumann et al. [8], we assume that climate change is expected to deliver at most 0.38 m of SLR by 2050. However, elevation data for Vietnam was available at one meter steps. It is, therefore, impossible to analyze the exact impacts of SLR to 2050 without additional assumptions. We assume that, with 0.38 m of SLR, 38 percent of the area that would be submerged by one meter of SLR is assumed to be submerged. We also assume that this area constitutes principally agricultural land and road infrastructure. Other forms of coastal capital, including machines and permanent structures, are assumed to be less affected because they can either be relocated or placed on higher ground. Based on these assumptions, the scenario SLR-High is proportionally worse than SLR-Low.
The Cyclone scenario considers the marginal impact of cyclones relative to the baseline. We assume that there is no change in the frequency or intensity of cyclone strikes from what was observed in the historical record. Much of the damage from cyclone strikes is a function of wind velocity; however, this is held constant between the baseline and the climate change scenarios. As a result, the marginal impact of cyclones due to climate change is restricted to the interactions between storm surge and SLR. SLR of 0.38 m causes the storm surge to extend further inland and increases the depth of submersion in affected areas.
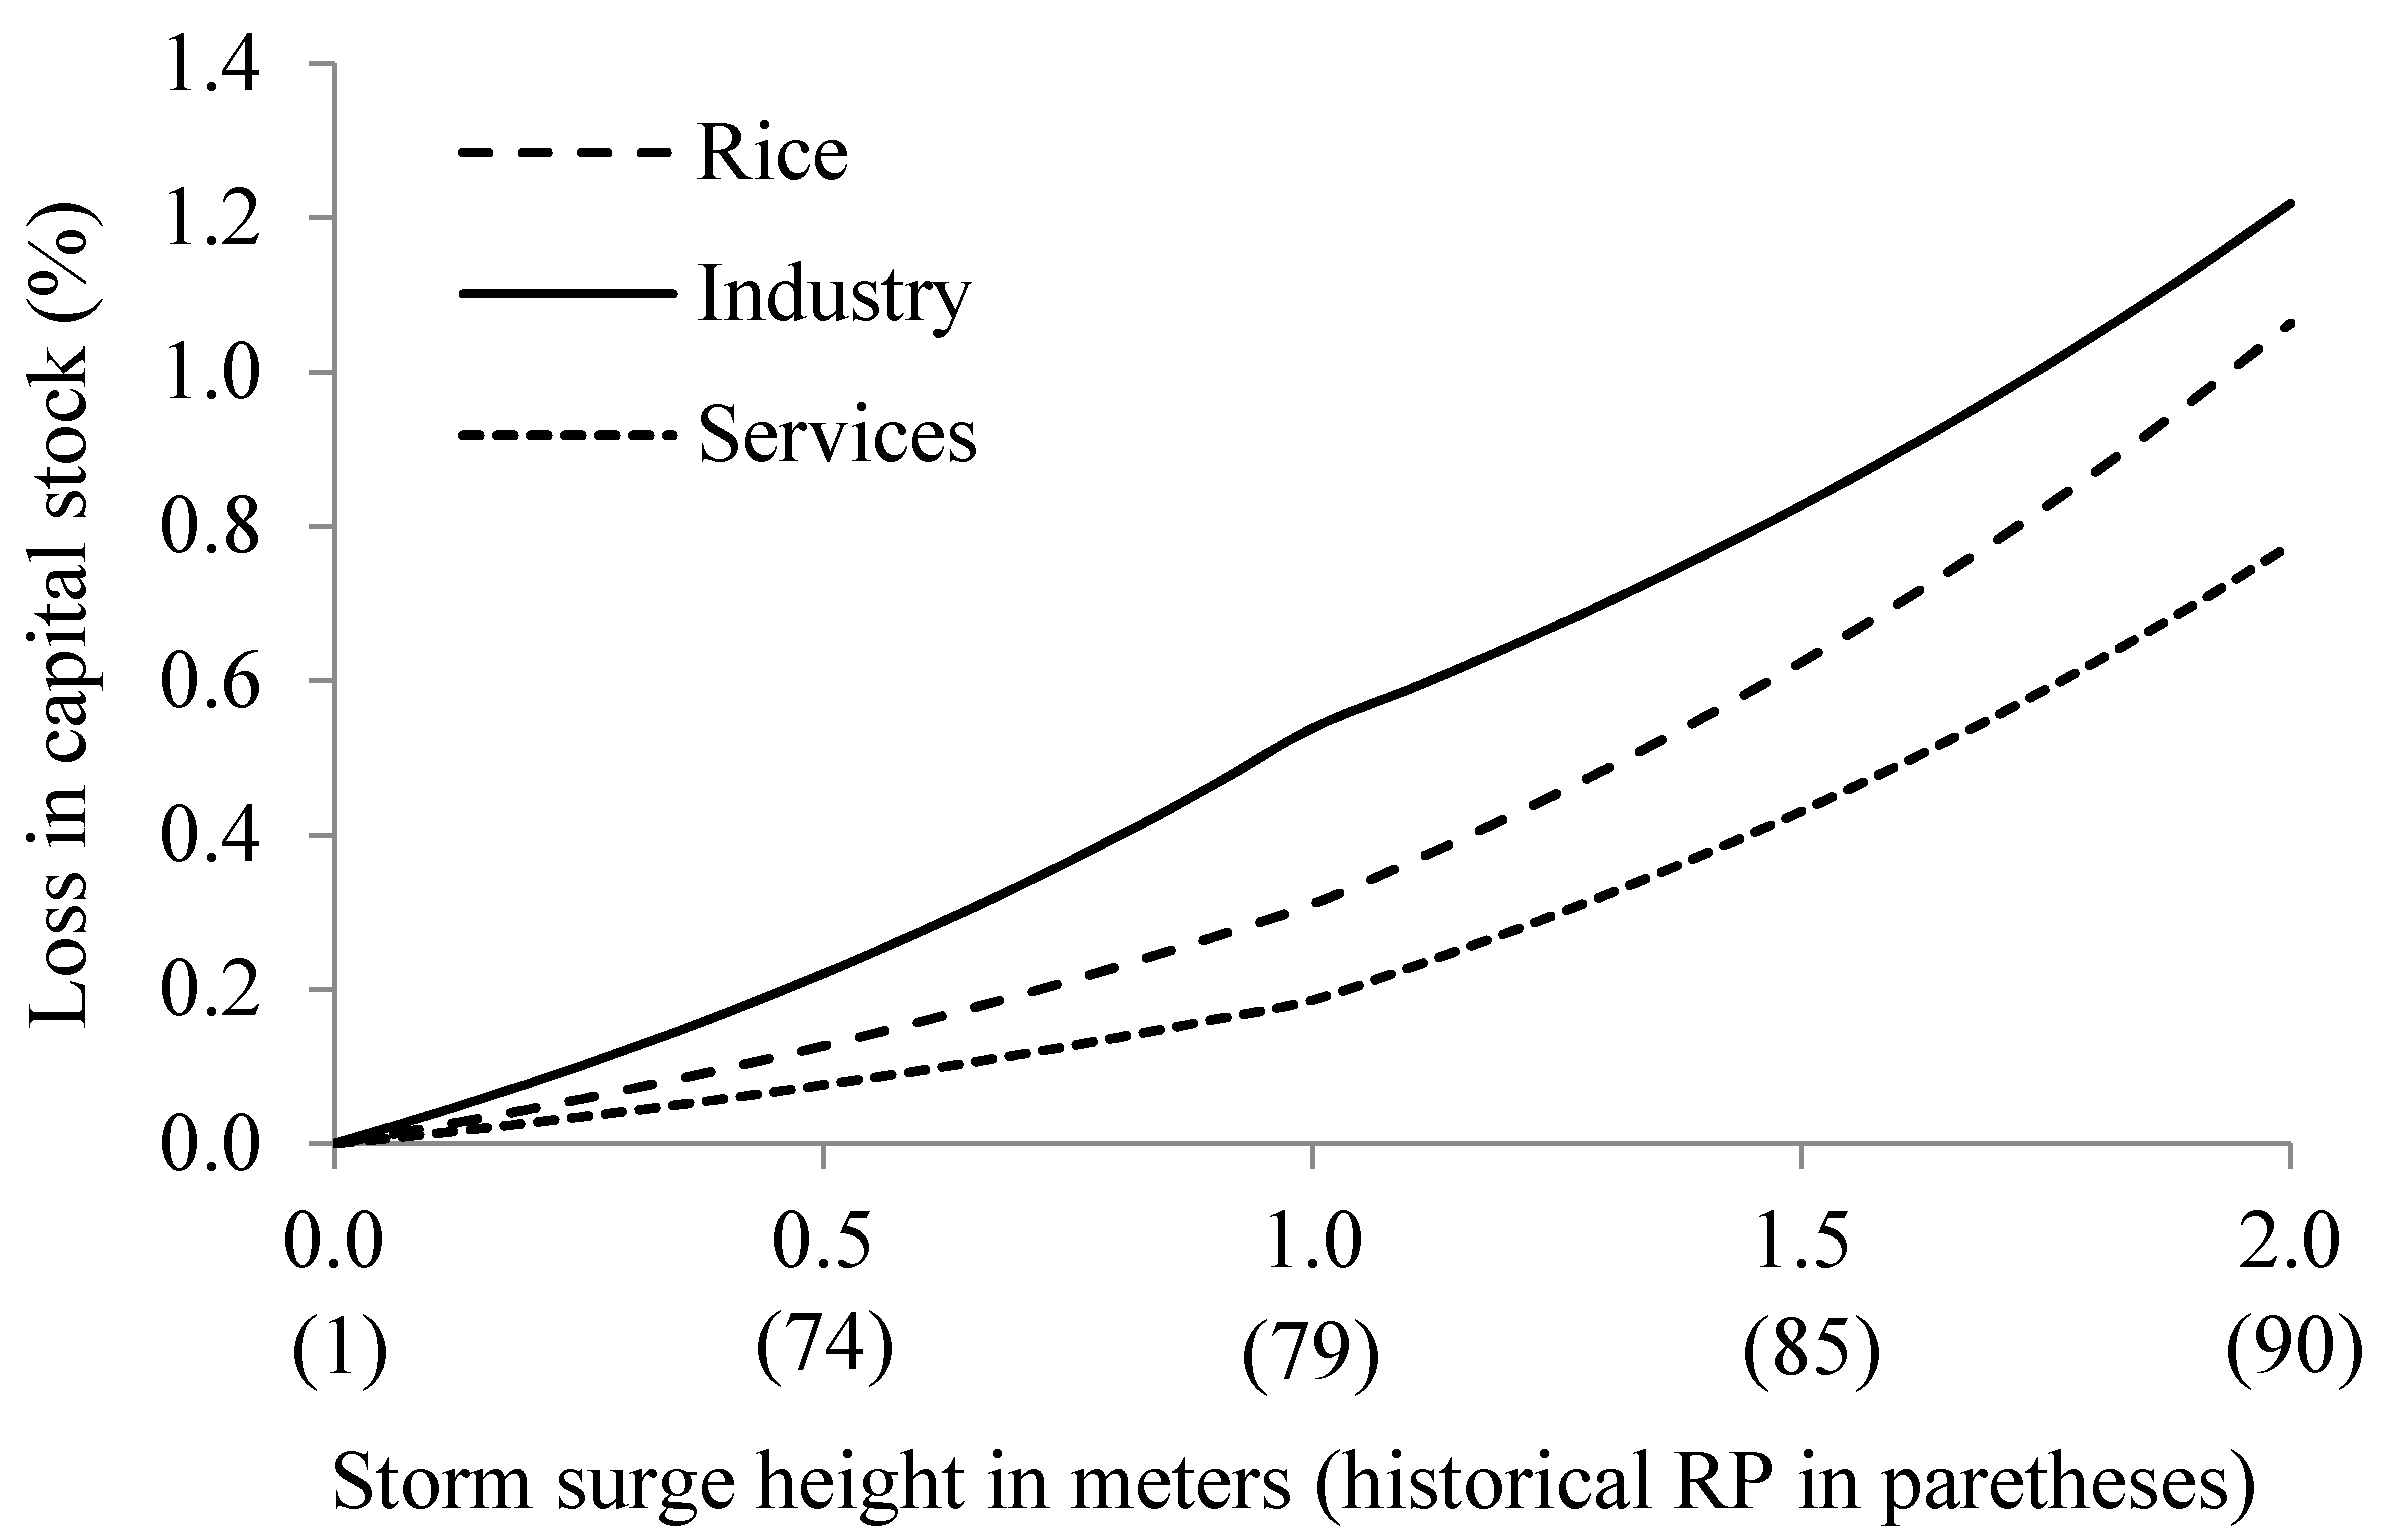
Since larger storms result in more powerful surges and a greater area inundated, we assume that marginal damages increase non-linearly with the power of the storm. This is illustrated in Figure 5, which shows the marginal loss of capital stock in economic sectors associated with cyclone strikes of different historical return periods (RP). The higher a cyclone’s RP, the less frequent but more severe it is. The figure shows how a two meter storm surge is an RP90 event, i.e., a cyclone of this severity or greater is expected only once every 90 years. Moreover, the figure shows how 0.38 m of SLR significantly increases the effective return period of historical storms by 2050. Cyclone events are drawn randomly each year across the 56 GCM/SRES pairings. As a result, we expect to see some strong cyclone activity in at least one GCM/SRES pairing in each year. While mean effects remain small even out to 2050 (about 0.1 percent or 1/1000 of the stock of capital lost), losses from relatively larger cyclone events are much more significant—at 1.2 percent of capital stock lost during a single 1-in-90 year storm surge.
Figure 5. Marginal damages to capital stock due to storm surge and cyclones. Source: Authors’ calculations using results from Neumann et al. [8].
Sustainability 07 04131 g005
The capital damages from cyclones shifts downward the distribution of GDP outcomes. Nevertheless, cyclones’ total effects on economic growth are not large relative to the full projected GDP of Vietnam. The SLR-Low scenario represents the least strong distribution of impacts, considering all impact channels as well as low SLR. As shown in Figure 4, average GDP during 2046–2050 is reduced by between 0.3 and 3.0 percentage points, with the majority of outcomes between 1.0 and 2.0 percent. With high SLR and cyclones (i.e., Cyclone scenario), the level of GDP in the period 2046–2050 is between 1.0 and 3.5 percent lower. These results are broadly consistent with World Bank [15].
Since growth is a cumulative process, the reported reductions in GDP levels translate into small reductions in average annual GDP growth rates over the simulation period. In the Cyclone scenario, the average annual GDP growth rate is reduced by between 0.02 percentage points and 0.10 percentage points. In other words, if the expected average baseline growth rate without climate change is 5.4 percent per annum, then the growth rate would be expected to be between 5.30 and 5.38 percentage points. In sum, climate change represents an additional challenge for future economic development in Vietnam. However, the challenge is not insurmountable in the time frame considered. Other factors will be more influential in determining economic growth rates out to about 2050.
Vietnam’s GDP is expected to exceed US$500 billion by 2050, which means that the losses caused by climate change are large in absolute terms. Figure 6 illustrates the net present value of losses over the period 2007–50, measured in terms of the difference in GDP at factor cost between the climate change scenarios and the baseline. The net present value is obtained using a 5 percent discount rate. Taking the range between the most favorable outcome of the SLR-Low scenario and the least favorable outcome of the Cyclone scenario, the net present value of losses ranges from about zero to around US$40 billion (measured in real 2007 prices). The majority of GDP losses are grouped within the range of US$6–15 billion. These losses provide clear incentives for adaptation policies designed to reduce climate change damages. Moreover, our findings suggest that there is a window of opportunity for Vietnam to benefit from preemptive action.
Figure 6. Net present value of total GDP losses during 2040s (shown as negative values) due to climate change. Note: CGE model results. Five per cent discount rate is applied. Scenarios are cumulative from left to right. Dots show outliers.
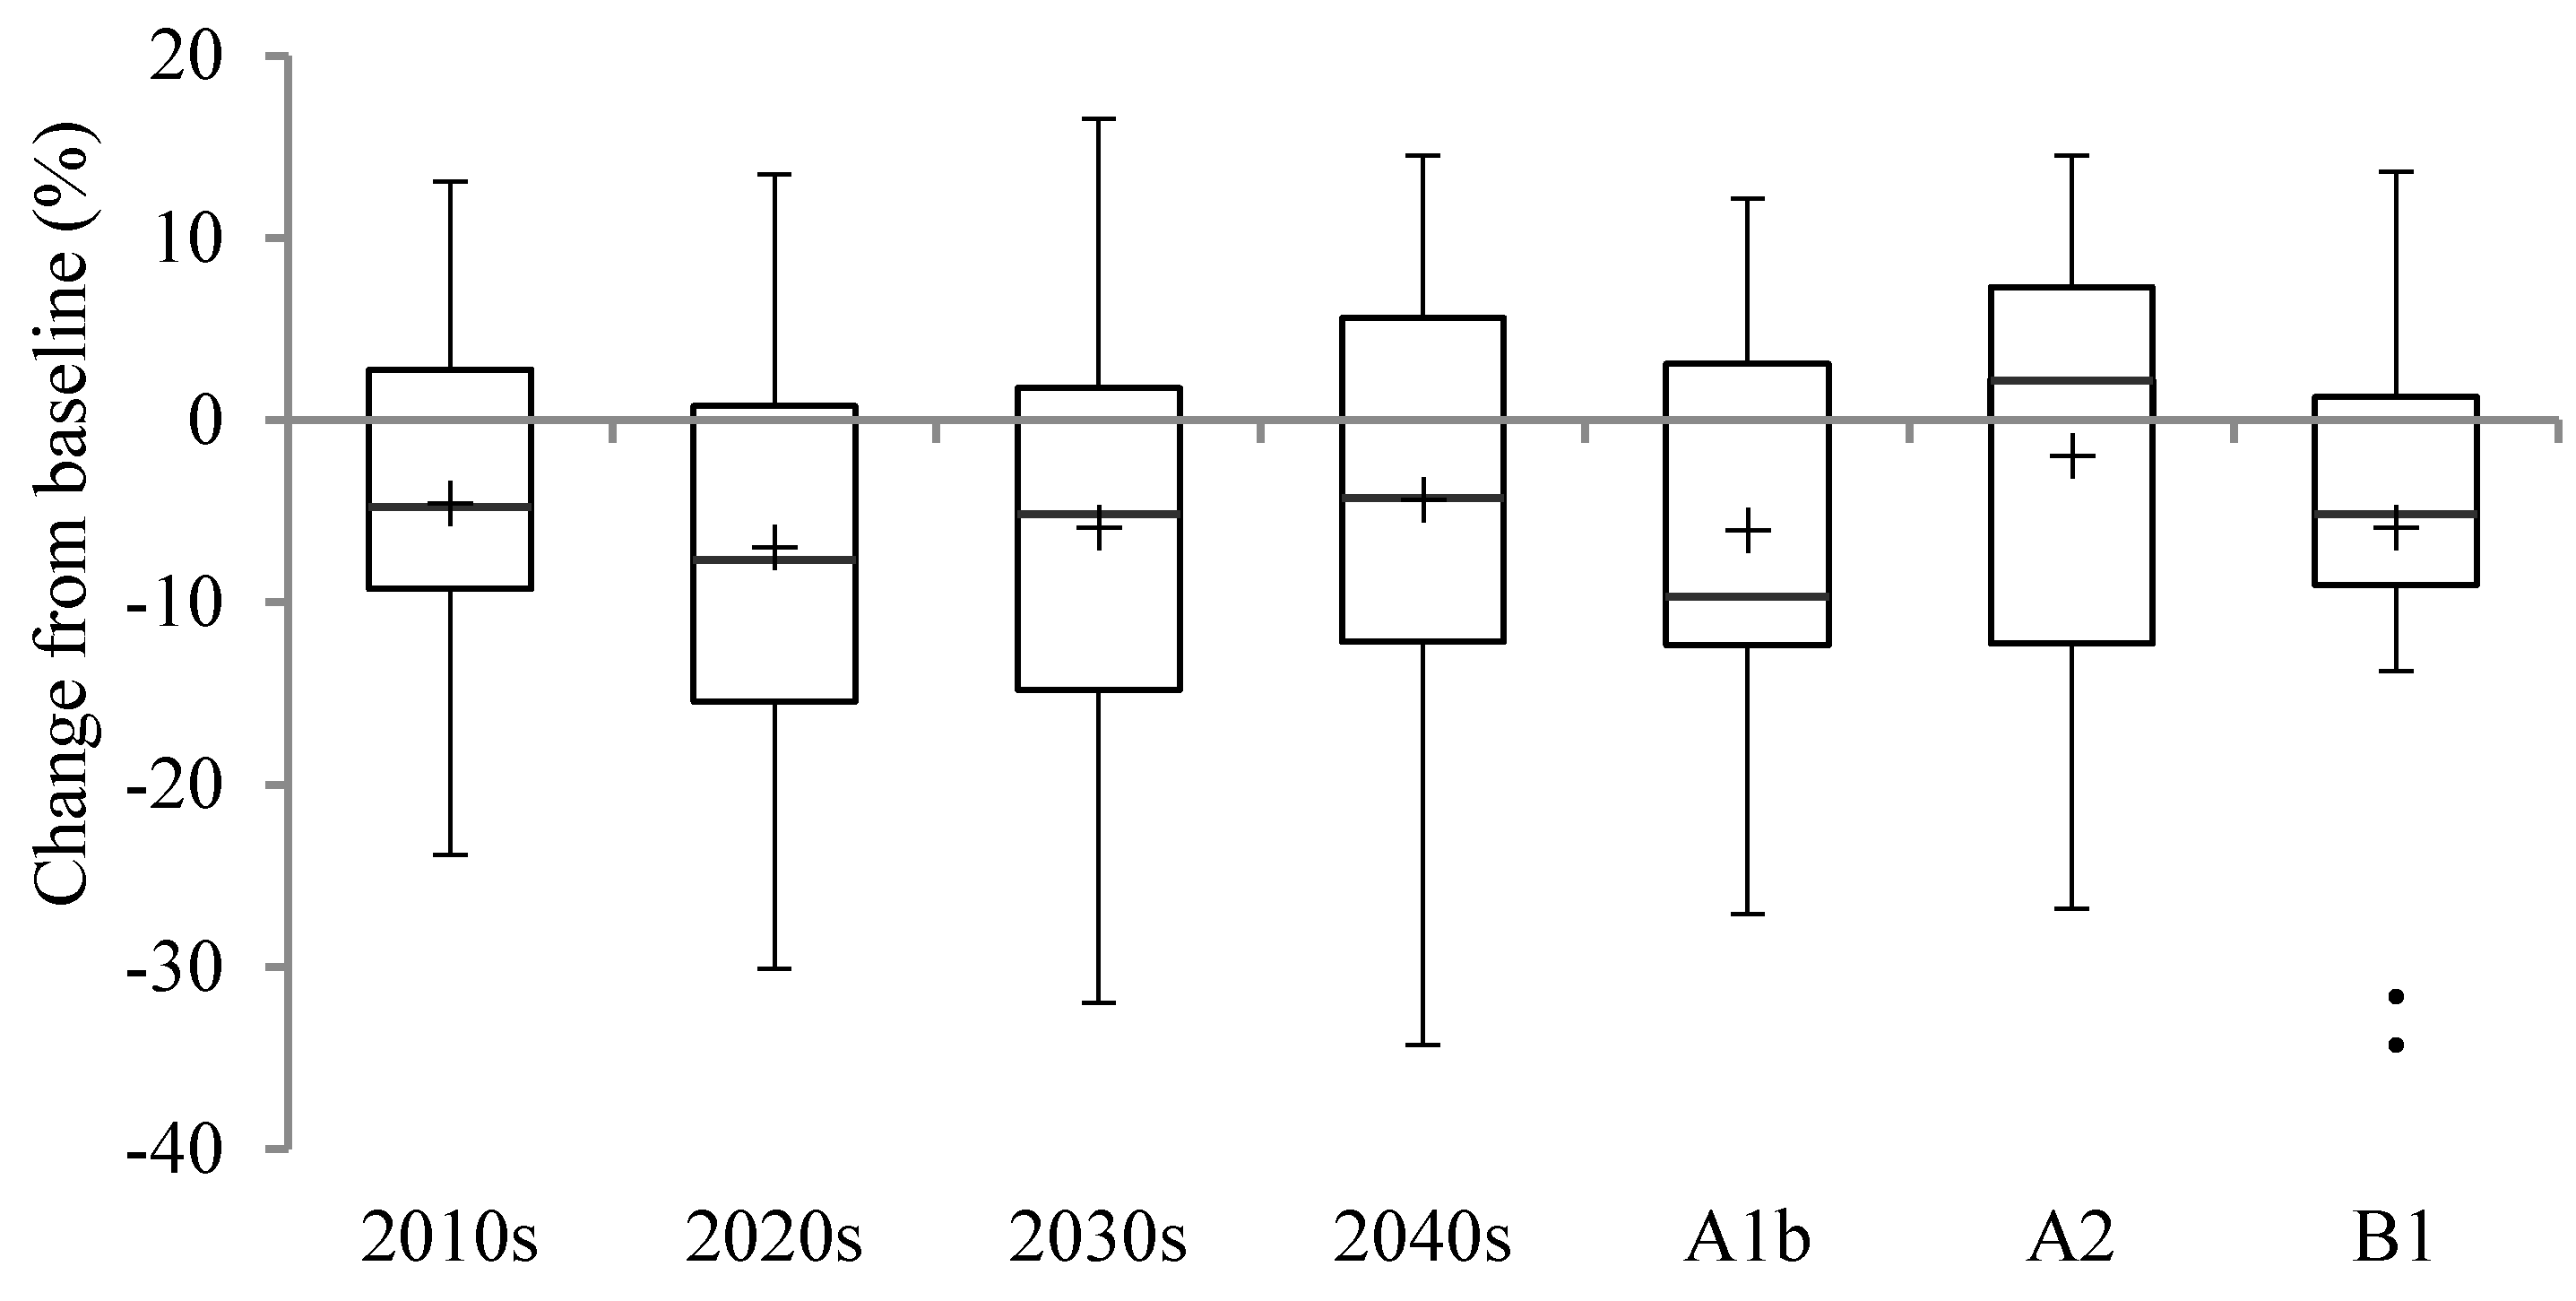
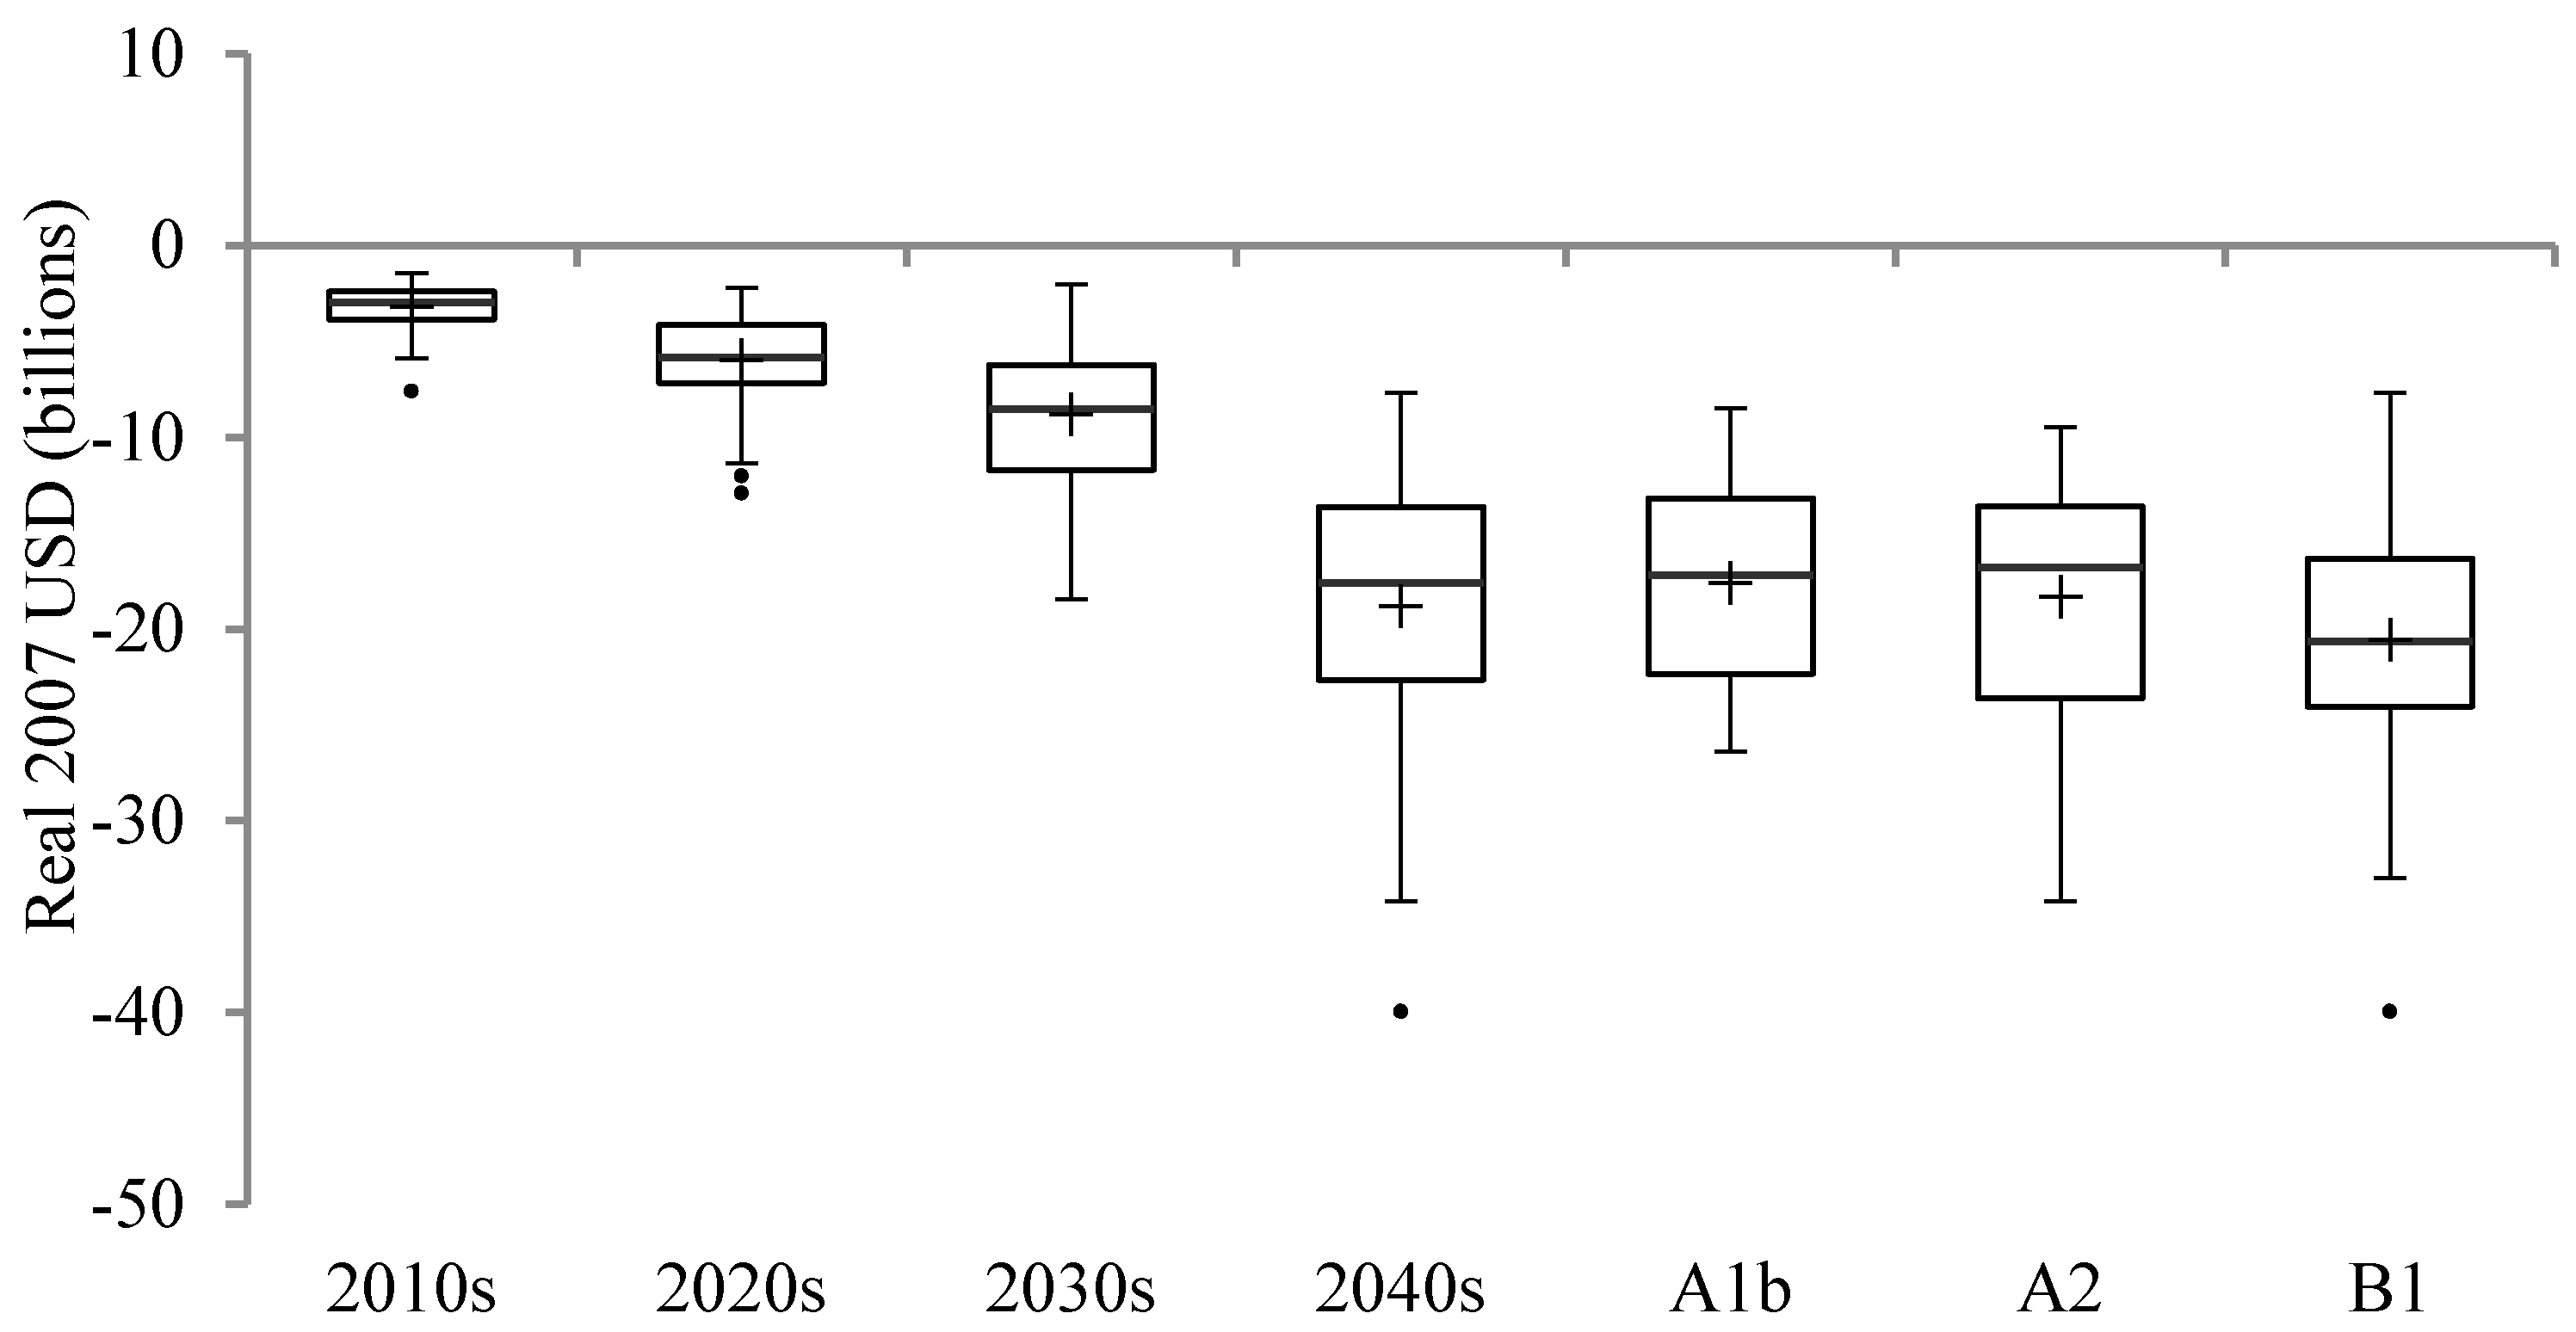
Sustainability 07 04131 g006
Finally, Figure 7 reports the net present value of GDP losses for the Cyclone scenario by decade and global emissions scenario. Even though these values are discounted to 2007 (i.e., the base year for our analysis), the later decades are found to contribute much more to the net present value of total losses than earlier decades. Moreover, climate change impacts are expected to be more severe after 2050 and so our results emphasize the need to prepare early for gradually more severe climate impacts.
Figure 7. Net present value of total GDP losses in the Cyclone Scenario (shown as negative values). Note: CGE model results. Five per cent discount rate is applied. The decadal box and whisker plots employ results from all 56 GCMs employed for the associated decade. The plots labelled A1b, A2 and B1 show results across all decades for GCMs associated with these emission scenarios. Dots show outliers.
Sustainability 07 04131 g007

5. Conclusions

Climate change is a multi-sectoral and uncertain phenomenon. This makes it difficult to evaluate economic impacts and design robust and appropriately prioritized adaptation strategies. In this article, we applied an economy-wide model that enabled us to estimate (and decompose) the effects of climate change via a range of sector level transmission channels, including agriculture, energy, infrastructure, sea levels and storm surges. We used this integrated modeling framework to examine the full distribution of climate projections. Our analysis advances previous studies for Vietnam by better capturing uncertainty and multi-sectoral impacts. Further research is needed to capture other important sector impacts, particularly health [21].
Anthropogenic climate change is expected to increase Vietnam’s surface temperature by 2050. Effects on precipitation are much more uncertain but are centered on relatively mild impacts with a slight tendency for drying. This combination of slightly lower rainfall and higher evapotranspiration leads to a mild “drying out” of Vietnam’s currently humid climate. These changes are not sufficient to generate large declines in total agricultural production, nor are they projected to generate (in most instances) large increases in the frequency and severity of events, such as flooding, that would threaten infrastructure. In addition, while hydropower generation tends to be negatively affected, this outcome is not large enough to be a major hindrance to economic development during 2007–2050. That being said, some climate change projections lead to substantial damages for Vietnam. This emphasizes the importance of analyzing the full range of climate projections. It also highlights the need to carefully balance precautionary adaptation investments against their opportunity costs, i.e., forgone investments in economic development.
Rising sea levels generate some of the largest economic effects in our analysis, especially when SLR is high and is combined with cyclone strikes and storm surges. Together these forces lead to significant damages to agricultural land, roads and other infrastructure. For this reason, climate change is expected to worsen Vietnam’s economic growth prospects out to 2050. Despite this, climate change’s macroeconomic impact out to about 2050 is not overwhelming. Non-climate factors are likely to be more important determinants of growth rates over at least the next few decades.
Nevertheless, the net present value of losses indicates that climate change’s macroeconomic effects are appreciable and adaptation policies are merited. Our analysis suggests that an adaptation agenda for Vietnam should include (i) investment in information systems to monitor climate change impacts, including improved information on river flow and land elevation in low-lying regions; (ii) development of heat resistant crop varieties; (iii) improved water use efficiency; and (iv) changes in design standards for infrastructure, such as roads, to endure a warmer and more variable climate.
Especially when one looks beyond 2050, serious choices revolve around the implications of SLR combined with cyclone strike. There are essentially two pro-active options: (i) the government channels economic activity towards higher ground in an evolutionary fashion; and (ii) the government invests in protective infrastructure. These are not mutually exclusive options and decisions in response to climate change do not need to be made immediately. Nevertheless, while more study is required, we expect that a gradual channeling of activity to higher ground may prove to be more economically efficient. It is certainly less risky than inaction. A major detractor to protective coastal infrastructure investments is that they reduce risks but increase exposure. Both the costs of protective coastal infrastructure and the capital that will inevitably be placed in the shadow of that protection are vulnerable to cyclone strike of sufficient magnitude. Hence, with a protective strategy, there is always the possibility that one will lose a great deal more than just the certain costs of building the protective infrastructure. The gradual channeling of economic activity to safer, higher elevation zones, on the other hand, recognizes that the vast majority of the capital stock of 2050 has yet to be created and installed. The location and vulnerability of that stock is, as a consequence, essentially a matter of choice. This strategy may also mute negative health effects from higher temperatures though this remains to be investigated in detail. Nevertheless, for the gradual evolution strategy to be efficient, the channeling of economic activity to higher ground should begin relatively soon, especially if, as time proceeds, the upper ends of SLR projections appear to coincide with observed SLR.
Finally, while our study offers a more comprehensive climate change impact assessment than existing studies, there are at least two areas where the analysis could be strengthened. First, we have drawn directly from historical climate data, and so our future baseline replicated the sequence of past weather events. However, a stochastic baseline scenario would be less dependent on the historical sequence of (extreme) weather events, but would require greater interaction between biophysical and economic models (see Thurlow et al. [17]). Second, the results from the CGE model incorporate some autonomous adaptation based on the behavior of representative agents (i.e., producers and consumers). However, these agents do not anticipate climate changes and so do not adjust their behavior based on forward-looking expectations. The extent to which such complex behavior is applicable in the context of climate changes in developing countries is an important area for future work.

Author Contributions

All authors contributed equally.

Conflicts of Interest

The authors declare no conflict of interest.

References

  1. Mendelsohn, R.; Dinar, A.; Williams, L. The Distributional Impact of Climate Change on Rich and Poor Countries. Environ. Dev. Econ. 2006, 11, 159–178. [Google Scholar] [CrossRef]
  2. Adger, W.N. Social Vulnerability to Climate Change and Extremes in Coastal Vietnam. World Dev. 1999, 27, 249–269. [Google Scholar] [CrossRef]
  3. Booth, T.H.; Nghia, N.H.; Kirschbaum, M.U.; Hackett, C.; Jovanovic, T. Assessing Possible Impacts of Climate Change in Species Important for Forestry in Vietnam. Clim. Chang. 1999, 41, 109–126. [Google Scholar] [CrossRef]
  4. Gebretsadik, Y.; Fant, C.; Strzepek, K. Impact of Climate Change on Irrigation, Crops and Hydropower in Vietnam; Working Paper 2012/79; UNU-WIDER: Helsinki, Finland, 2012. [Google Scholar]
  5. Yu, B.; Zhu, T.; Breisinger, C.; Hai, N.M. Impacts of Climate Change on Agriculture and Policy Options for Adaptation: The Case of Vietnam; Discussion Paper 01015; IFPRI: Washington, DC, USA, 2010. [Google Scholar]
  6. Chinowsky, P.S.; Schweikert, A.E.; Strzepek, N.L.; Strzepek, K. Road Infrastructure and Climate Change in Vietnam; Working Paper 2012/80; UNU-WIDER: Helsinki, Finland, 2012. [Google Scholar]
  7. Jacobs, J.W. Adjusting to Climate Change in lower Mekong. Glob. Environ. Chang. 1996, 6, 7–22. [Google Scholar] [CrossRef]
  8. Neumann, J.E.; Emanuel, K.A.; Ravela, S.; Ludwig, L.C.; Verly, C. Risks of Coastal Storm Surge and the Effect of Sea Level Rise in the Red River Delta, Vietnam; Working Paper 2012/81; UNU-WIDER: Helsinki, Finland, 2012. [Google Scholar]
  9. Warner, K. Global Environmental Change and Migration: Governance Challenges. Glob. Environ. Chang. 2010, 20, 402–413. [Google Scholar] [CrossRef]
  10. Adger, W.N.; Arnell, N.W.; Tompkins, E.L. Successful Adaptation to Climate Change across Scales. Glob. Environ. Chang. 2005, 15, 77–86. [Google Scholar] [CrossRef]
  11. Arnell, N.W.; Livermore, M.J.L.; Kovats, S.; Levy, P.E.; Nicholls, R.; Parry, M.L.; Gaffin, S.R. Climate and Socio-Economic Scenarios for Global-Scale Climate Change Impacts Assessments: Characterising the SRES Storylines. Glob. Environ. Chang. 2010, 20, 577–585. [Google Scholar] [CrossRef]
  12. Willmott, C.J.; Feddema, J.J. A More Rational Climatic Moisture Index. Prof. Geogr. 1992, 44, 84–88. [Google Scholar] [CrossRef]
  13. Chinowsky, P.; Arndt, C. Climate Change and Roads: A Dynamic Stressor—Response Model. Rev. Dev. Econo. 2012, 16, 448–462. [Google Scholar] [CrossRef]
  14. Dervis, K.; de Melo, J.; Robinson, S. General Equilibrium Models for Developing Countries; Cambridge University Press: Cambridge, UK, 1982. [Google Scholar]
  15. World Bank. Economics of Adaptation to Climate Change: Vietnam; World Bank: Washington, DC, USA, 2010. [Google Scholar]
  16. Arndt, C.; Strzepek, K.; Tarp, F.; Thurlow, J.; Fant, C.; Wright, L. Adapting to Climate Change: An Integrated Biophysical and Economic Assessment for Mozambique. Sustain. Sci. 2011, 6, 7–20. [Google Scholar] [CrossRef]
  17. Thurlow, J.; Dorosh, P.; Yu, W. A Stochastic Simulation Approach to Estimating the Economic Impacts of Climate Change in Bangladesh. Rev. Dev. Econ. 2012, 16, 412–428. [Google Scholar] [CrossRef]
  18. Arndt, C.; Thurlow, J. Climate uncertainty and economic development: Evaluating the case of Mozambique to 2050. Clim. Chang. 2015, in press. [Google Scholar]
  19. Diao, X.; Thurlow, J. A Recursive Dynamic Computable General Equilibrium Model. In Strategies and Priorities for African Agriculture: Economy-wide Perspectives from Country Studies; Diao, X., Thurlow, J., Benin, S., Fan, S., Eds.; International Food Policy Research Institute: Washington, DC, USA, 2012. [Google Scholar]
  20. Arndt, C.; Garcia, A.; Pham, H.H.; McCoy, S.; Tarp, F.; Thurlow, J. A 2007 Social Accounting Matrix (SAM) for Vietnam. Available online: http://www.ciem.org.vn/Portals/1/CIEM/SurveyData/2007/Revised_Vietnam_2007_SAM.pdf (accessed on 2 April 2015).
  21. Few, R.; Tran, P.G. Climatic Hazards, Health Risk and Response in Vietnam: Case Studies on Social Dimensions of Vulnerability. Glob. Environ. Chang. 2010, 20, 529–538. [Google Scholar] [CrossRef]

