Communication

Structural Evolution of Household Energy Consumption: A China Study

1
School of Energy and Power Engineering, Shandong University, 17923 Jingshi Road, Jinan 250061, China
2
School of Management, Shandong University, 27 Shanda Road, Jinan 250100, China
3
School of Municipal and Environmental Engineering, Shandong Jianzhu University, Jinan 250101, China
4
School of Natural and Built Environments, University of South Australia, Adelaide 5000, Australia
*
Author to whom correspondence should be addressed.
These authors contributed equally to this work.
Sustainability 2015, 7(4), 3919-3932; https://doi.org/10.3390/su7043919
Submission received: 28 January 2015 / Revised: 27 March 2015 / Accepted: 30 March 2015 / Published: 2 April 2015
(This article belongs to the Section Energy Sustainability)

Abstract

:
Sustainable energy production and consumption is one of the issues for the sustainable development strategy in China. As China’s economic development paradigm shifts, household energy consumption (HEC) has become a focus of achieving national goals of energy efficiency and greenhouse gas reduction. The information entropy model and LMDI model were employed in this study in order to analyse the structural evolution of HEC, as well as its associated critical factors. The results indicate that the information entropy of HEC increased gradually, and coal will be reduced by clean energies, such as natural gas and liquefied petroleum gas. The information entropy tends to stabilize and converge due to rapid urbanization. Therefore, from the perspective of environmental protection and natural resource conservation, the structure of household energy consumption will be optimized. This study revealed that residents’ income level is one of the most critical factors for the increase of energy consumption, while the energy intensity is the only driving force for the reduction of HEC. The accumulated contribution of these two factors to the HEC is 240.53% and −161.75%, respectively. It is imperative to improve the energy efficiency in the residential sector. Recommendations are provided to improve the energy efficiency-related technologies, as well as the standards for the sustainable energy strategy.

1. Introduction

With the rapid economy development, household energy consumption (HEC) has been continuously rising in China. The total amount of HEC more than doubled between 1990 and 2012, from 157.99 million to 396.66 million tce (tonnes of coal equivalent). Meanwhile, the annual energy consumption per capita increased from 139.2 kgce (kilograms of coal equivalent) to 293.8 kgce with an annual growth rate of more than 3.45% during the same period [1]. For the total energy consumption, the annual growth rate was as high as 4.28%. Moreover, the industrial energy consumption increased from 675.78 million tce in 1990 to 2524.63 million tce in 2012. This was higher than that of the total energy consumption. The acceleration of industrialization in China leads to the increase of energy consumption and rapid urbanization. The urbanization rate reached 52.57%, with a growing number of residents moving from rural areas to urban areas in 2012. The average annual energy consumption of urban residents was 1.4-times that of rural residents in 2012 due to different lifestyles in China [2]. HEC in urban areas also surged since the 2000s. HEC accounted for 10% of the total energy consumption in China [3]. This would likely increase along with the increase of the average income level, standard of living and associated access to home appliances, housing, etc. For example, the number of air-conditioners per 100 urban households increased from 0.34 in 1990 to 70.4 in 2012 [1]. To satisfy the growing demand of urban residents, a number of energy-intensive sectors have gained rapid growth in the last decade. These sectors include building materials, iron and steel and flat glass. It is undoubted that HEC contributes to the growth of the total energy consumption, either directly or indirectly. However, China’s energy policies do not pay adequate attention to the efficiency of the residential sector compared with the efforts in the industrial sector. For example, “The 12th Five-year Guideline for Economic and Social Development” specified that energy consumption per unit of GDP should decline 16% in the future compared with the level of 2010, with little discussion on the household energy efficiency [4]. On the other hand, HEC could directly affect the total energy consumption and energy structure. The experience of developed countries demonstrates that with the continuous increase of HEC, the current situation of energy efficiency remains severe, even if the structural adjustment of industry is completed [5]. It is of strategic importance and practical significance to study the energy policies of the residential sector.
HEC has drawn a growing level of attention from academics. It is well recognized that the residential energy consumption depends on a number of factors, such as family size, average income, appliance ownership, lifestyle, physical characteristics of houses and the human behaviour of energy consumption [6]. For example, York [7] analysed the influence of population and economic factors on HEC in the EU. Fang et al. [8] examined the impact of various research variables on HEC, such as population increase, production facility, life-style and living standard. Schultz [9] and Hansla et al. [10] analysed the psychological basis of energy consumption behaviour and investigated its influence on consumption behaviour. Reinhard et al. [11] and Egmond et al. [12] focused on the impact of technical efficiency, average income and revenue on the HEC. Therefore, the main factors influencing HEC include income level, energy structure, demographic characteristics and energy efficiency.
Some models and methods have been employed to analyse the most critical factors that affect HEC. Structural decomposition analysis (SDA) is one of the most widely employed approaches to identify the magnitude of predetermined driving factors for changes in observed energy indicators [13]. Ang concluded that the Logarithmic Mean Divisia Index (LMDI) method was the preferred method, due to its theoretical foundation, adaptability, ease of use and result interpretation, along with some other desirable properties in the context of decomposition analysis [14]. At present, the vast majority of empirical studies have utilized the LMDI method to quantitatively identify the relative impact of different factors on the changes in energy consumption [15]. Some other models were also employed to analyse the energy and environmental issues. For instance, Stern et al. [16] proposed the value-belief-norm theory and explained the formation of environmental behaviour through the role of environmental values, beliefs and subjective norms. Huang and Jin [17] developed the Smooth transition regression (STR) model and studied the impact of urbanization on HEC based on empirical data. Lenzen et al. [18] employed a comparative multivariate analysis model to analyse the requirements of household energy in Australia, Brazil, Denmark, India and Japan. Geng et al. [19] used the information entropy theory to analyse the structural evolution of HEC and concluded that the real disposable income was closely associated with the energy consumption per capita. This method provided an innovative approach to describe the complexity and chaos of the energy consumption system, which consists of a number of factors.
In addition, HEC can be divided into direct and indirect energy consumption. The former means the direct purchase and consumption of energy commodities for residents, such as cooking, lighting and heating fuel and electricity consumption [20].The latter refers to the energy consumed by non-energy goods and services for residents. Biesiot and Noorman [21] revealed that the indirect consumption of household energy was much higher than the direct consumption. Ala-Mantila et al. [22] concluded that indirect emissions dominate the direct emission at all income and urbanity levels. Furthermore, daily decisions of locating, moving and consuming also make a difference, which indicates that green growth cannot be achieved without profound changes in private consumption. Household direct energy consumption can be retrieved from the related statistical yearbook. On the contrary, household indirect energy consumption needs to be calculated with models, such as input-output analysis. Considering the availability of data required and the scope of this research, HEC in this research refers to direct energy consumption.
In summary, previous studies predominately focused on the structure, model development and critical factors of the HEC. There is lack of systematic investigation, which takes both the evolution of the structure and critical factors of HEC into consideration. Based on the analysing principles of HEC evolution with information entropy, the contribution of each individual driving factor to energy efficiency was examined. These findings provide useful inputs for the development of future policy instruments aiming for higher household energy efficiency.

2. Methods

2.1. Information Entropy Model

Originating from the thermodynamic theory, the concept of entropy has been widely applied in a variety of disciplines and sectors since the middle of the last century [23,24]. This includes information entropy [25], management entropy [26], economy entropy [27,28,29] and environmental entropy [30,31], which leads to the development of the nonlinear science theory.
Information entropy theory was introduced by Shannon in 1948, which is a measure of the average information value of a stochastic system [28]. In a system, a higher orderly degree means greater information value contained and less information entropy. The energy consumption system is an open and nonlinear system. It involves a frequent exchange of energy, material and information with other systems. The structure of energy consumption evolved spontaneously and irreversibly due to the continuous impacts of both the external disturbance and internal fluctuation. These characteristics of energy consumption system are in conformity with established assumptions of a dissipative structure system. Therefore, information entropy can be used to analyse the structural evolution of HEC. In this model, greater information entropy means a more complex system of the HEC structure. It has also been employed successfully to evaluate the structural revolution of land use in cities due to consistent dimensions of land area in different studies [25,32]. However, the contents of energy consumption vary significantly in the existence forms, types and units of different energy sources. In order to make it applicable for analysing energy consumption, it is imperative to unify the units of energy for the utilization of the information entropy model. The method is as follows:
It is assumed that m kinds of energy were consumed, and the amount of each kind of energy can be converted to H1, H2Hm kgce. The proportion of energy i to the total energy consumption is P i = H i H , H = H i , P i = 1 . According to information theory, information entropy can be defined as Equation (1) if the dimension of energy is unified.
S = i = 1 m P i ln P i
As shown in Equation (1), the information entropy is minimum ( S min = 0 ) when there is only one kind of energy in the system. On the other hand, the information entropy is maximum if H 1 = H 2 = = H m , namely, S max = ln m . Therefore, the value of information entropy is between 0 and ln m , reflecting the complexity of the structure of HEC.
E = i = 1 m P i ln P i / ln m
D = 1 E
In Equation (2), E is named the equilibrium degree, which is defined as the ratio of information entropy to maximum entropy. The data range is E [ 0 , 1 ] . The higher the E value, the smaller the difference in the proportion of each kind of energy is to the total energy consumption. Meanwhile, D in Equation (3) is defined as the dominance degree of the system, which reflects the level of energy consumption dominated by one or several kinds of energy. This is contrary to E defined in Equation (2). S represents the complexity of the energy consumption structure, while D and E describe the quality difference and structural pattern among various energies.

2.2. LMDI Model

The index decomposition method has been widely used to identify influential factors. It was introduced to the energy discipline in the late 1970s [33]. At present, LMDI was usually employed in the research of energy consumption and carbon emissions, which involves the industrial sector, energy type, population, economy and other factors [34]. It is well recognized that the direct consumption of household energy is associated with a number of factors, such as economic condition, energy structure, population characteristics and energy efficiency [3]. Therefore, the LMDI model was employed in this study to conduct a quantitative analysis on the relationship between HEC and the aforementioned factors (see Equation (4)).
E = i E i = i P Y P E Y E i E = i P R I S
where P, Y and E represent population, resident income and energy consumption, respectively; Ei is thei kind of energy; R is income per capita, representing the economic level of residents; I is the intensity of HEC, representing energy efficiency; S is the energy structure.
The logarithm and time t derivation was taken for Equation (4), and Equation (5) was obtained.
d ln E d t = i w i ( t ) × ( d ln P d t + d ln R d t + d ln I d t + d ln S d t )
The integral was taken for Equation (5), and Equation (6) was obtained.
0 t d ln E d t d t = i 0 t w i ( t ) × ( d ln P d t + d ln R d t + d ln I d t + d ln S d t ) d t
According to the definite integral value theorem, Equation (7) can be derived by Equation (6).
E t E 0 = exp ( i w i ( t * ) ln P t P 0 ) × exp ( i w i ( t * ) ln R t R 0 ) × exp ( i w i ( t * ) ln I t I 0 ) × exp ( i w i ( t * ) ln S t S 0 )
The logarithmic mean function as the weight proposed by Ang can be expressed as Equation (8) [14].
w i ( t * ) = ( E i t E i 0 ) / ( ln E i t ln E i 0 ) ( E t E 0 ) / ( ln E t ln E 0 )
Equation (8) is substituted into the Equation (7), obtaining Equation (9).
E t E 0 = exp [ ln ( E t E 0 ) ]
Based on additional decomposition, Equation (10) was obtained. Equation (9) was substituted into Equation (10). As a result, Equation (11) to Equation (14) were obtained.
Δ E tot = E t E 0 = Δ E pop + Δ E act + Δ E int + Δ E str
Δ E pop = i E i t E i 0 L n E i t L n E i 0 L n ( P t P 0 )
Δ E act = i E i t E i 0 L n E i t L n E i 0 L n ( R t R 0 )
Δ E int = i E i t E i 0 L n E i t L n E i 0 L n ( I t I 0 )
Δ E str = i E i t E i 0 L n E i t L n E i 0 L n ( S i t S i 0 )
where ∆Etot represents the contribution of all factors to the direct consumption of household energy. ∆Epop, ∆Eact, ∆Eint and ∆Estr are defined as demographic effects, the effects of residents’ income level, the effects of energy consumption intensity and the effects of the structure of HEC, respectively. This method is employed for the analysis of the critical factors of the HEC structure.

3. Results and Discussion

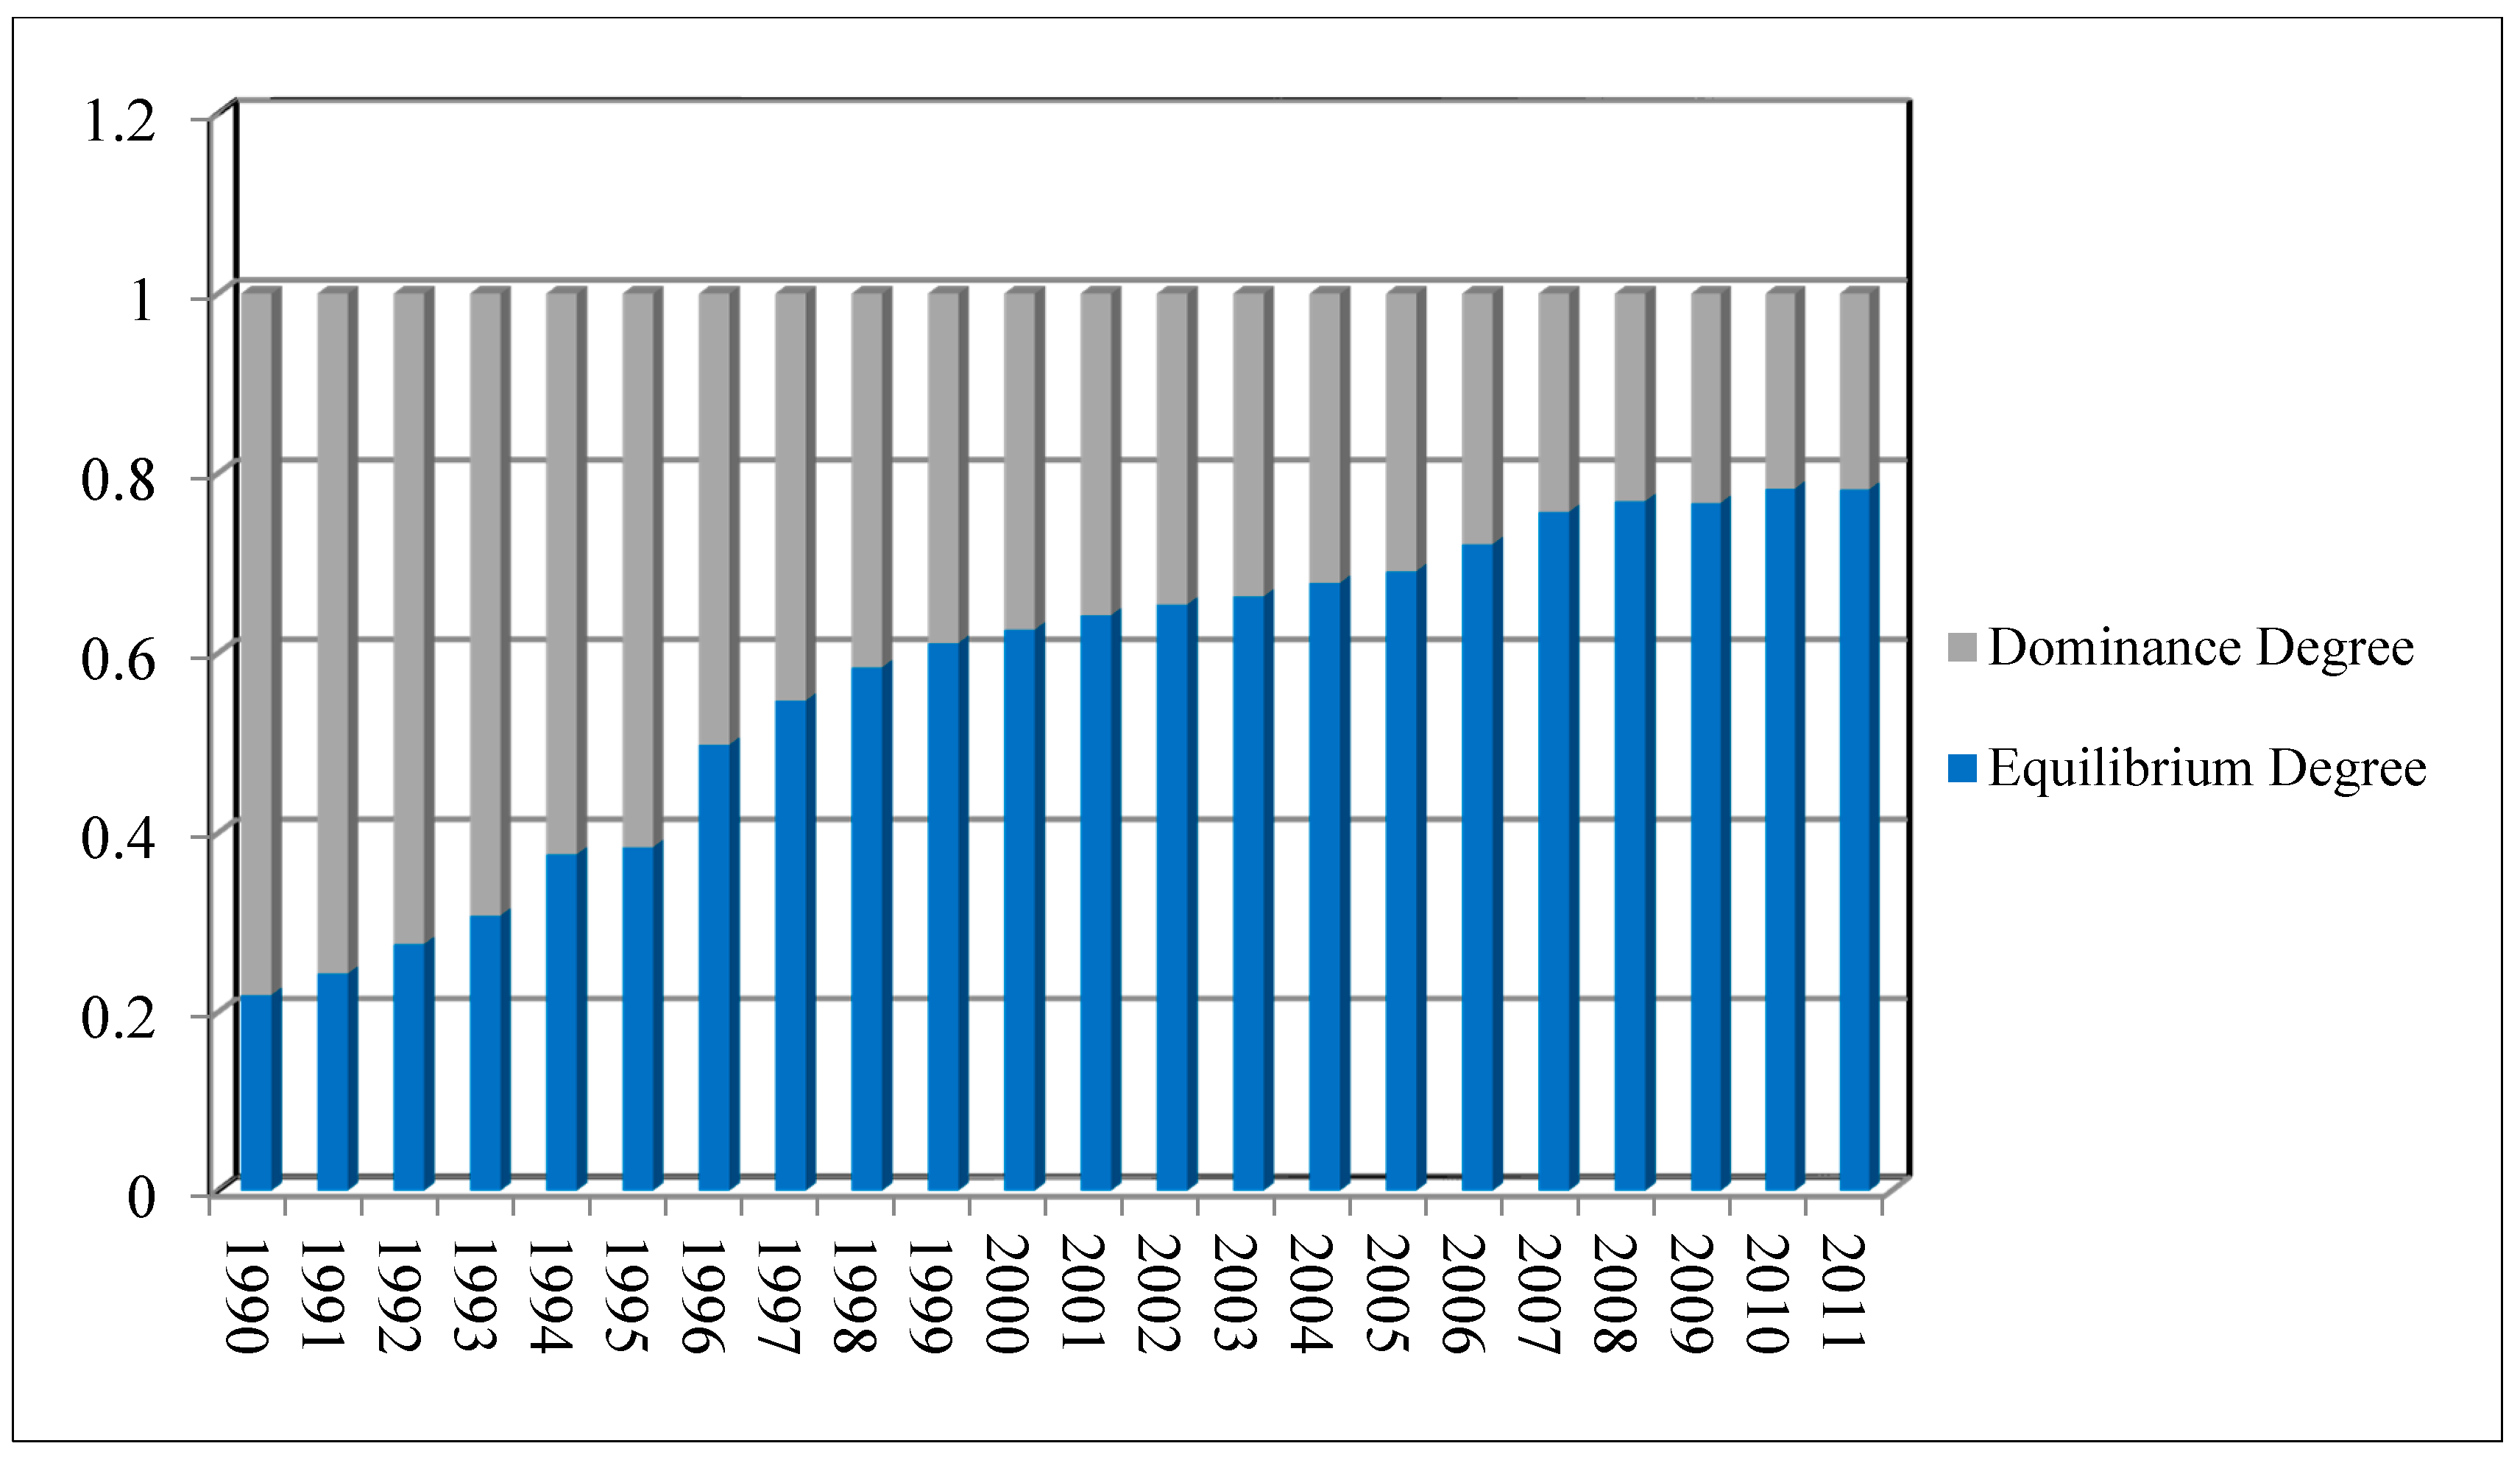
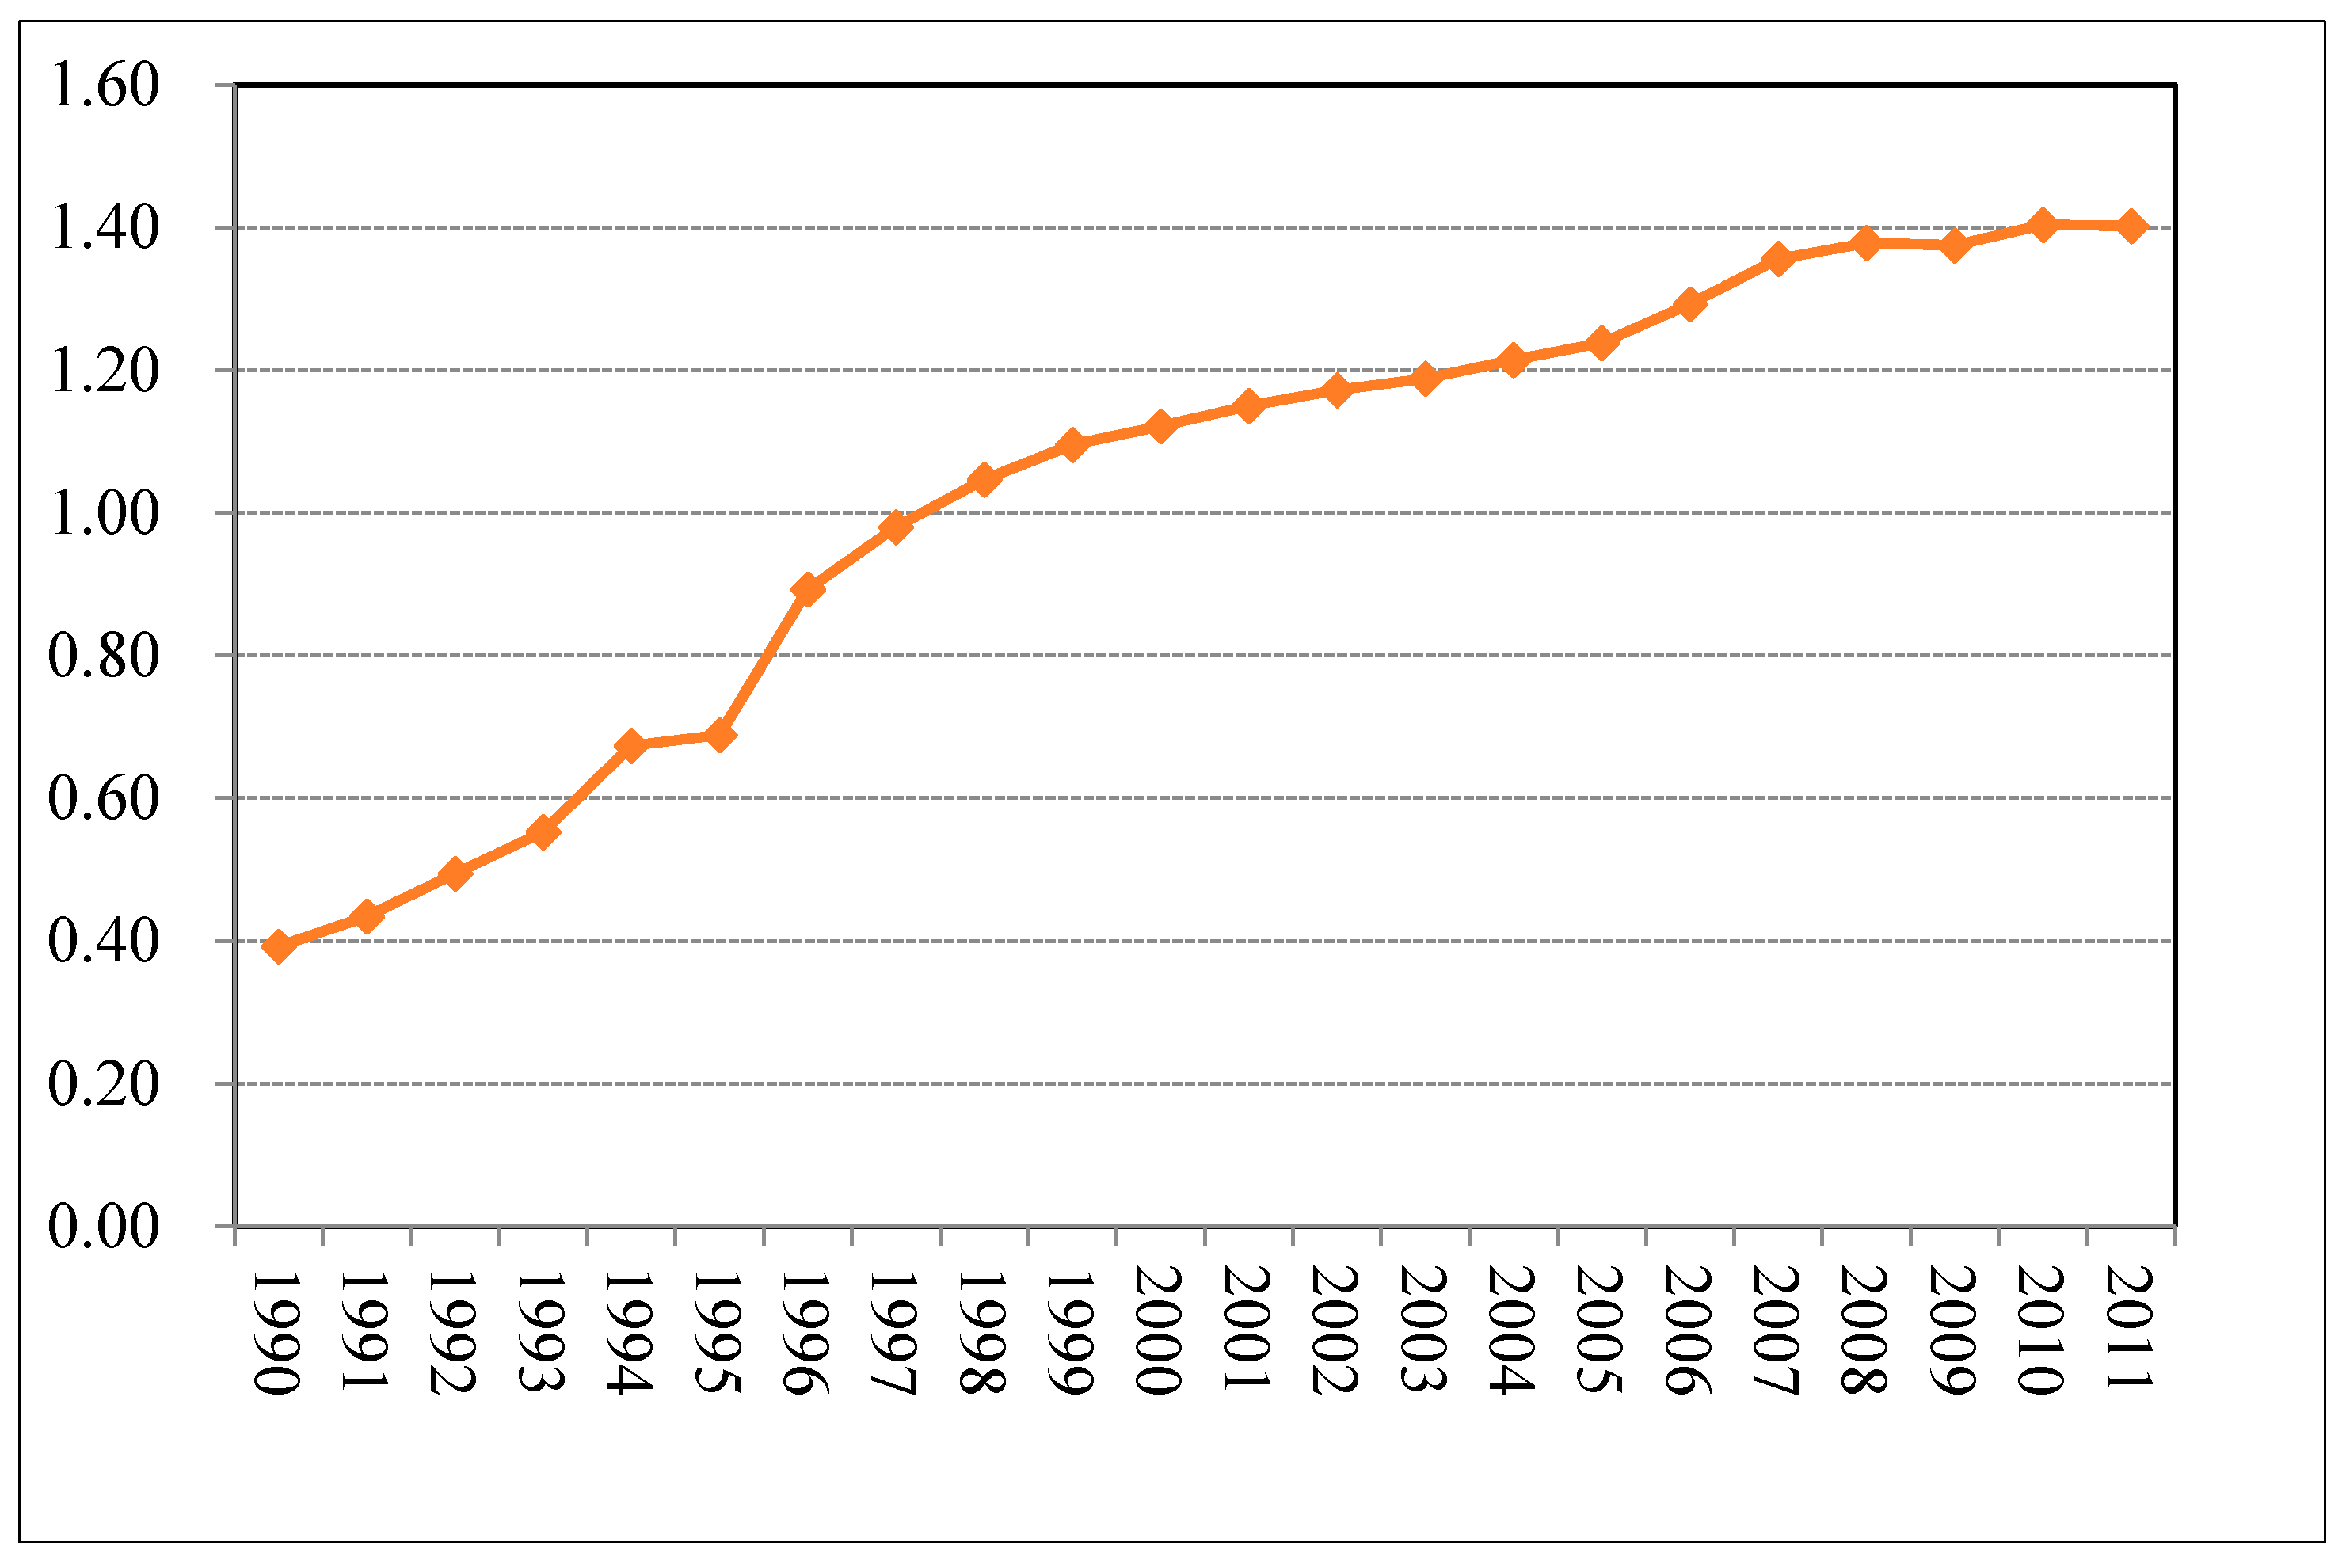
3.1. Results and Discussion of Information Entropy

Based on the data from the China Statistical Yearbook [1], the structural proportion of energy consumption was calculated (see Table 1). Values of the information entropy, equilibrium degree and dominance degree of the structure of HEC per capita are shown in Table 1, Figure 1 and Figure 2, respectively.
It could be observed from Figure 1 and Table 1 that the proportion of coal decreased dramatically from 92.11% in 1990 to 39.45% in 2011, while the information entropy increased gradually from 0.392 to 1.402 in the same period. Based on the response of the shrinking of coal in the energy consumption structure, the proportion of natural gas and electricity increased 26.33% and 13.76%, respectively. This indicated that the structure of HEC was markedly disordered. Although coal still makes up the majority of primary energy consumption currently, it has been gradually reduced by electricity, natural gas, liquefied petroleum gas and renewable energy. From the perspective of environmental protection and natural resource conservation, the energy consumption structure in the residential sector is optimized.
This is generally in line with the economic rules. As Chenery pointed out, economic development means structural transformation [35], which is two-fold, i.e., the upgrading of the existing industrial structure and the improvement of the urbanization level. There is a certain level of regularity on the changes of energy consumption structure due to the evolution of the economic structure and spatial structure. For example, with the speeding up of urbanization and industrialization, the proportion of natural gas in HEC in European and American countries accounts for more than 50% [19]. Based on the experience from the developed countries and the ambitious energy projects, such as the “west-east natural gas transmission project” and the “China-Russia natural gas pipeline project”, the structure of HEC in China will be changed significantly [36]. Natural gas and electricity will dominate the energy consumption in the residential sector in the future. Correspondingly, the evolution of the structure of HEC will be accelerating until the charging curve of information entropy becomes stable and convergent with the acceleration of urbanization. Thereafter, HEC will enter a virtuous and stable development stage.
Table 1. Structure proportion and information entropy for HEC in China from 1990 to 2011.
YearCoal (%)Electricity (%)Kerosene (%)Liquefied Petroleum Gas (%)Natural Gas (%)Coal Gas (%)SED
199092.113.260.831.501.330.960.3920.2190.781
199190.993.690.751.961.351.250.4350.2430.757
199289.174.740.722.530.931.90.4940.2760.724
199387.465.450.633.041.422.010.5530.3080.692
199483.636.820.674.191.732.960.6740.3760.624
199582.667.550.545.551.572.130.6880.3840.616
199674.909.730.669.132.043.550.8930.4980.502
199771.2111.180.689.802.095.040.980.5470.453
199868.2511.960.8211.042.365.561.0470.5840.416
199966.3312.670.8411.063.285.831.0950.6110.389
200064.8813.690.8511.293.355.951.1210.6260.374
200163.4514.920.8511.024.215.541.150.6420.358
200261.4115.890.4112.184.485.631.1720.6540.346
200360.1016.880.3812.684.575.391.1880.6630.337
200458.1717.440.2313.755.345.071.2140.6780.322
200556.2419.870.2112.775.934.981.2380.6910.309
200652.6421.590.2013.087.135.361.2920.7210.279
200747.3324.20.0913.589.265.531.3560.7570.243
200844.7426.410.1012.2111.025.531.3780.7690.231
200943.3128.430.0912.1411.184.851.3740.7670.233
201041.2828.380.0911.2613.635.371.4030.7830.217
201139.4529.590.1711.8515.093.861.4020.7820.218
Notes: S stands for information entropy; E stands for equilibrium degree; D stands for dominance degree.
Figure 1. The trend for S of HEC in China from 1990 to 2011.
Sustainability 07 03919 g001
Figure 2. The trend for E and D of HEC in China from 1990 to 2011.
Sustainability 07 03919 g002

3.2. Results and Discussion of LMDI Model

Based on the statistics data from the China Statistical Yearbook, the statistical results of HEC in China from Zhao et al. [37] and Equations (5)–(9), the results of LMDI analysis are presented in Table 2.
Table 2. Results of HEC in China based on the LMDI model.
YearΔEpopΔEactΔEintΔEstrΔEtot
1991–1992160.571033.22−1777.78−205.71−789.7
1992–1993150.46784.95−1544.81−16.67−626.07
1993–1994142.43850.93−1162.76−73.74−243.14
1994–1995132.67676.82−977.4989.89−78.11
1995–1996122.43881.21−2313.43−120.92−1430.71
1996–1997108.51531.95−1099.91−166.20−625.65
1997–199895.75610.38−707.94−15.93−17.74
1998–199986.84774.09−590.9018.18288.21
1999–200081.88572.46−537.89−22.3394.12
2000–200177.62831.65−697.81439.03650.49
2001–200275.471221.91−518.70−379.83398.85
2002–200377.031045.50697.1663.371883.06
2003–200487.491221.72915.1372.342296.68
2004–200598.521531.38−349.9238.451,318.43
2005–200695.421773.25−464.34−16.821387.51
2006–2007101.312292.09−721.0132.531704.92
2007–2008105.681798.64−1311.8140.66633.17
2008–2009106.042495.35−1381.95113.331332.77
2009–2010111.052263.15−1048.64138.891464.45
Total2017.1723,190.65−15,594.828.529641.54
As shown in Table 2, the accumulated contribution of demographic effects to HEC is 2017.17 from 1991 to 2010. The accumulative contribution rate was about 21%, implying that population is one of main driving factors for the growth of HEC. From 1991 to 2002, demographic effects became lower due to the decrease of the annual population incremental rate. Thereafter, demographic effects increased smoothly. The contribution rate of demographic effects to HEC was 6.88%, 5.94%, 16.69%, 7.96% and 7.58% from 2006 to 2010. This indicated that the influence of demographic effects on household energy is limited if population is under control. These findings are basically the same as the conclusion of Fu et al. [38], Lenzen et al. [18,39] and Munksgaard et al. [40].
As shown in Table 2, all values for the effect of residents’ income level were positive, which showed a direct impact on energy consumption. The accumulative contribution of residents’ income level is 23,190.65 with a contribution rate of 240.53%. This indicated that the effect of residents’ income level is one of the most critical driving factors for HEC, which proved the research conclusion of Mehrara [41] and He et al. [42]. With rapid economic development and the acceleration of urbanization, the residents’ income will be further increased. Therefore, this is an issue that the government must pay attention to with respect to achieving a balance between the goals of income growth and energy savings. Economic development should not be achieved without the consideration of energy savings and environmental protection.
Most values for the effect of energy consumption intensity are negative from 1991 to 2010. Its accumulative contribution to the HEC was −15.5948 with a contribution rate of −161.75%. This indicated that the effect of energy consumption intensity is the key driving force to reduce HEC. However, the K-B hypothesis proposed by Khazzoom [43] and Brookes [44] discussed the rebound effect for the first time. They argued that energy efficiency improvements cannot reduce energy demand as much as expected [45,46]. The energy rebound effect was confirmed by some other studies [47,48,49,50,51,52]. A recent study showed that the residential household energy rebound effect aroused by efficiency improvement is comparatively small in China [52]. It is essential to continue adhering to the existing energy strategy and conservation routine in the macro perspective. With the implementation of policy instruments, such as carbon tax, subsidy policy for clean energy and ladder price for electricity consumption, the rebound effect can be restrained in the future [52]. It is a complex system to enhance household energy efficiency, which covers various aspects relevant to the daily activities of residents, such as housing, food, appliances, trips, etc. Residents should be encouraged to use energy-saving products. Energy-efficient policies should be designed to influence the behaviour of different energy consumers in both urban and rural areas, especially in the residential sector [53]. This could be achieved by market regulation or price regulation. For example, the government should strengthen urban infrastructure planning for the supply of district heat and gasification, as well as the necessary solar energy facilities [54,55]. In addition, China should implement different subsidy policies for energy-efficient home appliances between urban and rural regions to ensure the effectiveness of the future energy-efficient subsidy program. Secondly, the level of energy-saving technologies and energy efficiency standard of products should be improved to provide residents with better energy-efficient products. Thirdly, efforts are required to enhance the public awareness of sustainability issues and associated energy-efficient measures. It is necessary to cultivate proper living habits and energy-saving awareness, such as green transportation, green travel and sustainable consumption. Lastly, accelerating the transformation of the energy structure towards clean and low carbon, it is necessary to develop new and renewable energies, as well as clean energies, such as natural gas. Due to the gap between energy reserves and energy supply in China, it is necessary to import more natural gas in the future. The goals for new and renewable energy development have been established in China, i.e., contributing to 15% of the total primary energy consumption by 2020. From 2011 to 2030, the newly added hydropower, wind power, solar power and nuclear power will surpass 1 billion kW, in which nuclear power will occupy 15%–20% [36]. With the development of new energy, renewable energy and low-carbon energy, China will reduce the reliance on traditional fossil fuel and consequently improve the environmental performance, as well as the energy sustainability [56].
The accumulative contribution and contribution rate of the effect of energy structure are 0.2852 and 2.96%, respectively. The annual contribution rate in the last four years was 1.91%, 6.42%, 8.50% and 9.48%, respectively. Although it has increased year by year, the effect of energy structure was not the main factor responsible for the growth of HEC based on the analysis of information entropy. As a result, the proportion of natural gas and electricity to the total energy consumption will increase, and the coal-dominated energy mix will be transformed step by step [17]. To sum up, the transformation of the energy consumption structure is inevitable as an outcome of urbanization. It is not feasible to achieve the goal of reducing the amount of HEC simply by reducing the effect of the energy structure.

4. Conclusions

The information entropy and equilibrium degree of the energy consumption structure gradually increasedfrom1991–2010 in China, while the dominance degree decreased in China. Similar to the developed countries, the structural evolution of HEC is inevitable, as coal will be reduced by using cleaner energy step by step. According to the analysis of the LMDI model, the accumulative contribution rate of demographic effects, the effect of energy consumption intensity, the effect of residents’ income level and the effect of energy structure are 20.92%, 240.53%, −161.75% and 2.96%, respectively. This indicated that residents’ income was the key driving factor to increase HEC, while the effect of energy intensity was the only driving factor to reduce the amount of HEC. Considering the acceleration of China’s industrialization and urbanization, the economy will further develop, and residents’ income will also increase. Therefore, enhancing the household energy efficiency is an important way to control the rapid growth of HEC effectively. From the perspective of sustainable energy policies, the government should enact specific plans and measures to improve the household energy efficiency. The level of energy-saving technologies and energy efficiency standards should be improved. Energy-saving awareness and consumption habits of the public should also be motivated via both incentives and penalties. New energy, renewable energies and low-carbon energy should be further promoted. It is crucial to formulate relevant new and renewable energy development planning. This helps to reduce the utilization of traditional fossil fuel, as well as to improve the energy efficiency and environmental performance of the residential sector.
HEC is a complex social system, which is associated with a number of uncertainties. For instance, it is well recognized that HEC is a social behaviour, which is based on the constitution of the family and their relationships. As a result, HEC is affected by a number of sociological factors, such as the awareness and attitudes toward energy consumption, which is difficult to quantify. Although LMDI is an established model to quantitatively identify the relative impact of different factors on the changes in energy consumption, however, due to different focuses, those sociological factors are not taken into consideration in LMDI. This has resulted in a certain degree of uncertainty. Similarly, all statistics were drawn from the Chinese Statistic Yearbook, which are the most reliable data in China. However, a certain level of biases exists due to errors during the data acquisition process. Consequently, uncertainties exist in every individual influencing factor. For instance, the income per capita (R) is significantly affected by the government policies due to the transition period of the economic system in China. This uncertainty associated with incomes will lead to uncertainties of energy consumption by household. In addition, related energy development plans were released in order to promote renewable energy development. However, the original targets may not be followed during the execution of plans. Therefore, there are uncertainties associated with the energy production and consumption. Indeed, making future projections based on historical data inherently carries a lot of uncertainties. In summary, HEC is a complex system that is associated with uncertainties. Future research opportunities exist to quantitatively analyse the impacts of these uncertainties in the HEC.

Acknowledgments

This research is supported by National Natural Science Foundation (41301640, 41471461), the Award Fund for Young Scientists of Shandong Province (BS2012SF015), the Innovation Fund of Shandong University (IFYT1401, IFYT14010), the Humanities & Social Sciences Project of Shandong Province (14-ZZ-JG-02), the Soft Science Research Plan of Shandong Province (2014RKE27057, 2014RKE27058) and The Development Program of Application-Oriented Talent Training for Environmental Engineering Specialty, Shandong Province.

Author Contributions

The study was designed by Qingsong Wang and Xueliang Yuan. The data from yearbooks and professional websites were retrieved by Ping Liu, Rujian Ma and Ruimin Mu. The results were analysed by Xingxing Cheng and Qignsong Wang. The literature related to the research was reviewed by Xueliang Yuan. Model design and English corrections were undertaken by Jian Zuo.

Conflicts of Interest

The authors declare no conflict of interest.

References

  1. National Bureau of Statistics (NBS). China Statistical Yearbook 2013; China Statistic Press: Beijing, China, 2013. [Google Scholar]
  2. Zheng, X.Y.; Wei, C.; Qin, P. Chinese Household Energy Consumption Report (2014); Science Press: Beijing, China, 2015. [Google Scholar]
  3. Qin, Y.; Hou, L. An Empirical Research on the Influence of Urban Residents Income on Direct Energy Consumption in China. Ecol. Econ. 2013, 1, 64–66. [Google Scholar]
  4. Yuan, X.L.; Zuo, J. Transition to low carbon energy policies in China-from the Five-Year Plan perspective. Energy Policy 2011, 39, 3855–3859. [Google Scholar] [CrossRef]
  5. Linden, A.L.; Annika, C.K.; Eriksson, B. Efficient and inefficient aspects of residential energy behavior: What are the policy instruments for change? Energy Policy 2006, 34, 1918–1927. [Google Scholar] [CrossRef]
  6. Yohanis, Y.G. Domestic energy use and householders’ energy behavior. Energy Policy 2012, 41, 654–665. [Google Scholar] [CrossRef]
  7. York, R. Demographic Trends and energy consumption in European Union Nations 1960–2025. Soc. Sci. Res. 2007, 36, 855–872. [Google Scholar] [CrossRef]
  8. Fang, B.; Guan, D.B.; Liao, H.; Wei, Y.M. Empirical study of drivers for China’s energy consumption:Evidence from an input-output based structural decomposition analysis. Math. Pract. Theory 2011, 2, 66–77. [Google Scholar]
  9. Schultz, P.W. The structure of environmental concern: Concern for self, other people, and the biosphere. J. Environ. Psychol. 2001, 21, 327–339. [Google Scholar] [CrossRef]
  10. Hansla, A.; Gamble, A.; Juliusson, A. Psychological determinants of attitude towards and willingness to pay for green electricity. Energy Policy 2008, 36, 768–774. [Google Scholar] [CrossRef]
  11. Reinhard, H.; Schipper, L. Residential energy demand in OECD-countries and the role of irreversible efficiency improvements. Energy Econ. 1998, 20, 421–442. [Google Scholar] [CrossRef]
  12. Egmond, C.; Jonkers, R.; Kok, G. A strategy to encourage housing associations to invest in energy conservation. Energy Policy 2005, 33, 2374–2384. [Google Scholar] [CrossRef]
  13. Cellura, M.; Longo, S.; Mistretta, M. Application of the structural decomposition analysis to assess the indirect energy consumption and air emission changes related to Italian households consumption. Renew. Sustain. Energy Rev. 2012, 16, 1135–1145. [Google Scholar] [CrossRef]
  14. Ang, B.W. Decomposition analysis for policymaking in energy: Which is the preferred method? Energy Policy 2004, 32, 1131–1139. [Google Scholar] [CrossRef]
  15. Chung, W.; Kam, M.S.; Ip, C.Y. A study of residential energy use in Hong Kong by decomposition analysis, 1990–2007. Appl. Energy 2011, 88, 5180–5187. [Google Scholar] [CrossRef]
  16. Stern, P.C.; Dietz, T.; Abel, T. A value-belief-norm theory of support for social movements: The case of environmentalism. Res. Hum. Ecol. 1999, 6, 81–97. [Google Scholar]
  17. Huang, F.X.; Jin, L. Mechanism of impact of urbanization on energy consumption in China. Rev. Ind. Econ. 2011, 10, 104–121. [Google Scholar]
  18. Lenzen, M.; Dey, C.; Lundie, S. A Comparative Multivariate Analysis of Household Energy Requirements in Australia, Brazil, Denmark, India and Japan. Energy 2006, 31, 181–207. [Google Scholar] [CrossRef]
  19. Geng, H.Q.; Gu, S.Z.; Guo, D.M. Analyses on evolution of household energy consumption structure based on information entropy. J. Nat. Resour. 2004, 2, 257–262. [Google Scholar]
  20. Li, Y.M.; Zhang, L. Structural Decomposition Analysis of China’s Indirect Household Energy Consumption. Resour. Sci. 2008, 30, 890–895. [Google Scholar]
  21. Biesiot, W.; Noorman, K.J. Energy requirements of household consumption: A case study of The Netherlands. Ecol. Econ. 1999, 28, 367–383. [Google Scholar] [CrossRef]
  22. Ala-Mantila, S.; Heinonen, L.; Junnila, S. Relationship between urbanization, direct and indirect greenhouse gas emissions, and expenditures: A multivariate analysis. Ecol. Econ. 2014, 104, 129–139. [Google Scholar] [CrossRef]
  23. Larry, L.S.; James, K.W. Application of steady state maximum entropy methods to high kinetic energy impacts on ceramic targets. Int. J. Impact Eng. 1999, 23, 869–882. [Google Scholar] [CrossRef]
  24. Allan, J. Entropy and the cost of complexity in industrial production. Exergy 2002, 2, 295–299. [Google Scholar] [CrossRef]
  25. Tan, Y.Z.; Wu, C.F. The laws of the information entropy values of land use composition. J. Nat. Rresour. 2003, 18, 112–117. [Google Scholar]
  26. Durowoju, O.A.; Chan, K.H.; Wang, X.J. Entropy assessment of supply chain disruption. J. Manuf. Technol. Manag. 2012, 23, 998–1014. [Google Scholar] [CrossRef]
  27. Tomas, K.; Bengt, M. Entropy and economic processes-physics perspectives. Ecol. Econ. 2001, 36, 165–179. [Google Scholar] [CrossRef]
  28. Jowsey, E. Economic aspects of natural resource exploitation. Int. J. Sustain. Dev. World Ecol. 2009, 16, 303–307. [Google Scholar] [CrossRef]
  29. Macqueen, J.; Marschak, J. Partial Knowledge, Entropy, and Estimation. Proc. Natl. Acad. Sci. USA 1975, 72, 3819–3824. [Google Scholar] [CrossRef] [PubMed]
  30. Kasemsan, M.; Park, S.K.; Armistead, G.R. A accounting for high-order correlations in probabilistic characterization of environmental variables, and evaluation. Stoch. Environ. Res. Risk Assess. 2008, 22, 159–168. [Google Scholar] [CrossRef]
  31. Wang, Q.S.; Yuan, X.L.; Ma, C.Y.; Zhang, J.; Zuo, J. Research on the impact assessment of urbanization on air environment with urban environmental entropy model: A case study. Stoch. Environ. Res. Risk Assess. 2012, 26, 443–450. [Google Scholar] [CrossRef]
  32. Chen, Y.M.; Liu, M.H. The basic laws of the Shannon entropy values of land-use composition. Hum. Geogr. 2001, 16, 20–24. [Google Scholar]
  33. Ang, B.W.; Zhang, F.Q.; Choi, K. Factorizing changes in energy and environmental indicators through decomposition. Energy 1998, 23, 489–495. [Google Scholar] [CrossRef]
  34. Wang, C.J.; Wang, F.; Zhang, H.G.; Ye, Y.Y.; Wu, Q.T.; Su, Y.X. Carbon Emissions Decomposition and Environmental Mitigation Policy Recommendations for Sustainable Development in Shandong Province. Sustainability 2014, 6, 8164–8179. [Google Scholar] [CrossRef]
  35. Dai, B.X.; Shen, H.D. Modern Industry Economics; Economy & Management Press: Beijing, China, 2011. [Google Scholar]
  36. He, J.K. The strategic choice of Chinese energy revolution and low carbon development. Wuhan Univ. J. 2015, 68, 5–12. [Google Scholar]
  37. Zhao, X.L.; Li, N.; Ma, C.B. Residential energy consumption in urban China: A decomposition analysis. Energy Policy 2012, 41, 644–653. [Google Scholar] [CrossRef]
  38. Fu, C.H.; Wang, W.J.; Zeng, X.C.; Zhang, L.H.; Lei, G.H. Population Sensitivity of Urban Energy Consumption. Resour. Sci. 2013, 35, 1933–1944. [Google Scholar]
  39. Lenzen, M.; Dey, C.; Foran, B. Energy Requirements of Sydney Households. Ecol. Econ. 2004, 49, 375–399. [Google Scholar] [CrossRef]
  40. Munksgaard, J.; Wier, M.; Lenzen, M.; Dey, C. Using Input-Output Analysis to Measure the Environmental Pressure of Consumption at Different Spatial Levels. J. Ind. Ecol. 2005, 9, 169–185. [Google Scholar] [CrossRef]
  41. Mehrara, M. Energy consumption and economic growth: The case of oil exporting countries. Energy Policy 2007, 35, 2939–2945. [Google Scholar] [CrossRef]
  42. He, R.F.; Niu, S.W.; Jia, Y.Q.; Zhang, X.; Ding, Y.X. Panel Data Analysis of Per Capita Household Energy Consumption, Income and Carbon Emissions. Resour. Sci. 2012, 34, 1142–1151. [Google Scholar]
  43. Khazzoom, D.J. Economic implications of mandated efficiency standards for household appliances. Energy J. 1980, 11, 21–40. [Google Scholar]
  44. Brookes, L.G. Energy policy, the energy price fallacy and the role of nuclear energy in the UK. Energy Policy 1978, 6, 94–106. [Google Scholar] [CrossRef]
  45. Brookes, L.G. Energy efficiency fallacies: The debate concluded. Energy Policy 1993, 21, 346–347. [Google Scholar] [CrossRef]
  46. Grubb, M.J. Reply to Brookes. Energy Policy 1992, 20, 392–393. [Google Scholar] [CrossRef]
  47. Chitnis, M.; Sorrell, S.; Druckman, A.; Firth, S.K.; Jackson, T. Turning lights into flights: Estimating direct and indirect rebound effects for UK households. Energy Policy 2013, 55, 234–250. [Google Scholar] [Green Version]
  48. Saunders, H. Recent Evidence for Large Rebound: Elucidating the Drivers and their Implications for Climate Change Models. Energy J. 2015, 36, 23–48. [Google Scholar] [CrossRef]
  49. Galvin, R. Estimating broad-brush rebound effects for household energy consumption in the EU 28 countries and Norway: Some policy implications of Odyssee data. Energy Policy 2014, 73, 323–332. [Google Scholar] [CrossRef]
  50. Heinonen, J.; Jalas, M.; Juntunen, J.K.; Ala-Mantila, S.; Junnila, S. Situated lifestyles: II. The impacts of urban density, housing type and motorization on the greenhouse gas emissions of the middle-income consumers in Finland. Environ. Res. Lett. 2013, 8. [Google Scholar] [CrossRef]
  51. Hertwich, E.G. Consumption and the rebound effect—An industrial ecology perspective. J. Ind. Ecol. 2005, 9, 85–98. [Google Scholar] [CrossRef]
  52. Xue, D. Estimating the Rebound Effect for Household Energy Consumption in China. Acta Sci. Nat. Univ. Peki. 2014, 5, 348–354. [Google Scholar]
  53. Yao, X.L.; Liu, Y.; Yan, X. A quantile approach to assess the effectiveness of the subsidy policy for energy-efficient home appliances: Evidence from Rizhao, China. Energy Policy 2014, 73, 512–518. [Google Scholar] [CrossRef]
  54. Angelamaria, M.; Marco, D.I.; Andrea, F.; Giorgio, F. Development of a Geographical Information System (GIS) for the Integration of Solar Energy in the Energy Planning of a Wide Area. Sustainability 2014, 6, 5730–5744. [Google Scholar] [CrossRef]
  55. Graham, P. Household Solar Photovoltaics: Supplier of Marginal Abatement, or Primary Source of Low-Emission Power? Sustainability 2013, 5, 1406–1442. [Google Scholar] [CrossRef]
  56. Wang, Q.S.; Yuan, X.L.; Zuo, J.; Mu, R.M.; Zhou, L.X.; Sun, M.X. Dynamics of Sewage Charge Policies, Environmental Protection Industry and Polluting Enterprises-A Case Study in China. Sustainability 2014, 6, 4858–4876. [Google Scholar] [CrossRef]

