Article

Quantitative Diagnoses and Comprehensive Evaluations of the Rationality of Chinese Urban Development Patterns

1
Key Laboratory of Regional Sustainable Development Modeling, Chinese Academy of Sciences, Beijing 100101, China
2
Institute of Geographical Sciences and Natural Resources Research, Chinese Academy of Sciences, Beijing 100101, China
*
Author to whom correspondence should be addressed.
Sustainability 2015, 7(4), 3859-3884; https://doi.org/10.3390/su7043859
Submission received: 8 December 2014 / Revised: 23 March 2015 / Accepted: 23 March 2015 / Published: 31 March 2015

Abstract

:
China’s new urbanization development strategy needs to be supported by rational urban systems. Here, a comprehensive diagnostic index system that uses GIS technology and a Chinese urban scale structure rationality diagnostic model, functional structure rationality diagnostic model, spatial structure rationality diagnostic model and Chinese urban development rationality diagnostic model is used to comprehensively evaluate the rationality of Chinese urban development patterns. The results show that the structure of urban development in China is largely rational, with 70.78% of all cities rational in this respect  and with rationality influenced by historical evolution, zoning adjustments and natural conditions; that overall, the scale structure of Chinese cities is rational, with 68.03% of all cities rational in this respect, conforming to Zipf’s law and exhibiting a relatively rational pyramidal pattern with “a slightly larger middle and small bottom end”; that overall, urban spatial structure is rational, with 69.41% of all cities rational in this respect, and irrational cities concentrated in areas with low carrying capacities and regions with few cities with high carrying capacities; and that urban functional structure is largely rational, with 69.11% of all cities rational in this respect, mainly concentrated in urban agglomerations. This study provides a scientific basis for further optimizing the structure of urban development in China and promoting a new type of urbanization.

1. Introduction

Over the past 30 years, urbanization in China has accelerated at a scale and speed unprecedented in the country’s past, which has attracted the world’s attention [1]. There has been a rapid increase in urban data, with data on population, land use and economic scale having increased enormously [2]. These changes have prompted major changes to the systems and structures of Chinese cities. According to the China Urban Statistical Yearbook, the number of cities in China increased at an annual average of 12.13% between 1984 and 2013, from 296 to 660. The total includes 469 cities with a population of more than 500,000, which is 43.35% of the global total (1082). From 1985 to 2010, the proportion of urban GDP in China’s national GDP as a whole has increased from 43.21% to 60.73%, with an increment of urban population of 17,162 people and built-up urban areas of 21,505 square kilometers. Within this context of dramatic changes to China’s urban development, assessments of the rationality of Chinese urban development, including rational control of scale hierarchy, rational guidance of spatial structure and rational upgrading of functional structure, have become key issues concerning the sustainable development of China’s urban system.
The nature of urbanization and associated urban spatial structures is generally related to population, industrial, economic, social and ecological factors. A rational urban development structure should consist of an urban spatial configuration with an orderly hierarchical scale, rational division of functions and a clear leading role for space. These three things are not completely independent. In fact, they intersect and interrelate, and together they constitute the urban system structure [3].
Many existing studies have examined the characteristics and evaluated the rationality of national and regional urban systems. These studies largely take population, space, levels and networks as their point of departure. They are also based on population data and tend to discuss the urban system structures [4,5,6,7,8,9,10], spatial structures [11,12,13,14], and functional structures [15,16,17,18,19,20,21,22] of different countries and regions. Some scholars have also studied the development structures of Chinese cities from the perspective of their scale structure, spatial structure and functional structure. Studies of urban scale mainly include two areas. The first is city size distribution change based on population data. Zhou, Dai and Bu [23] feel that metropolises and large cities have not grown abnormally large in the globalization process of China’s urbanization. Xu and Zhu [24] noted that between 1990 and 2000, small cities grew more rapidly than large cities. The second is using population data to test and verify whether city size distribution complies with Zipf’s law in terms of time and space. Song and Zhang [25] and Xu and Zhu [24] found that China’s urban system complied with Zipf’s law during the decade. Luckstead and Devadoss [26] selected 142 upper-tail cities and used population data to examine the scale of Chinese cities and concluded that Zipf’s law does not hold for China for all decades.
There are two possible reasons why these studies had different results. First, the adequacy of the cities selected in the study sample may have directly impacted the results. In 2010 China had 657 cities, but Luckstead and Devadoss only selected 142 cities, which clearly did not represent all China’s cities. Second, population and land factors are equally important when it comes to China’s urban scale. Population data alone cannot fully show the scale of Chinese cities. As a result, this study shall look at both population and land to show the scale of Chinese cities.
Studies on spatial structure either focus on one city or a group of cities in terms of the spatial differences and laws governing the evolution of urban land use expansion, with few studies on urban spatial structure and its rationality at the national level [27,28]. China’s regional development strategies have played an active role in the Chinese economic development structure. Under the new type of Chinese urbanization, major function-oriented zoning (MFOZ) is the guideline for optimizing the spatial structure of regional development in China. It uses differentiated policies to guide the Chinese urban system in forming a new development structure. MFOZ divides Chinese territory into optimal development zones, key development zones, restricted development zones and prohibited development zones. Optimal development zones and key development zones encourage development of cities and urban agglomerations. Restricted development zones and prohibited development zones restrict urban development. Using these main functional zones as a framework to study the spatial development direction of the Chinese urban system can provide a scientific basis on which to formulate an urban development strategy. There are currently few studies in this area, which is an important point of innovation in this paper.
Studies on urban functional structure are mainly concerned with the classification and evolution of function types. Tian et al. [29] used the Nelson method based on population data to look at types of functions of Chinese cities in 1989 and 1996. They discovered that the functions of cities underwent considerable change during this period and came to the conclusion that the functions of cities are related to their size and location. In fact, the urban functional structure includes three elements, namely function type, functional intensity and functional scale [30], but to date there have been few studies that evaluate these three elements together. This is another innovation point of this study.
Although these studies advanced our understanding of the changes taking place in Chinese cities, they had several limitations. First, previous cases only focused on either urban scale structure, spatial structure or functional structure, which means they did not reflect the overall structural characteristics of the urban system. Second, none of their methodologies included constructing a model involving scale structure, spatial structure and functional structure for carrying out comprehensive evaluations of national urban development patterns. Third, with regard to China’s rapid urbanization, there has been a lack of studies that comprehensively evaluate the rationality of China’s urban development pattern taking into account scale structure, spatial structure and functional structure.
This study was conducted within the context of China’s rapid urbanization and is based on data from the China Urban Statistical Yearbook 2010 and the Sixth National Population Census of the People’s Republic of China. Using the three elements of scale structure, spatial structure and functional structure, this study establishes a rationality evaluation index system and evaluation model to examine the rationality of the urban development pattern in China in 2010.
After the introduction, this paper is divided into four sections for modeling and evaluating the rationality of the Chinese urban development pattern. The second section looks at the scope and source of data. The third section establishes a rationality evaluation index system and comprehensive diagnostic model to examine the rationality of the urban development pattern in China, including an urban scale structure rationality (USR) diagnostic model, an urban spatial structure rationality (UKR) diagnostic model and an urban functional structure rationality (UFR) diagnostic model. The fourth section analyzes the results and ends with conclusions and a discussion.

2. Study Area and Data

The variable sample used in this paper is from 2010, and the unit of study is China’s 657 cities (subject to data availability limitations and not including Hong Kong, Macao). The research data comes from three sources. First, urban population and GDP data comes from the China Urban Construction Statistical Yearbook 2011. Urban population scale refers to the non-agricultural population of cities and municipal districts and is stated in tens of thousands. Second, data on population employed in certain industries comes from the Sixth National Population Census of the People’s Republic of China from 2010. There are 20 industries: agriculture, forestry, animal husbandry and fisheries; mining; manufacturing; production and supply of electricity, gas and water; construction; warehousing and postal services; transportation and transport; computer services and software; information transmission; wholesale and retail trade; accommodation and catering; financial services; real estate; rental and business activities; scientific research, technical services and geological prospecting; water conservancy, environment and public facilities; management residential and other services; education; health, social security and social welfare; culture, sport and entertainment; public administration and social organizations; international organizations. Third, data on major function-oriented zoning comes from the division scheme of Planning of Major Function-Oriented Zoning, which divides the whole country into optimal development zones, key development zones, restricted development zones and prohibited development zones [31].

3. Methods

3.1. Establishing a Comprehensive Diagnostic Indicator System for Urban Development Structure Rationality

Based on the basic connotations of the rationality of the urban development pattern and the dynamic mechanisms it forms, and taking China’s 657 cities as the units of study, the Chinese urban development pattern rationality diagnostic index system is divided into an urban scale structure rationality diagnosis, urban functional structure rationality diagnosis and urban spatial structure rationality diagnosis, which is then used to establish an index system that includes a target layer, sub-target layer, factor layer and sub-factor layer. Normalization of the index is achieved using the maximum deviation and standard deviation normalization methods. Delphi and analytic hierarchy process (AHP) methods are used to determine index weight coefficients in accordance with the contribution rates of each indicator in assessing the target (see Table 1). We find that a high rationality city should have high rationality indices in terms of urban scale structure, urban functional structure and urban spatial structure. If the conditions are not met, the development structure rationality of the city would be reduced.
Table 1. Comprehensive Diagnostic Index System for Chinese Urban Development Pattern Rationality.
Target LayerSub-Target LayerFactor LayerSub-Factor Layer
Urban Development Pattern Rationality DiagnosisUrban scale structure rationality diagnosisUrban system rationalityZipf’s exponent
Urban scale efficiency rationalityUrban scale efficiency index
Urban spatial structure rationality diagnosisMajor function zoningMajor function zone carrying capacity index
Degree of equilibrium of urban spaceUrban distribution density index
Urban space kernel density index
Urban functional structure rationality diagnosisFunctional scaleBenefits of scale index
Functional strengthSpecialization index
Specialized departmentsIndustry abundance index

3.2. Comprehensive Diagnostic Model for Urban Development Structure Rationality

According to the comprehensive diagnostic index system for urban development structure rationality, the urban development structure rationality HL comprehensive diagnostic model is composed of three weighted parts: the urban scale structure rationality (USR) diagnostic model based on Zipf’s exponent, the urban spatial structure rationality (UKR) diagnostic model based on kernel density estimation (KDE) and the urban functional structure rationality (UFR) diagnostic model based on the Shannon-Wiener index. By combining the urban system rationality and the urban scale efficiency rationality with urban scale structure rationality (USR) diagnostic model, we can evaluate the urban scale structure rationality in a rational way. By overlaying the urban space kernel density index and the major function zone carrying capacity index with the urban spatial structure rationality (UKR) diagnostic model, we can well evaluate the urban spatial structure rationality. By combining the functional scale factor,functional strength factor and functional diversity factor with the urban functional structure rationality (UFR) diagnostic model, we can evaluate the urban functional structure rationality. The HL comprehensive diagnostic model is the combined model in this manuscript, and it is used to evaluate urban development structure rationality by combining the indices of USR, UKR and UFR. Delphi and analytic hierarchy process (AHP) methods are used to determine index weight coefficients in accordance with the contribution rates of each indicator in assessing the target.
The HL comprehensive diagnostic model is applicable to evaluate the spatial pattern rationality of such areas with homogeneity as one-city agglomeration, economic zone, province or country. Respectively, define the city list of different rationality levels in terms of urban scale structure rationality, the urban spatial structure rationality, the urban functional structure rationality and the overall urban development structure rationality at the regional scale. The following is the formula:
H L = y 1 U S R + y 2 U K R + y 3 U F R
In Formula (1), HL is the urban development structure rationality diagnostic index, y1 is the weight coefficient of the urban scale structure rationality index, y2 is the weight coefficient of urban spatial structure rationality index and y3 is the weight coefficient of urban functional structure rationality index. Over 30 urban experts from Peking University, Tsinghua University and CAS were invited to score the weight of the three factors applicable to the assessment of urban development pattern at the national and large area scale. Using the AHP supported by entropy technology, the calculations came to y1 = 0.3571, y2 = 0.3286, and y3 = 0.3143. The comprehensive diagnostic criteria for urban development structure rationality are shown in Table 2.
Table 2. Comprehensive Diagnostic Criteria for Development Structure Rationality of Chinese Cities.
Type/Weight/CriteriaUSRUKRUFR
y1 = 0.3571y2 = 0.3286y3 = 0.3143
Criteria (USR value)attribute valueCriteria (matrix)attribute valueCriteria (UFR value)attribute value
Highly Rational CityUSR > 0.645(A,a), (B,b), (C,c), (D,d) 5UFR > 0.555
Relatively Highly Rational City0.55 < USR < 0.634(A,b), (B,a), (D,c), (C,b)40.44 < UFR < 0.544
Moderately Rational City0.47 < USR < 0.543(D,b), (C,a)30.34 < UFR < 0.433
Relatively Irrational City0.37 < USR < 0.462(A,c), (B,c), (D,a)20.26 < UFR < 0.332
Irrational CityUSR < 0.361(A,d), (B,d), (C,d)1UFR < 0.261
USR: the urban scale structure rationality; UKR: the urban spatial structure rationality; UFR: the urban functional structure rationality; A: optimal development zones; B: key development zones; C: restricted development zones; D: prohibited development zones; a: highly concentrated urban areas; b: relatively highly concentrated urban areas; c: scattered urban areas; d: sparse urban areas.

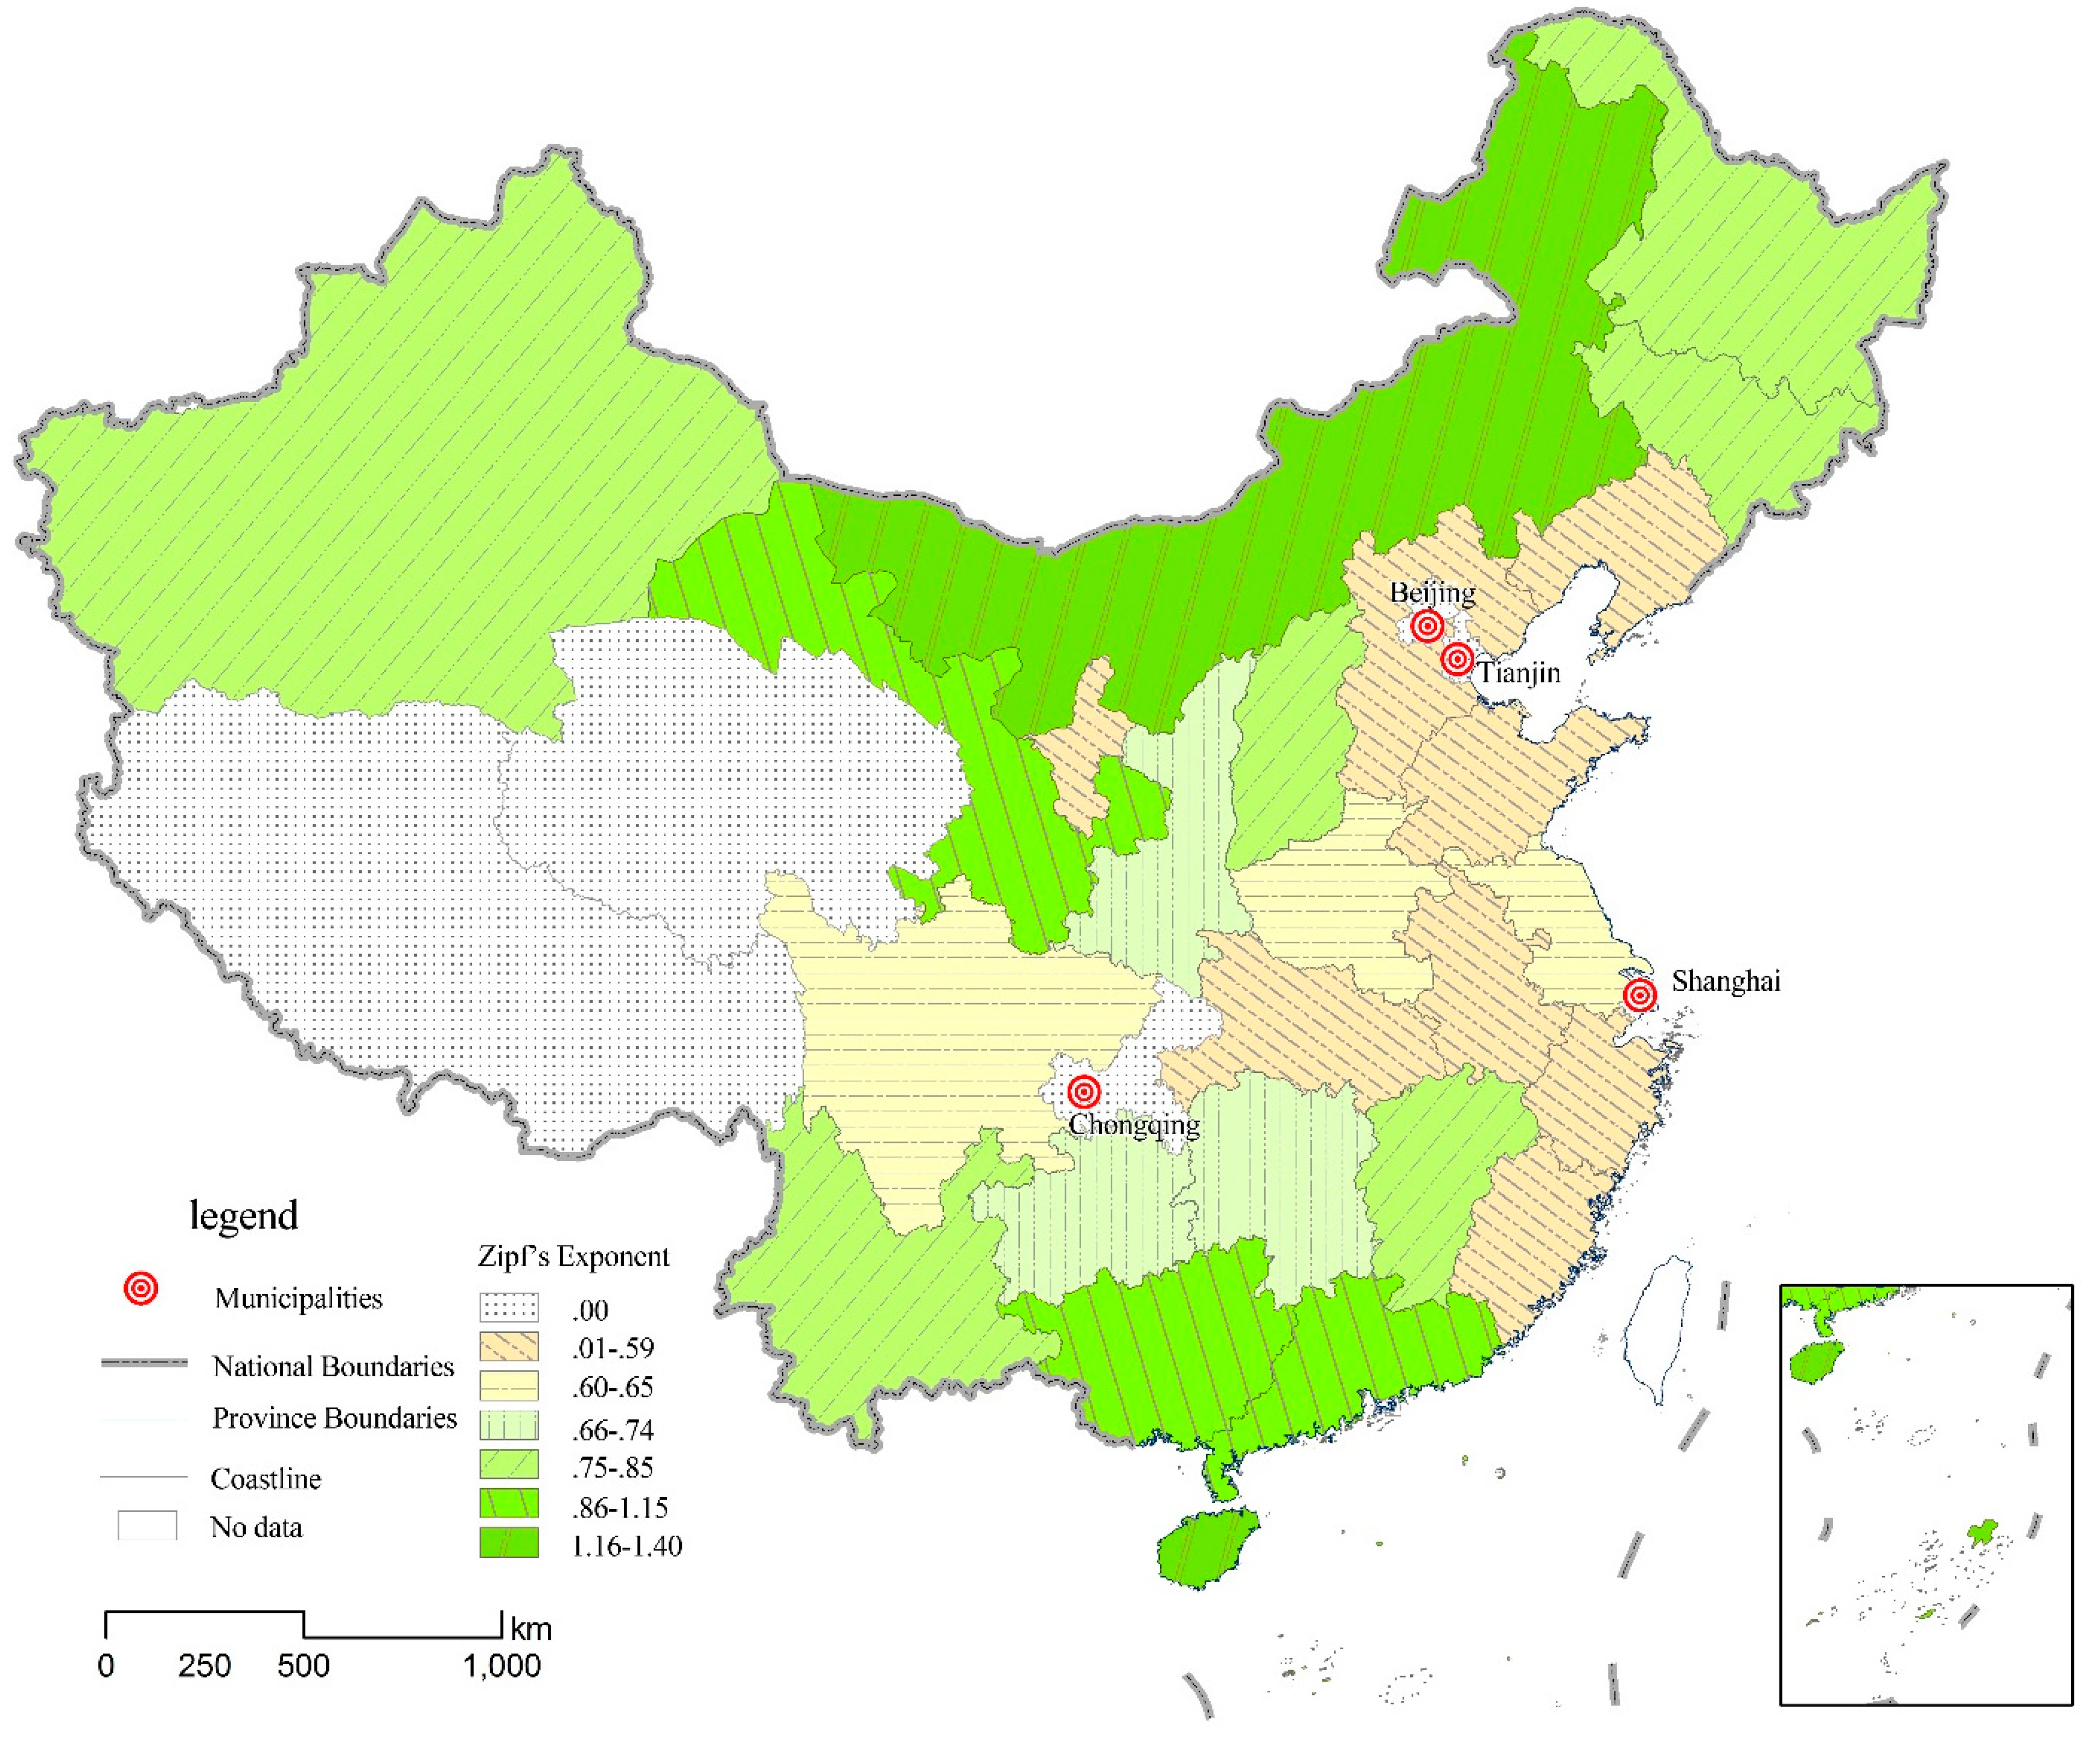
3.2.1. Diagnostic Model for Urban Scale Structure Rationality Based on Zipf’s Exponent

Zipf’s exponent model is used to reflect the scale of cities and their relationship with the entire system in terms of rank, and it can be a powerful scientific quantitative criterion for optimizing the scale of the urban system [32]. It can be used to assess the distribution of a system of cities within a country or region [24,26]. Based on Zipf’s exponent model, an urban scale structure rationality index (USR) diagnosis model consists of a regional urban system scale structure rationality index Qi and a regional urban scale efficiency rationality index Fij. The formula for this is as follows:
U S R = α 1 Q i + α 2 F i j
Q i = | q 1 | = | ( ln P 1 ln P i ) / ln R i 1 |     R = 1 , 2 , L , n
F i j = L S i P S i
In Formula (2), α1 is the weight coefficient of the urban system scale structure rationality index and α2 is the weight coefficient of the urban scale efficiency rationality index. Using the analytic hierarchy process, their values were calculated as α1 = 0.35 and α2 = 0.65. α1Qi is the membership function value relative to Zipf’s exponent for j region (or province), α1Fij represents the membership function value of i city, j region (or province) and m represents the number of specific indicators in the index system. The min-max normalization method was used to perform normalization calculations on the two sets of data, and the urban scale structure rationality diagnostic index (USR) was then calculated for each of China’s 657 cities. On the basis of this, they were divided into highly rational cities, relatively highly rational cities, moderately rational cities, relatively irrational cities and irrational cities. According to diagnostic criteria of the urban system scale structure rationality index Qi and urban scale efficiency rationality index Fij, the proposed urban scale structure rationality index USR diagnostic criteria were: USR > 0.64 is a highly rational city; 0.55 < USR < 0.63 is a relatively highly rational city; 0.47 < USR < 0.54 is a moderately rational city; 0.37 < USR < 0.46 is a relatively irrational city; and USR < 0.36 is an irrational city.
In Formula (3), the Qi urban system scale structure rationality index is calculated according to Zipf’s exponent model. In this study, Zipf’s exponent q = (lnP1 − lnPi)/lnRi was calculated after deriving the natural logarithm from Zipf’s exponent model Pi = Pi × Ri−q (R = 1, 2, ··, n), before the urban scale system rationality index Qi was obtained. n is the number of cities, Ri represents the rank of city i, Pi is the city size of Ri after they have been sorted according to descending order of size, and P1 is the size of the first city. When q = 1, the ratio between the first city in the region and the smallest city is exactly the same as the total number of cities in the urban system. At this point, the urban system is considered to be in a natural state of optimal distribution. When q > 1, the first city in the region has a strong monopoly and the urban scale system tends to be dispersed. When q < 1, urban scale distribution tends to be concentrated, population is relatively balanced and there is a relatively high number of middle ranking cities. When q = 1 in Zipf’s exponent, the urban system is considered to be in a natural state of optimal distribution, and the closer q is to the absolute value of 1, the more rational the urban scale structure will be. Qi < 0.1 denotes a highly rational city; 0.1 < Qi < 0.3 is a relatively highly rational city; 0.3 < Qi < 0.5 is a moderately rational city; 0.5 < Qi < 0.8 is a relatively irrational city; and 0.8 < Qi < 1 is an irrational city.
In Formula (4), Fij is the urban scale efficiency rationality index. It is the ratio between the population of an urban built-up area and the amount of land used. According to Urban Land Use Classifications and Standards for Land Use Planning and Construction (Bulletin No.88 of the Ministry of Housing and Urban-Rural Development of the People’s Republic of China), urban scale efficiency is the main indicator for measuring the rationality of land use in urban built-up areas. Criterion for construction land per capita nationwide (L) should be consulted, where 80.0 m²/person, 100 m²/person, 120 m²/person and 150 m²/person are cut-off values for land use rationality of urban built-up areas. The judgement standards for urban scale efficiency index Fij are as follows: when Fij > 12,500 people/km², the diagnosis is a highly rational city; 10,000 < Fij < 12,500 people/km² is a relatively highly rational city; 8300 < Fij < 10,000 people/km² is a moderately rational city; 6700 < Fij < 8300 people/km² is a relatively irrational city; and Fij < 6700 people/km² is an irrational city.

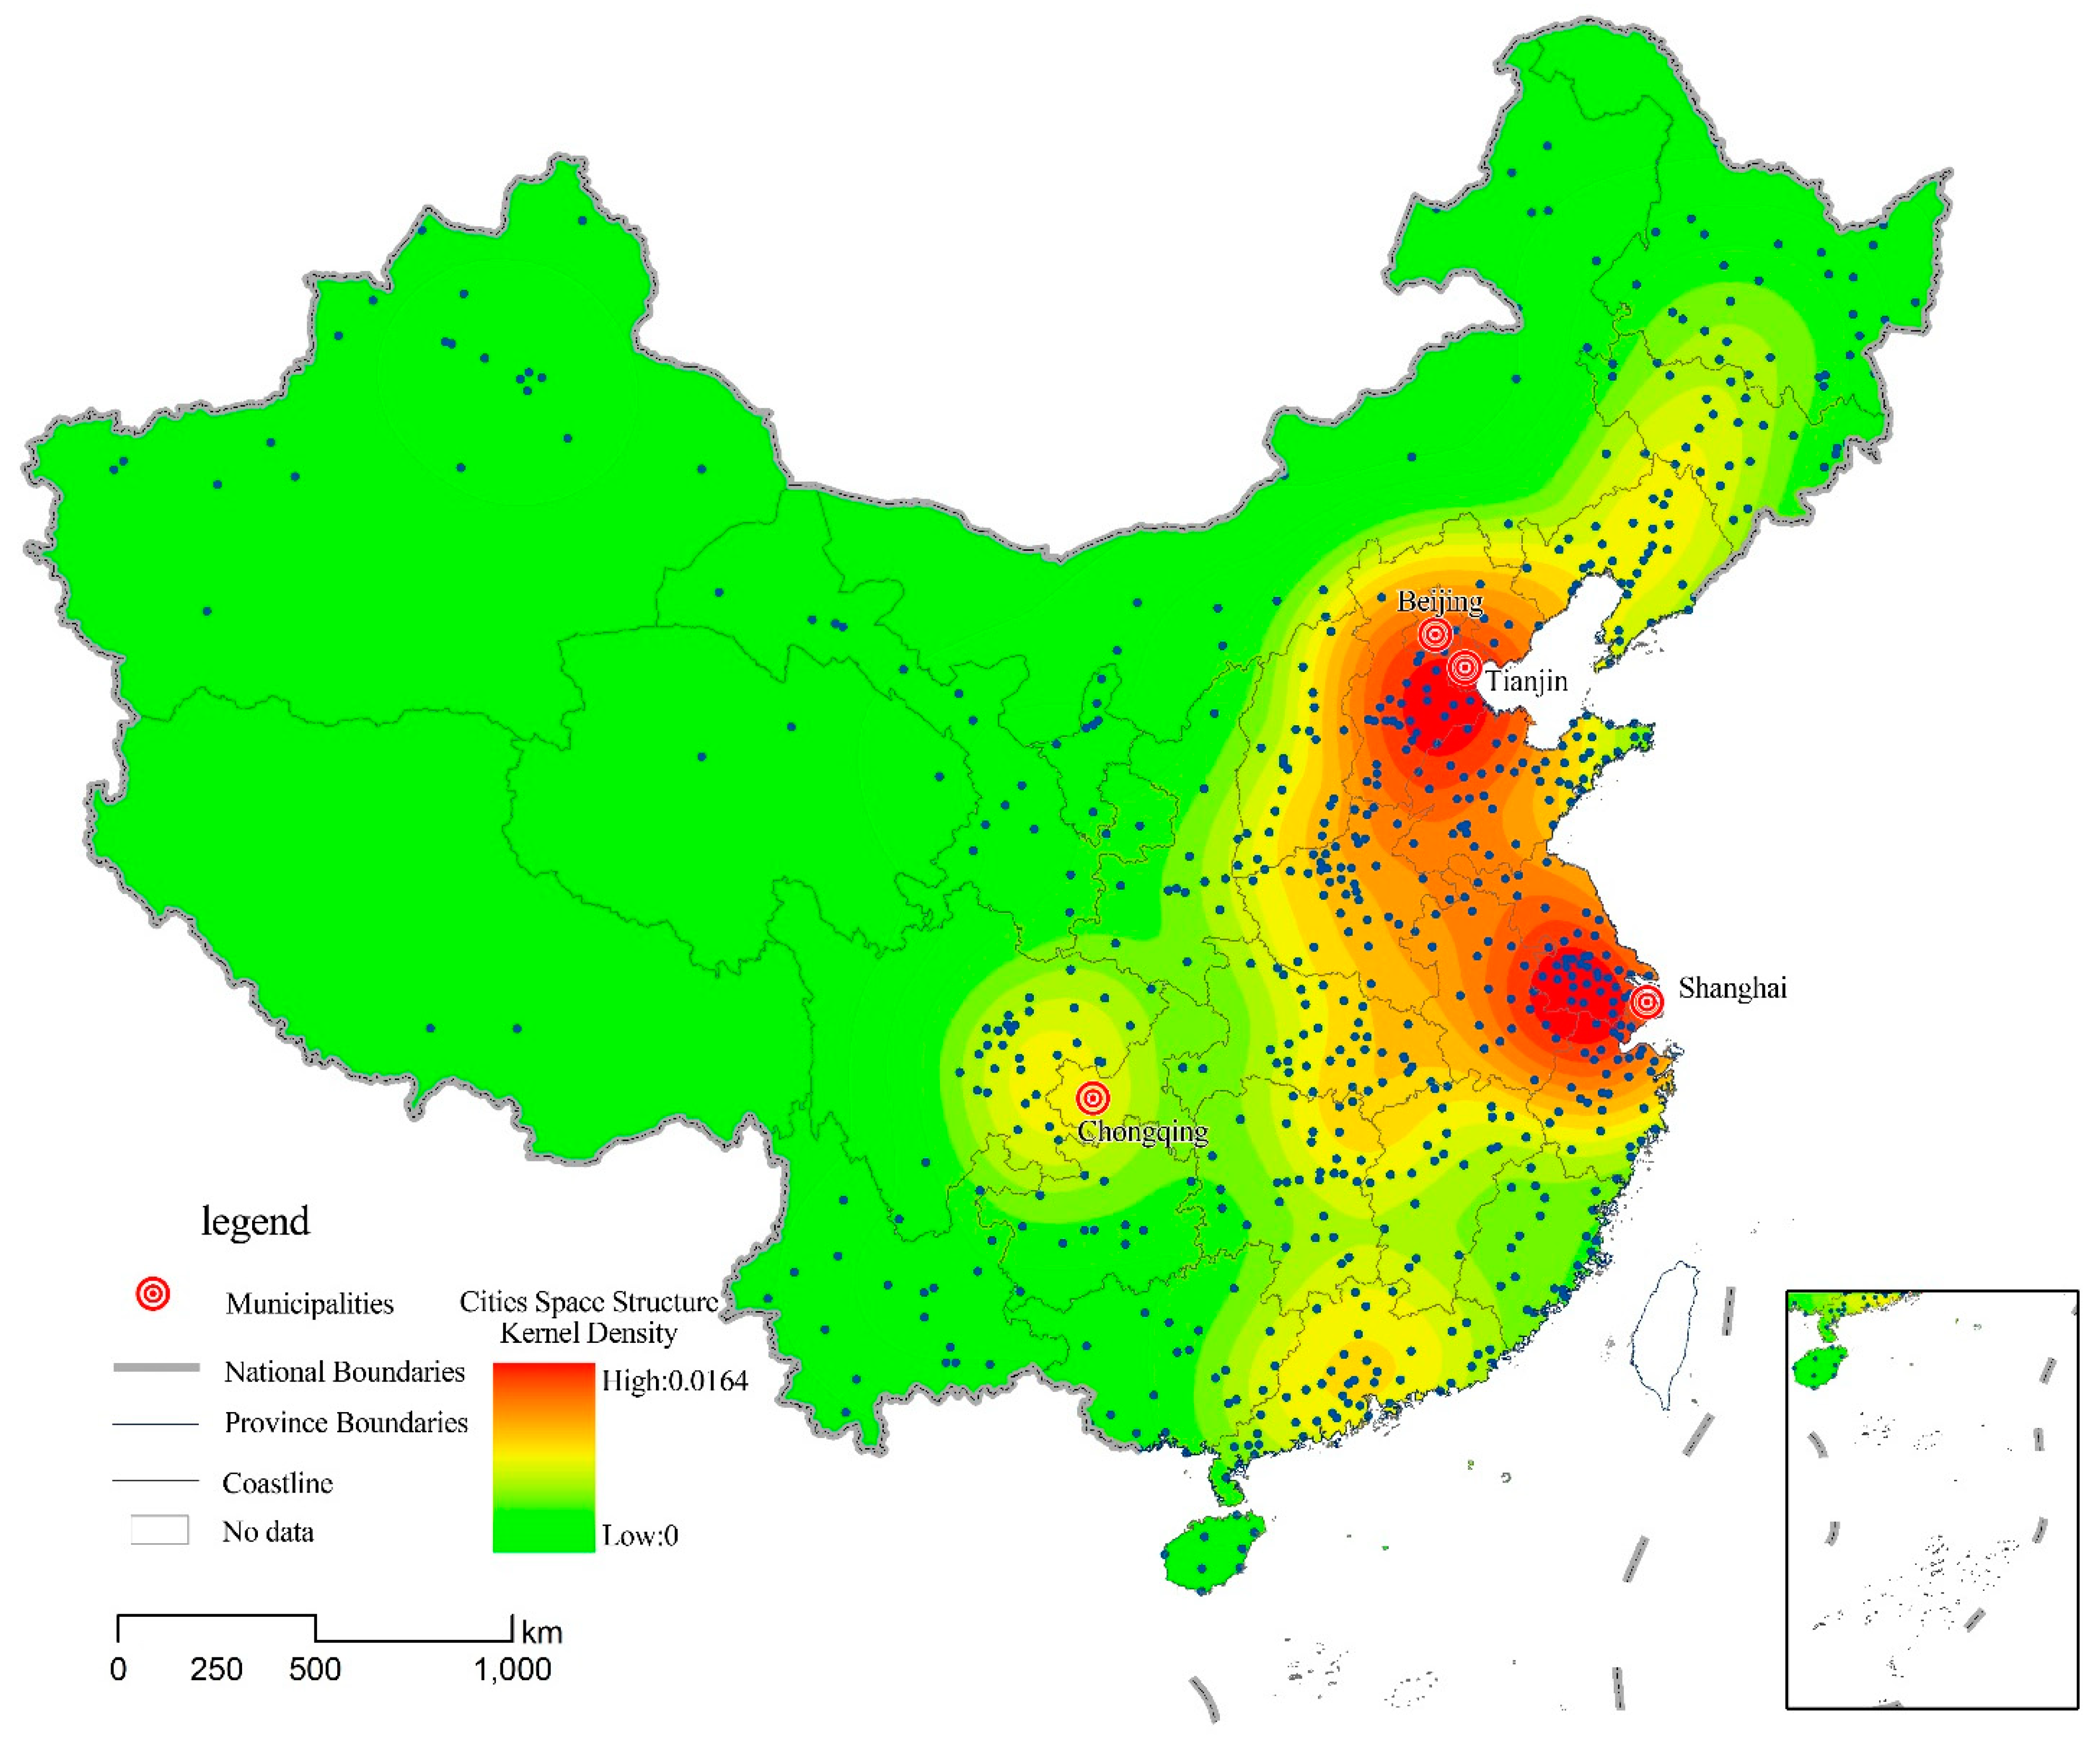
3.2.2. Diagnostic Model for Urban Spatial Structure Rationality Based on KDE

KDE is a method for reconstructing the probability density function from some random sampling points, and taking the total number of variables within a known area as the premise, one can ideally simulate the detailed distribution form of variables [33]. The calculation process is as follows: first, the country is divided into a grid with a certain resolving power, with the degree of accuracy of the grid chosen to be 1000m; second, the total data within the city area is converted into respective density values; third, a central city is set for each region, and variable density data is linked to it; fourth, the KDE model is used to interpolate the variable density data onto the surface of the grid. The KDE model is used as the basis for constructing an urban spatial structure rationality UKR diagnostic model. The formula for this is as follows:
U K R ( x ) = 1 n i = 1 n K h ( x x i ) = 1 n h i = 1 n K ( x x i h )
In Formula (5), K () is the kernel density formula; h is the scaled kernel, namely the search radius of the kernel density function; x is the central city of a region; xi is the variable point within the scope of the scaled kernel; and n is the number of variables within the scope of the scaled kernel. This paper takes the population value of each city as the property of the variable points of cities for the calculation and uses the Gaussian kernel as the distance between each city and the central city for weighted smoothing. Cities in close proximity are heavily weighted. Based on related research results [34], the average radius of influence for cities was set as 50km to obtain a map showing kernel density distribution of Chinese cities.

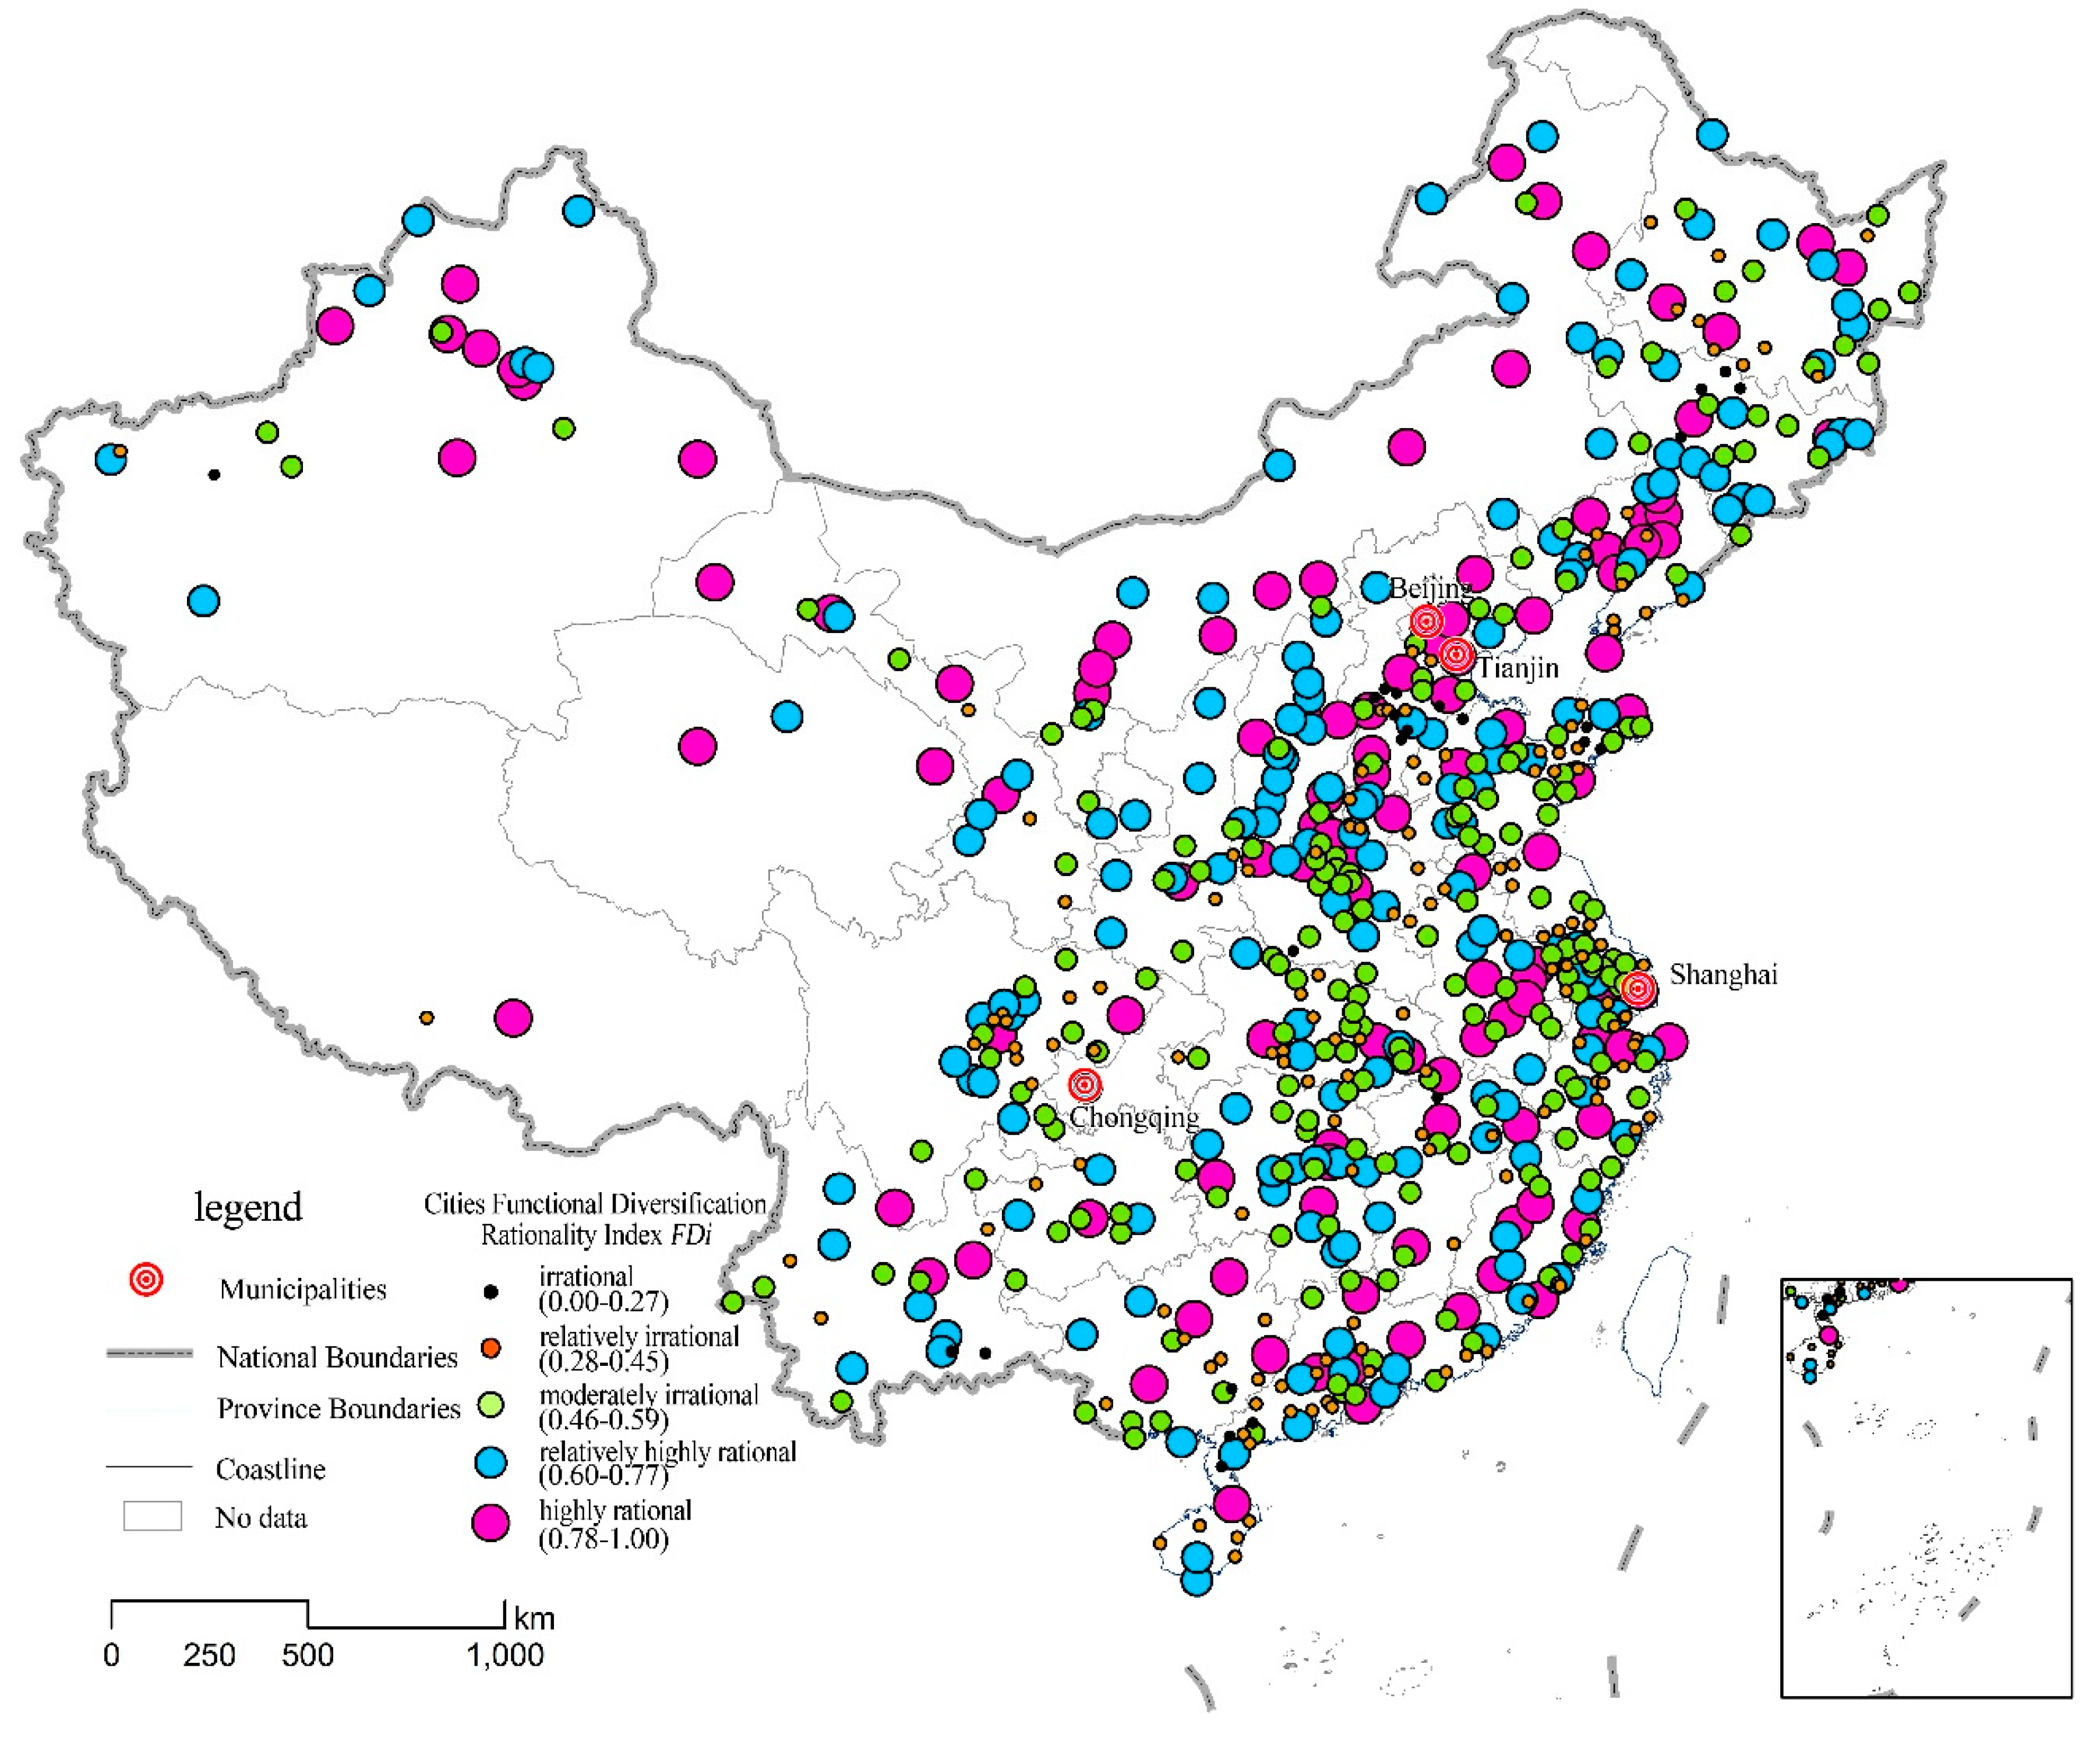
3.2.3. Diagnostic Model for Urban Functional Structure Rationality Based on the Shannon-Weiner Index

The urban functional structure rationality UFR diagnostic model is reflected by the urban functional scale rationality clustering model FGi, functional intensity index model FRi and functional diversification diagnostic model FDi. The formula for which is as follows:
U F R = β 1 F G i + β 2 F R i + β 3 F D i
F R i = 1 2 j = 1 n ( | S i j S j | j = 1 n E i j ) j = 1 n E i j = 1 2 j = 1 n ( | S i j S j | )
F D i = log N i = 1 s ( S i j × log S i j )
In Formula (6), β1, β2 and β3 represent the weight coefficients of the urban functional scale rationality clustering model FGi, functional intensity index model FRi and functional diversification diagnostic model FDi. Using the AHP method with the support of entropy technology, the following was calculated: β1 = 0.3333, β2 = 0.5000 and β3 = 0.1667. The fuzzy membership function model was used to calculate the FGi, FRi and FDi fuzzy membership function values for each city. The weight smoothing method was then used to calculate the urban functional structure rationality index. According to the results, in accordance with the natural breaking point classification criteria, the diagnostic criteria for the UFR index are as follows: when UFR > 0.55, it denotes a highly rational city; 0.44 < UFR < 0.54 is a relatively highly rational city; 0.34 < UFR < 0.43 is a moderately rational city; 0.26 < UFR < 0.33 is a relatively irrational city; and UFR < 0.26 is an irrational city.
In Formula (6), FGi represents the urban functional scale rationality index. In accordance with the Natural Breaks model, the variance of various types of cells is calculated to find the breaking point between the different types of cells and scientifically achieve the spatial clustering of cells. This paper uses this to evaluate the rational clustering of urban functional scale.
In Formula (7), Eij represents employed people in i city and j industry, Sij is the share of employed people in i city and j industry in terms of the total number of employed people, Sj represents the share of people employed in industry j nationwide in terms of the total number of employed people, and the urban functional intensity index FRi represents the degree of specialization and development potential of a certain urban industry sector. If the degree of specialization of a sector is high, the proportion of product output is also high and functional intensity is high. Urban functional specialization index FRi takes dislocation development between cities as a precondition and shows the degree of specialization of urban function for i region. It reflects the relative size of the city’s trade with other cities. The higher the specialization index of a city, the higher its degree of specialization and the higher its functional intensity will be. The closer the specialization index is to 1, the lower the specialization index will be.
In Formula (8), FDi is the functional diversity index; N is the number of industries in a city; and the functional diversification index is calculated using the Shannon-Wiener index, which borrows from ecosystem diversity assessment models [35]. The more industrial sectors a city has, the more complicated the industrial structure and the greater resistance stability will be.

4. Results

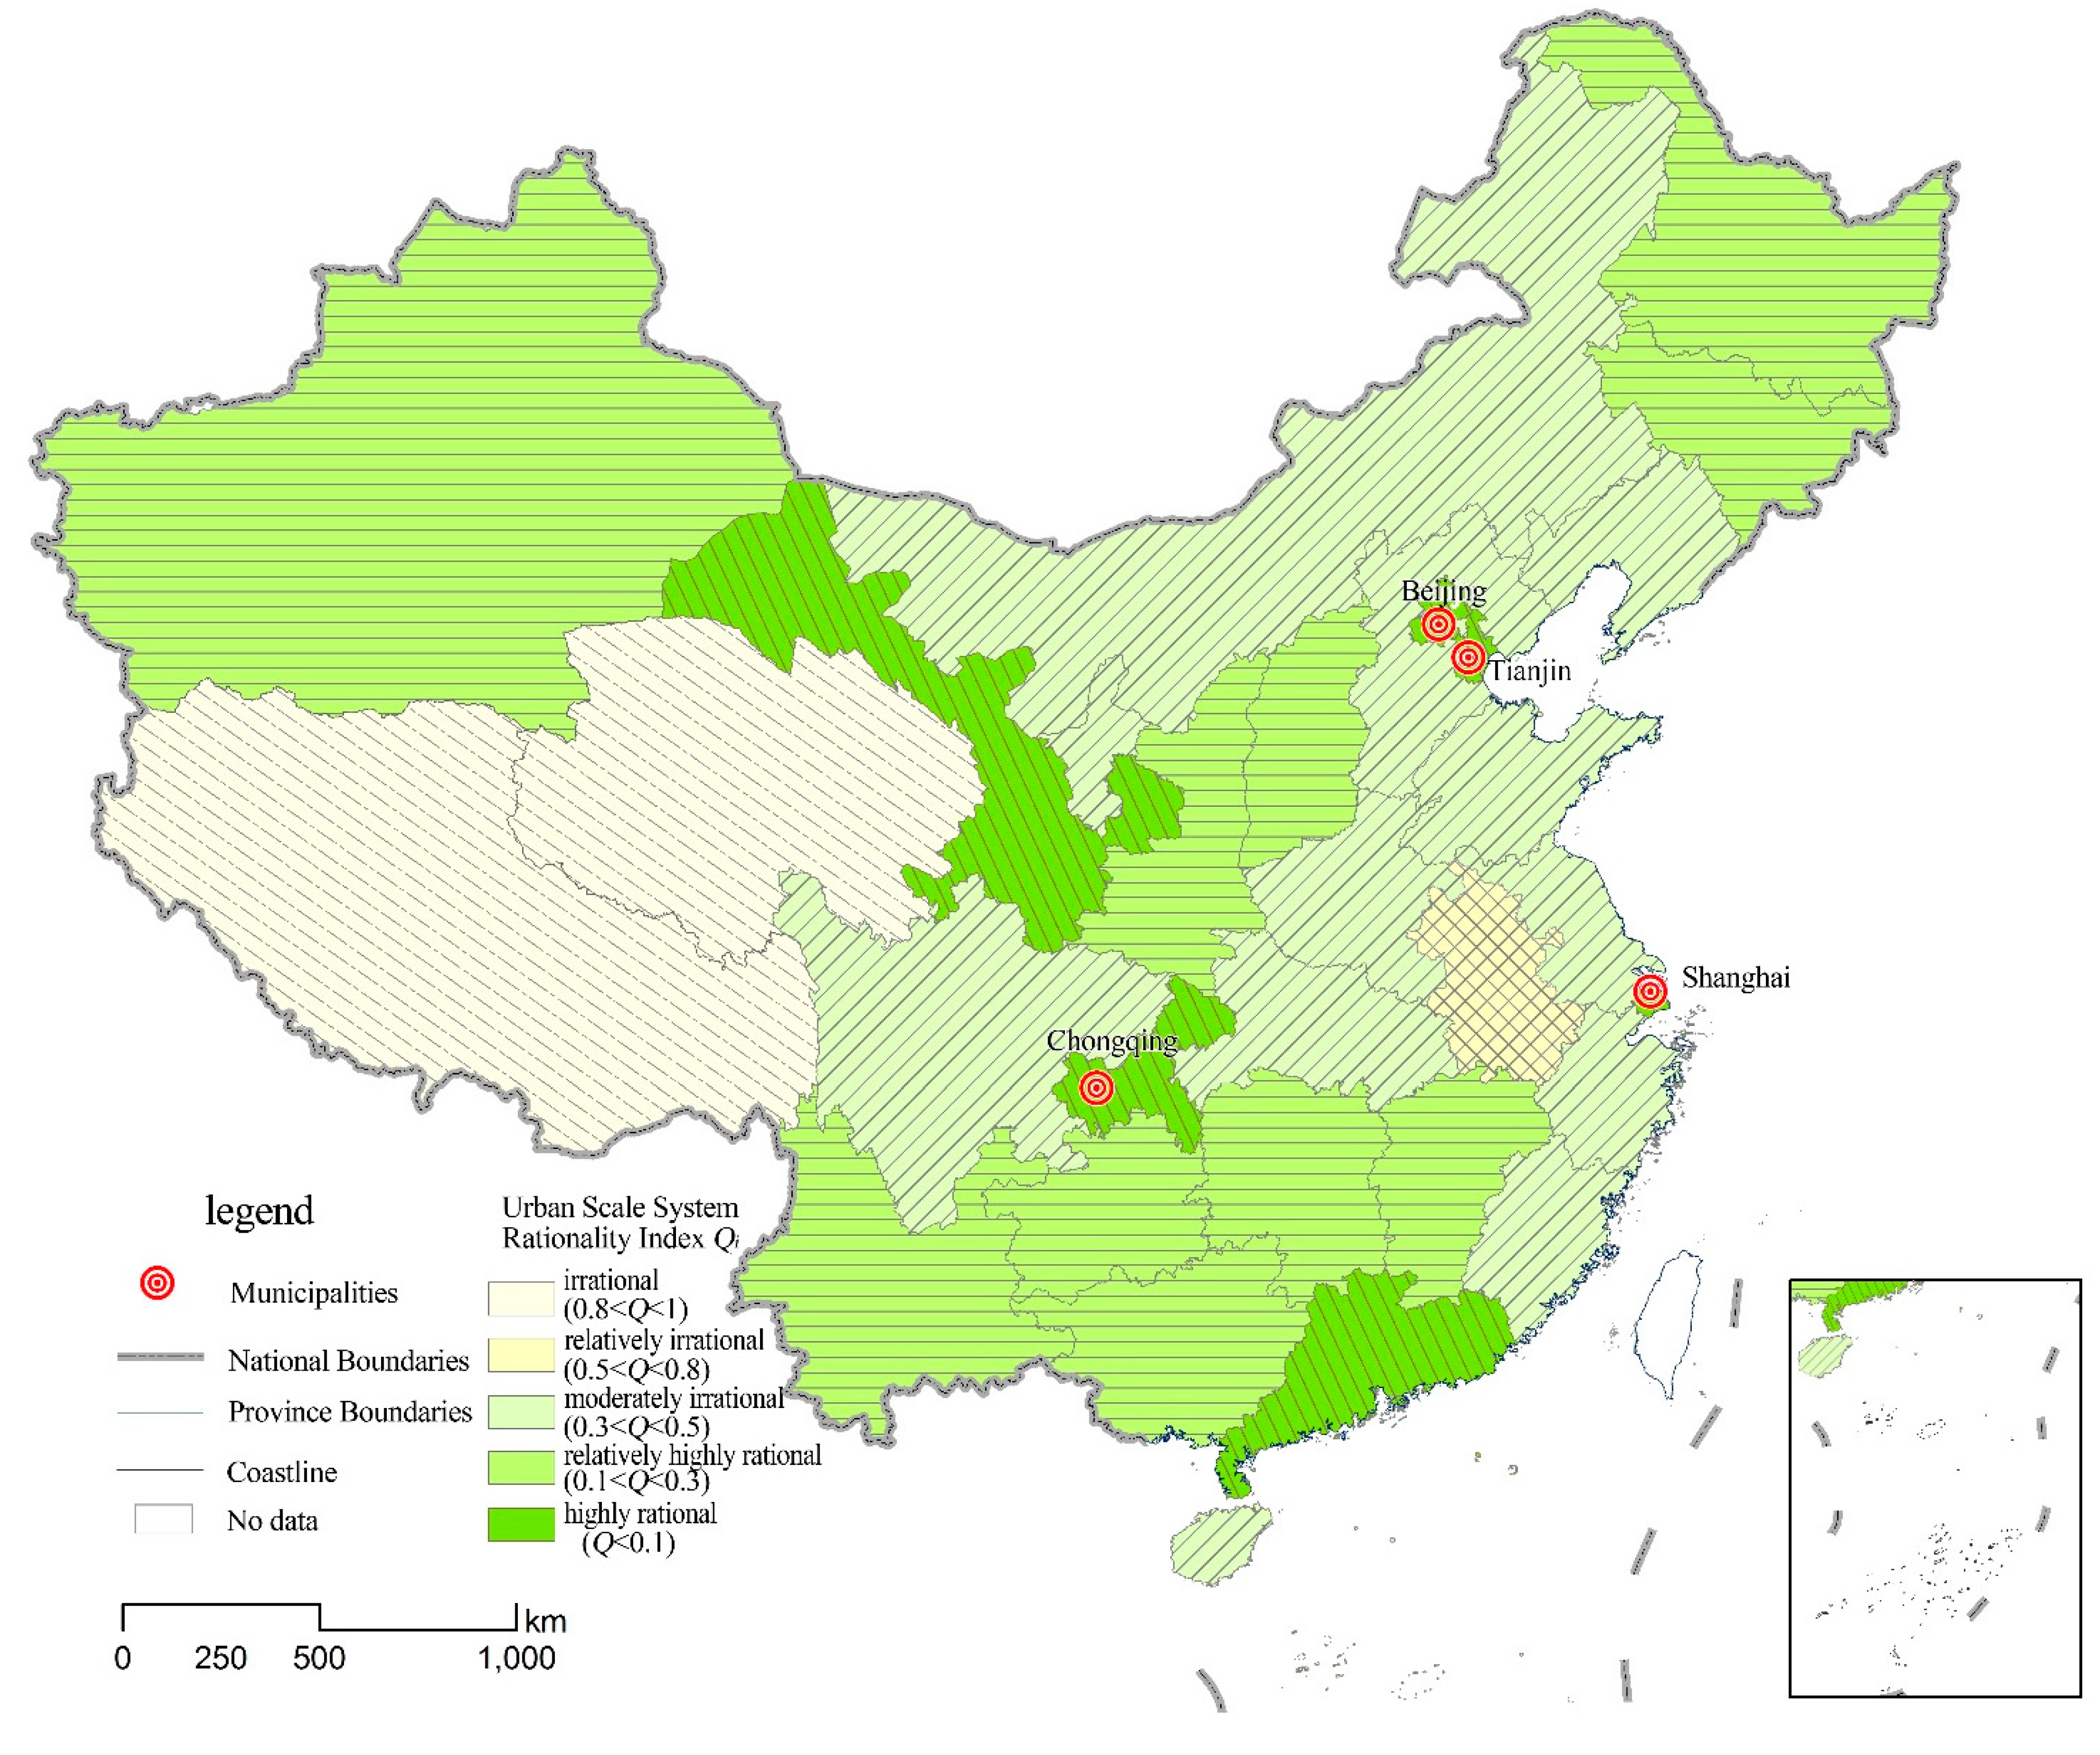
4.1. Rationality Diagnosis of Chinese Urban Scale Structure

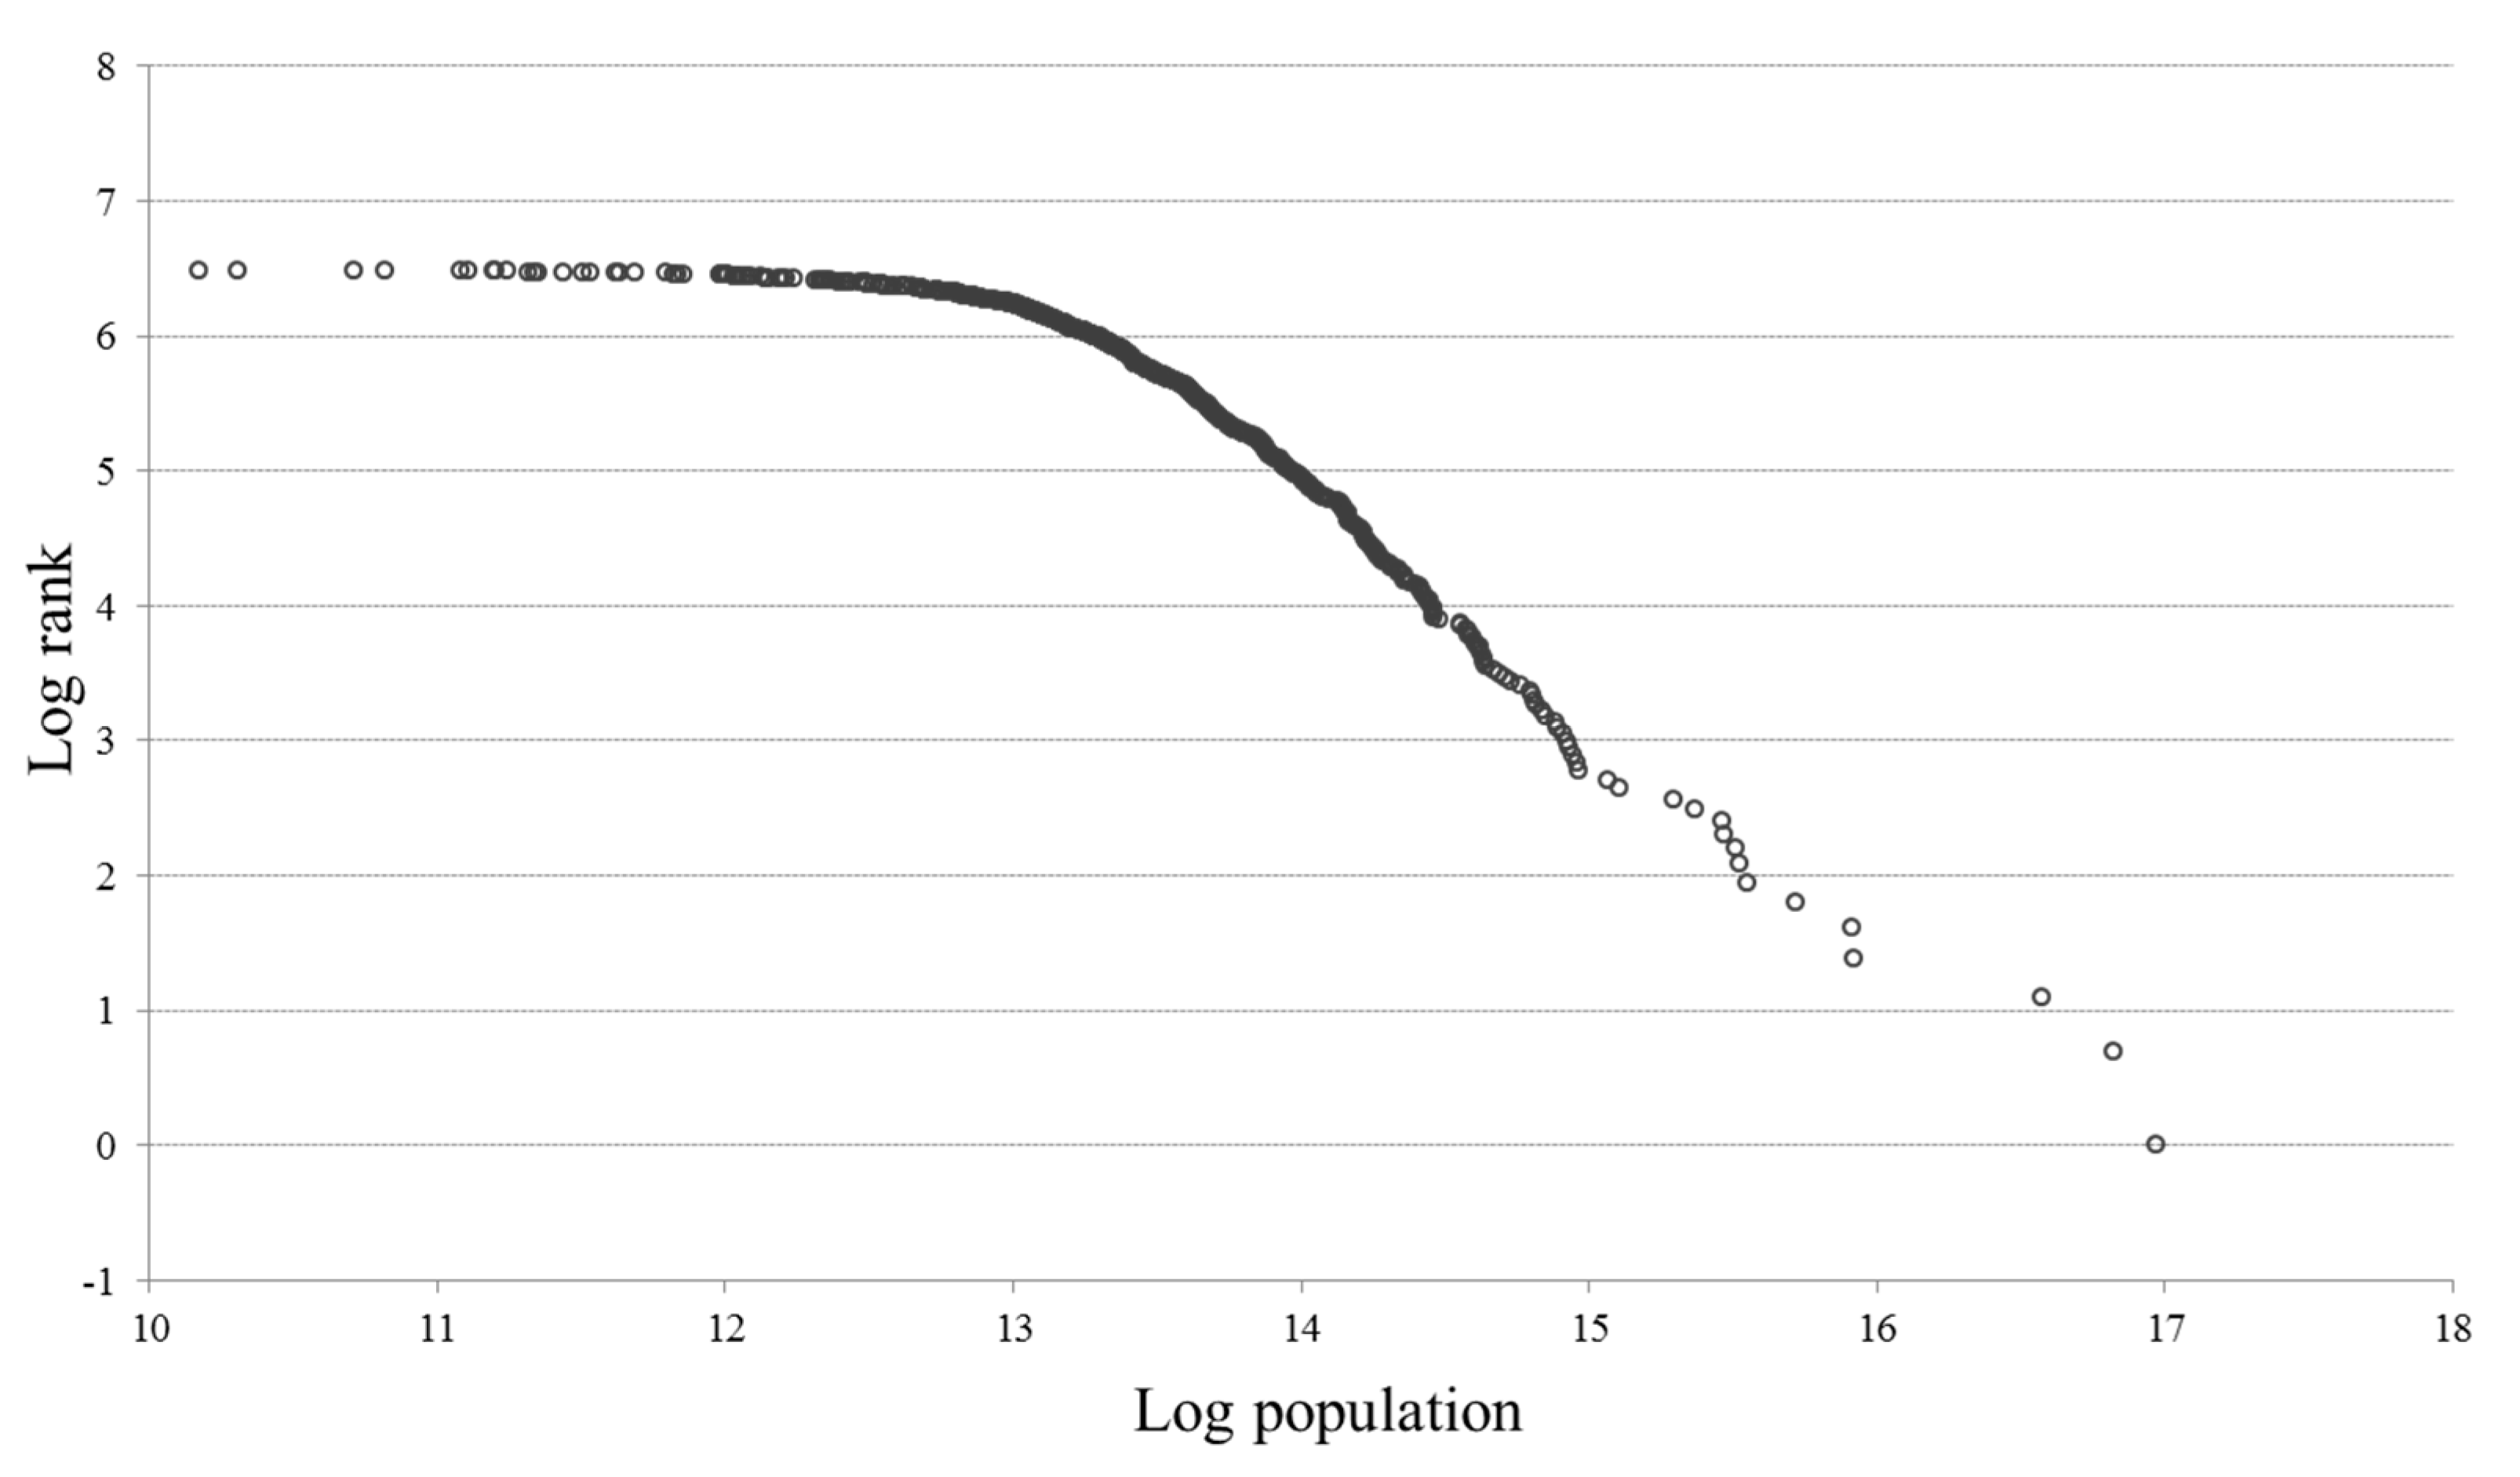
4.1.1. Fractal and Rationality Analysis of the Urban System Scale Structure

The fractal dimension value of national, eastern, central and western city size distribution was estimated using Zipf’s index, making a double logarithmic graph (ln Pi, ln Ri),where ln Pi is the vertical axis and is the horizontal axis, and using the OLS method for a regression simulation. The results are shown in Formulas (9)–(12) below:
Nationwide:
ln P i = ln P 1 0.6438 ln R i , R2=0.9895, T= 248.43,
Eastern region:
ln P i = ln P 1 0.7111 ln R i , R2=0.9928, T= 196.32
Central region:
ln P i = ln P 1 0.5718 ln R i , R2=0.9770, T= 101.91
Western region:
ln P i = ln P 1 0.8799 ln R i , R2=0.9918, T= 123.32
In the formulas above, the coefficient of determination (R2) is equal to or greater than 0.97, and the value of T is equal to or greater than 100, so calculation results pass testing by 1%, which indicates that the fitted values and actual values of regression formulas conform relatively well and the reliability of curve fitting is high. This reflects the fact that the size distribution of Chinese cities has significant fractal characteristics and fractal dimension values are reliable (see Figure 1).
Figure 1. Rank-Size Distribution of Chinese Cities in 2010.
Sustainability 07 03859 g001
The calculations show that in Zipf’s index for Chinese city size in 2010, q = 0.6438. Given that q is less than 1 but approaching 1, city size distribution is fairly concentrated, population distribution is relatively balanced, there are a relatively large number of mid-ranking cities and the scale structure for the whole urban system is relatively rational. This is the standard Zipf distribution and it is the natural urban rank-size rule. The urban scale structure has a relatively rational pyramidal pattern with “a slightly larger middle and small bottom end”. Of China’s 657 cities in 2010, there were three (0.46% of China’s cities) megacities with resident populations greater than 10 million people, nine (1.37%) very large cities with resident populations of 5–10 million, 182 (27.7%) large cities with resident populations of 1–5 million, 275 (41.86%) cities with resident populations of 500,000–1 million and 188 (28.61%) cities with resident populations of 100,000–500,000. Looking at three major regions, for the western region q = 0.8799, the eastern region q = 0.7111 and central region q = 0.5718.
This indicates that the scale hierarchical structure of cities in the western region is better than cities in the central and eastern regions, and the scale structure of cities in the eastern region have an irrational pyramidal pattern with “a slightly larger middle and smaller ends”; the scale structure of cities in the central region have an rational pyramidal pattern with “a large middle and bottom end and small top”; and the scale structure of cities in the western region have a rational pyramidal pattern with “a large bottom and small top” (see Figure 2).
Figure 2. Map Showing Zipf’s Exponent Distribution of Chinese Provincial Cities.
Sustainability 07 03859 g002
Calculations using the regional urban scale system rationality index Qi show that 90.32% of provinces nationwide have moderate or greater rationality, which means that China’s urban scale structure is rational overall. Of these, the six provinces and municipalities of Beijing, Shanghai, Tianjin, Chongqing, Guangdong and Gansu, or 19.35% of all provinces, autonomous regions and municipalities, are highly rational in terms of urban scale structure. The nine provinces and autonomous regions of Heilongjiang, Guangxi, Jiangxi, Yunnan, Shanxi, Jilin, Xinjiang, Guizhou, Shaanxi and Hunan, or 32.26%, are relatively highly rational. The 12 provinces and autonomous regions of Jiangsu, Hainan, Henan, Sichuan, Mongolia, Shandong, Fujian, Liaoning, Hubei, Zhejiang, Hebei and Ningxia, or 38.71%, are moderately rational. Anhui province, or 3.22%, is relatively irrational. Qinghai and Tibet, 6.45%, are irrational (see Figure 3).
Figure 3. Map Showing the Scale System Rationality Distribution of Chinese Provincial Cities.
Sustainability 07 03859 g003

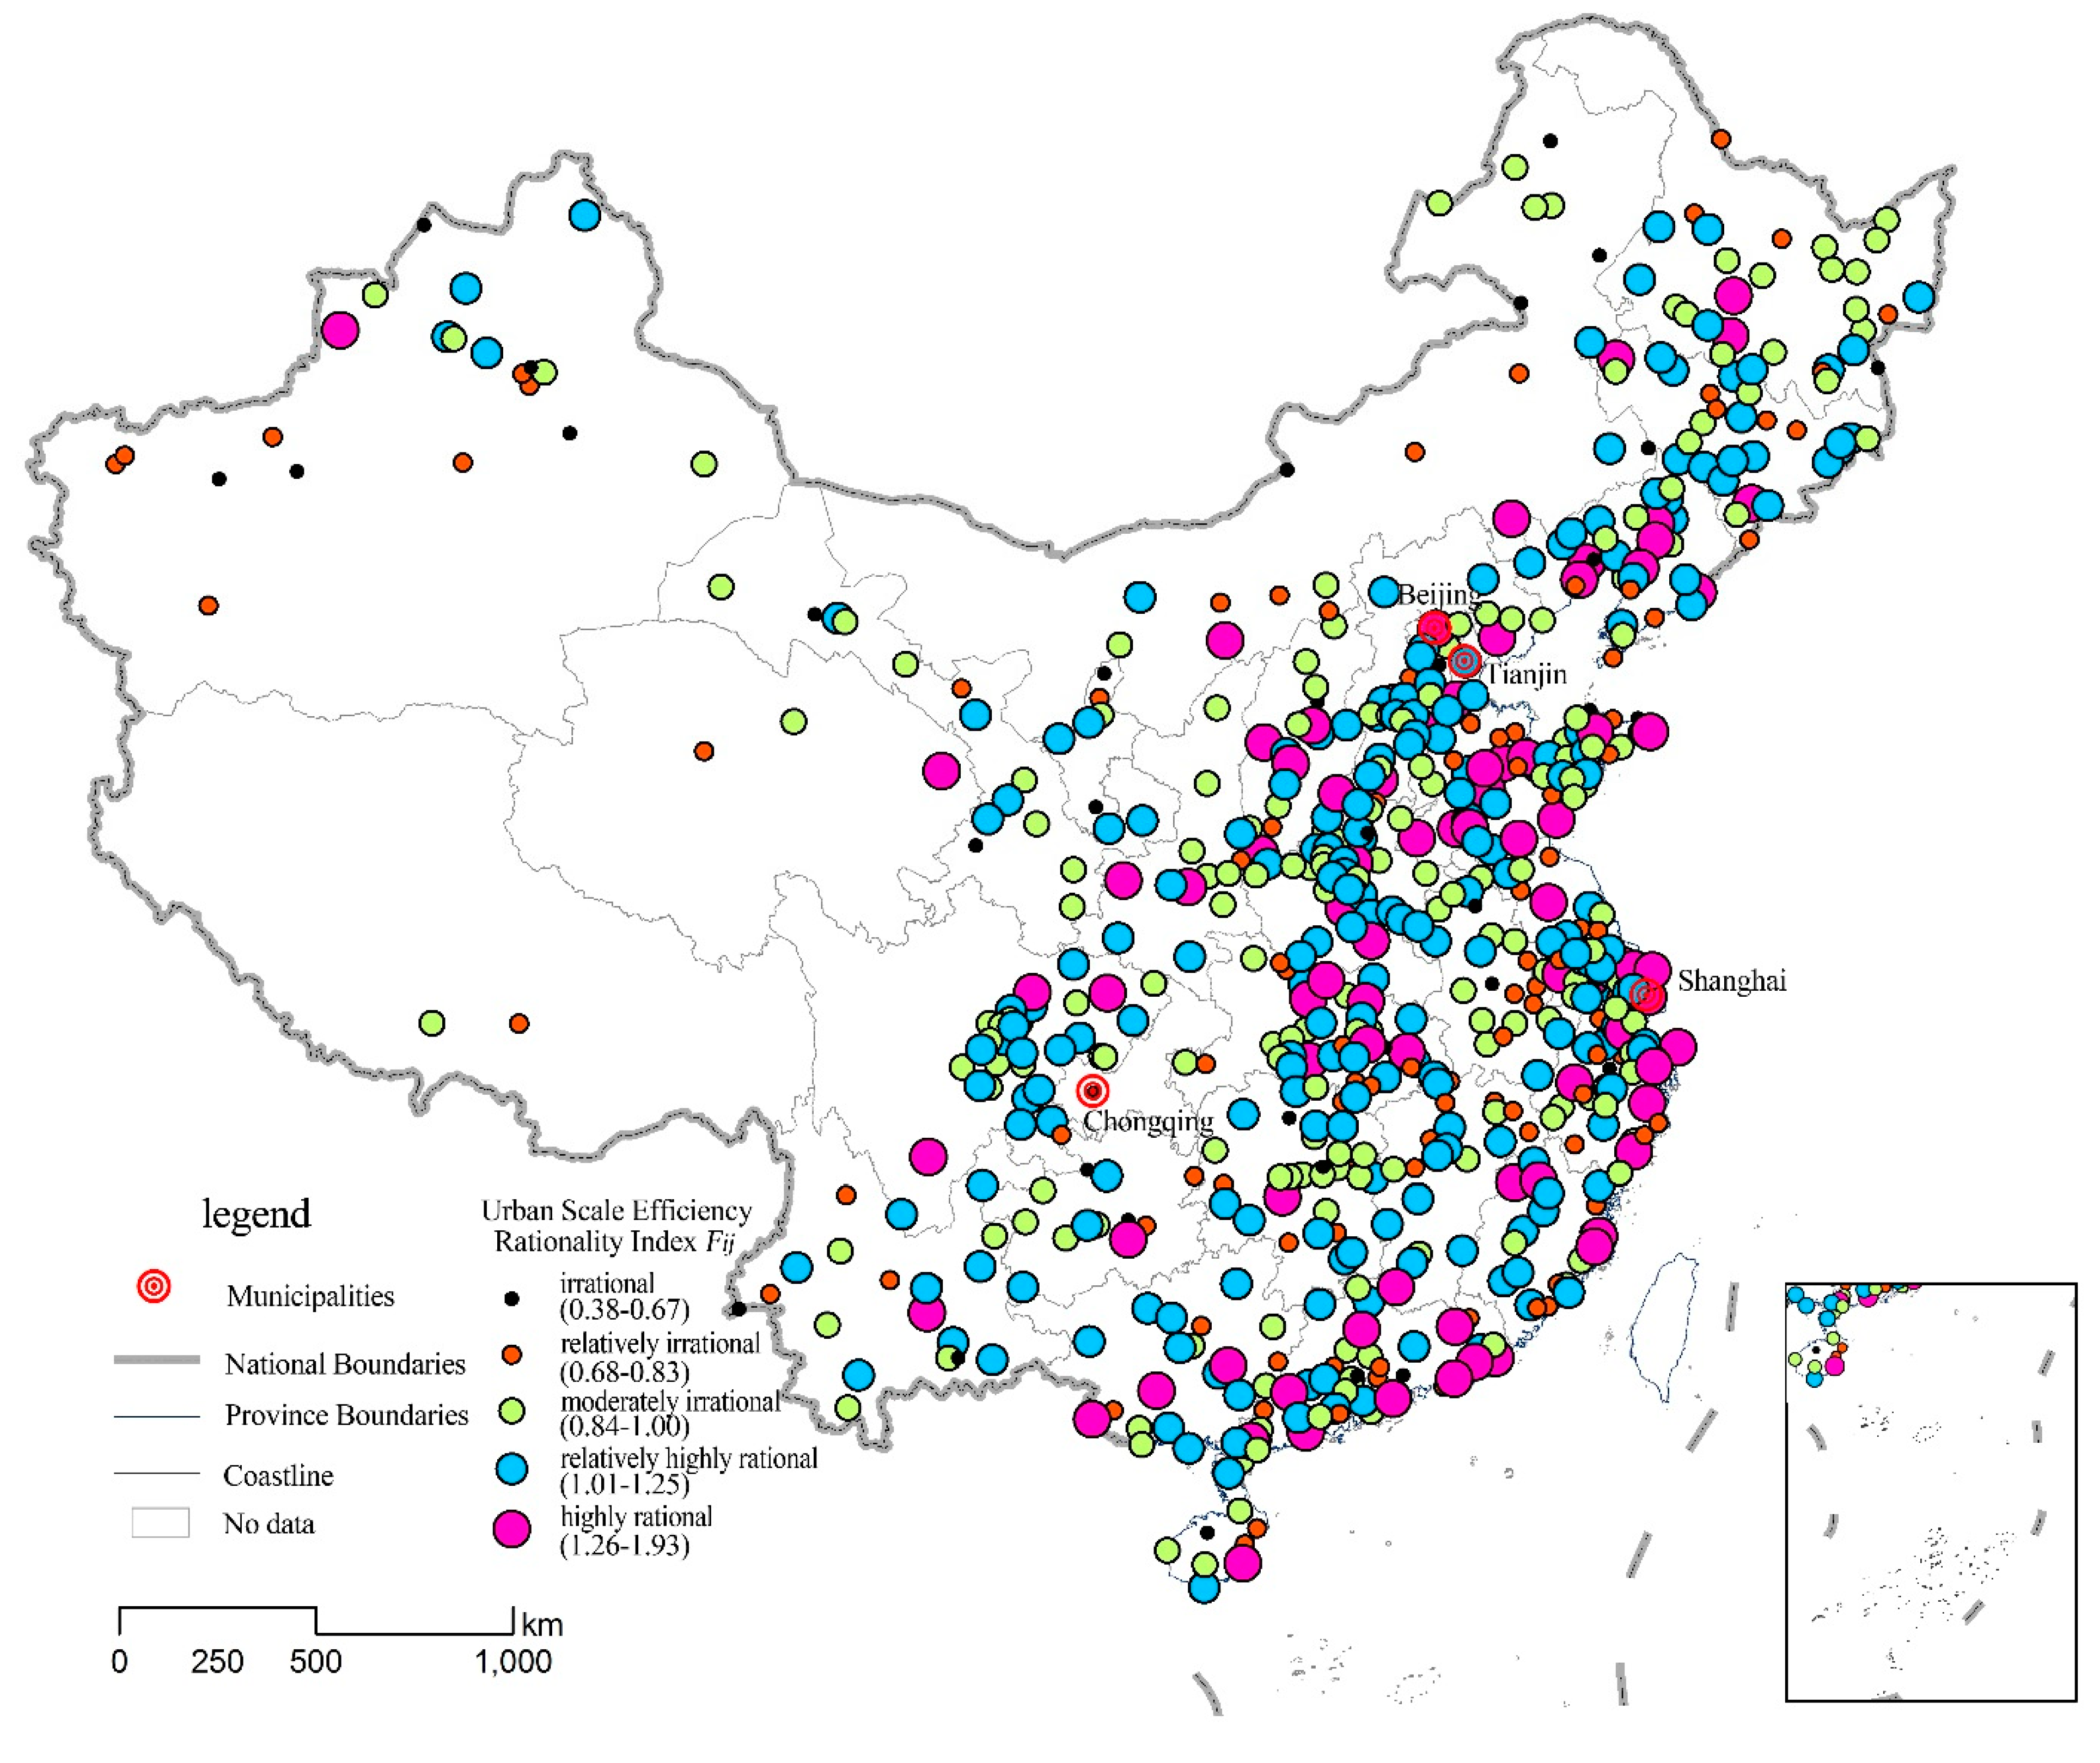
4.1.2. Rationality Analysis of Urban Scale Efficiency

Calculations using the regional urban scale efficiency rationality index Fij show that 77.7% of cities have moderate or greater urban scale efficiency (see Figure 4), which means that national urban scale efficiency is rational overall. The figures show that 13.24% of cities are highly rational and concentrated in coastal and central regions; 34.7% of cities are relatively highly rational and clearly concentrated in the Beijing-Tianjin-Hebei region, the Central Plains, the middle reaches of the Yangtze River and the Sichuan-Chongqing region; 29.22% of cities are moderately rational and concentrated in the central and northeast regions; 16.59% of cities are relatively irrational and concentrated in the Shandong Peninsula, the Yangtze River Delta, the Pearl River Delta and the Beijing-Tianjin-Hebei region; and 6.24% of cities are irrational and are located across the country, but with a clear distribution pattern along the country’s border.
Figure 4. Map Showing the Scale Efficiency Rationality Distribution of Chinese Cities.
Sustainability 07 03859 g004

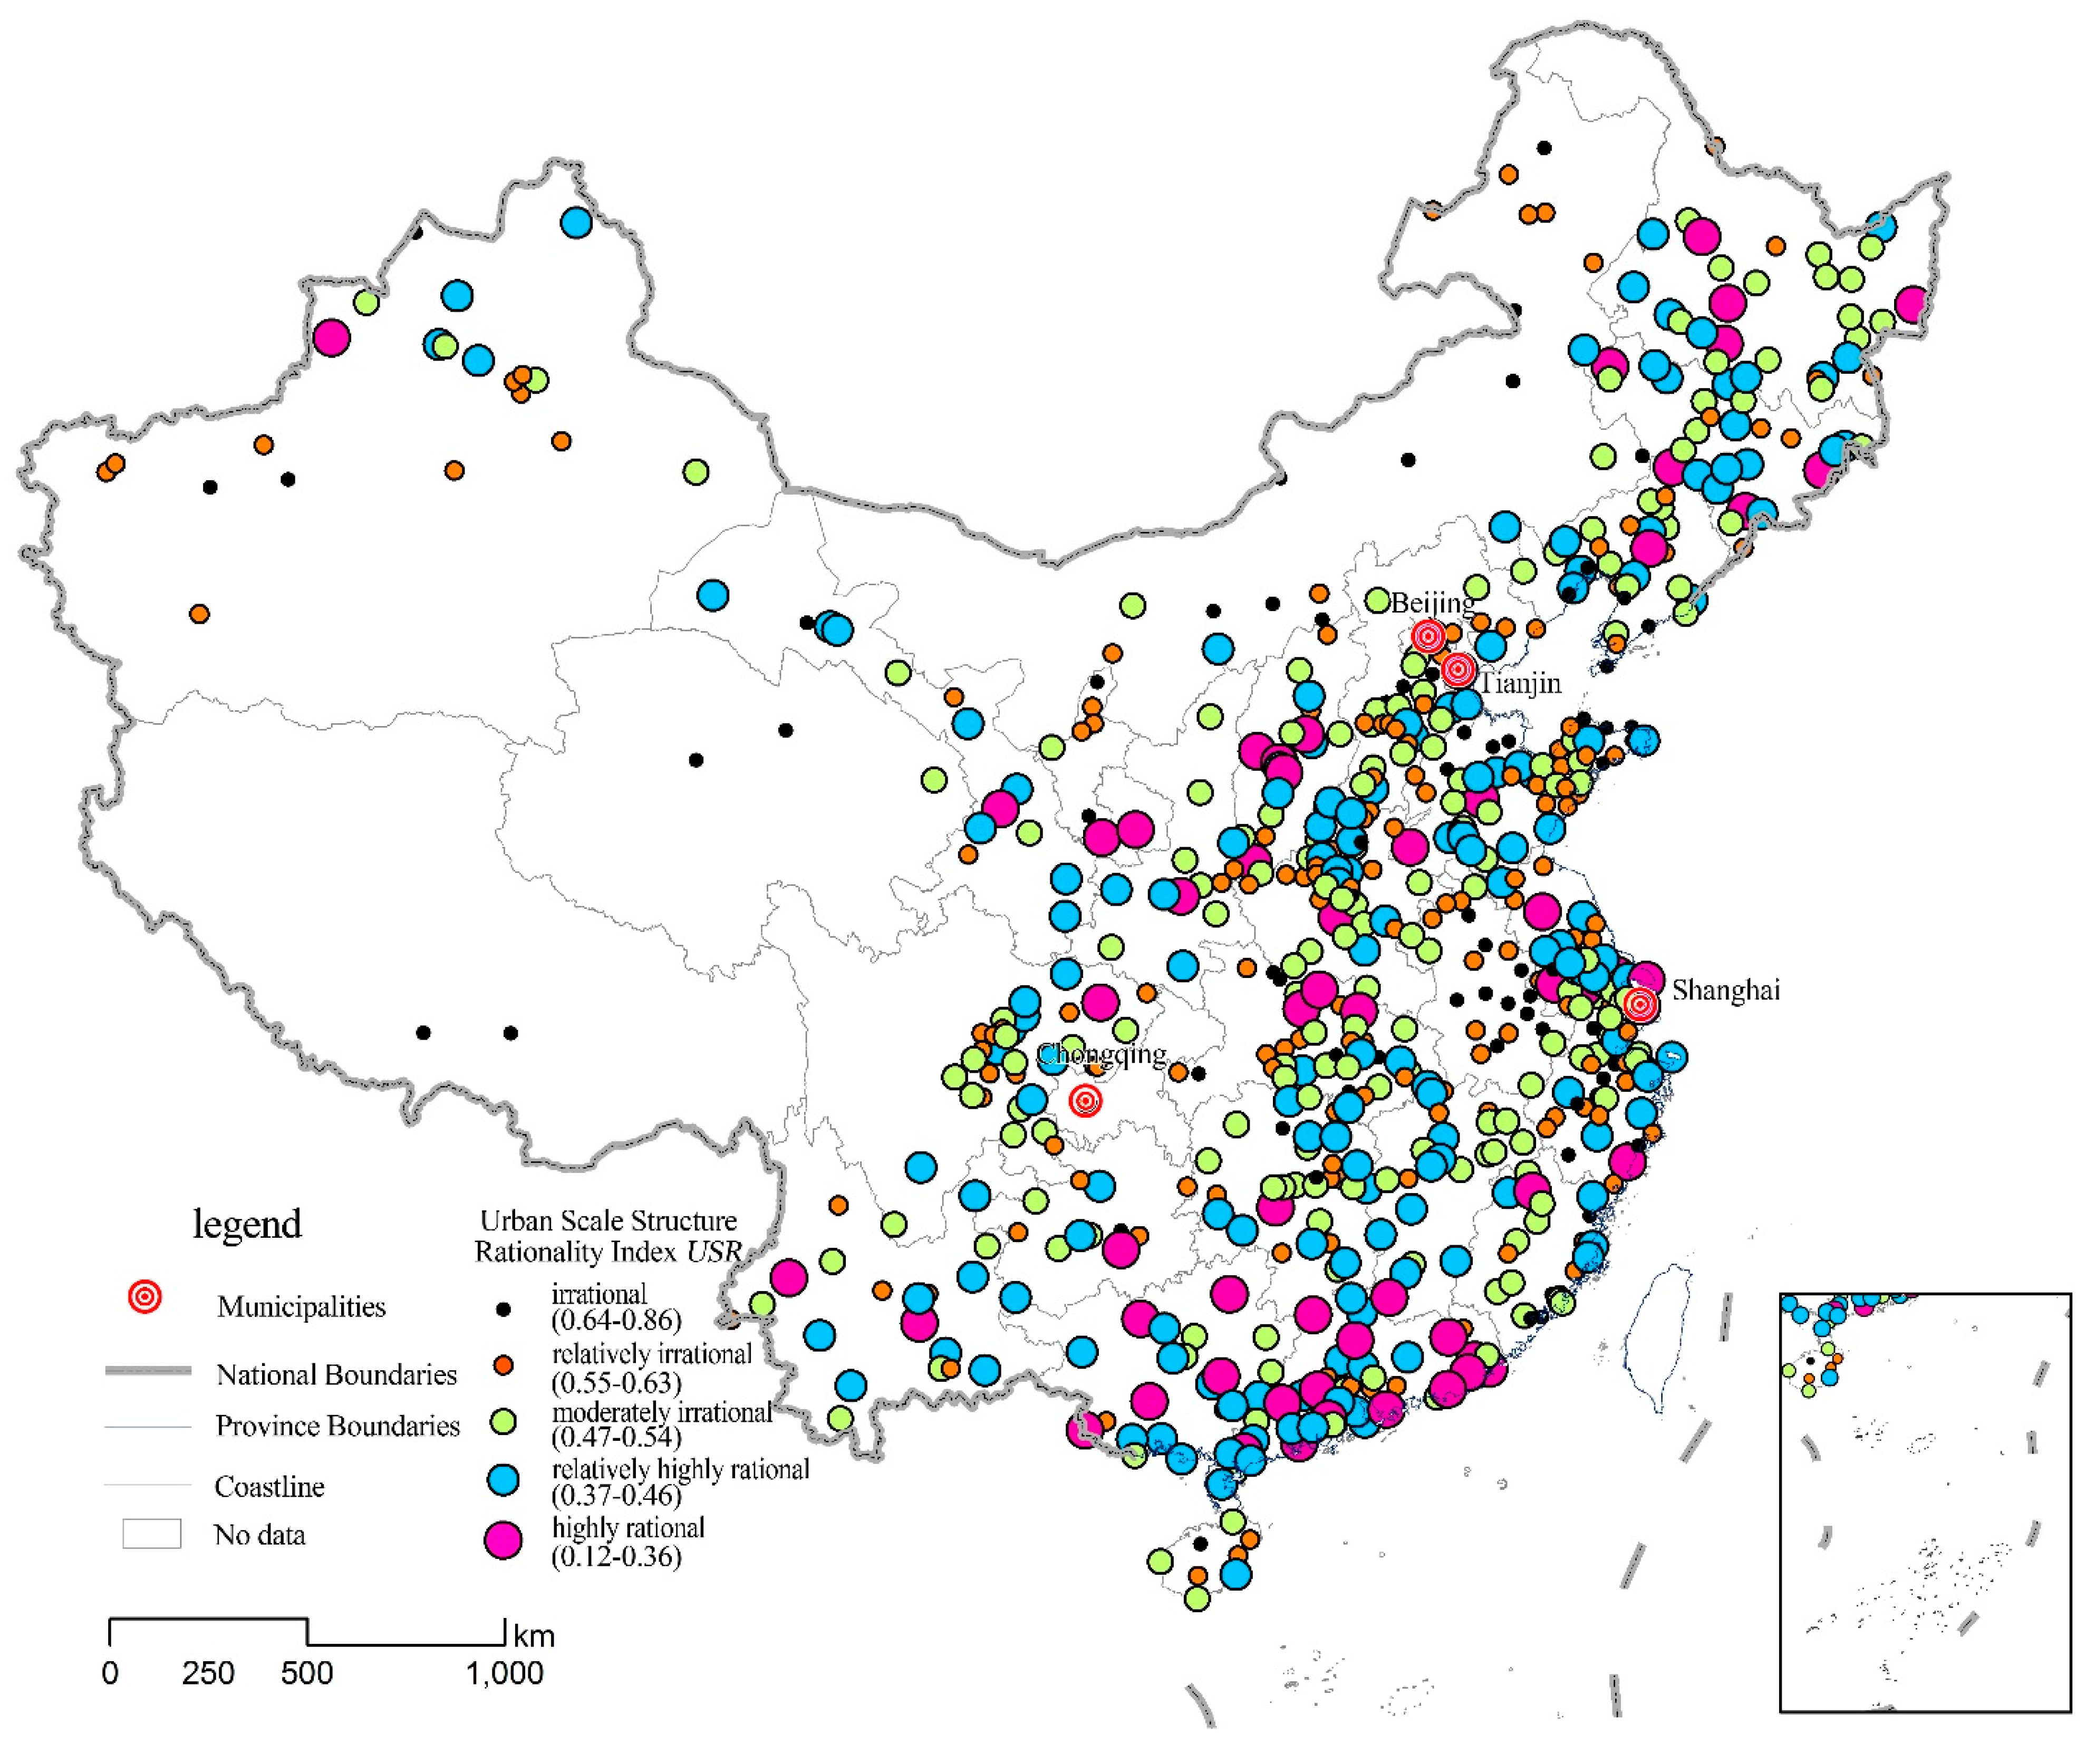
4.1.3. Urban Scale Structure Rationality Diagnosis

The results of calculating national urban scale structure rationality using the USR diagnostic model based on Zipf’s exponent, show that 68.03% of cities nationwide have moderate or greater scale structure rationality (see Figure 5), which means that Chinese urban scale structure rationality is basically rational. Of these, 10.5% are highly rational and mainly located in the Yangtze River Delta, Pearl River Delta, Central Plains region and the three northeast provinces; 22.98% are relatively highly rational and have small concentrations that are widely distributed, mainly in the Shandong Peninsula, Yangtze River Delta, Yangtze River Delta, middle reaches of the Yangtze River, Pearl River Delta, Central Plains region, three Northeast provinces, southwest region and areas along the Eurasian Land Bridge; 34.55% are moderately rational and have small concentrations that are widely distributed, mainly in the Yangtze River Economic Belt region, Beijing-Tianjin-Hebei region, Shandong Peninsula, Central Plains region, Chengdu-Chongqing region and the northeast region; 22.83% are relatively irrational and mainly located in the Shandong Peninsula, Central Plains region, Chengdu-Chongqing region and middle reaches of the Yangtze River; and 9.13% are irrational and mainly located in the middle reaches of the Yangtze River and the Shandong Peninsula.
Figure 5. Map Showing the Scale Structure Rationality Distribution of Chinese Cities.
Sustainability 07 03859 g005

4.2. Rationality Diagnosis of Chinese Urban Space Structure

Using national major function-oriented zones as restrictive criteria and space kernel density of Chinese cities as the evaluation subject, comparing coincidence and differentiation of the two revealed the distribution of Chinese cities within major function-oriented zones and allowed evaluation of their spatial rationality characteristics.

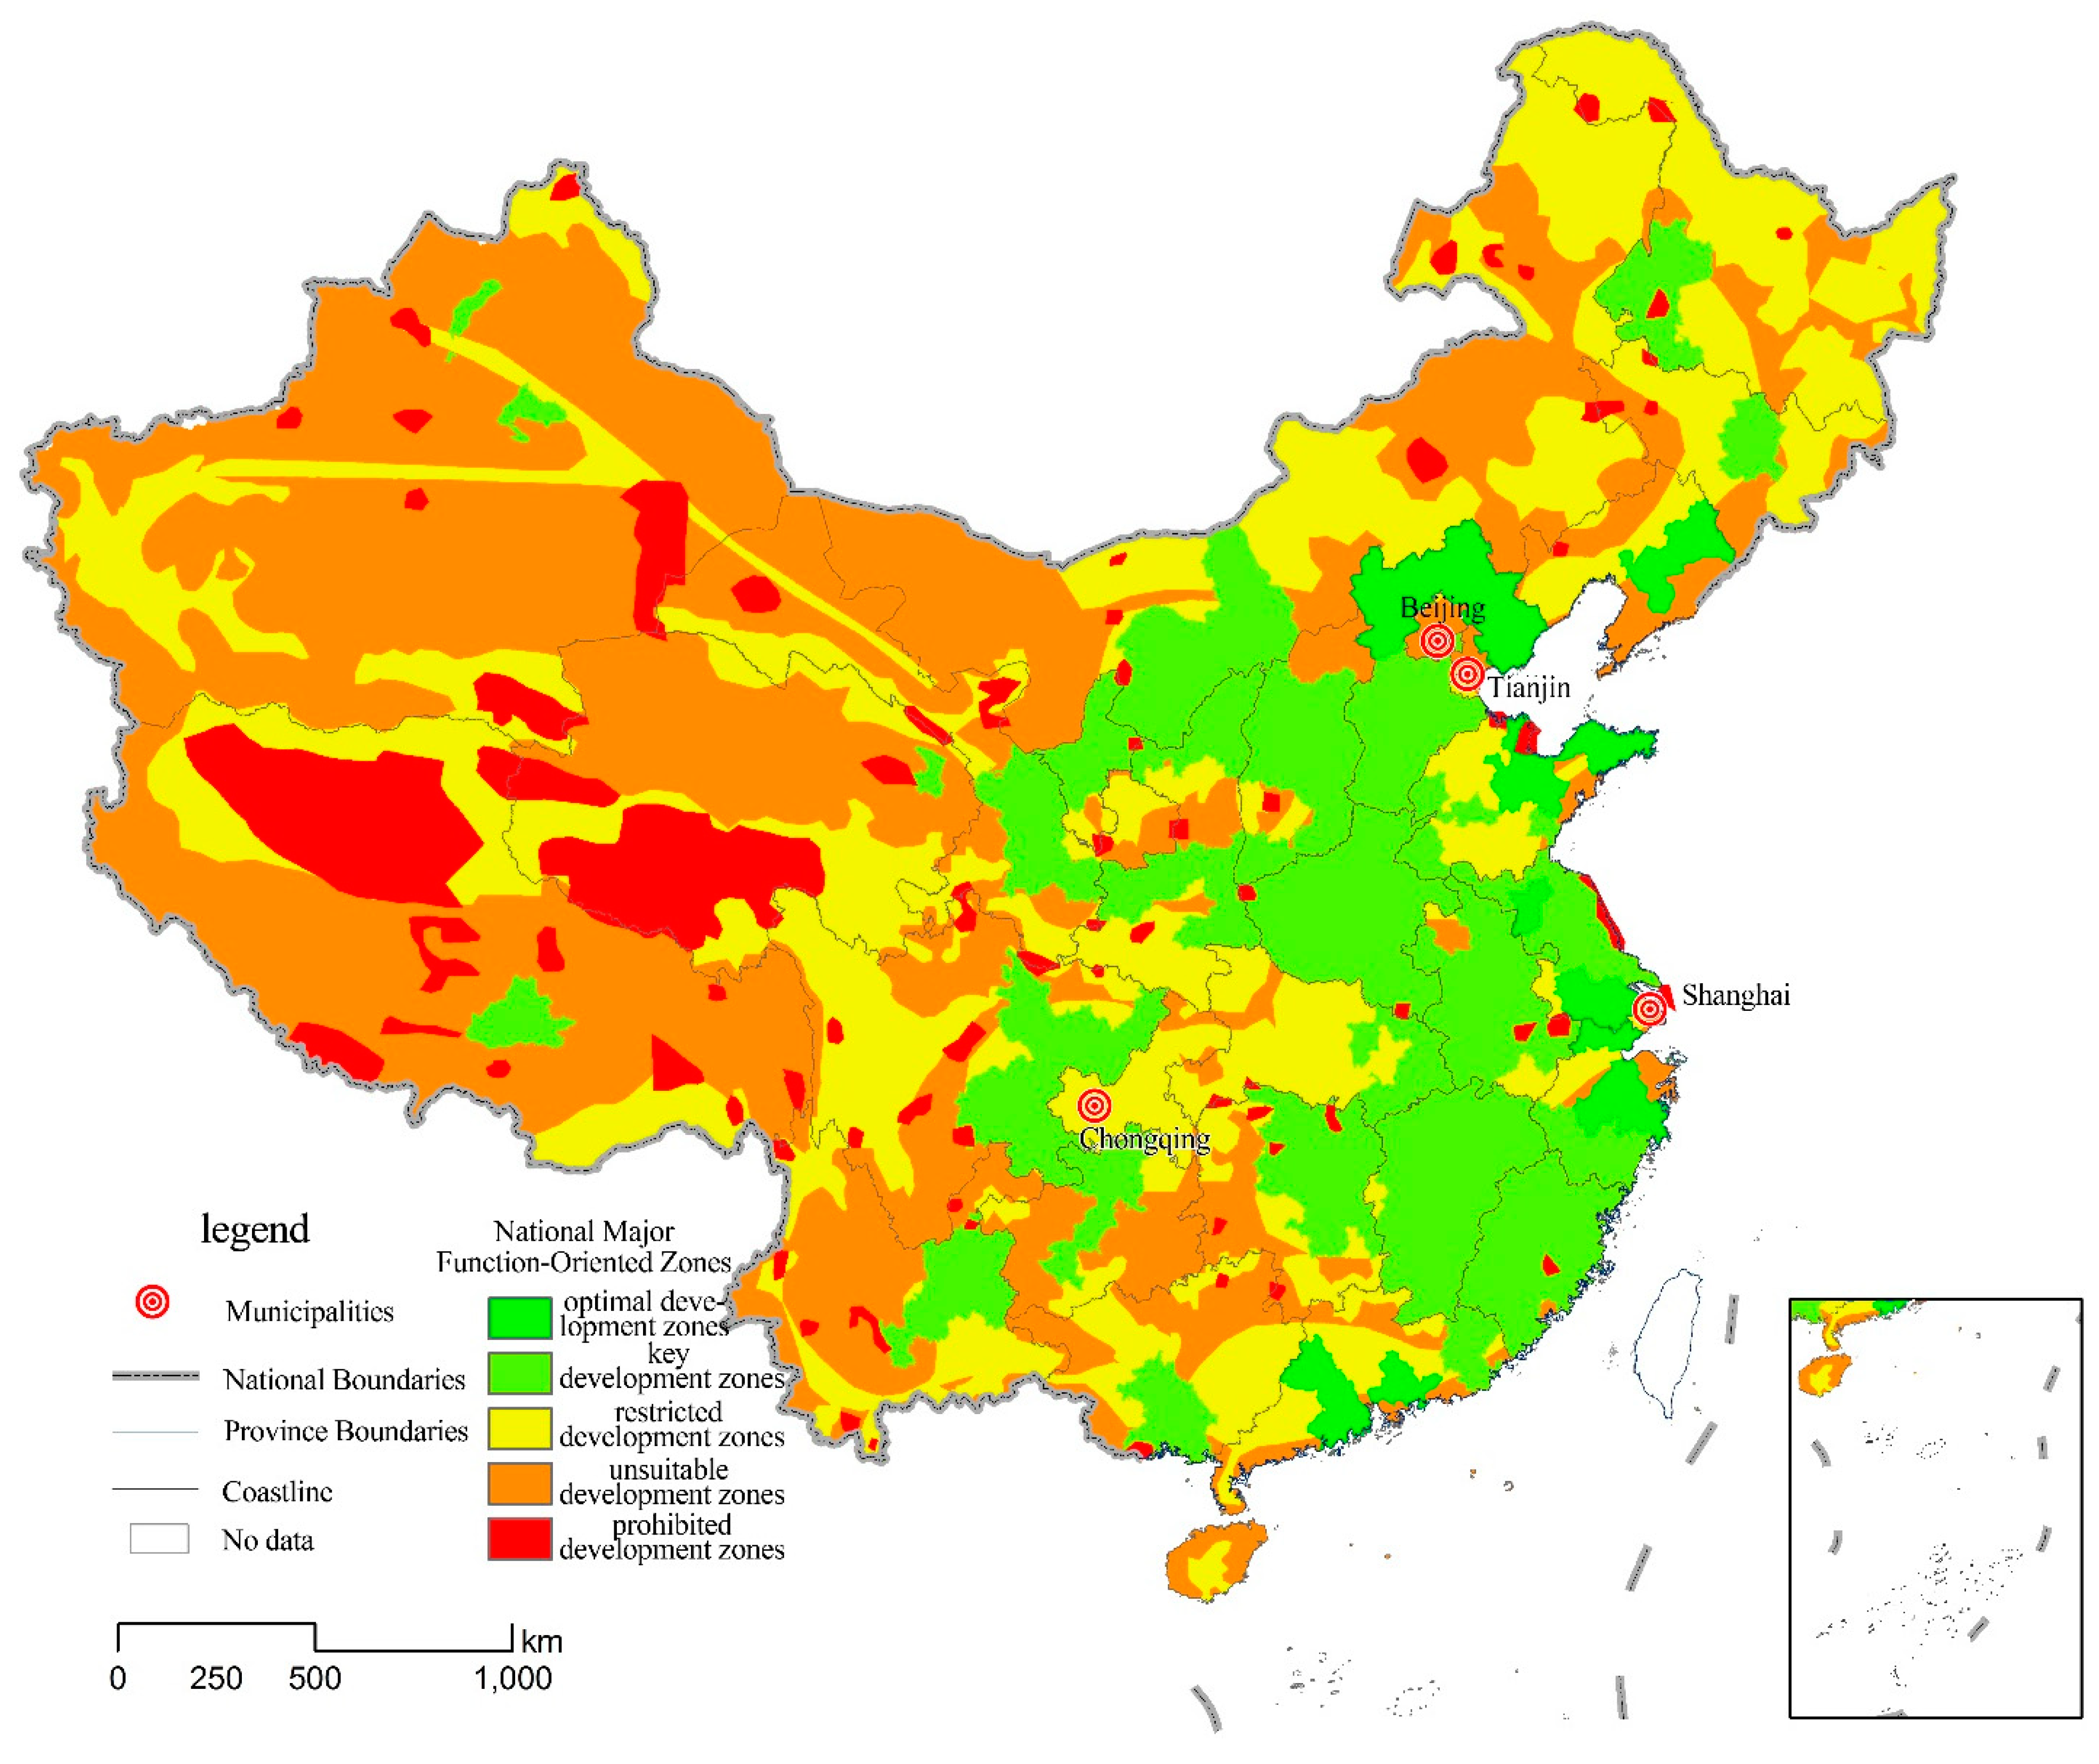
4.2.1. Kernel Density Analysis of Chinese Urban Space Structure

In order to allow them to be superimposed on major function-oriented zones, cities were reclassified into four levels, namely highly concentrated urban areas, relatively highly concentrated urban areas, scattered urban areas and sparse urban areas, with each level designated as a, b, c, d respectively. Major function-oriented zones were then split into optimal development zones, key development zones, restricted development zones and prohibited development zones, with each designated a, b, c, d respectively. The ArcGIS10.1 platform was then used to create a two-dimensional attribute differentiation matrix made up of a map of national major function-oriented zoning and a national urban kernel density zoning map. Development function of carrying capacity got weaker in regions from left to right, with weak numbers and density of cities able to carry their populations (see Figure 6). In sequence these are optimal development zones (A), key development zones (B), restricted development zones (C) and prohibited development zones (D) (see Figure 6). There was a reduction in urban concentration from top to bottom, with decreasing density in cities within regions: highly concentrated urban areas (a), relatively highly concentrated urban areas (b), scattered urban areas (c) and sparse urban areas (d) (see Figure 7). In the diagrams, (a-a), (b-b), (c-c) and (d-d) had the best match of carrying capacity and urban density, i.e. they had the most rational space structure. In the top right of the matrix, density exceeds carrying capacity. In the bottom left, density is lower than carrying capacity. Both of these are irrational areas.
Figure 6. Map Showing the Distribution of National Major Function-Oriented Zones.
Sustainability 07 03859 g006
Figure 7. Map Showing the Space Structure Kernel Density of Chinese Cities
Sustainability 07 03859 g007

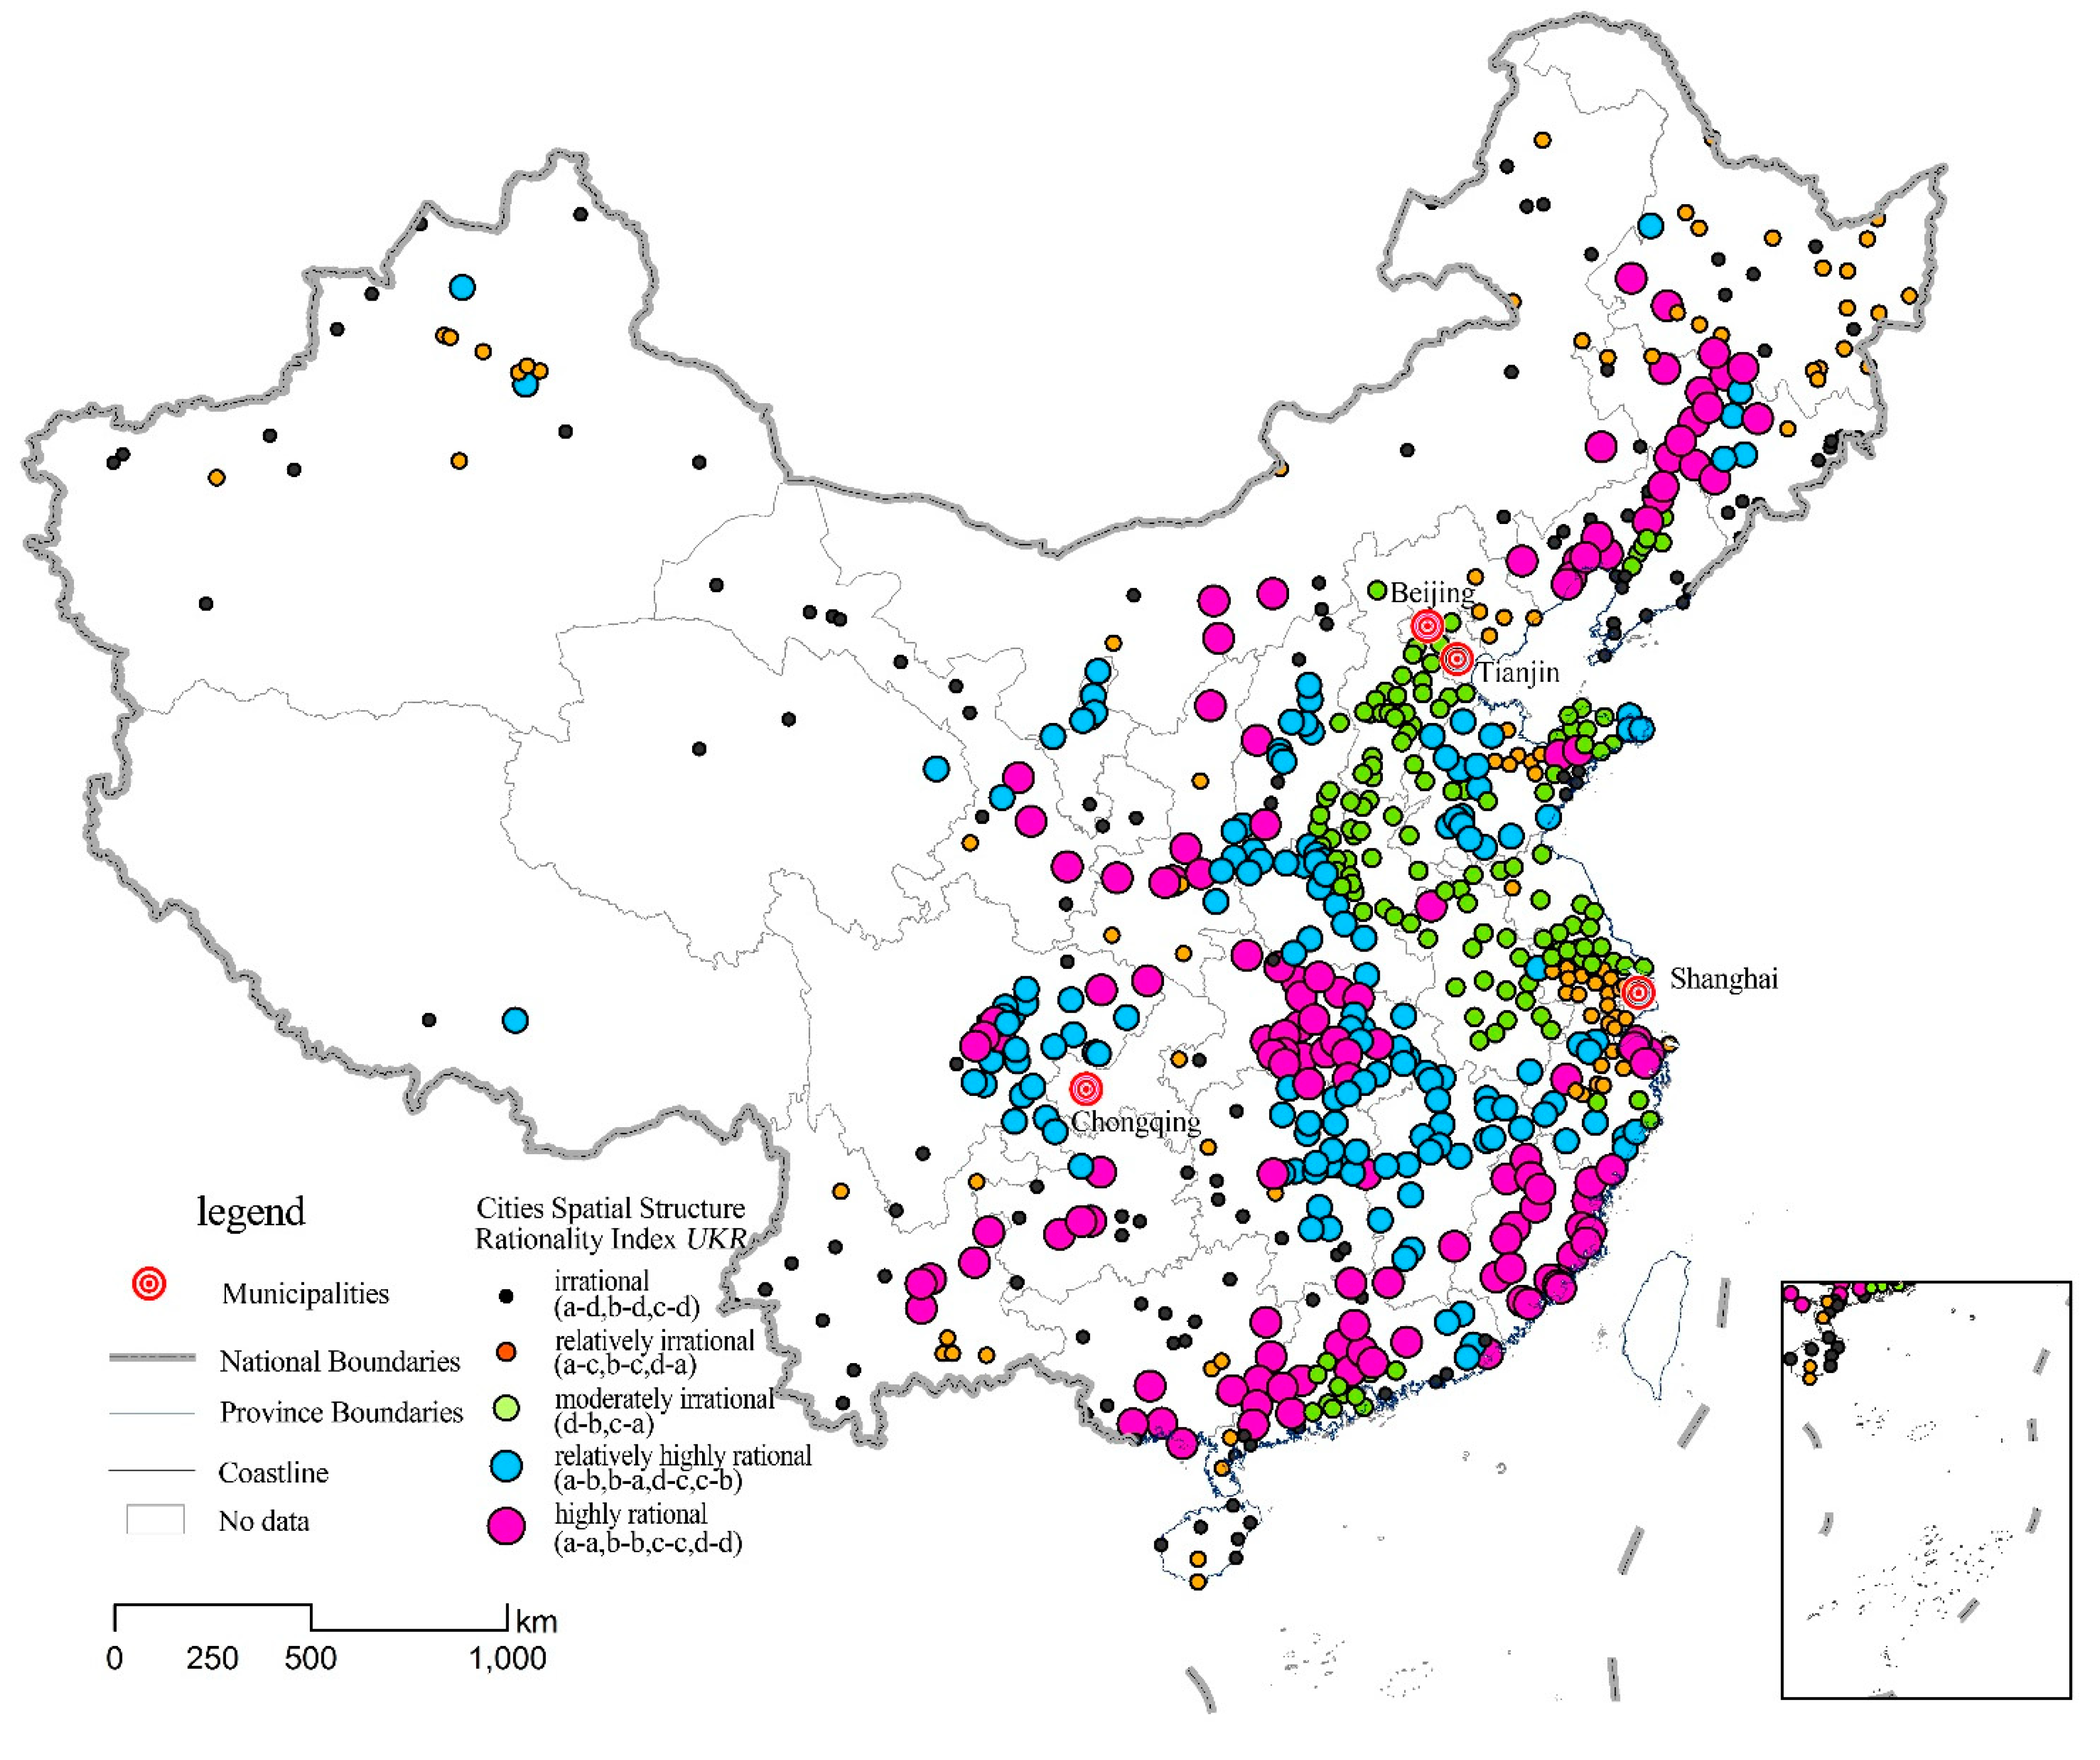
4.2.2. Rationality Diagnosis of Chinese Urban Spatial Structure

Calculations using the spatial structure rationality index UKR diagnostic model based on kernel density showed that, of China’s 657 cities, 132 (20.09%) had high spatial structure rationality, 178 (27.09%) had relatively high spatial structure rationality and 146 (22.22%) had moderate space structure rationality, focused on highly concentrated optimal development zones, relatively highly concentrated key development zones, scattered restricted development zones (agricultural areas) and sparse prohibited development zones. A total of 177 cities (26.94%) were shown to be irrational, with the focus on prohibited development zones and nearby and optimal development zones with sparse urban areas (see Figure 8). In summary, 69.41% of Chinese cities have a rational spatial structure, while 30.59% of cities need to strengthen planning and guidance through population guidance, land use regulation and control, industrial upgrading and ecological protection.
Figure 8. Map Showing the Spatial Structure Rationality Distribution of Chinese Cities.
Sustainability 07 03859 g008

4.3. Rationality Diagnosis of Chinese Urban Functional Structure

The rationality of Chinese urban functional structure includes urban functional scale rationality, functional intensity rationality and of function type rationality. Rational urban functional structure is the result of coordinated development of functional scale, functional intensity and functional diversity.

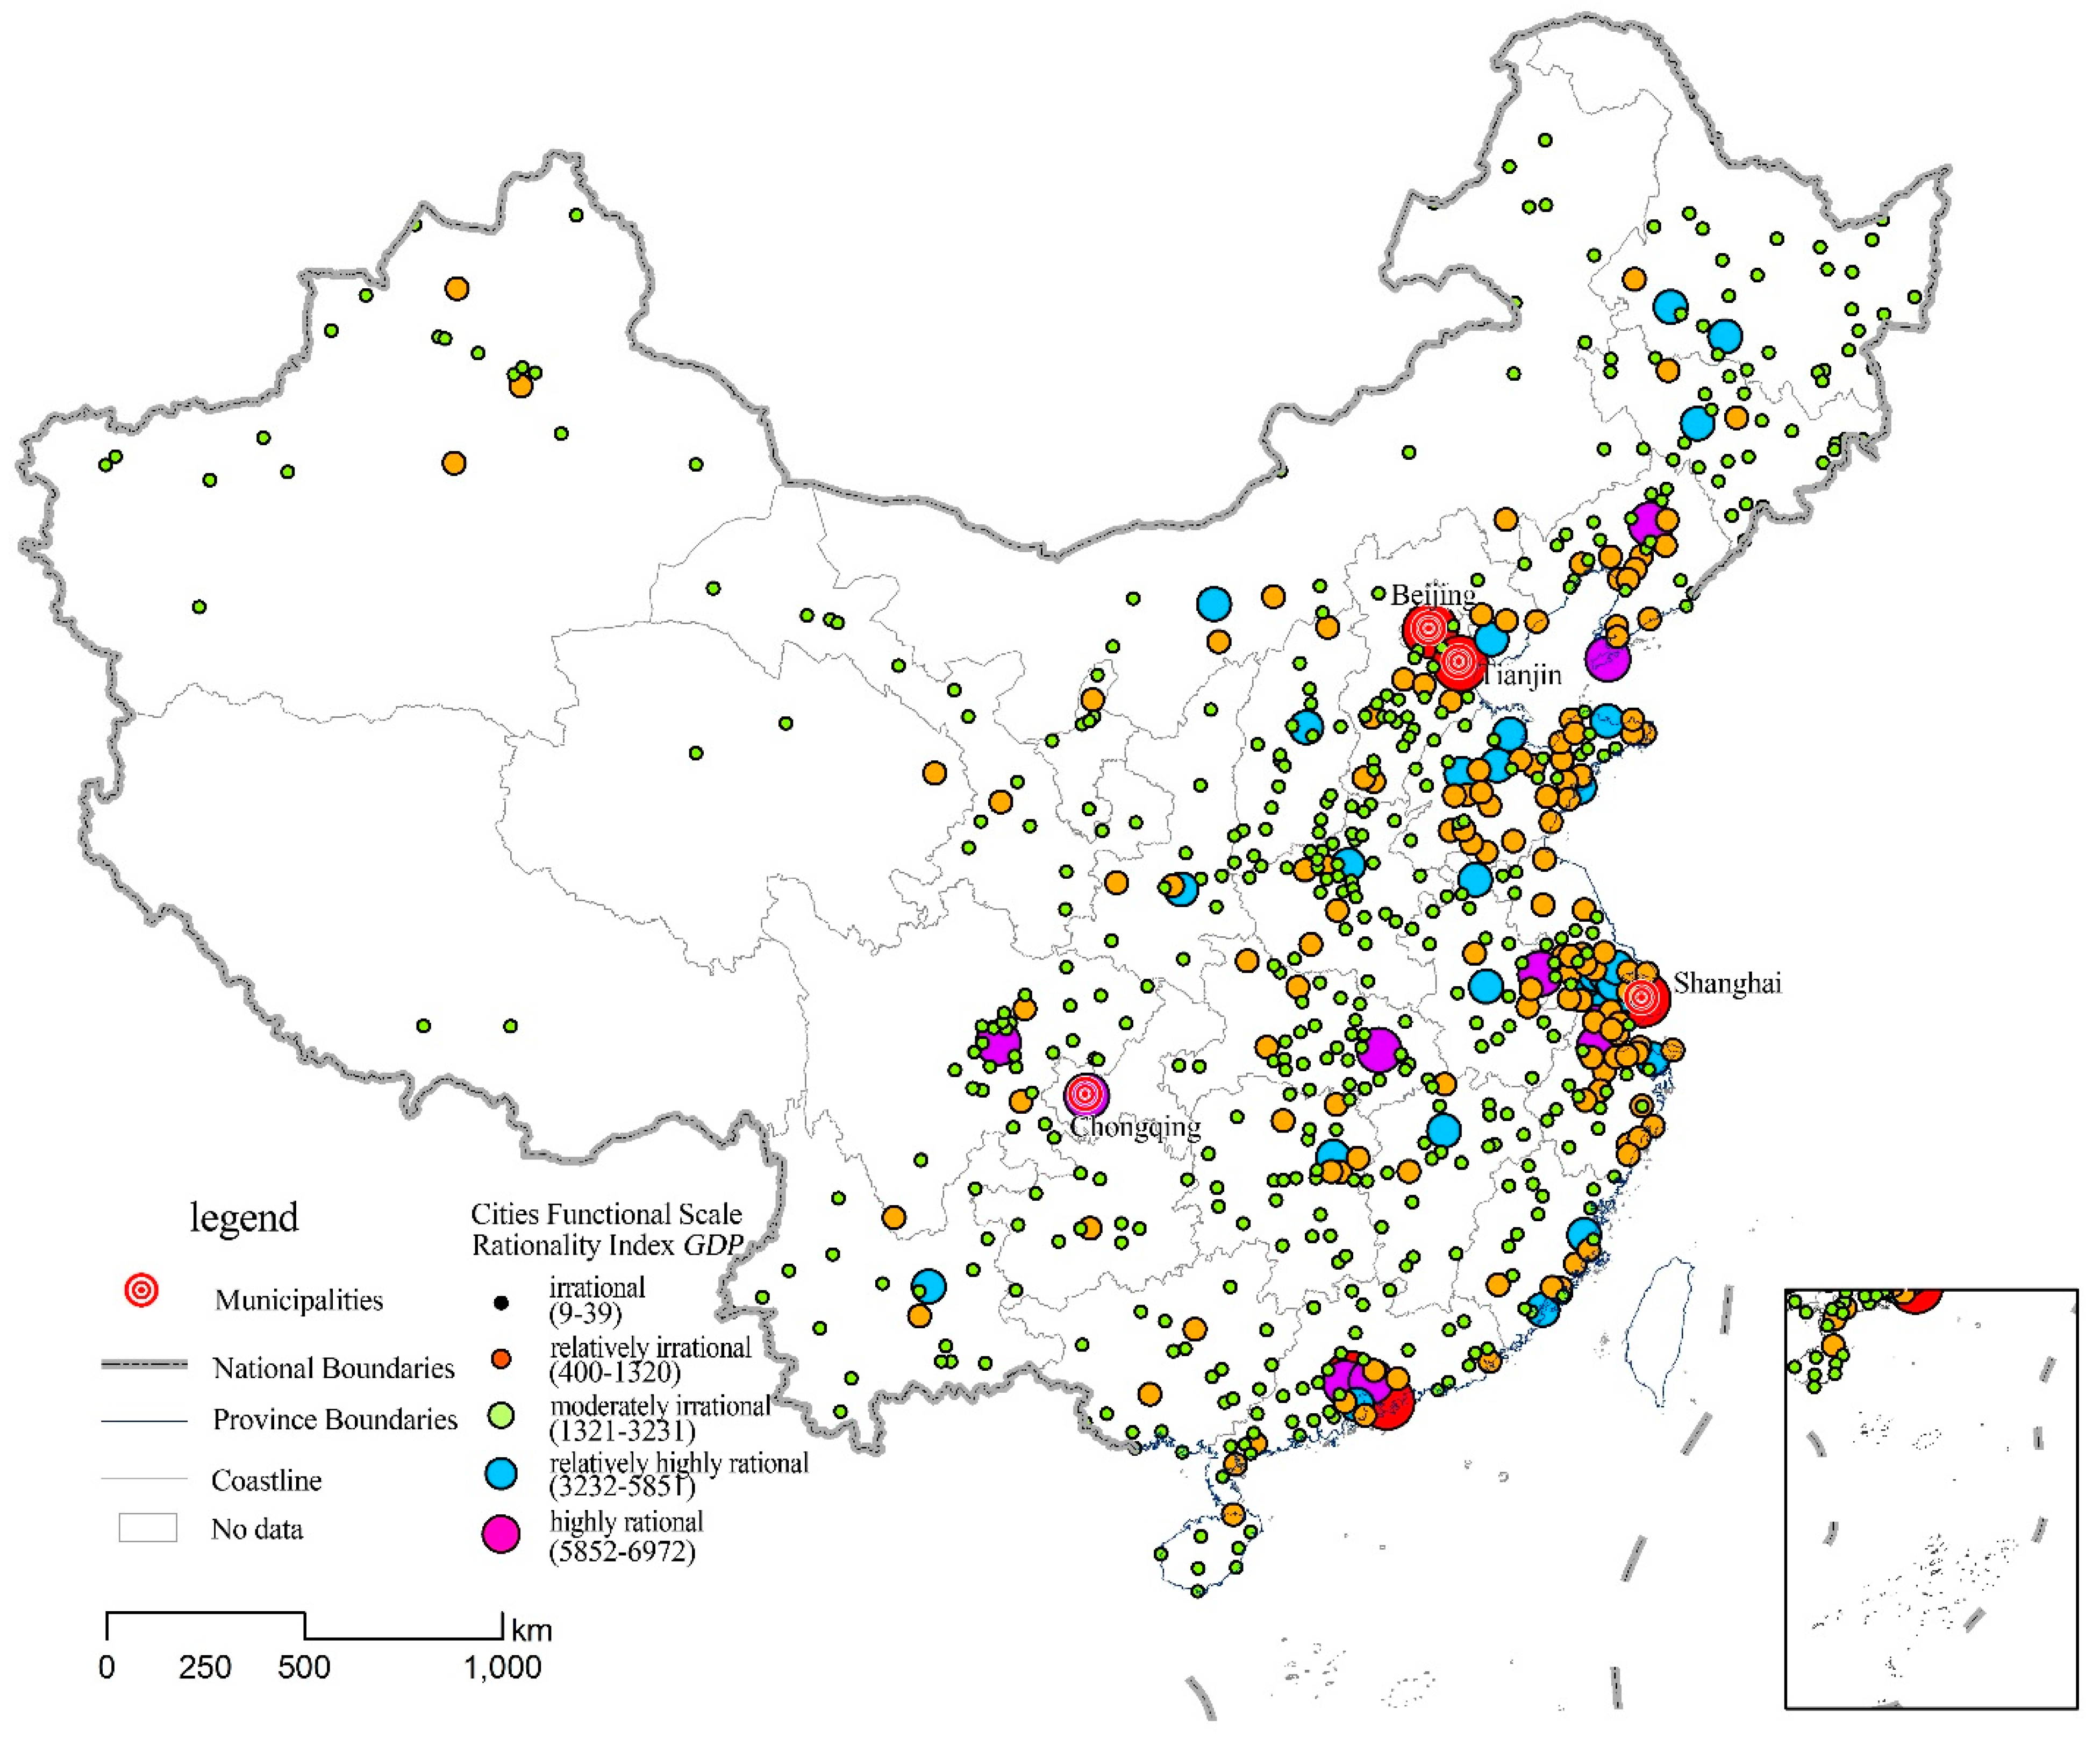
4.3.1. Rationality Analysis of Chinese Urban Functional Scale

Using the urban functional scale rationality clustering model FGi, where urban GDP is the influencing factor in diagnosing functional scale, the natural breaking point method was employed to divide the functional scale of cities into highly rational cities (GDP > RMB 585 billion), relatively highly rational cities (GDP = RMB 323 billion to 585 billion) moderately rational cities (GDP = RMB 132 billion to 323 billion), relatively irrational cities (GDP = RMB 38.9 billion to 132 billion) and irrational cities (GDP < RMB 38.9 billion). Of China’s 657 cities, six (0.91%) are highly rational cities (see Figure 9), 10 (1.52%) are relatively highly rational, 29 (4.41%) are moderately rational, 141 (21.46%) are relatively irrational and 471 (71.69%) are irrational.
Cities with highly rational (mainly municipalities), relatively highly rational and moderately rational functional scales tend to be grouped together, mainly in the Yangtze River Delta, the Beijing-Tianjin-Hebei region, the Pearl River Delta, the Shandong Peninsula, south and central Liaoning, the Central Plains, the middle reaches of the Yangtze River, the west coast of the Taiwan Strait, the Sichuan-Chongqing region and the Guanzhong region, which form the main city groups and regional centers of regional economic development in China. Relatively irrational and irrational cities are dispersed around urban clusters.
Figure 9. Map Showing the Functional Scale Index Distribution of Chinese Cities.
Sustainability 07 03859 g009

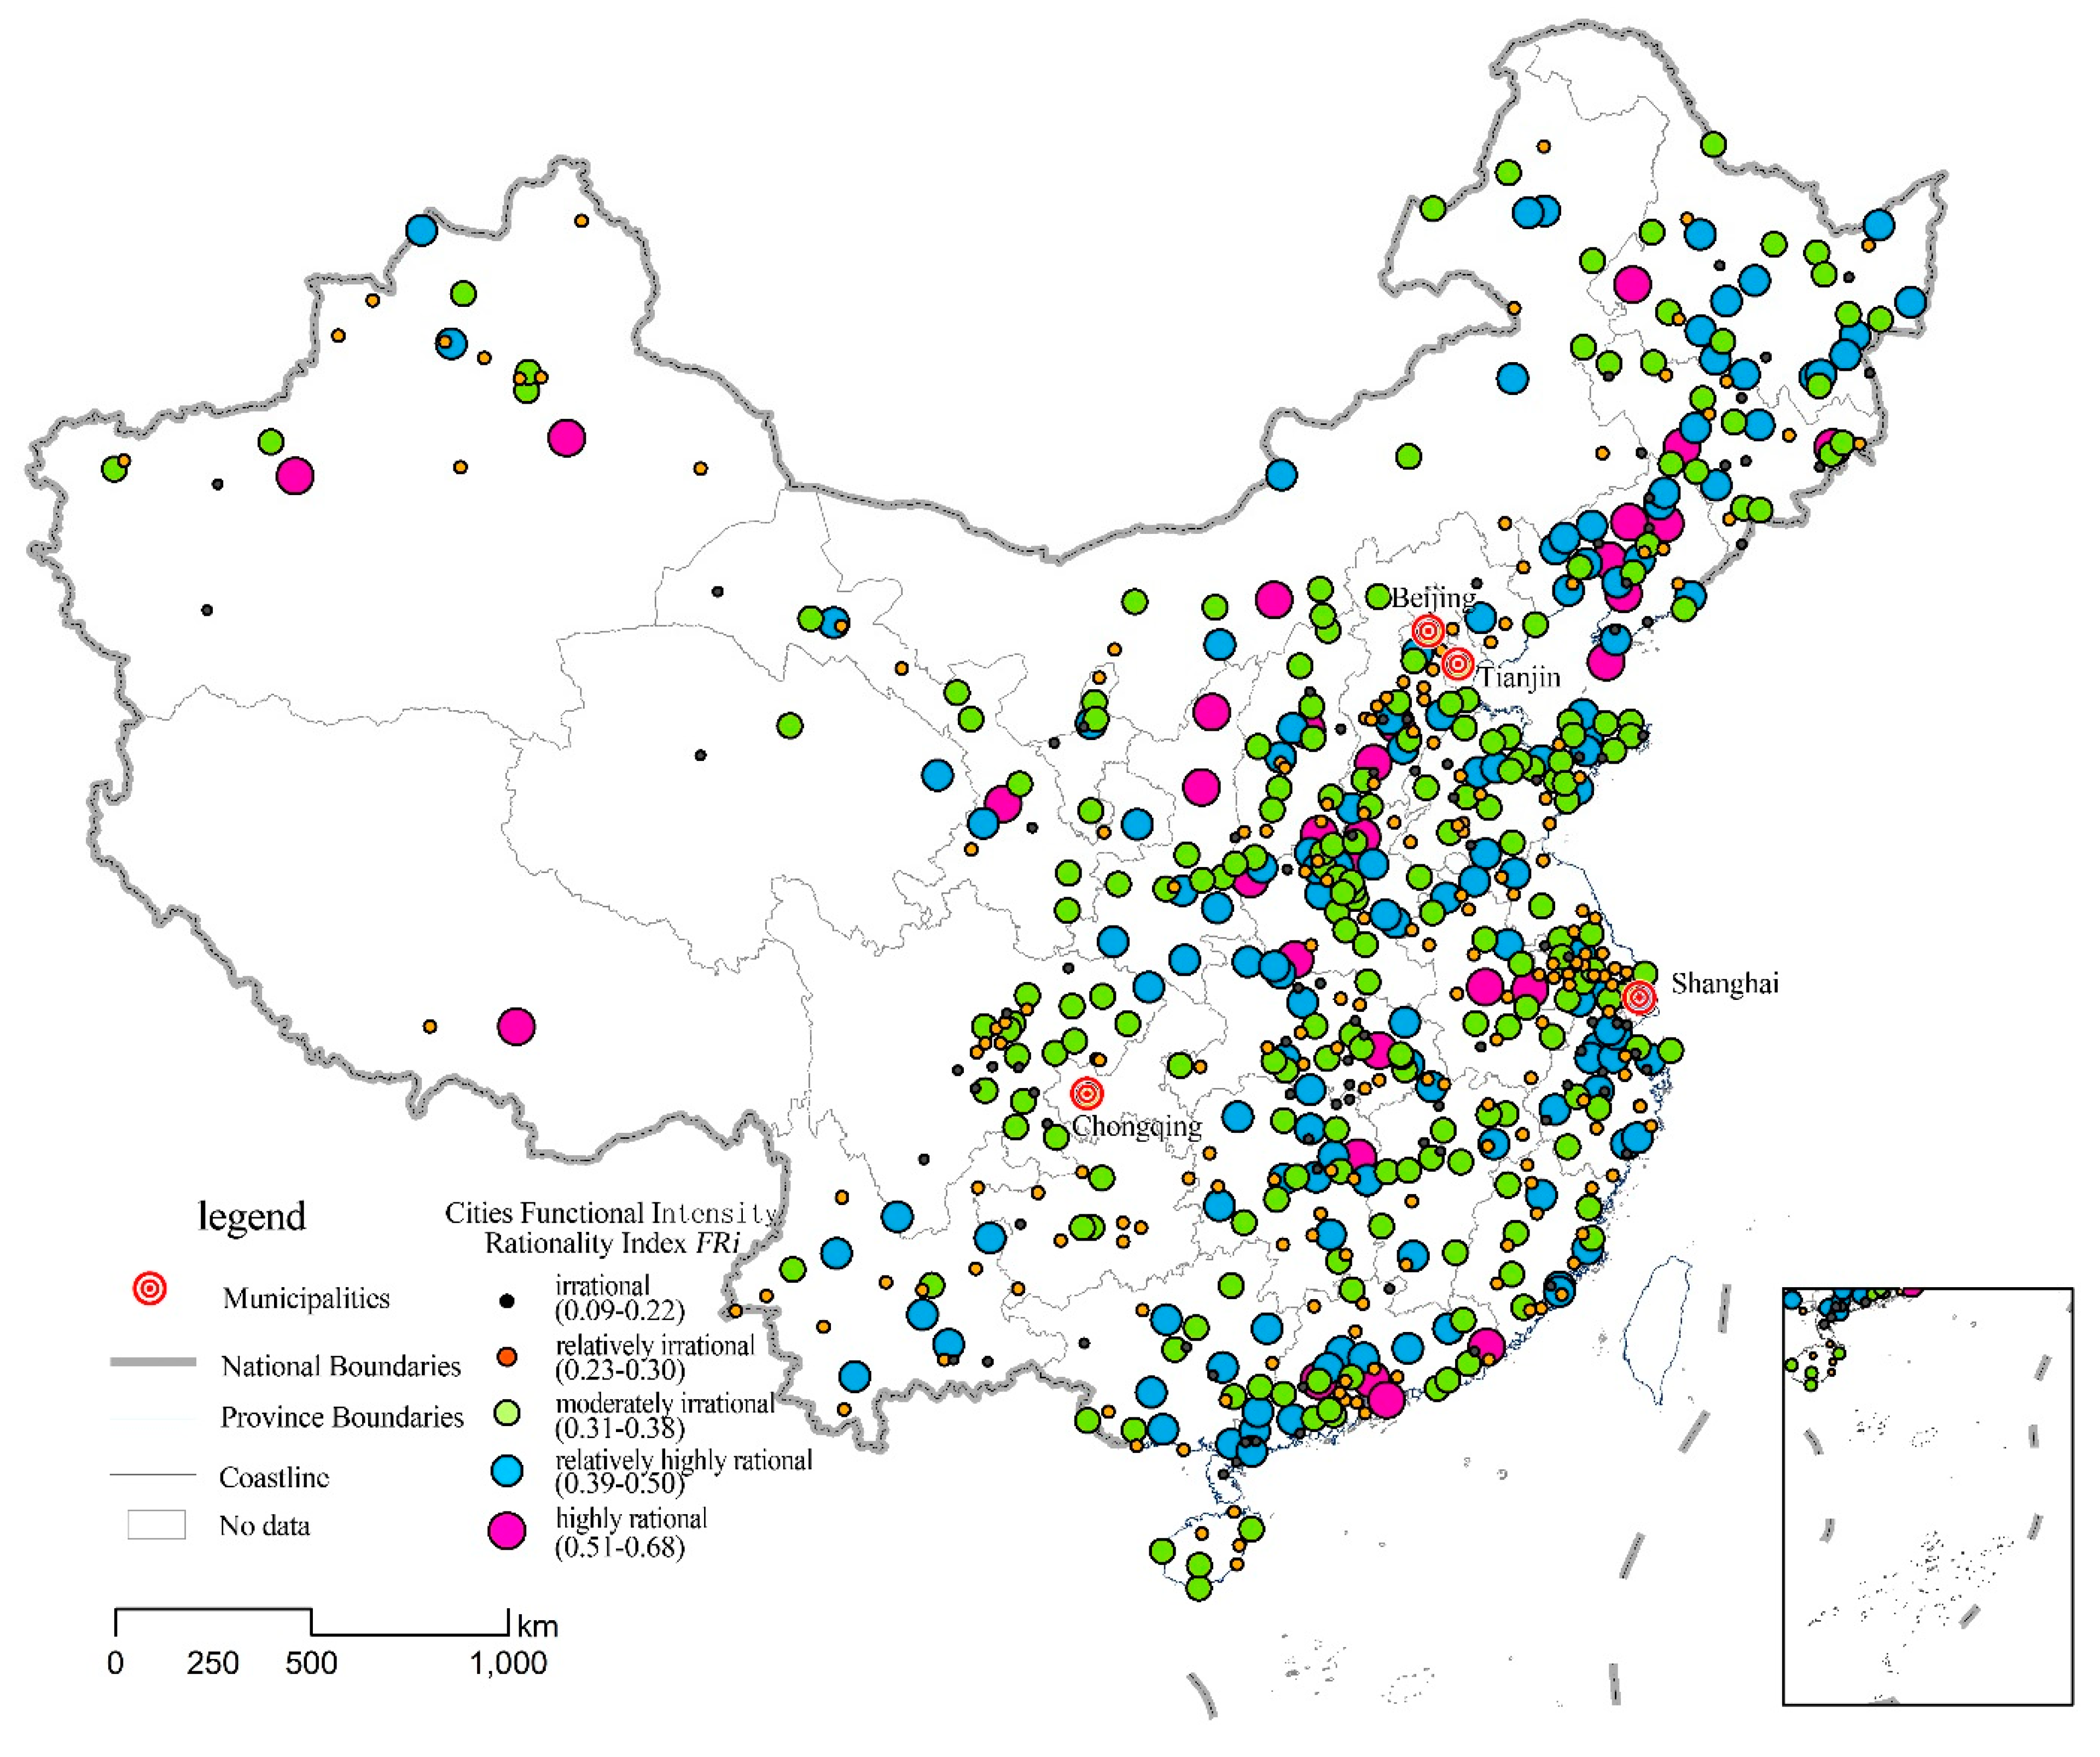
4.3.2. Rationality Analysis of Chinese Urban Functional Intensity

Using the urban functional intensity index model FRi and data from the Sixth National Population Census of the People’s Republic of China, the breaking point method was employed to divide the functional intensity of cities in China into highly rational cities (FRi > 0.50), relatively highly rational cities (0.37 < Fri < 0.49), moderately rational cities (0.27 < FRi < 0.36), relatively irrational cities (0.13 < FRi < 0.26) and irrational cities (Fri < 0.12). Of China’s 657 cities, 33 (5.02%) are highly rational, with the degree of specialization within certain sectors at the forefront of China, especially in mining cities and open coastal cities concentrated in mining areas and in coastal areas (see Figure 10); 165 cities (25.11%) are relatively highly rational, with a relatively degree of specialization within certain sectors mainly along important transport routes; 268 (40.79%) are moderately specialized, with cities having multiple sectors, a balanced distribution of these sectors and being comprehensively distributed along main transport routes; 183 (27.85%) have a relatively low level of specialization, with cities developing diverse urban functions and balanced sectors, but with a low level overall; 8 (1.22%) have a low level of specialization, meaning with the exception of the agriculture, forestry, animal husbandry and fishery industries, the level of specialization of multiple sectors is below the national average, and the development level of sectors is relatively low.
Figure 10. Map Showing the Functional Intensity Distribution of Chinese Cities.
Sustainability 07 03859 g010

4.3.3. Rationality Analysis of Chinese Urban Diversification

Using the urban functional diversification diagnostic model FDi and data from the Sixth National Population Census of the People’s Republic of China, the Shannon-Wiener index model was employed to diagnose industrial diversification in cities. The higher the degree of diversification, the more stable the urban industrial structure will be and the more viable and shock-resistant it will be. A breaking point model was used to divide China’s cities into those with functional diversification that is highly rational (FDi > 3.23), relatively highly rational (2.93 < FDi < 3.22), moderately rational (2.71 < FDi < 2.92), relatively irrational (2.41 < FDi < 2.70) and irrational (FDi < 2.40). Of China’s 657 cities, 118 cities, mostly provincial capitals and major industrial cities, are highly rational, with specialized departments that are complete and balanced concentrated in the Beijing-Tianjin-Hebei region, south-eastern Liaoning province, the Central Plains and the Yangtze River Delta region (see Figure 11); 167 cities, mainly at the prefecture level, are relatively highly rational, with quite a lot of specialized sectors but not a large number of sectors overall, and mainly consisting of third-tier cities along major transport routes in China’s eastern region; 199 cities, mainly at the county level, are moderately rational and have small overall numbers of balanced industries, and are scattered mainly in the Yangtze River Delta, the Central Plains and the middle reaches of the Yangtze River; 149 cities, mainly at the county level, are relatively irrational, with few specialized sectors that have a low level of specialization; and 24 cities are irrational, with few specialized sectors, mainly in the agriculture, forestry, animal husbandry and fishery industries and mainly concentrated around the Yangtze River Delta, the Pearl River Delta, the Shandong Peninsula and south-eastern Liaoning province.
Figure 11. Map Showing the Functional Diversification Index of Chinese Cities.
Sustainability 07 03859 g011

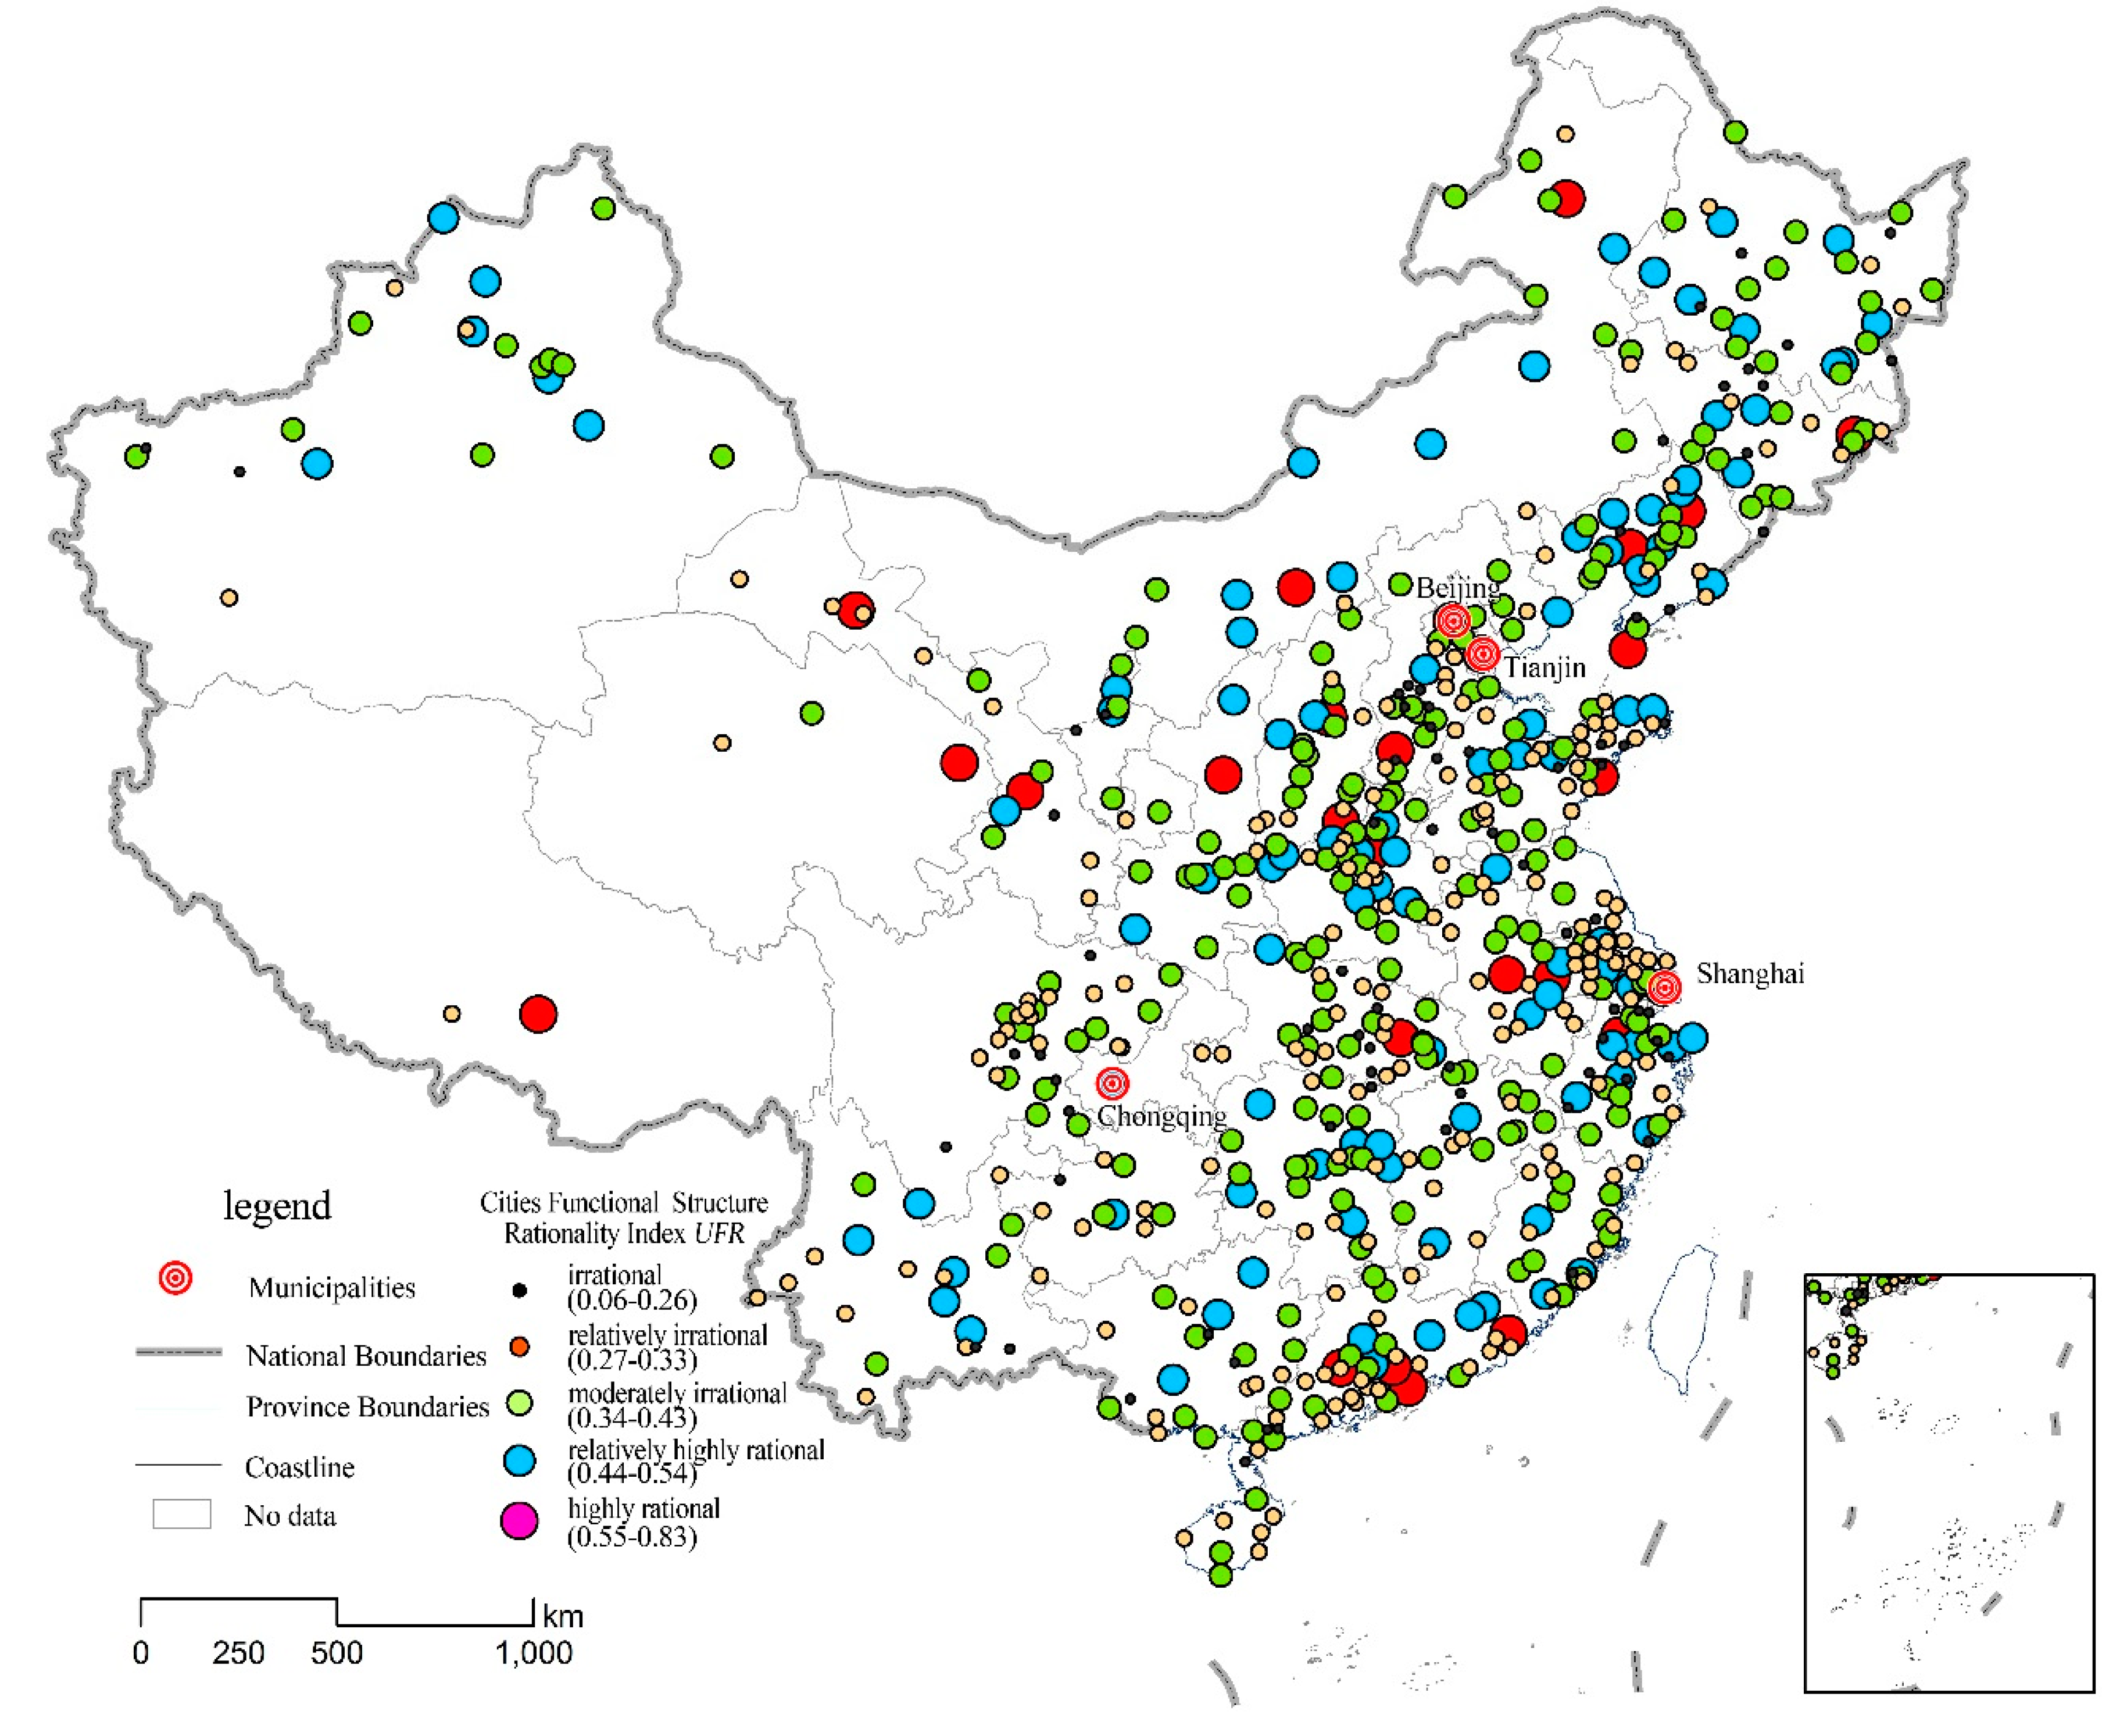
4.3.4. Comprehensive Diagnosis of Chinese Urban Functional Structure Rationality

Using the urban functional structure rationality (UFR) diagnostic model based on the Shannon-Wiener index, and according to the diagnostic results of the urban functional scale rationality clustering model FGi, the urban functional intensity index model FRi and the urban diversification diagnostic model FDi, the AHP method supported by entropy technology was used to calculate the weight coefficients of FGi, FRi and FDi, which came out as 0.3333, 0.5 and 0.1667, respectively. The fuzzy membership function model was used to calculate the fuzzy membership function values of FGi, FRi and FDi for each city. The weighted average method was then used to calculate urban functional structure rationality (UFR), and urban functional structure was divided into five types according to the natural breaking point model and comprehensive diagnostic criteria: 62 cities (or 9.44% of all China’s cities) were designated as highly rational (UFR > 0.55) (see Figure 12); 175 (26.64%) as relatively highly rational (0.44 < UFR < 0.54); 217 (33.03%) as moderately rational (0.34 < UFR < 0.43); 133 (21.06%) as relatively irrational ; and 49 (9.74%) as irrational. Cities with moderate or greater rationality account for 69.1% of Chinese cities, and they are mainly concentrated within urban agglomerations.
Figure 12. Map Showing the Functional Structure Rationality Distribution of Chinese Cities.
Sustainability 07 03859 g012

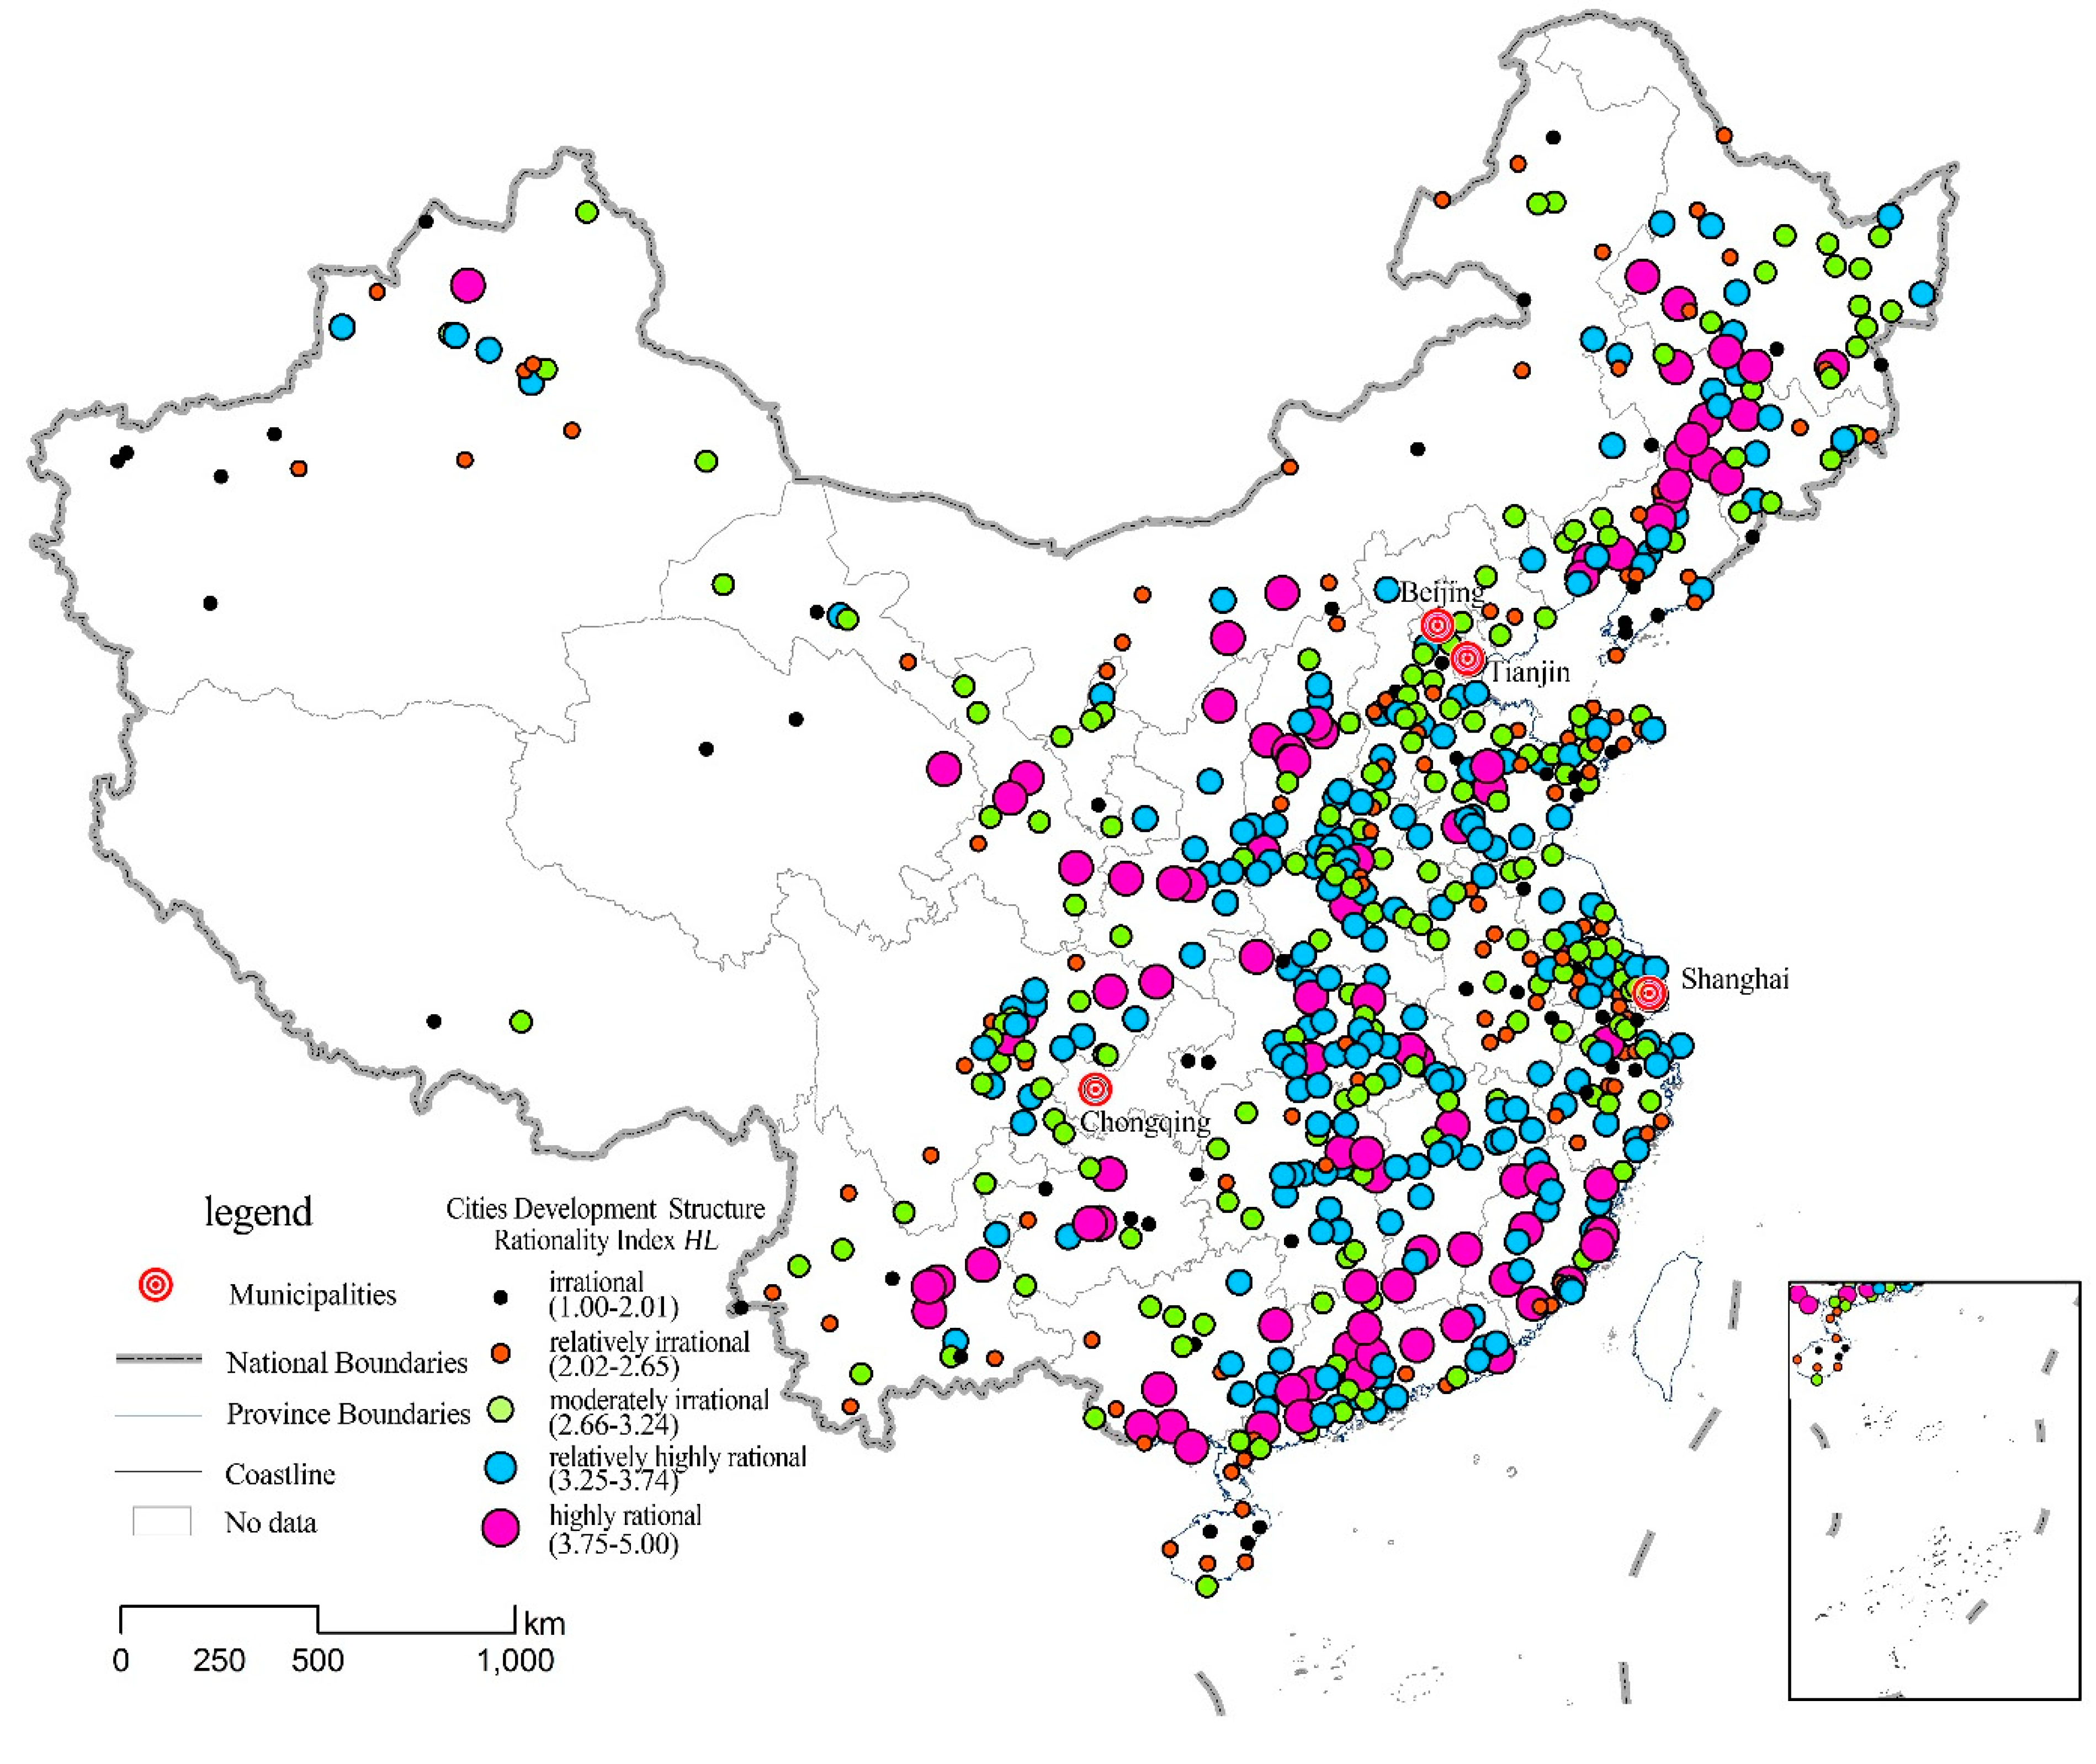
4.4. Comprehensive Diagnosis of Chinese Urban Development Structure Rationality

On the basis of the results of the Chinese urban development structure rationality diagnostic model HL, combined with the results of the urban scale structure rationality (USR) diagnostic model, urban spatial structure rationality (UKR) diagnostic model and the urban functional structure rationality (UFR) diagnostic model, in accordance with the comprehensive diagnostic criteria for urban development structure rationality, the AHP method supported by entropy technology was used to calculate the weight coefficients of USR, UKR and UFR, which came to y1 = 0.3571, y2 = 0.3286 and y3 = 0.3143. The fuzzy membership function model was used to calculate the fuzzy membership function values of USR, UKR and UFR for each city. The weighted average method was then used to calculate the comprehensive diagnosis value of development structure rationality of Chinese cities.
The natural breaking point classification method was used to divide the development structure rationality of Chinese cities into five levels: 95 cities (or 14.46% of China’s 657 cities) are designated as highly rational (see Figure 13); 207 (31.51%) are relatively highly rational; 163 (24.81%) are moderately rational; 134 (20.4%) are reasonably irrational; 58 (8.83%) are irrational. The results of the calculations show that 465 cities (70.78%) have moderate or greater rationality, which shows that the space structure of China’s cities is currently rational overall.
Figure 13. Map Showing the Development Structure Rationality Classification of Chinese Cities.
Sustainability 07 03859 g013

5. Discussion and Conclusions

Overall, the Chinese urban system is rational in terms of the development pattern of the urban system from the perspective of scale structure, spatial structure, functional structure and a combination of all three.
First, the overall pattern of Chinese urban development is rational, with 70.78% of cities showing moderate or greater rationality. From the analysis of overall rationality of urban development patterns nationwide, 465 cities (70.78%) were seen to have moderate or greater rationality (see Table 3). This shows that the current spatial pattern of Chinese cities is rational overall. This rationality is influenced by historical evolution, zoning adjustments and natural conditions, and no significant change is expected to occur for a long time to come.
Table 3. Comparative Analysis of the Comprehensive Diagnosis of Chinese Urban Spatial Structure Rationality.
Urban rationality ClassificationUrban Scale Structure RationalityUrban Spatial Structure RationalityUrban Functional Structure RationalityUrban Development Pattern Rationality
Number of citiesPercentage that are rationalNumber of citiesPercentage that are rationalNumber of citiesPercentage that are rationalNumber of citiesPercentage that are rational
Highly rational6910.5013220.09 629.449514.46
Relatively highly rational15122.9817827.09 17526.6420731.51
Moderately rational22734.5514622.22 21733.0316324.81
Relatively irrational15022.837711.72 13921.1613420.40
Irrational609.1412418.87 649.74588.83
Total657100.0657100.0657100.0657100.0
The figures show that 58 cities (8.83% of all cities) have an irrational distribution. In order to determine the reasons for the distribution of these cities being irrational, it would be necessary to go to each city to conduct analysis. The diagnosis of this study that, relatively speaking, they are irrational should not be used as the sole criterion for concluding that their distribution is irrational.
Second, the scale structure of Chinese cities is basically rational, with 68.03% of cities showing moderate or greater rationality. From the analysis of overall rationality of the scale structure of Chinese cities, 447 cities (70.78%) were seen to have moderate or greater rationality (see Table 3). This shows that the scale structure of Chinese cities is rational overall. As the urban population continues to rise, urban space continues to expand and factors of production become more and more concentrated, cities will constantly expand, with small cities becoming medium-sized cities, medium-sized cities becoming large cities and large cities becoming megacities, and differing scales of urban expansion will affect change to the rationality of the urban scale structure. Due to planning regulations and policy adjustments, this change will gradually evolve into a new pattern of rationality.
Third, the spatial structure of Chinese cities is rational overall, with 69.41% of cities showing moderate or greater rationality. From the analysis of overall rationality of the spatial structure of Chinese cities, 456 cities (69.41%) were seen to have moderate or greater rationality. This shows that the spatial structure of Chinese cities is rational overall. This rationality is influenced by historical evolution, zoning adjustments and natural conditions, and no significant change is expected to occur for a long time to come. Of course, the figures show that 77 cities are relatively irrational. In order to determine the reasons that the spatial structure of these cities is relatively irrational, it would be necessary to go to each city to conduct analysis. The diagnosis of this study that, relatively speaking, they are irrational should not be used as the sole criterion for concluding that their spatial structure is irrational.
Fourth, the functional structure of Chinese cities is rational overall, with 69.11% of cities showing moderate or greater rationality. From the analysis of overall rationality of the functional structure of Chinese cities, 454 cities (69.11%) were seen to have moderate or greater rationality. This shows that the functional structure of Chinese cities is rational overall. This rationality is influenced by changes to a city’s functional structure as well as adjustments to and transformation of the orientation of industrial development. As such, the rationality of urban functional structure is only relative and temporary, and it is subject to change as the development of cities changes.
It is necessary to point out that the results of the evaluation of rationality of the Chinese urban system made during this study are relative and temporary, and they only represent the features of the Chinese urban system in 2010. Moreover, it is not the sole criterion for determining whether their pattern is irrational. The evolution and forecasting of the rationality of the Chinese urban system based on a comprehensive diagnosis HL model of the rationality of the urban development pattern should be the focus of future research.

Acknowledgments

Great thanks are given to the National Social Science (Key grant) Fund (13&ZZD027) of China.

Author Contributions

Chuanglin Fang and Zhenbo Wang conceived and designed the research; Zhenbo Wang performed the data collection; Zhenbo Wang analyzed the data and wrote the paper; Chuanglin Fang reviewed the paper and made several comments and suggestions for revision.

Conflicts of Interest

The authors declare no conflict of interest.

References

  1. Liu, X.J.; Derudder, B.; Taylor, P. Mapping the evolution of hierarchical and regional tendencies in the world city network, 2000–2010. Comput. Environ. Urban Syst. 2014, 43, 51–66. [Google Scholar] [CrossRef] [Green Version]
  2. Chen, X.; Greene, R.P. The spatial-temporal dynamics of China’s changing urban hierarchy: 1950–2005. Urban Stud. Res. 2012, 2012. Article 162965. [Google Scholar] [CrossRef]
  3. Myint, S.W. An exploration of spatial dispersion, pattern, and association of socio-economic functional units in an urban system. Appl. Geogr. 2008, 28, 168–188. [Google Scholar] [CrossRef]
  4. Baccaini, B.; Pumain, D. Migrations in the French Urban System, 1982–1990. Population 1998, 53, 947–977. [Google Scholar] [CrossRef]
  5. Esparza, A.X.; Krmenec, A.J. Large city interaction in the US urban system. Urban Stud. 2000, 37, 691–709. [Google Scholar] [CrossRef]
  6. Osada, S. The Japanese urban system 1970–1990. Prog. Plan. 2003, 59, 125–231. [Google Scholar] [CrossRef]
  7. Zook, M.; Devriendt, L.; Dodge, M. Cyber spatial proximity metrics: Reconceptualizing distance in the global urban system. J. Urban Technol. 2011, 18, 93–114. [Google Scholar] [CrossRef]
  8. Utrilla, S.E. Recent Dynamics of the Chilean Urban System 1970–2002: Integration at a National Level. Boletin De La Asociacion De Geografos Espanoles 2012, 59, 129–150. [Google Scholar]
  9. Pogacnik, A. Proposal of changes in the urban system of Slovenia. Geodetski Vestnik 2013, 57, 97–111. [Google Scholar] [CrossRef]
  10. Tellier, L.N. Projecting the topodynamic evolution of the West-African urban system: Is West Africa heading for an “urbexplosion” or an “urbimplosion”? Can. J. Dev. Stud. 1996, 17, 405–426. [Google Scholar] [CrossRef]
  11. Robson, B.T. Growth-Centers in the European Urban System—Hall,p, Hay,d. Geogr. J. 1983, 149, 89–91. [Google Scholar]
  12. Shin, K.H.; Timberlake, M. World cities in Asia: cliques, centrality and connectedness. Urban Stud. 2000, 37, 2257–2285. [Google Scholar] [CrossRef]
  13. Gu, C.L.; Guan, W.H. Approach to urban system dynamic in China. In Proceedings of the 2005 Conference of System Dynamics and Management Science-Sustainable Development of Asia Pacific, Shanghai, China, 4–6 November 2005; pp. 193–196.
  14. Limtanakool, N.; Schwanen, T.; Dijst, M. Developments in the Dutch urban system on the basis of flows. Reg. Stud. 2009, 43, 179–196. [Google Scholar] [CrossRef]
  15. Coffey, W.J.; Shearmur, R.G. The growth and location of high order services in the Canadian urban system, 1971–1991. Prof. Geogr. 1997, 49, 404–418. [Google Scholar] [CrossRef]
  16. O'Donoghue, D. The relationship between diversification and growth: Some evidence from the British urban system 1978 to 1991. Int. J. Urban Reg. Res. 1999, 23, 549–566. [Google Scholar] [CrossRef]
  17. Agnew, J. The Italian urban system: Towards European integration. Urban Stud. 2000, 37, 1215–1217. [Google Scholar]
  18. Johnston, R.; Poulsen, M.; Forrest, J. Ethnic residential segregation across an urban system: The Maori in New Zealand, 1991–2001. Prof. Geogr. 2005, 57, 115–129. [Google Scholar] [CrossRef]
  19. Tonts, M.; Taylor, M. Corporate location, concentration and performance: Large company headquarters in the Australian urban system. Urban stud. 2010, 47, 2641–2664. [Google Scholar] [CrossRef]
  20. Ante, U. Areas of the Knowledge Economy—Implocationf for the German urban system. Plan. Rev. 2011, 47, 91–92. [Google Scholar]
  21. Cladera, J.R.; Bergada, M.M.; Ramos, B.A. The urban system in Spain. Scripta Nova-Revista Electronica De Geografia Y Ciencias Sociales 2012, 16, 1–20. [Google Scholar]
  22. Ma, X.L.; Timberlake, M. World city typologies and national city system deterritorialisation: USA, China and Japan. Urban Stud. 2013, 50, 255–275. [Google Scholar] [CrossRef]
  23. Zhou, S.Y.; Dai, J.C.; Bu, J.H. City size distributions in China 1949 to 2010 and the impacts of government policies. Cities. 2013, 32, S51–S57. [Google Scholar] [CrossRef]
  24. Xu, Z.L.; Zhu, N. City size distribution in China: Are large cities dominant? Urban Stud. 2009, 43, 2159–2185. [Google Scholar]
  25. Song, S.F.; Zhang, K.H. Urbanisation and city size distribution in China. Urban Stud. 2002, 39, 2317–2327. [Google Scholar] [CrossRef]
  26. Luckstead, J.; Devadoss, S. A comparison of city size distributions for China and India from 1950 to 2010. Econ. Lett. 2014, 124, 290–295. [Google Scholar] [CrossRef]
  27. Xu, X.L.; Min, X.B. Quantifying spatiotemporal structures of urban expansion in China using remote sensing data. Cities. 2013, 35, 104–113. [Google Scholar] [CrossRef]
  28. Liu, J.; Zhang, Q.; Hu, Y. Regional differences of China’s urban expansion from late 20th to early 21st century based on remote sensing information. Chin. Geogr. Sci. 2012, 22, 1–14. [Google Scholar] [CrossRef]
  29. Tian, G.J.; Liu, J.Y.; Zhang, Z.X. Urban functional structure characteristics and transformation in China. Cities. 2002, 19, 243–248. [Google Scholar] [CrossRef]
  30. Zhou, Y.X.; Bradshaw, R. The classification of industrial function of Chinese (including attached counties): Theory, method and results. Acta Geogr. Sin. 1988, 43, 287–298. [Google Scholar]
  31. The State Council. National Major Function Zoning; The State Council Article No. 46 in 2010; The State Council: Beijing, China, 2010. (In Chinese) [Google Scholar]
  32. Zipf, G.K. Human Behaviour and the Principle of Least Effort; Addison-Wesley: Cambridge, MA, USA, 1949. [Google Scholar]
  33. Sheather, S.J. Density estimation. Stat. Sci. 2004, 19, 588–597. [Google Scholar] [CrossRef]
  34. Lu, S.S.; Guan, X.L.; Wang, Z.B.; Song, C. Spatial field of the Yangtze River Delta Economic Zone: An application of regional accessibility and data field. Geogr. Res. 2013, 32, 295–306. [Google Scholar]
  35. Wang, B.; Zheng, Q.H.; Guo, H. Economic Value Assessment of Forest Species Diversity Conservation in China Based on the Shannon-Wiener Index. For. Res. 2008, 21, 268–274. [Google Scholar]

