Article

An Evaluation of Holistic Sustainability Assessment Framework for Palm Oil Production in Malaysia

1
Faculty of Engineering and Science, Curtin University, Miri 98009, Sarawak, Malaysia
2
Sustainable Engineering Group, Curtin University, Perth WA 6845, Australia
*
Author to whom correspondence should be addressed.
These authors contributed equally to this work.
Sustainability 2015, 7(12), 16561-16587; https://doi.org/10.3390/su71215833
Submission received: 27 October 2015 / Revised: 6 December 2015 / Accepted: 10 December 2015 / Published: 16 December 2015

Abstract

:
Palm oil based biodiesel offers an alternative energy source that can reduce current dependence on conventional fossil fuels and may reduce greenhouse gas (GHG) emissions depending on the type of feedstock and processes used. In the Malaysian context, the palm oil industry not only provides high-yield, renewable feedstock to the world, it brings socio-economic development to the Malaysian rural community and contributes to the national income. However, the sustainability of palm oil remains controversial, due to deforestation, pollution and social conflicts associated with its production. Sustainability assessment is vital for the palm oil industry to identify weaknesses, improve its sustainability performance and improve consumer confidence. This paper proposes a holistic sustainability assessment framework for palm oil production with the aim to address the weaknesses of existing palm oil sustainability assessment methods. It identifies environmental, social and economic Headline Performance Indicators, Key Performance Indicators and their Performance Measures in crude palm oil production in a structured framework. Each quantitative/semi-quantitative performance measure is translated into Likert Scale of 1–5, where 3 is the threshold value, 5 is the ideal condition, and 1 is the worst case scenario. Calculation methods were established for the framework to provide quantitative assessment results. The framework was tested using a hypothetical example with data from existing studies. The results suggest that crude palm oil production in Malaysia is below the sustainability threshold. Evaluations of this sustainability assessment framework also demonstrate that it is a comprehensive assessment method for assessing sustainability of feedstock for biofuel production.

1. Introduction

Malaysia is known as the major palm oil producer in the world. The palm oil industry stands as the fourth largest contributor to the nation’s economy and contributes to 6.4% of gross national income [1,2]. The palm oil industry creates job opportunities, alleviates poverty and improves healthcare as well as education in rural areas [3]. Oil palm has been recognized as a high-yield oil tree compared to other feedstocks. The versatility of palm oil in oleo-chemical applications, food and biofuel production has also led to rapid growth of this industry.
Whilst palm oil could offer sustainability benefits by improving Malaysia’s socio-economic and environmental conditions, these industries have been criticized particularly by international pressure groups, including Greenpeace, Rainforest Action Network and World Wildlife Fund (WWF) for current unsustainable production practices that has led to deforestation, increased greenhouse gas (GHG) emissions, and the loss of biodiversity [4]. There is also a pressure from environmentally conscious consumers for palm oil industries to achieve sustainability criteria [4,5,6]. Hence, there is a need for a holistic sustainability assessment method for palm oil production in order to identify the area of strengths and weaknesses, which will enable decision makers to improve the supply chain sustainability practices, and hence offer more confidence to the consumers.
Sustainable palm oil production is defined as the production that protects the natural environment, promotes intra and inter-generational equity, while enhancing commercial operations, and sharing economic growth with the local community through employment and fair trade, following Lim et al. [7,8,9].
A thorough review of literature published to date suggests that this aforementioned definition could substantially strengthen the framework for assessing sustainability of Malaysian palm oil industries [10,11,12,13,14,15,16,17,18,19,20]. Existing sustainability assessment that involves a number of assessment methods including Life Cycle Assessment, measurement of palm oil sustainability standards and certification schemes have not adequately addressed the sustainability of Malaysian palm oil production due to the following reasons [16,21,22]: the absence of Triple Bottom Line (TBL) assessment, use of ambiguous or unmeasurable indicators (e.g., Criterion 6.11 of Roundtable on Sustainable Palm Oil (RSPO) principles would require growers and millers to contribute to local sustainable development as “wherever appropriate”, while the indicator is “demonstrable contribution to local development that are based on the results of consultation with local community”. However, there is no clear measure on how they should contribute, and to what level these contributions should be considered as “appropriate” and “demonstrable”), lack of relevant sustainability indicators (e.g., RSPO excludes banning of plantation on peatlands and high carbon stock forests, as well as the impact of deforestation that took place before November 2005), greenwashing, and incompliance with import regulations [4,7,23] are some of the weaknesses in existing sustainability assessment methods for palm oil production.
Apart from the aforementioned weaknesses of the existing sustainability assessment methods, there are some other factors that have impeded the successful application of sustainability assessment frameworks (e.g., the perceived complexity associated with sustainability assessment by the industrial stakeholders including plantation companies and millers) [24], the hurdle to obtain a large number of information for determining useful indicators [25], lack of knowledge in sustainability aspects, i.e., economics, environmental and social science and analytical ability to interpret the indicators and results [26,27,28], and finally the involvement of time and cost in the detailed assessment process. Therefore, a user-friendly framework is necessary not only to overcome the aforementioned weaknesses and gaps of sustainability assessment in the context of palm oil production, but also to encourage wider application of self-examination on sustainability performance among the stakeholders, thus closing the “research–implementation gap” [29].
This paper presents the development and implementation of a holistic sustainability assessment framework for palm oil production in Malaysia. Firstly, various models of a sustainability assessment framework have been evaluated. Secondly, the development of a sustainability assessment framework consisting of social, economic and environmental indicators relevant to the contexts of palm oil production in Malaysia has been discussed. Thirdly, information about crude palm oil production based on national statistics and other existing research has been used to test the applicability of the framework. Fourthly, the formulae for calculating the assessment results have been presented as part of testing the framework. Finally, the sustainability assessment framework has been analysed using TBL indicators.

2. Theoretical Framework of Palm Oil Sustainability Assessment

2.1. Sustainability Assessment and Its Purpose

Sustainability assessment is commonly defined as a tool to identify, predict and evaluate potential environment, social and economic impacts of an initiative to assess sustainability [30]. The assessment will identify barriers to achieve sustainability and, accordingly, it will propose the best available options for planning and decision making [31].

2.2. Various Frameworks of Sustainability Assessment

Various sustainability assessment frameworks have been proposed from different contexts. Since sustainability assessment is aimed to examine the implication of an initiative to attain “sustainability”, the concepts as well as approaches of these frameworks vary with the definitions of sustainability.

2.2.1. Weak vs. Strong Sustainability

The existing sustainability approach is grounded on two major schools of thoughts where one promotes a “weak sustainability” approach or social, economic and environmental bottom lines are treated with equal importance [9]. On the other hand, the Federal Office for Spatial Planning of Switzerland believes that sustainability assessment should identify imbalances and deficiencies between environmental, social and economic dimensions, in order to optimise the benefits and attain long-term equilibrium between these three dimensions. Trade-offs are permitted between three dimensions, provided that the basic social, economic and environmental requirements are met [30]. A similar approach is used in the studies of Devuyst for transportation management plans [31] and Kucukvar for the construction industry [32].
Pope et al. however, warned of taking such a sustainability assessment approach without critical debate as it might overly promote the prevailing economic agenda and undermine the environmental factors [33]. This echoes a strong sustainability approach which is the second school of thought, as defined as “Sustainable development comprises various types of economic and social development that protect and enhance the natural environment and social equity” [9]. In this concept, natural resources are finite, and therefore sustainability means finding a way to live within the carrying capacity of natural systems and this considers both inter- and intra-generational equity where the latter is aimed at achieving social equality. A similar principle was applied by Ekins et al. where maintenance of critical natural capital is regarded as a priority [34], rather than man-made capital and the built environment.
The sustainability assessment framework varies with the concept adopted. It affects the approach, determination of assessment structure, evaluation of methods and, hence, the outcome of the assessment process. Thus, the conceptual framework of the current research is based on the strong sustainability concept that is ecosystem focused, as it takes into account biophysical limits, social equity and eco-sufficiency.

2.2.2. Three Categories of Sustainability Assessments

Ness et al. categorize sustainability assessment into three approaches, i.e., indicators/indices, product-related assessment and integrated assessment [35]. Indicator approaches use sets of qualitative dimensions which could be aggregated into quantifiable measures that assess sustainability in the form of index [35]. It is simple, easy to understand, and flexible in allowing integration of different sustainability elements.
Product-related assessments are usually more focused on one facet of sustainability, e.g., life cycle assessment that focuses on overall environmental impact of a specific product, life cycle cost analysis that evaluates the financial impact and product material/energy analysis that measures only the material/energy consumption. It provides quantitative results based on specific and thorough evaluation, but on the other hand, it usually involves a large data set and is limited to certain sustainability elements.
To incorporate a deeper and broader scope of sustainability elements [36], integrated assessments are introduced as the third type of approach. Integrated assessment combines two or all three sustainability elements. It includes the qualitative assessment, e.g., conceptual modelling that presents the relationships between different elements in the form of flow diagrams, flow charts, or causal loop diagrams [35,37], and Multi-Criteria Analysis (MCA) that allows evaluation of competing criteria such as the assessment approach used in RSPO certification. Integrated assessment could also be quantitative, e.g., hybrid of LCA with Environmental Impact Assessment (EIA), Input Output Life Cycle Assessment (IOA) and other methods [38] and remodeling of other elements, i.e., economic and social aspects, into LCA [39].

2.2.3. The Circular, Triangular and Network Structure

As sustainability assessment involves complex concepts and utilizes data, the assessments are usually presented in a matrix or diagram with different structures. The sustainability indicators and their relationship with different elements of sustainability could be presented in three types of structures, i.e., circular, triangular and network.
For a circular structure, a circle is divided into segments that represent each dimension, and each segment is further divided into smaller segments where each smaller segment represents a sustainability indicator. Performance of each indicator could be rated based on a quantitative or qualitative Likert scale. The results could therefore be presented in a spider-web diagram that is easy to interpret. For example, a circular structure is used in sustainability assessments for urban planning [40] and social sustainability assessments [41] (Figure 1).
Figure 1. Circular structure for sustainability assessment [40,41].
Sustainability 07 15833 g001
A triangular structure is another arrangement commonly applied in sustainability assessments, where a number of indicators are aggregated from several criteria to form the base of the triangle, while the criteria are aggregated from each sustainability dimension (Figure 2). Such a structure allows more than two levels of aggregation, and is more suitable for complex assessment with more indicators. It allows traceability and analysis as to how results of each indicator affect the relevant criteria and dimension. This is a widely accepted structure used in sustainability assessments [42] as well as in formulation of sustainability strategies [30].
Figure 2. Triangular structure for sustainability assessment [30].
Sustainability 07 15833 g002
Network structure is applied comparatively less commonly. It is presented in the form of a flow chart or interlinked diagram to incorporate system complexity through modelling interaction among sustainability indicators (e.g., Figure 3) [43]. Network structure is powerful in presenting complex conceptual assessments but is less desired in cases where quantitative results are needed.
Figure 3. An example of network structure for sustainability assessment [43].
Sustainability 07 15833 g003
The current sustainability assessment framework thus considers a triangular approach as it is suitable to handle the complexity that is particularly required for the Malaysian palm oil industry to address sustainability challenges including social, economic and environmental objectives as discussed in the previous section.

2.3. Description of the Selected Assessment Framework

The framework of sustainability assessment for crude palm oil production addresses the three principle objectives or dimensions of TBL—environmental, economic and social. The economic objective ensures business sustainability in all the phases of the life cycle of the product or services. The social objective consists of inter-generational and intra-generational equity. The principle of inter-generational equity states that the development must meet the needs of present and future generations. Intra-generational equity, on the other hand, refers to equity in wellbeing (or quality of life) between current generations, concerning human development aspects of sustainable development. The environmental objective focuses on minimizing environmental impacts and resource scarcity throughout the product life cycle. Accordingly, the proposed sustainability framework will assess the social, economic and environmental indicators of the proposed sustainable palm oil production.
The framework is developed based on a strong sustainability concept, where environmental conservation and social equity are of utmost priority. To consider all dimensions of TBL in the assessment and to enable quantitative measurement and easy application, an integrated approach using multi-criteria analysis with indicators/indices is selected. The indicators, criteria and dimensions will be arranged in the triangular structure, similar to the approach followed by IISD (2002) and van Berkel et al. (2008) [44,45].
Figure 4. Sustainable palm oil assessment framework [44] (the HPI, KPI and PMs have been numbered for testing purposes in the following section).
Sustainability 07 15833 g004
The sustainable palm oil assessment framework is as shown in Figure 4. Each TBL objective consists of a number of headline performance indicators (HPI). These indicators are the highest aggregation level for the performance measurement against sustainability objectives. Each HPI is then aggregated into key performance indicators (KPI) which further describe key impact areas of each HPI with respect to palm oil production that could foster or impede the achievement of each sustainability objective. The performance measures (PM), which are the lowest level of aggregation, are established to give quantitative values that could contribute to each KPI [44]. The advantage of using this structure is to enable establishment of specific indicators for field measurements without losing sight of broader sustainability objectives. On the other hand, even though the overall sustainability performance would be assessed under a single umbrella matrix and involve multi-criteria assessment, the framework will ensure that the strong sustainability principles are maintained by openly checking each level of aggregation, and of course by appropriately selecting HPIs, KPIs, and PMs.

2.4. Selection of Indicators: HPI, KPI and PM

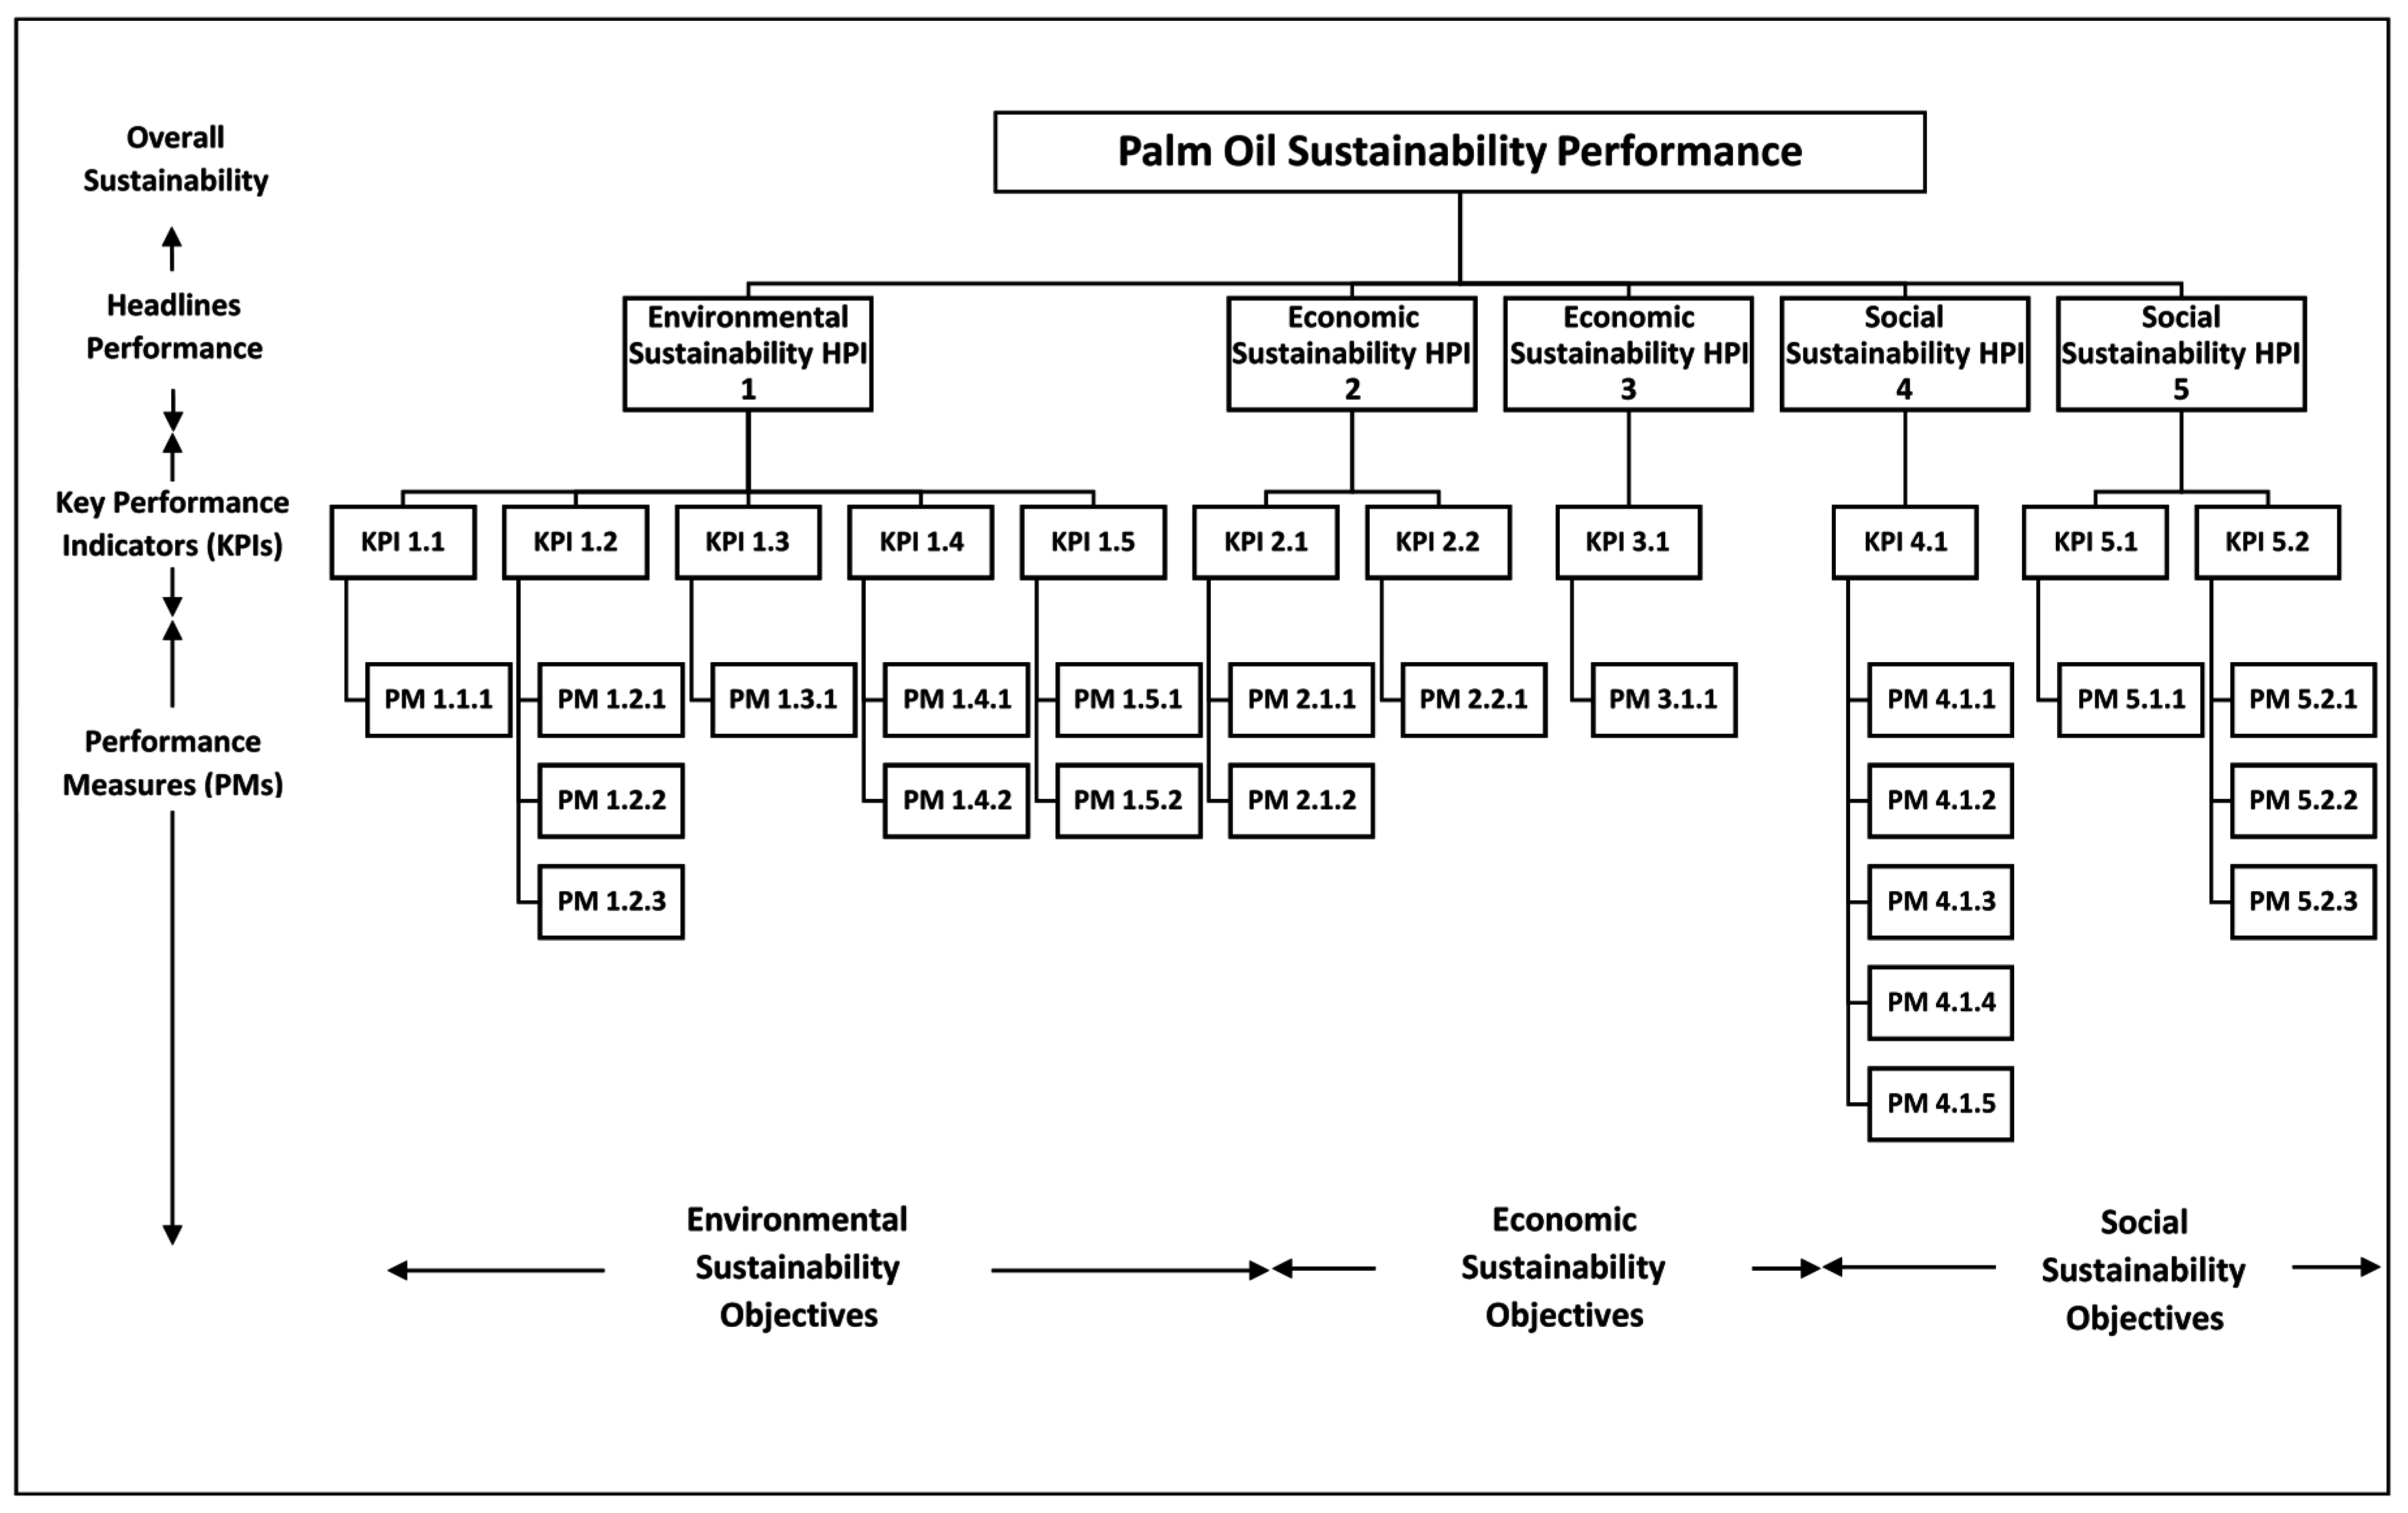
As discussed, the HPIs are at the highest aggregation level of performance measures and, hence, should reflect fundamental principles of sustainability. The HPIs are chosen from classic definitions of sustainability and scholarly research on environment, social and economic sustainability.
KPIs are identified from commonly accepted pointers that refer to each HPI. They are nominated after filtering through sustainability reports and literature published by policy makers and researchers. PMs are then selected to address each KPI in the context of palm oil production, referring to palm oil sustainability standards, literature, government authorities’ requirements, national statistics, and industrial practices.
There are other means of gathering suitable indicators for sustainability assessment, e.g., a participatory approach that involves substantial participation of stakeholders [46], a valid scientific approach [47], integration in the political process [48], and by interviewing experts [49]. As the main purpose in this paper is to test the feasibility of the sustainability assessment framework, the process of selecting indicators is deliberately simplified through literature review for demonstration purposes.

2.4.1. HPI, KPI and PM for Environmental Sustainability Objectives

According to Brundtland’s Report [8], human intervention in the natural system during the course of development must be at a minimum level, not endangering the natural system that supports life on earth. Ekins [50] defines environmental sustainability as “the maintenance of important environmental functions, and hence the maintenance of the capacity of the capital stock to provide those functions”. In both definitions, “1. Natural capital conservation” has been seen as an ultimate indicator in determining environmental sustainability. This is also in agreement with the European Commission’s basis [51] of their environmental policies and laws, i.e., preservation of natural capital. WWF for Nature, IUCN and UNEP’s definition in building strategy of sustainable living, that is to live within the carrying capacity of the supporting ecosystem [52], also presents natural capital as the key important indicator and takes on a “throughput” based approach rather than a “utility” based approach [53]. The former takes into account the bio-physical limit for any development activity while the latter considers the choice of available alternative sources, either fossil or renewable sources, to maintain economic growth.
The natural capital can be categorized into four main aspects [8,50,52,54,55]:
  • Elements, i.e., climate, quality of air, water that contribute to the ecosystem’s overall integrity and functions of ecosystem services.
  • Biodiversity, conservation of all species of plants, animals and other organisms.
  • Renewable resources, e.g., soil, forest, cultivated land and fish stocks that replenish at natural rate.
  • Non-renewable resources e.g., fossil fuel and minerals that deplete over time.
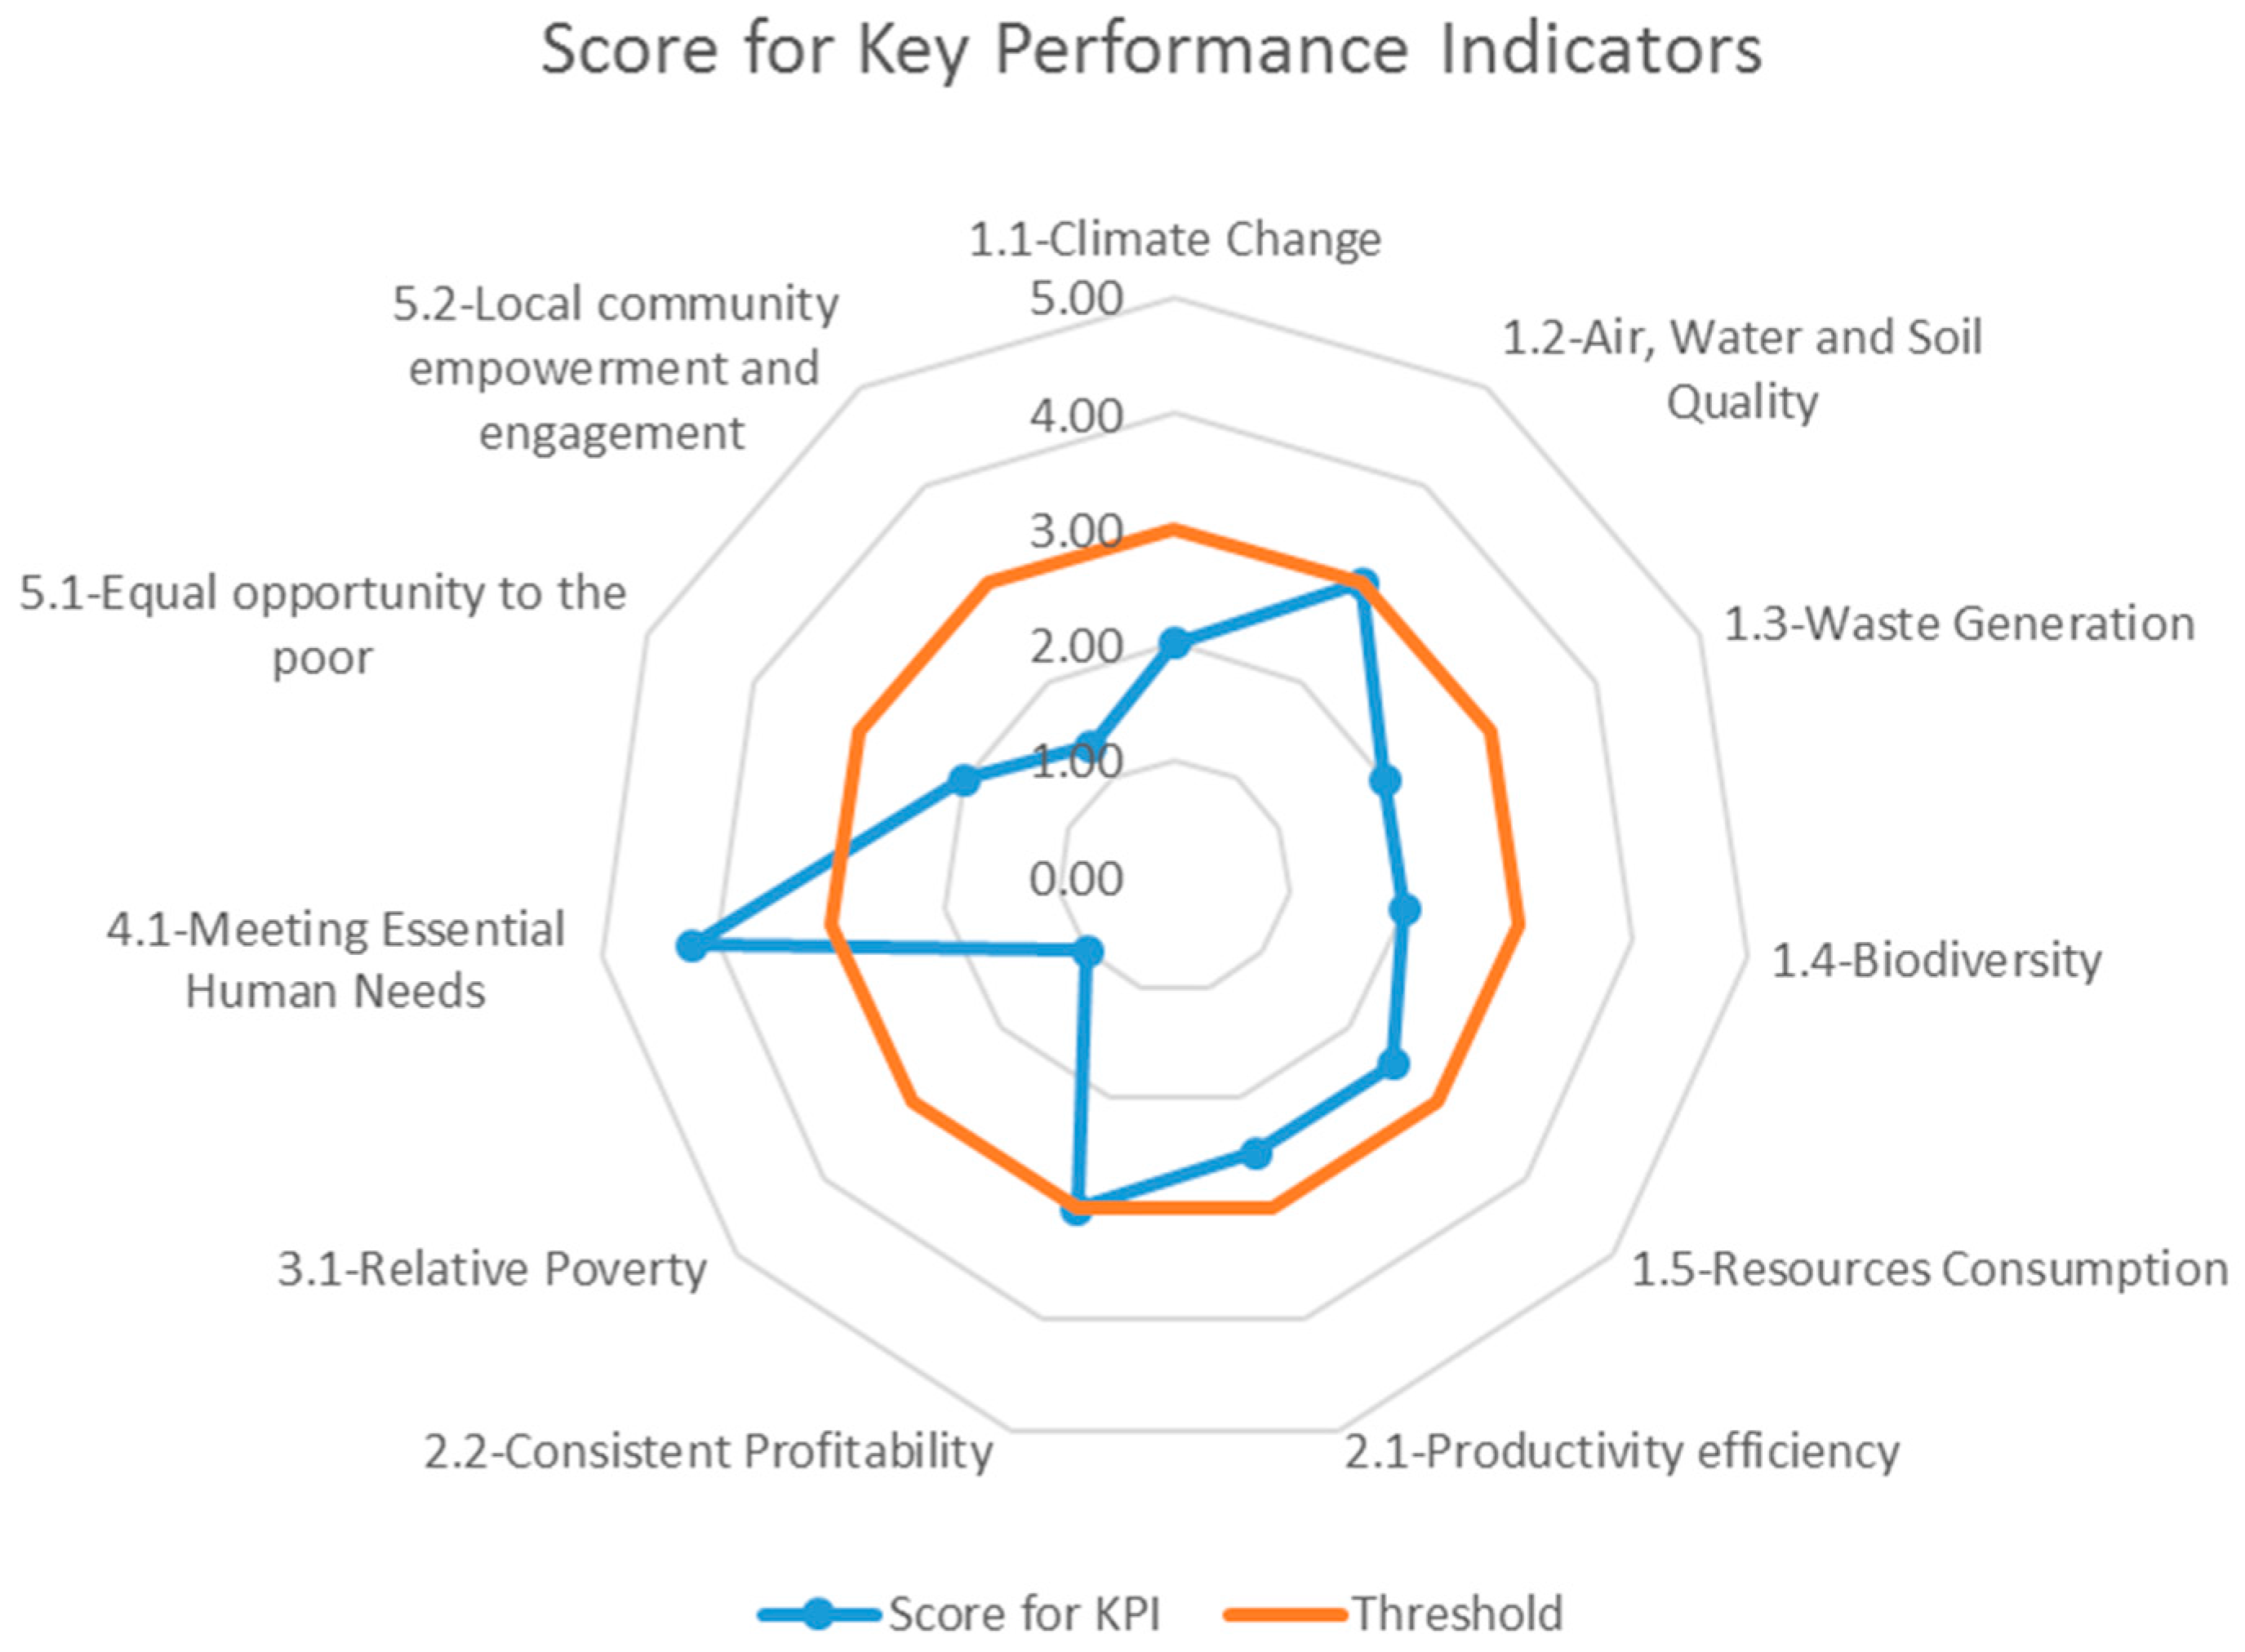
Following these four aspects of natural capital, KPIs for environmental sustainability have thus been developed, including “1.1 Climate change”, “1.2 Air, water and soil quality”, “1.3 Waste generation”, “1.4 Biodiversity” and “1.5 Resources consumption”. 
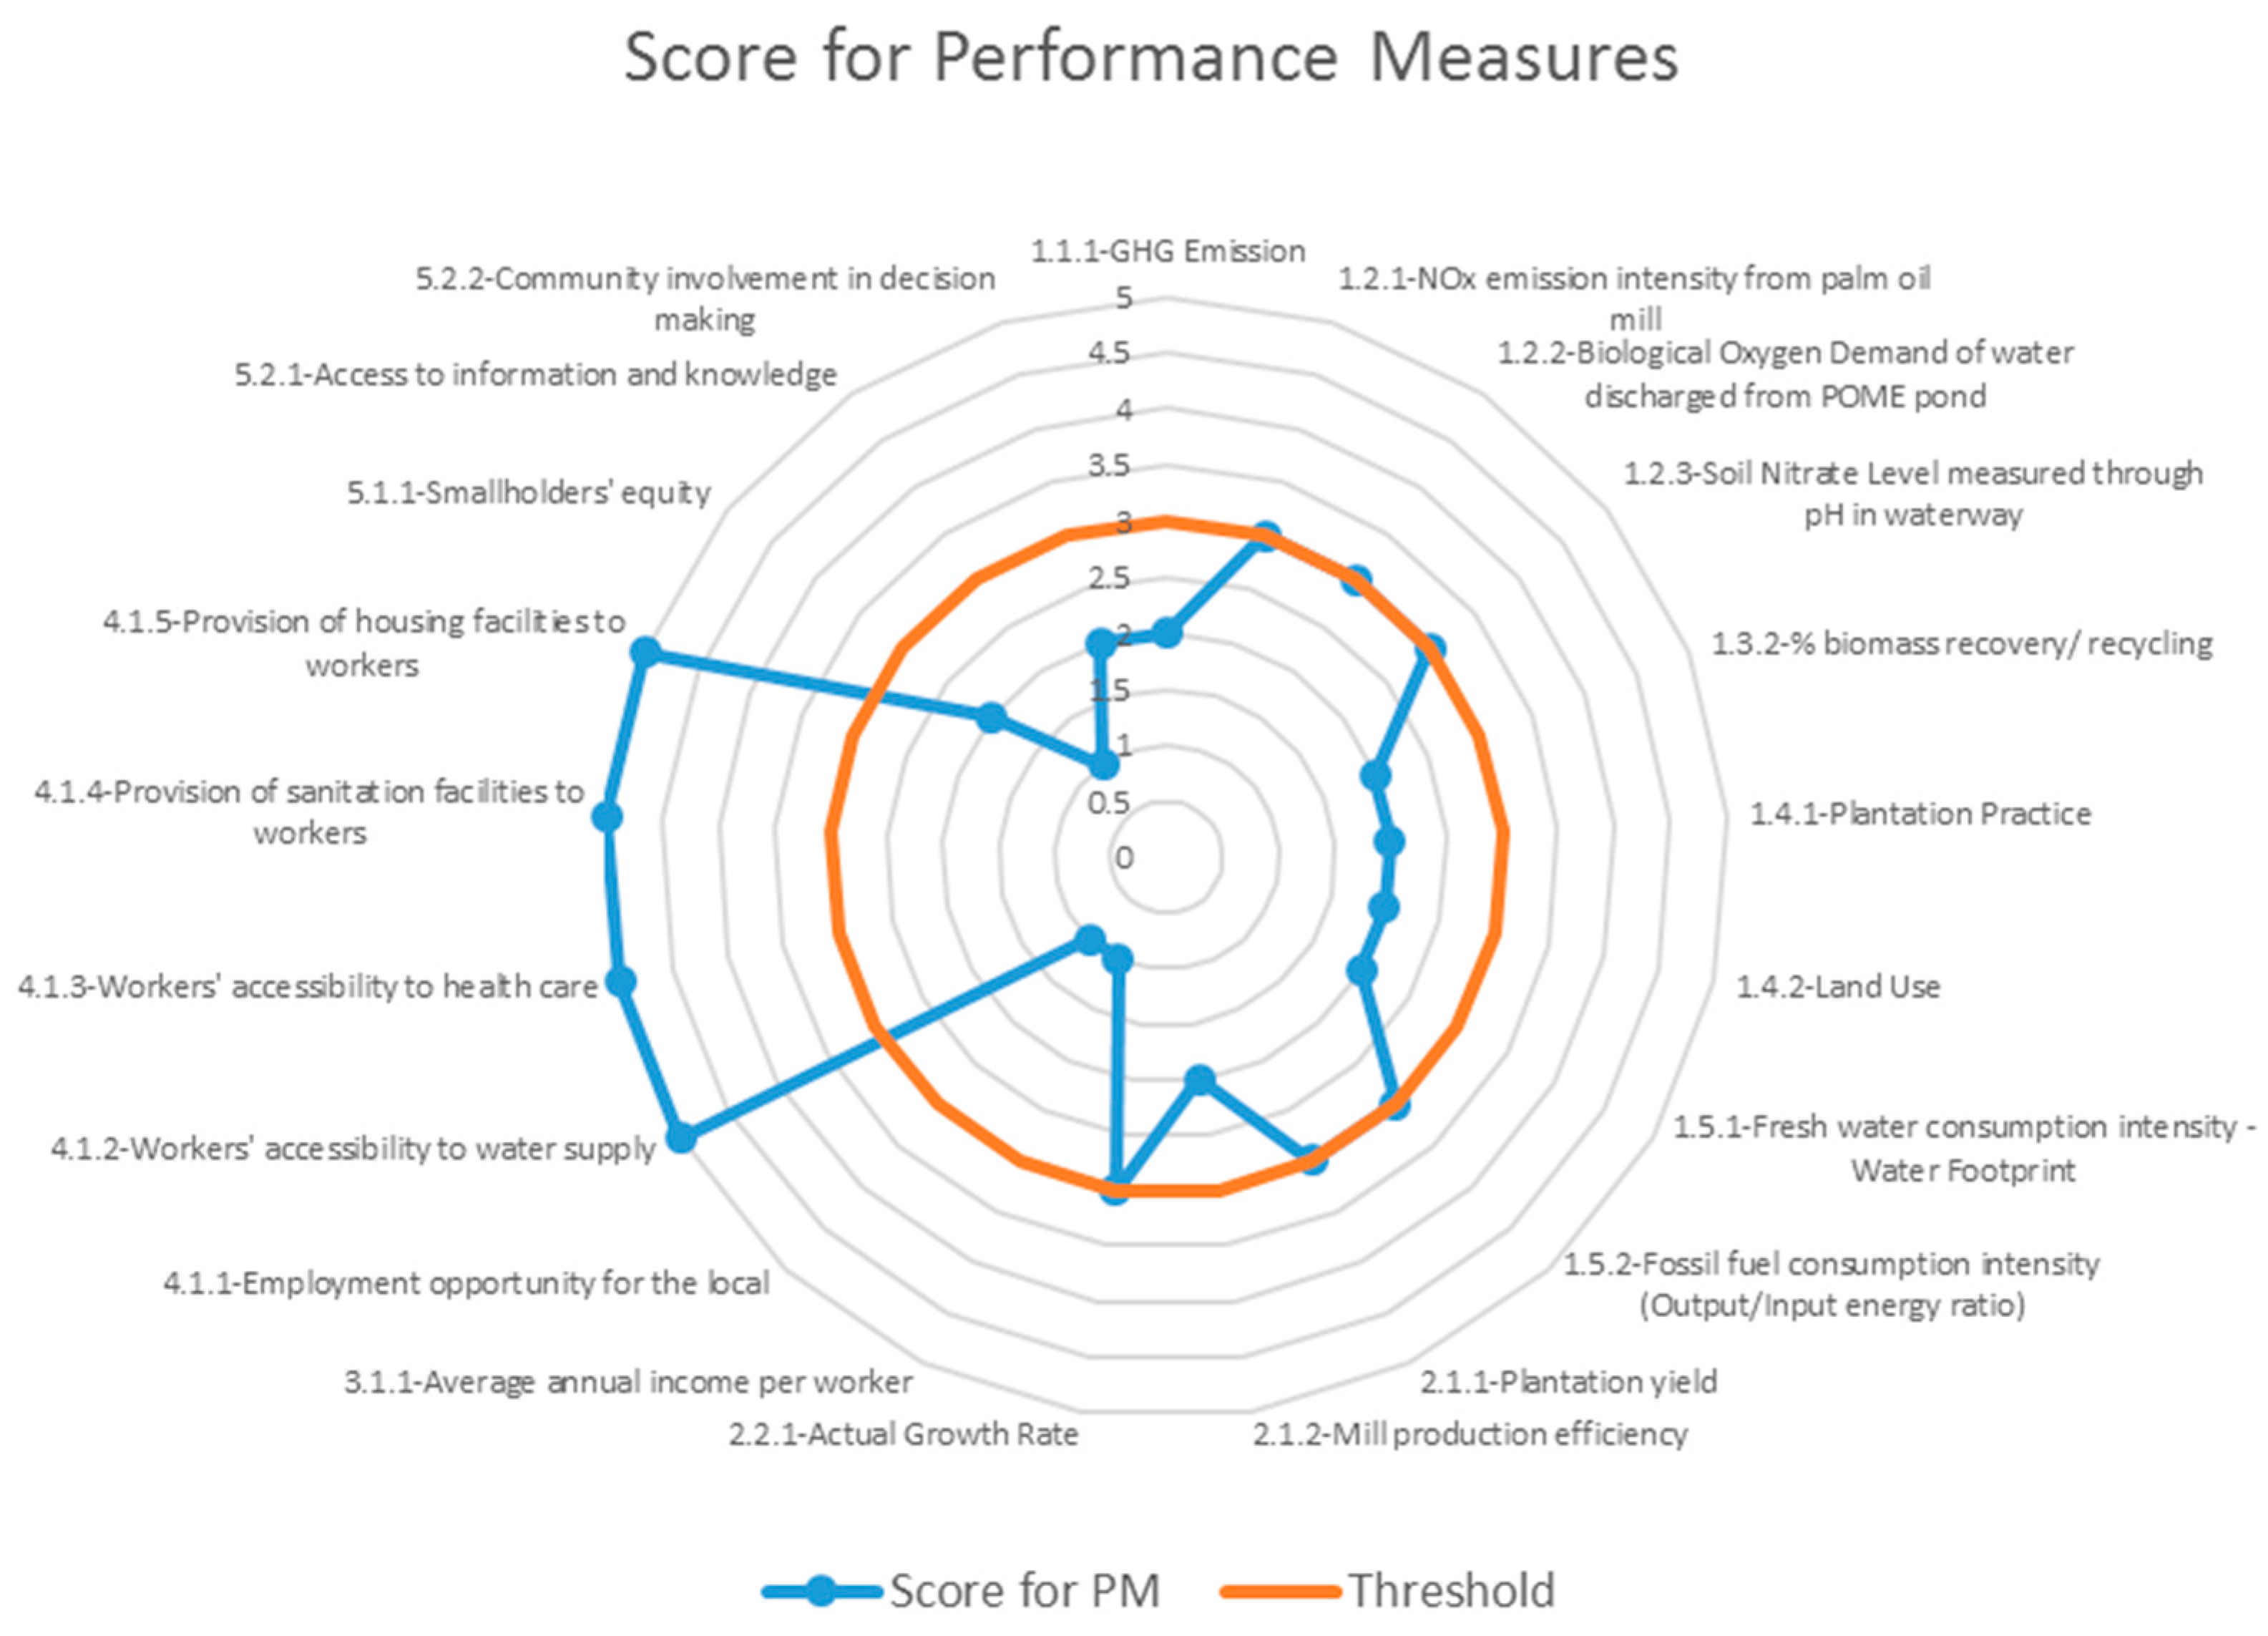
Table 1 shows the performance measures (PMs) for each of these KPIs related to palm oil production.
Table 1. HPI, KPI and PM for environmental sustainability objectives.
Sustainability Objective: Environment
Headline Performance Indicator 1: Natural Capital Conservation
Key Performance IndicatorPerformance MeasuresRanking Value
1.1Climate Change1.1.1GHG Emission1> 1 tCO2eq/tonne CPO
2> 0.8 tCO2eq/tonne CPO
30.5–0.8 tCO2eq/tonne CPO
4< 0.50 tCO2eq/tonne CPO
5< 0.15 tCO2eq/tonne CPO
1.2Air, Water and Soil Quality1.2.1NOx emission intensity from palm oil mill1>400 mg/m3 emission (continuous)
2>350 mg/m3 emission (continuous)
3<350 mg/m3 emission (continuous)
4<200 mg/m3 emission (continuous)
5<100 mg/m3 emission (continuous)
1.2.2Biological Oxygen Demand of water discharged from POME pond1>150 mg/L (3 days, 30 degC)
2>100 mg/L (3 days, 30 degC)
3<100 mg/L (3 days, 30 degC)
4<50 mg/L (3 days, 30 degC)
5<25 mg/L (3 days, 30 degC)
1.2.3Soil Nitrate Level measured through nitrogen in waterway1Total nitrogen >300 mg/L
2Total nitrogen >200 mg/L
3Total nitrogen <200 mg/L
4Total nitrogen <100 mg/L
5Total nitrogen <50 mg/L
1.3Waste Generation1.3.2% biomass recovery/ recycling 1<25% recovery
2>25% recovery
3>50% recovery
4>75% recovery
5100% recovery
1.4Biodiversity1.4.1Plantation Practice1Replacement of forest
2Total/large area replanting
3Increase heterogeneity through patch planting
4Increase connectivity through successive strips/ connectivity
5Reduce severity of disturbance through variable rotation
1.4.2Land Use1Planted on Peat Land/HCVF
2Planted on secondary forest/replaced other crops
3Replanting on agricultural land
4Replanting with Best Management Practice
5Replanting with agricultural intensification
1.5Resources Consumption1.5.1Fresh water consumption intensity—Water Footprint1> 85 m3/GJ
2>75 m3/GJ
362 m3/GJ
4<62 m3/GJ
5<50 m3/GJ
1.5.2Fossil fuel consumption intensity (Output/Input energy ratio)1<7
2<9
39
4>10
5>12
“1.1 Climate change” has been chosen as one of the KPIs because it could threaten ecosystem functions by causing changes in rainfall distribution, extreme weather, drought, floods, soil–water balance, new pests and diseases [56]. Most importantly, this is one of the key environmental criterion for exporting palm oil to European and North American countries [57,58]. The PM “1.1.1 Greenhouse Gases (GHG) emissions” predominantly resulting from agriculture and fossil fuel combustion could intensify the natural greenhouse effect and cause temperature rise [59]. The palm oil production involves large scale agricultural activities and milling processes that emit GHGs from fossil fuel combustion, open burning for land clearing [60], decomposition of agricultural waste (i.e., CH4 emissions) [61,62] and inorganic nitrogen fertilizers’ application (i.e., N2O emissions) [62] that result in the increase of GHG emissions.
“1.2 Air, water and soil quality” together forms a KPI as they are required to achieve a healthy ecosystem. Among the three performance measures which were used in WHO Air Quality Guidelines [63], including airborne particulate matter, Sulfur Dioxide (SOx) emission intensity and Nitrogen Dioxide (NOx) emission intensity, “1.2.1 NOx emission intensity” has been selected as a performance measure as these are pre-dominant air pollutants emitted from palm oil mills’ boilers and forest/peatland/ plantation burning for land clearing.
An uncontrolled discharge of Palm Oil Mill Effluent (POME) to the waterway has been gradually increasing the water pollution in Malaysia over the last four decades. The Malaysian Environmental Quality Regulations have since outlined nine indicators and set standards for POME discharge [64]. These indicators are Bio-chemical Oxygen Demand (BOD), Chemical Oxygen Demand (COD), Total Solid (TS), Suspended Solid, Oil and Grease, Ammoniacal Nitrogen, Total Nitrogen, pH and Temperature. Among all, “1.2.2 BOD of water discharged from POME pond” has been selected as the performance measure for water quality control in this framework due to its common application and robustness in measuring pollution caused by both organic and inorganic matter [65].
Maintaining organic content and nutrients in soil and controlling soil erosion could assist in maintaining the fertility of agricultural land. Soil quality can be measured in terms of biological, chemical and physical performance [66]. PMs that can be selected for biological attributes are soil respiration and earthworm activity. Physical characteristics of soil quality are measured using soil infiltration, soil bulk density and aggregate stability while soil nitrate level, pH and salt concentration are measured for determining the chemical characteristics of soil [67]. “1.2.3 Soil Nitrate Level” that results from the overuse of N- fertilizer in palm oil plantations to sustain commercial operations has thus been selected as the key PM for soil quality.
In the case of the palm oil production process, a large volume of solid, chemical and biological wastes is generated [68]. Solid waste generation and management are important PMs of environmental control to satisfy both domestic and international standards [59,69]. The biomass solid waste that was generated throughout the milling process is the main concern in the palm oil industry. Whilst palm oil mills apply 3Rs strategies, including reuse, recycle and regeneration for converting these solid waste to resources, there is still a significant amount of this waste that remains unutilized increasing the landfill area. Hence, “1.3.1 Biomass recovery rate” has been considered as one of the key PMs in this study. Chemical wastes which are emitted to the air and water are measured indirectly through air and water quality indicators.
“1.4 Biodiversity” which means the richness of variety of species interacting with each other to establish a stable food chain and to maintain ecological balance [70] is important natural capital for future generations [8]. The PM that is commonly used by biologists for biodiversity is the number of endangered species/number of known species ratio in palm oil plantations and production areas [71]. However, the difficulty associated with data collection for this PM would make it challenging for the palm oil industry to conduct sustainability assessments [72,73]. Hence, “1.4.1 Plantation practice”, and “1.4.2 Land-use for plantation”, which have direct impact on biodiversity and are easily measured, have been selected as PMs. Land-use pattern (e.g., replantation, farmland replacement), high conservation value (HCV), forest replacement, and plantation on peat land will have different levels of impact on biodiversity [69,74]. Plantation practices that minimise disturbance to existing landscape and create a stable microclimate have also been proven to have different impacts on biodiversity [75].
The other KPI that measures the conservation of natural capital is “1.5 Resources consumption”. Renewable resources should be consumed at a rate that the nature could cope with, and if there is sufficient effort in harnessing them. Non-renewable resources are limited and irreversible and, hence, their consumption should be minimised in order to ensure that the resources do not run out before substitutes are available [8,52]. Two major resources, i.e., “1.5.1 Fresh water consumption in terms of water footprint” and “1.5.2 Fossil fuel consumption (Output/Input Energy Ratio)”, have been chosen as the PMs for this KPI.

2.4.2. HPI, KPI and PM for Economic Sustainability Objectives

The economic pillar of sustainability is often perceived as monetary income and profit. This perception is narrowly focused. A sustainable economic activity has to remain profitable for a long period of time, in order to be able to “stay in business” [76] and maintain social equity. Whilst monetary value is not the only economic pillar of sustainability, it is something that a business needs to maintain a healthy balance sheet and has the ability to withstand any financial shock to sustain its operation. This is commonly measured as “business continuity and resiliency” in economic studies [77,78].
Besides sustaining the business, economic sustainability has greater depth in its meaning which is to increase productivity potential to “meet human needs” and to “ensure equitable opportunities”. The Brundland’s report says that sustainable development requires a change in the content of growth rather than growth itself [8]. Economic growth shall also bring upon positive changes to the society in meeting its essential needs, and empower the community with an ability to change their lives.
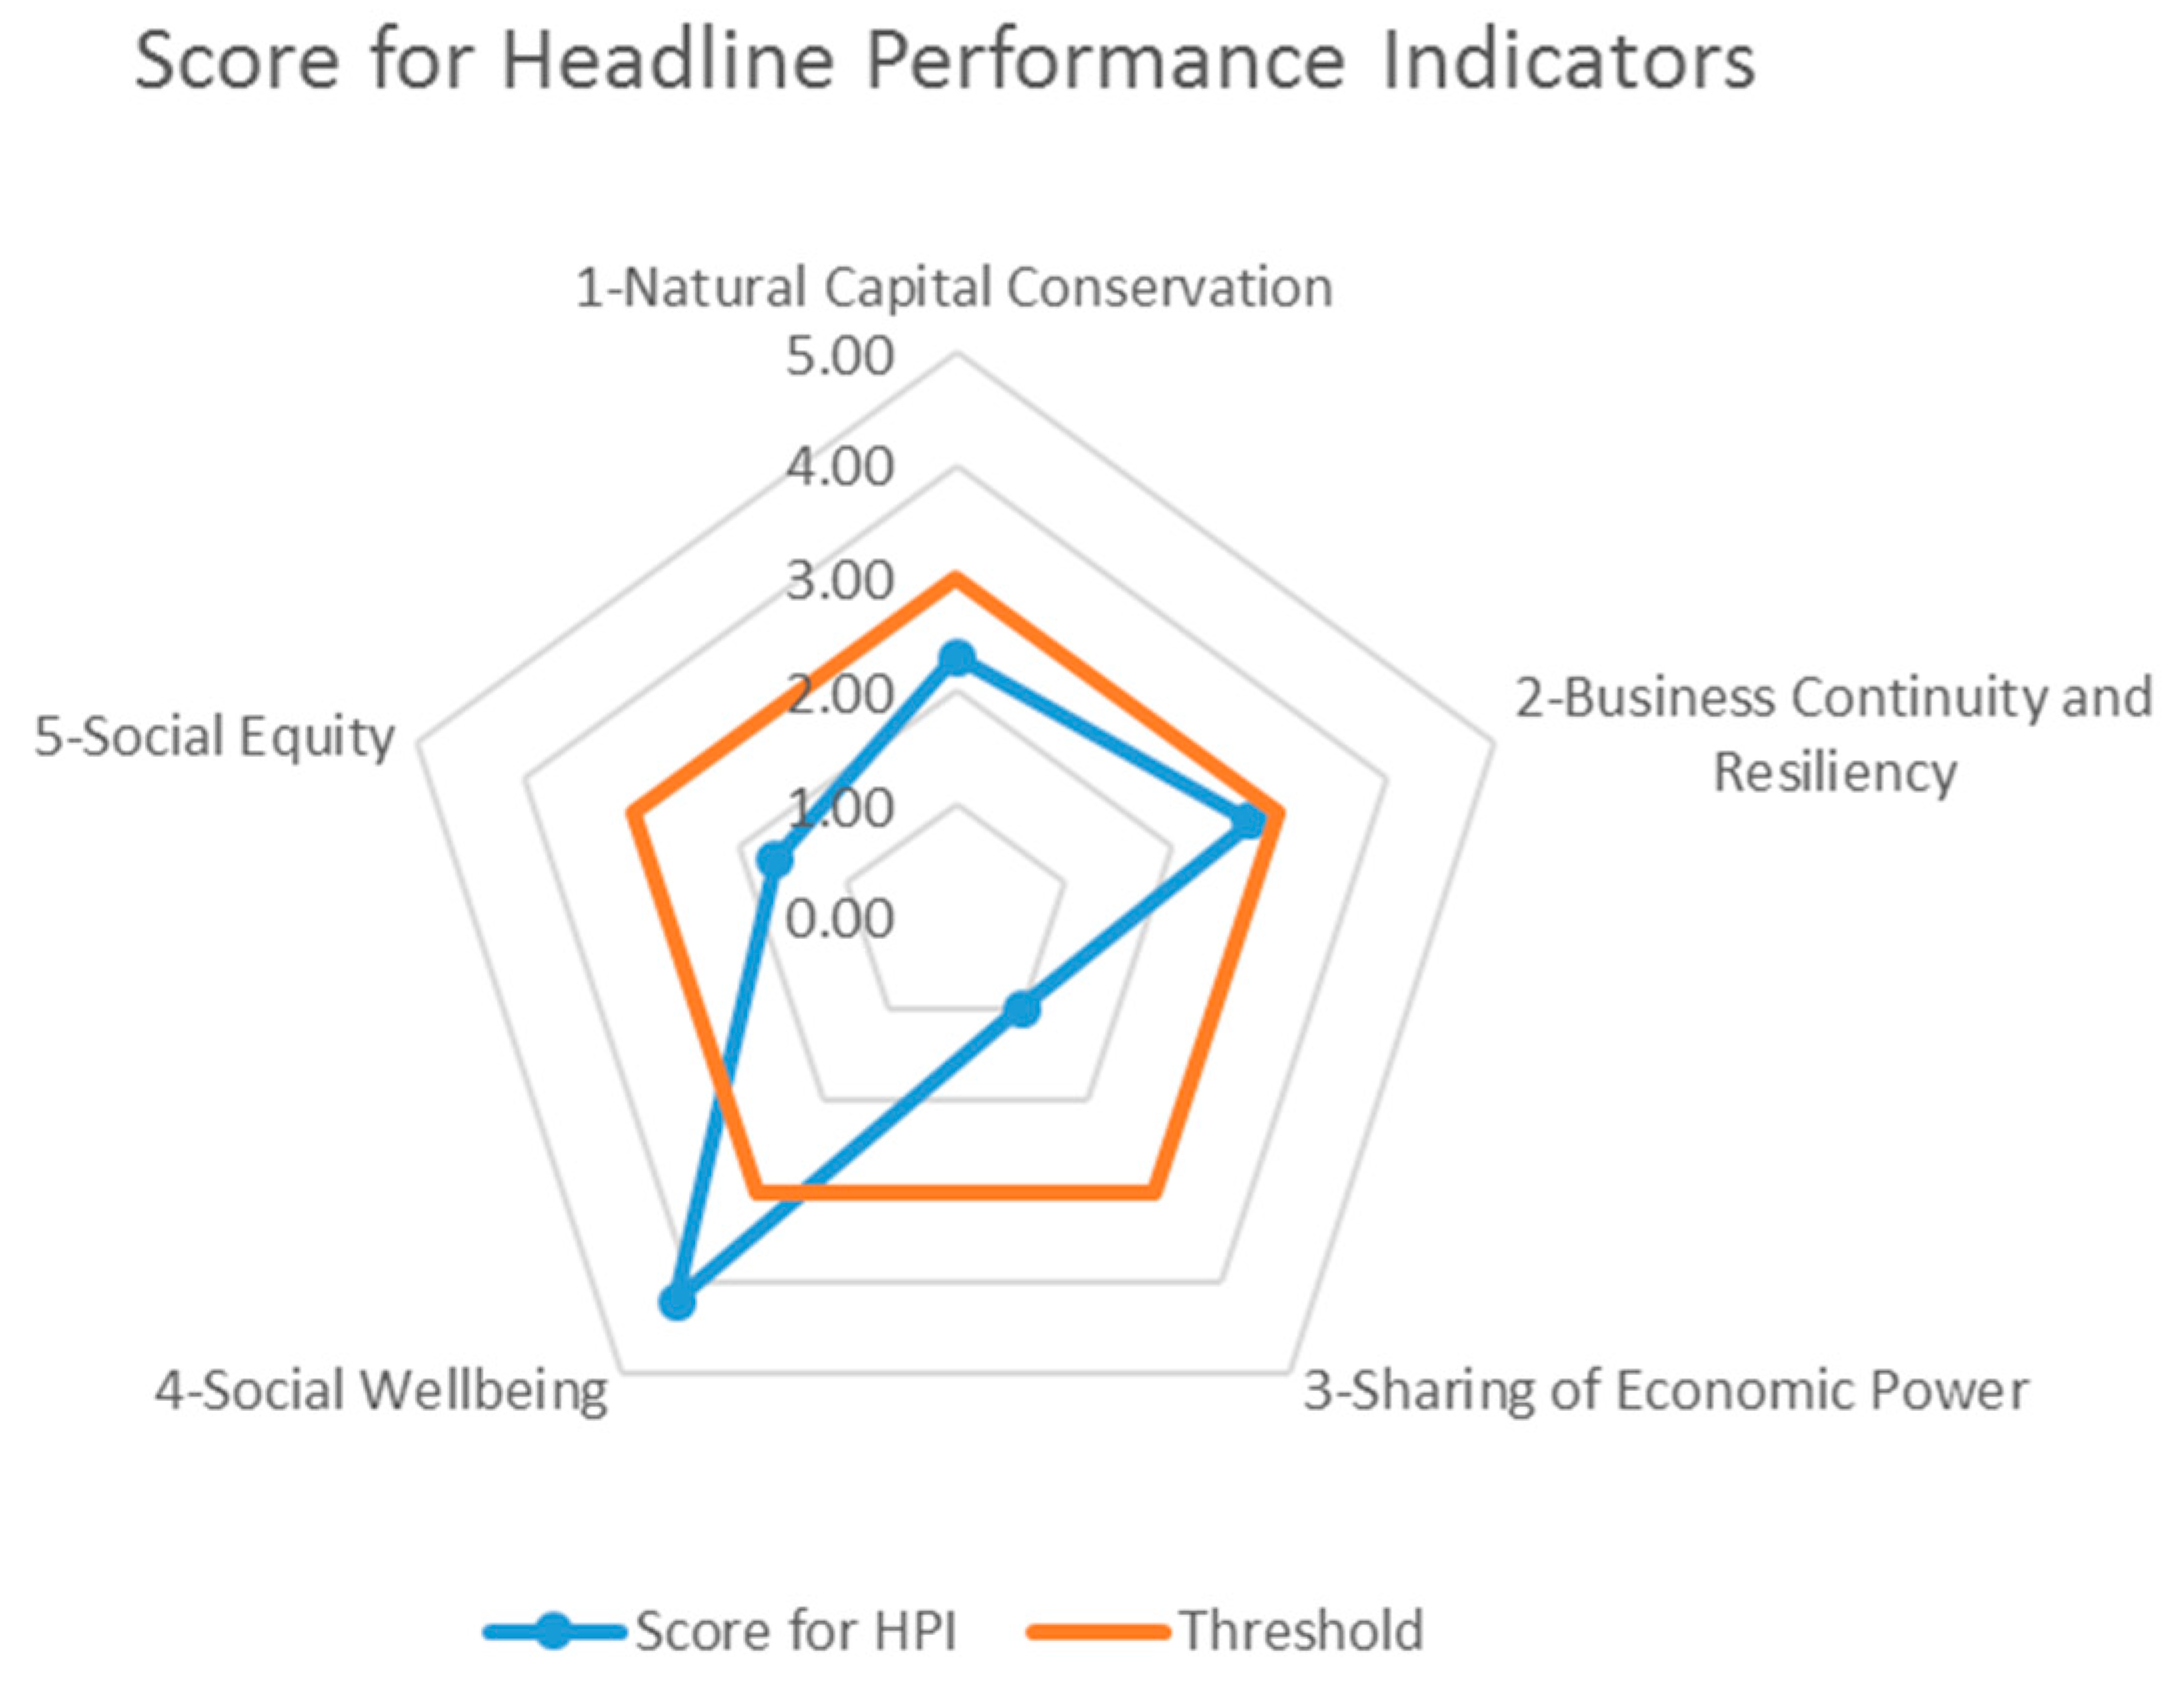
“2. Business continuity and resiliency” and “3. Sharing of economic power” are thus chosen as two HPIs to be achieved under this sustainability objective.
The HPI entitled “2. business continuity and resiliency” is directly related to the KPI “2.1 Production efficiency”. Increasing productivity not only has financial benefits, it also conserves the natural resources for the present and future generations. In the case of crude palm oil production, the PMs during the plantation (or on-farm) and milling stages would be the “2.1.1 Plantation Yield” i.e., Fresh Fruit Bunches (FFB) harvested per hectare, and “2.1.2 Mill production efficiency”, i.e., the amount of crude palm oil produced per tonne of FFB, respectively.
The second KPI, “2.2 Business Continuity”, is the “capability of the organization to continue delivery of products or services at acceptable predefined levels following a disruptive incident” [77]. It reflects how consistently the crude palm oil production is profitable. Sustainable Growth Rate (SGR) presents how the economic growth can be maintained without increasing its financial leverage [79]. In the case of the palm oil industry, an attainable growth rate would mean that a plantation could remain profitable and ensure security of supply, without increasing its debts, even under circumstances where the crude palm oil price plunges. The deviation of actual growth rate from SGR reflects the financial viability of a business. Therefore, “2.2.1 Actual Growth Rate” measuring against SGR has been chosen as a PM over profit margin.
One of the objectives of sustainable development is to enhance intra-generational equity by reducing the gap between rich and poor [8]. The HPI “3. Sharing of economic power” will be measured by the KPI “3.1 Relative poverty”, which is measured at 50% of the national median income [80]. Relative poverty would be a more useful KPI than the absolute poverty level (a fix income value is set as the poverty line) to capture the distribution of wealth [81]. This is because the relative poverty line that is set at RM2292.50 (half of the average income per person per month in Malaysia for the year of 2014) (1 USD = RM3, 2014) reflects the imbalance in wealth distribution. About 46.6% of the wealth is shared by the top 20%, 36.9% is shared by the middle 40%, while only 16.5% is shared by the bottom 40% in Malaysia in 2014 [82]. In the case of the absolute poverty line (RM860 per month in 2014), only less than 1% of Malaysians live under the poverty line. This does not represent a detailed breakdown of wealth distribution or wider social inequality. In case of palm oil production, the PM is “3.1.1 Average annual income per workers”, and it is measured against the national median income that determines the relative poverty level.
The HPI, KPI and PM for the economic sustainability objectives are as presented in Table 2.
Table 2. HPI, KPI and PM for economic sustainability objectives.
Sustainability Objective: Economy
Headline Performance Indicator 2: Business Continuity and Resiliency
Key Performance IndicatorPerformance MeasuresRanking Value
2.1Production efficiency2.1.1Plantation yield1<16 tonne per ha
2< 17 tonne per ha per year
319 tonne per ha per year
4>19 tonne per ha per year
5>20 tonne per ha per year
2.1.2Mill production efficiency1<0.20 tonne CPO per tonne FFB
2<0.21tonne CPO per tonne FFB
30.21 tonne CPO per tonne FFB
4>0.21 tonne CPO per tonne FFB
5>0.22 tonne CPO per tonne FFB
2.2Business continuity2.2.1Actual Growth Rate1>15% deviation from Sustainable Growth Rate
215% deviation from Sustainable Growth Rate
310% deviation from Sustainable Growth Rate
45% deviation from Sustainable Growth Rate
50% deviation from Sustainable Growth Rate
Headline Performance Indicator 3: Sharing of Economic Power
Key Performance IndicatorPerformance MeasuresRanking Value
3.1Relative Poverty3.1.1Average annual income per worker1<25% of national median income
2<50% of national median income
3≥50% of national median income
4>75% of national median income
5≥100% of national median income

2.4.3. HPI, KPI and PM for Social Sustainability Objectives

The aim of sustainable development is to meet the basic needs of life of current and future generations [8]. In order for this to happen, seven critical basic needs, including jobs, food, healthcare, water, sanitation and shelter, are to be fulfilled. A livelihood should be created to empower households in the local community that could be affected by palm oil plantation. “4. Social Wellbeing” has thus been selected as one of the HPIs that will be achieved under the social sustainability objective. This HPI has “4.1 Meeting essential human needs” as one of its KPIs, which have five PMs including “4.1.1 Employment opportunity for the local”, “4.1.2 Workers' accessibility to water supply”, “4.1.3 Workers' accessibility to healthcare”, “4.1.4 Provision of sanitation facilities to workers”, and “4.1.5 Provision of housing facilities to workers” (Table 3).
Table 3. HPI, KPI and PM for social sustainability objectives.
Sustainability Objective: Social
Headline Performance Indicator 4: Social Wellbeing
Key Performance IndicatorPerformance MeasuresRanking Value
4.1Meeting Essential Human Needs4.1.1Employment opportunity for the local1<25% local employment
2≥25% local employment
3>50% local employment
4>75% local employment
5100% local employment
4.1.2Workers’ accessibility to water supply1<25% accessible to portable water
2>25% accessible to portable water
3>50% accessible to portable water
4>75% accessible to portable water
5100% accessible to portable water
4.1.3Workers’ accessibility to healthcare1<25% accessible to healthcare facilities
2>25% accessible to healthcare facilities
3>50% accessible to healthcare facilities
4>75% accessible to healthcare facilities
5100% accessible to healthcare facilities
4.1.4Provision of sanitation facilities to workers1<25% accessible to sanitation facilities
2>25% accessible to sanitation facilities
3>50% accessible to sanitation facilities
4>75% accessible to sanitation facilities
5100% accessible to sanitation facilities
4.1.5Provision of housing facilities to workers1<25% provision to housing facilities
2>25% provision to housing facilities
3>50% provision to housing facilities
4>75% provision to housing facilities
5100% provision to housing facilities
Headline Performance Indicator 5: Social Equality
Key Performance IndicatorPerformance MeasuresRanking Value
5.1Equal opportunity to the poor5.1.1Smallholders’ equity1<25% of CPO sourced from smallholders
2>25% of CPO sourced from smallholders
3>50% of CPO sourced from smallholders
4>75% of CPO sourced from smallholders
5100% of CPO sourced from smallholders
5.2Local community empowerment and engagement5.2.1Access to information and knowledge1No information available
2Information available but local community are not informed
3Local community informed prior to the plantation and mill development
4Local community informed periodically on the plantation and mill development
5Local community are timely updated
5.2.2Community involvement in decision making1No involvement at all
2Indirect communication channels are available
3Local community could provide feedback to plantation owner/mill management through establish channel
4Local community has representation in plantation/mill HSE Committee
5Consensus from local community is mandatory for any decision that impact them
5.2.3Level of community acceptance to plantation and mill activities1<25% agreement from community
2<50% agreement from community
3>50% agreement from community
4>75% agreement from community
5100% agreement from community
In addition to “Social Wellbeing”, “Social Equality” is another intra-generational equity aspect for providing equal distribution of opportunity and wealth, where no specific group is marginalised [8]. Communities that could potentially be affected by palm oil plantation include employees, small-landholders and even the neighbouring communities, as they have various perspectives, consumption patterns and lifestyles and interests [3]. Social equality would vary and depend on how much the local community is empowered through a number of ways, such as consultation, engagement and employment creation.
“5. Social Equality” has thus been considered as the second HPI and one of the KPIs is “5.1 Equal opportunity to the poor”. It measures how much the economic benefits of palm oil industries are shared by the local small farmers contributing to this industry. The price of crude palm oil (CPO) has been considered fixed by the market, hence the PM refers to “5.1.1 Smallholders' equity”, i.e., the percentage of CPO sourced from small farmers compared to large plantations.
Beyond “equal opportunity”, “5.2 Local community empowerment and engagement” is another KPI that needs to be considered. An empowered community has the attributes of confidence, inclusiveness, organisational ability, cooperation and ability to influence [83]. A community gains confidence through education, training and practice. A community would also be more co-operative if its voices are heard and disseminated via organised channels. The industry–community relations would be strengthened if the community could be involved in collective decision making in matters that affect them. The PMs that indicate the level of local community empowerment and engagement are identified as “5.2.1 Access to information and knowledge”, “5.2.2 Community involvement in decision making”, and “5.2.3 Level of community acceptance to plantation and mill activities”.

3. Testing the Framework

3.1. Five-level Ranking System & Development of Benchmarking Criteria

The PMs are assessed using a Likert scale of 1–5, depending on the performance of palm oil production under environmental, economic and social conditions. Levels 1, 3 and 5 represent the poorest performance, the threshold value, and the ideal performance, respectively. The performance at different levels of ranking is pre-defined for every PM as shown in Table 1, Table 2 and Table 3.
Threshold value in this framework is defined as “a minimal level of performance that is acceptable as environmentally, economically or socially sustainable in Malaysia’s context”. The threshold values are determined through the review of legislative requirements, international environmental commitment, technological constraints, and published literature in the journal articles. Criteria used in selecting the threshold values for PMs, in the order of preference, are as below:
  • Values that are considered ecologically and socially sustainable from the Malaysian context, and are obtained from literature research, multidimensional analysis and system modelling.
  • Values that meet the national target set by the International Treaties.
  • Values that meet relevant Malaysian legislative requirements.
  • Average oil crop performance value as that will provide a benchmark for oil palm production, compared with other competing oil crops in the world.
  • Optimum palm oil plantation performance value in the context of Malaysian plantations considering the fact that yield could vary with soil types and farming practices in different agro-ecological and hydrological zones across the country.
  • Best possible performance values of existing technology (i.e., palm oil mill) that is available in the Malaysian market.
Once these threshold values are selected, they will be cross checked or verified through experts’ opinions, and must comply with the international standards.
The PMs that are currently applied are “1.2.1 NOx emission intensity” and “1.2.2 Biological Oxygen Demand of POME discharged from palm oil mills” and “1.2.3 Soil Nitrate Level in waterway”. The threshold values of these PMs were set to meet the requirements of Malaysian regulations for Environmental Quality (Clean Air Act 2014 and Crude Palm Oil 1977) [84]. Ranking values of 1, 2, 4 and 5 are set for each PM at an evenly distributed scale around a threshold value that measures the sustainability performance of palm oil production.
Experts’ opinions that were published in the refereed literature have also been considered in determining both threshold values and other values in the Likert scale for ranking purposes. The values for ranking for PMs on “1.4.1 plantation practice” and “1.4.2 land use” have been developed on the basis of the relevant studies carried out by Luskin et al. [75] on microclimate and habitat heterogeneity through the oil palm lifecycle. Based on the study, the ranking values for the Likert’s scale (i.e., from high to low) for the impact of plantation practice on biodiversity would be total replacement of forest (1), total/large area of replanting (2), patch planting (3), successive strips/connectivity (4) and variable rotation (4) [75]. Likewise, the threshold value for PM of “1.5.2 fossil fuel consumption intensity (energy ratio of palm oil production/fossil fuel consumption)” has been considered as 9 through the review of both local and international literature that were published recently or at least within the last five years [85].
Multidimensional perspective, i.e., analysis on the threshold value based on multiple input factors has also been considered for some PMs in determining the ranking and threshold values. For example, “1.1.1 GHG emission” can be measured in a number of ways, including absolute GHG emission in ppm, absolute GHG emission in CO2eq/ha or per tonne CPO per year or relative GHG emission (CO2eq/kWh) to fossil fuel. To set the correct target value and threshold value, the question is raised as to whether Malaysia is committed to a 2 °C reduction target [86], or what is the maximum allowable GHG emissions per tonne of CPO per year. Malaysia’s agreement in the Copenhagen Summit is to achieve a GHG reduction in 2020 of 40% of the 2005 level [87].
The total GHG emission level for Malaysia in 2005 was 279.2 MtCO2eq while total GHG removal level (sink) was 240.5 MtCO2eq which takes into account all activities including land use changes, and deforestation [80]. With a commitment to achieving a 40% GHG reduction target by 2020, the total allowable emissions in 2020 would be 167.52 MtCO2eq/ year. Around 4% [2] of these GHG emissions result from agricultural activity (including palm oil production), and so the targeted total emissions level from palm oil production would be 6.7 MtCO2eq/year in 2020 (average reduction of 0.3 MtCO2eq/year over 15 years). Using the 2014 palm oil production volume of 48,398,384 tonne CPO [88], the targeted emissions level per tonne of CPO would be 0.138 tCO2eq/ tonne CPO/year by 2020 if the annual production volume remains the same over this period. This value is set as the best case scenario—the ranking value of 5 has been allocated to this GHG value. The threshold has been considered as 0.5–0.8 tCO2eq/tonne CPO/year as this value is achievable given current technological and socio-economic constraints [88]. The GHG per tonne CPO of yield was 3.2–4 tonne per hectare is 920–2007 kgCO2eq (0.920–2.007 tCO2eq) in 2009, which does not include carbon stock change associated with sequestration and peat emission [89]. Malaysian Palm Oil Board (MPOB) published data in 2010 shows that GHG emissions per tonne CPO were 970.58 kgCO2eq without taking into account the capture of biogas and 505.76 kgCO2eq with biogas capture (0.5–0.97 tCO2eq), but none of them included carbon stock change effects [64].
Ideally, the threshold values shall be referred to as only those values which are considered ecologically and socially sustainable from Malaysia’s context, and they were obtained from literature review, analysis and system modelling. However, this is constrained by the availability of literature, and also the complexity of system modelling for every PM for palm oil production in Malaysia. Hence, in some cases, the threshold values for PMs are determined using the average performance of oil crops or palm oil industries. This gives a justification as to where the palm oil production stands, as compared to other options for food and renewable energy.
The average value indirectly represents the performance constrained by geological factors, existing technology and practices [90]. It also helps compare the performance of one production system with other feasible options in the market. For example, “1.5.1 fresh water consumption/ water footprint” threshold value has been determined as 62 m3/GJ, which is the average water footprint values obtained from 15 different oil crops planted in a country with tropical weather [91]. “2.1.1 Plantation yield” and “2.1.2 Mill production efficiency” have been considered as PMs for the economic sustainability objective. The threshold value of “2.1.1 plantation yield” has been considered as 19 tonne/ha/year on the basis of optimum performance by the Malaysian palm oil industry recently in the year 2014, while the threshold value for “2.1.2 mill production efficiency” is set at 0.21 tonne CPO/tonne FFB, considering the best performance of the available existing technology in the industry.

3.2. Performance Measure Calculation Formula

Once the ranking level of each performance measure is determined, the performance for KPI, the following formulae have been developed in this research to calculate HPI and then sustainability objectives.
The performance of each KPI = the average ranking of PMs related to it.
P e r f o r m a n c e   o f   K P I   1.1 = P M 1.1.1 + P M 1.1.2 + + P M 1.1. n n
where, 1.1.1, 1.1.2, …, 1.1.n represents score for first PM, second PM and nth PM of KPI 1.1.
Performance of each HPI = average performance of related KPIs.
P e r f o r m a n c e   o f   H P I   1 = K P I   1.1 + K P I   1.2 + + K P I   1. n n
where, 1.1, 1.2, …, 1.n represents score for first KPI, Second KPI and nth KPI of HPI 1.
Overall sustainability performance = the average ranking of HPIs related to all three triple bottom line objectives.
O v e r a l l   S u s t a i n a b i l i t y   P e r f o r m a n c e = H P I   1 + H P I   2 + + H P I   n n
where, 1, 2, …, n represents score for first HPI, Second HPI and nth HPI of respective sustainability objective.

4. Results

The sustainability assessment framework has been tested for the crude palm oil production in the Malaysian palm oil industry. The score of each PM for triple bottom line objectives has been measured using Equations (1)–(3) (Table 4). Since no field data has been collected yet for this research, the national statistics of the year 2014–2015 and other relevant literatures as cited in Table 4 have been reviewed to find out the generic values of PMs of existing palm oil practices at the national level to compare with the threshold values for testing this framework. In the case of implementation of this framework, the real data from a palm oil industry will be collected for its sustainability assessment.
Utilizing the equations in Section 3.2 and ranking values of PMs in Table 4, the KPIs and HPIs of three sustainability objectives have thus been calculated (Table 5).
Table 4. Score for PM and its justification.
Performance MeasuresScore for PMJustification and Reference
Environmental Sustainability Objective
1.1.1GHG Emission287% mill in Malaysia do not have biogas facilities. Thus most of the production system has GHG emission around 0.97 tCO2/tonne CPO [13]
1.2.1NOx emission intensity from palm oil mill3It is assumed that meeting the regulation requirement is mandatory
1.2.2Biological Oxygen Demand of water discharged from POME pond3It is assumed that meeting the regulation requirement is mandatory
1.2.3Soil Nitrate Level measured through pH in waterway3It is assumed that meeting the regulation requirement is mandatory
1.3.2% biomass recovery/recycling2Palm oil mill mass balance shows that >50% of biomass produced goes to Palm Oil Mill Effluent (POME). For mill without biogas capture, biomass recovery will be <50% and majority of mill in Malaysia do not have an anaerobic digester to generate biogas
1.4.1Plantation Practice2Large plantations in Malaysia commonly practice large area replantation [75]
1.4.2Land Use2Largest portion of land-use change for palm oil plantation happened during 1990–2006, and 42% are from rubber plantation conversion [64]
1.5.1Fresh water consumption intensity—Water Footprint2Palm oil water footprint is recorded as 75 m3/GJ [91]
1.5.2Fossil fuel consumption intensity (Output/Input energy ratio)3Fossil fuel consumption for palm oil production or fossil fuel intensity (Output energy of oil produced/Input energy of fossil fuel consumed) is recorded as 9 in 2014 [85]
Economic Sustainability Objective
2.1.1Plantation yield3Refer to Malaysian average FFB yield per ha per year for 2014, i.e., 18.63 [88]
2.1.2Mill production efficiency2Refer to MPOB statistic 2014, Oil extraction rate in average for palm oil mill is 20.62% [88]
2.2.1Actual Growth Rate3Ideal condition with score of 5 would be zero deviation from sustainable growth rate. Growth rate is very much dependent on specific supply chain economic performance. Thus for overall evaluation it is assumed at 3 with 10% deviation
3.1.1Average annual income per worker1Malaysia median income in 2014 is RM4585 [92]. Thus, relative poverty line refer to household income ≤50% of RM4585, i.e., ≤RM2292.50. Malaysia oil palm plantation workers is earning average of RM900 as reported by Reuters [93], way below the relative poverty line
Social Sustainability Objective
4.1.1Employment opportunity for the local1Oil palm plantations’ foreign workers employment as of 2014 is as high as 75.9% in Malaysia [94]
4.1.2Workers’ accessibility to water supply5Workers for plantation and mill in Malaysia are supplied with portable water [3]
4.1.3Workers’ accessibility to healthcare5Workers for plantation and mill in Malaysia are supplied with healthcare access [3]
4.1.4Provision of sanitation facilities to workers5Workers for plantation and mill in Malaysia are supplied with sanitation facilities [3]
4.1.5Provision of housing facilities to workers5Workers for plantation and mill in Malaysia are supplied with housing facilities [3]
5.1.1Smallholders’ equity2Smallholders contribute to 35%–45% of CPO production as in 2015 [95]
5.2.1Access to information and knowledge1Plantation and mills are not required to provide information to the local community under existing legislation. The usual practice is that most industries do not necessarily feel obliged to engage the neighbouring community [96]
5.2.2Community involvement in decision making2Local community has no power or access to decision making in any neighbouring plantation or mill. Indirect communication will be made through area community leaders
5.2.3Level of community acceptance to plantation and mill activities1Local community agreement or opinion is not a requirement in Malaysia for plantation/mill construction and their daily production activities [97]
Note: 1. For PM 1.2.1, 1.2.2 & 1.2.3, instead of an answer of “yes” or “no” in compliance to regulatory requirement, regulatory requirement level is set as threshold value (score of 3), while other scores (1,2, 4 and 5) reflect how much worse/ better the plantation/ mill is performing from the regulatory requirement. For this exercise, it is assumed that meeting regulatory requirement is mandatory; hence, the plantations and mills in this evaluation meet the threshold value. 2. Elements of calculation for Actual Growth Rate include profit, debts to equity ratio, dividend payout and assets value. Thus, it is very specific to each mill/ plantation financial condition. Thus score at threshold value is selected in this evaluation. 3. The data obtained from Malaysian Statistics for Median Income only considers the monetary income. Hence, income provided “in kind” to palm oil plantation workers, e.g., housing, healthcare, water supply is not considered in order to make a fair comparison.
Table 5. Overall assessment results.
Sustainability ObjectivesHeadline Performance IndicatorKey Performance IndicatorPerformance MeasuresScore for PMScore for KPIScore for HPIScore for Sustainability ObjectiveScore for Overall Sustainability
Environment1Natural Capital Conservation1.1Climate Change1.1.1GHG Emission22.002.302.302.37
1.2Air, Water and Soil Quality1.2.1NOx emission intensity from palm oil mill33.00
1.2.2Biological Oxygen Demand of water discharged from POME pond3
1.2.3Soil Nitrate Level measured through pH in waterway3
1.3Waste Generation1.3.2% biomass recovery/recycling22.00
1.4Biodiversity1.4.1Plantation Practice22.00
1.4.2Land Use2
1.5Resources Consumption1.5.1Fresh water consumption intensity—Water Footprint22.50
1.5.2Fossil fuel consumption intensity (Output/Input energy ratio)3
Economy2Business Continuity and Resiliency2.1Productivity efficiency2.1.1Plantation yield32.502.751.88
2.1.2Mill production efficiency2
2.2Business Continuity2.2.1Actual Growth Rate33.00
3Sharing of Economic Power3.1Relative Poverty3.1.1Average annual income per worker11.001.00
Social4Social Well-being4.1Meeting Essential Human Needs4.1.1Employment opportunity for the local14.204.202.93
4.1.2Workers’ accessibility to water supply5
4.1.3Workers’ accessibility to health care5
4.1.4Provision of sanitation facilities to workers5
4.1.5Provision of housing facilities to workers5
5Social Equality5.1Equal opportunity to the poor5.1.1Smallholders’ equity22.001.67
5.2Local community empowerment and engagement5.2.1Access to information and knowledge11.33
5.2.2Community involvement in decision making2
5.2.3Level of community acceptance to plantation and mill activities1

5. Discussion

The sustainability assessment results as presented in Table 5 and Figure 5, Figure 6, Figure 7 and Figure 8 show that the sustainability performance score of Malaysian crude palm oil production is 2.37 out of 5, which is below the threshold value of 3. The score of economic sustainability objectives is the lowest (1.88) which pulls down the overall sustainability performance of the crude palm oil production. In addition, the scores of environmental (2.30) and social (2.93) objectives are also below the threshold values. This framework thus enables identifying PMs (or “hotspots”) requiring major improvements for achieving the required level of sustainability performance.
Figure 5. Score for performance measures.
Sustainability 07 15833 g005
Figure 6. Score for key performance indicators.
Sustainability 07 15833 g006
Figure 7. Score for headline performance indicators.
Sustainability 07 15833 g007
Figure 8. Score for sustainability objectives.
Sustainability 07 15833 g008
One of the “hotspots” identified is the “3.1.1 Average income per worker”, which has resulted in the increase of relative poverty and thus decreased the HPI for “3. Sharing of economic power” under the economic sustainability objective. The second hotspot is “4.1.1 Employment opportunity for the local people”. The local employment opportunity has been reduced due to replacement of local manpower with cheap foreign labour from neighbouring developing countries [94]. This will reduce the score of the KPI for “4.1 Meeting essential human needs” for livelihood, as the the score of HPI for “4. Social well-being”. However, by improving the wellbeing of workers in terms of providing the employees (both foreigners and locals) with decent housing, access to water, sanitation and healthcare facilities, particularly for those working in remote plantation and mills [3], the scores for relevant KPIs and HPIs can be increased. The third and fourth hotspots are “5.2 Local community empowerment and engagement” where the KPI score (1.33) is relatively low and hence reduces the score for “5. Social equality” HPI. This is because of the fact that the sharing of information and exchange of knowledge between industry and the local community is not common practice in Malaysia [98].
Interestingly, no hotspot has been identified under the environmental sustainability objective, but it does not necessarily mean that the performance of this objective is satisfactory. Out of nine environmental PMs, five PMs are at level 2, which is below the threshold value, but the scores of the remaining 4 PMs are so high that it pulled up the overall score for environmental sustainability above the threshold value. Other performance measures are controlled reasonably well because they are performances regulated by Malaysian authorities. Incompliance with the threshold values for these performance measures would mean risk of facing legal action, halting operations or even losing business licenses.
Therefore, this framework will not only assess the sustainability performance of palm oil production in Malaysia but it will also help in selecting appropriate strategies for addressing the identified PMs for restructuring the supply chain of CPO production to improve sustainability. The hotspots identified, the causes of these hotspots and relevant opportunities for improvement for addressing these hotspots have been presented in Table 6.
We have identified the following advantages in developing a sustainability assessment framework:
  • It allows integration of all three sustainability dimensions into one single score, thus providing an opportunity to compare the sustainability performance of similar products.
  • It allows the application of a triangular structure approach of sustainability assessment by integrating Key Performance Indicators and Performance Measures into Higher Performance Indicators.
  • It is flexible in adapting to both quantitative and qualitative measures by interpreting these measures into indices.
  • The integrated, multi-criteria analysis approach allows sustainability objectives to be assessed in a balanced and integrated manner. A clearly defined, quantitative PM criteria and presentation of results at different levels of aggregation would also allow such assessment to be more transparent.
  • The hotspots could be easily identified through this assessment process and the remediation or relevant improvement strategies can specifically be devised accordingly.
  • It could be a decision making tool for policy makers, growers and producers to identify strategies for further improvement and achieving sustainability objectives. This is because the stakeholders would be able to identify areas of weakness from the assessment results, and would be able to make an effective determination as to how well they are performing from the threshold and best practice, and work towards all three sustainability objectives.
  • The framework could offer flexibility as the ranking values could be reviewed from time to time as technology advances, policies changes, or regulations are revised.
Some weaknesses observed from this assessment framework are as discussed below:
  • As the Likert scale is equally applied to all PMs, the relative advantages and disadvantages between PMs are not clearly differentiated. For example, the employment opportunity for the local people is an important hotspot, but it does not have much influence on the KPI and HPI as the remaining PMs of the KPI and HPI perform well.
  • Another aspect is, due to a variable number of performance measures for each sustainability objective, i.e., nine for environment, four for economy and nine for social objectives, it can be observed that each PM under economic sustainability carries a heavier weighting. Non-performance of a single performance measure under the economic sustainability objective would be highly sensitive to the KPI, HPI and overall sustainability, compared to performance measures under environment and social sustainability.
  • Threshold values for some PMs (e.g., “1.5.1 Fresh water consumption intensity—Water Footprint” and “1.5.2 Fossil fuel consumption intensity (Output/Input energy ratio)”) refer to average/ best industrial practices, which might be still too high for the natural system, e.g., groundwater replenishment, fossil fuel resources, to accommodate. The use of such PMs causes deviation from the concept of strong sustainability, where the performance shall be judged objectively, solely by its impact on society and the environment.
Table 6. Hotspots, their reasons and opportunities for improvement.
HotspotsReasonOpportunities for Improvement
1.
3.1.1 Average annual income per worker
  • Minimum wage in Malaysia is set too low, way below the relative poverty line.
  • Most of the workers are foreign workers, who do not have much bargaining power for negotiation with the employer.
  • The minimum wage shall be reviewed.
  • Use of skilled workers and technicians shall be encouraged instead of relying on general labour.
  • Standard wage policy needs to be applied by the government
2.
4.1.1 Employment opportunity for the local people
  • The local people do not want to work in the plantation due to hardship and low wages.
  • Large plantation employer would prefer the foreign workers who are willing to work for lower wages to keep the business competitive.
  • The nation’s policy in importing foreign workers shall be reviewed.
  • The model of large plantation with high demand on foreign labour could be replaced with smallholder schemes to encourage more local farmers/entrepreneurs.
  • Government’s incentives on education, training, effort reducing technologies and health and safety as it is one of nation’s key industries.
3.
5.2.1 Access to information and knowledge
  • There is no regulatory requirements for industry to share information with the community.
  • It is not a common culture in Malaysia for industry to share information and knowledge with the local people.
  • Sharing of information and knowledge between plantations and mills with the local people shall be made a good practice by the authority.
  • Organising workshops at local level participated by all stakeholders including government, NGOs, industries and the local community
4.
5.2.3 Level of community acceptance to plantation and mill activities
  • There is no regulatory requirements for industry to obtain permissions or consensus from the local community in any phase of the development
.
  • Consensus of the local community shall be made a mandatory requirement prior to any development approval by the authority.

6. Recommendations

Considering different degrees of importance for each indicator under different environmental situations, policy changes and socio-economic conditions, relevant weightings could be applied for HPIs, KPIs and PMs. The weightings for an indicator could be discerned through stakeholder consultations, workshops involving people directly and indirectly related to palm oil production. The following formula could be applied to determine weightings:
P e r f o r m a n c e   o f   H P I   1 = W 1 K P I   1.1 + W 2 K P I   1.2 + + W n K P I   1. n W 1 + W 2 + + W n
where W1, W2, …, Wn represents weighting factor applied to KPI 1.1, KPI 1.2, and KPI 1.n respectively
P e r f o r m a n c e   o f   K P I   1.1 = W 1 P M   1.1.1 + W 2 P M 1.1.2 + + W n P M 1.1. n W 1 + W 2 + + W n
where W1, W2, …, Wn represents weighting factor applied to PM 1.1.1, PM 1.1.2, and PM 1.1.n respectively.
With this amendment, the influence of important performance measures and indicators would not be overlooked in the results of higher level indicators (i.e., HPIs). Secondly, the current analysis suggests that an equal number of PMs needs to be developed for each of these three sustainability objectives, or a weighting factor could be applied to the PM in a way that the results of KPI and HPI could better reflect the actual scenario. The introduction of weighting factors, however, does not intend to offset the impact of sustainability performance measures, or to give precedence to socio-economic development. It shall be applied carefully, referring to scientific findings and diverse stakeholders’ input to avoid shifting from strong sustainability objectives to weak sustainability objectives.
It is also suggested that a thorough literature review is carried out and separate system modelling is undertaken to identify threshold values that are considered ecologically and socially sustainable for every PM. That could further verify if targets set according to the latest legislative requirements and international treaties are legitimate and applicable. It would also ensure that the assessment framework has incorporated strong sustainability principles.

7. Conclusions

The proposed sustainability assessment framework for crude palm oil production has been developed to overcome the weaknesses in some of the existing assessment methods. It is aimed at developing a holistic, comprehensive, measurable, and easy to apply approach or framework, thus providing a quick self-assessment tool for the industries in the palm oil supply chain. The testing of the framework by utilizing existing data on Malaysian crude palm oil production in general reflects the sustainability performance of the industry. The assessment framework has been successfully tested and it was found that there are still opportunities for improvement in this current framework by selecting appropriate weightings of PMs, introducing an equal number of PMs for each sustainability objective and by using more scientific threshold values.

Acknowledgments

The authors would like to thank Michele Rosano of Sustainable Engineering Group, Curtin University and Yudi Samyudia of Curtin University Sarawak Malaysia for their support and guidance in this research.

Author Contributions

Both authors contribute equally in literature review, concept formulation, framework development, data collection, results evaluation and writing of this paper.

Conflicts of Interest

The authors declare no conflict of interest.

References

  1. Ong, S.H.A. The Global Palm Oil Phenomenon. The Star Online. 14 May 2012. Available online: http://www.thestar.com.my/business/business-news/2012/05/14/the-global-palm-oil-phenomenon/?style=biz (accessed on 15 August 2012).
  2. Performance Management and Delivery Unit (PEMANDU). Economic Transformantion Programme Annual Report 2011; Prime Minister’s Department, Malaysian Government: Putrajaya, Malaysia, 2012.
  3. Norwana, A.; Kunjappan, R.; Chin, M.; Schoneveld, G.; Potter, L.; Andriani, R. The Local Impacts of Oil Palm Expansion in Malaysia—An Assessment Based on A Case Study in Sabah State; Center for International Forestry Research (CIFOR): Bogor, Indonesia, 2011. [Google Scholar]
  4. Datamonitor. Palm Oil Case Study: How Consumer Activism Led the Push for Sustainable Sourcing; Datamonitor: London, UK, 2010. [Google Scholar]
  5. Palm Oil Consumer Action. Sustainable Palm Oil Our Definition. Available online: http://www.palmoilconsumers.com/sustainable-palm-oil.html (accessed on 1 September 2015).
  6. Bateman, I.J.; Fisher, B.; Fitzherbert, E.; Glew, D.; Naidoo, R. Tigers, markets and palm oil: Market potential for conservation. Oryx 2010, 44, 230–234. [Google Scholar] [CrossRef]
  7. Lim, C.I.; Biswas, W.; Samyudia, Y. Review of existing sustainability assessment methods for malaysian palm oil production. Procedia CIRP 2015, 26, 13–18. [Google Scholar] [CrossRef]
  8. Brundtland, G.H. Our Common Future; World Commission on Environment and Development (WCED): Oxford, UK, 1987. [Google Scholar]
  9. Diesendorf, M. Sustainability and sustainable development. In Sustainability: The Corporate Challenge of the 21st Century; Dunphy, D., Benveniste, J., Griffiths, A., Sutton, P., Eds.; Allen & Unwin: Sydney, Australia, 2000; pp. 19–37. [Google Scholar]
  10. Tan, Y.; Muhammad, H.; Hashim, Z.; Subramaniam, V.; Puah, C.; Chong, C.; Ma, A.; Choo, Y. Life cycle assessment of refined palm oil production and fractionation (part 4). J. Oil Palm Res. 2010, 22, 913–926. [Google Scholar]
  11. Subramaniam, V.; Choo, Y.; Muhammad, H.; Hashim, Z.; Tan, Y.; Puah, C.W. Life cycle assessment of the production of crude palm kernel oil (part 3a). J. Oil Palm Res. 2010, 22, 904–912. [Google Scholar]
  12. Subramaniam, V.; Ma, A.N.; Choo, Y.M.; Sulaiman, N.M.N. Environmental performance of the milling process of malaysian palm oil using the life cycle assessment approach. Am. J. Environ. Sci. 2008, 4, 310–315. [Google Scholar]
  13. Subramaniam, V.; Choo, Y.M.; Muhammad, H.; Hashim, Z.; Tan, Y.A.; Puah, C.W. Life cycle assessment of the production of crude palm oil (part 3). J. Oil Palm Res. 2010, 22, 895–903. [Google Scholar]
  14. Muhammad, H.; Hashim, S.; Subramaniam, V.; Tan, Y.; Puah, C.; Chong, C.; Choo, Y.M. Life cycle assessment of oil palm seedling production (part 1). J. Oil Palm Res. 2010, 22, 878–886. [Google Scholar]
  15. Bessou, C.; Chase, L.D.C.; Henson, I.E.; Abdul-Manan, A.F.N.; Milà I Canals, L.; Agus, F.; Sharma, M.; Chin, M. Pilot application of palmghg, the rspo greenhouse gas calculator for oil palm products. J. Clean. Prod. 2014, 73, 136–145. [Google Scholar] [CrossRef] [Green Version]
  16. Hansen, S. Feasibility study of performing an life cycle assessment on crude palm oil production in malaysia (9 pp). Int. J. Life Cycle Assess. 2007, 12, 50–58. [Google Scholar] [CrossRef]
  17. Zulkifli, H.; Halimah, M.; Chan, K.W.; Choo, Y.M.; Mohd Basri, W. Life cycle assessment for oil palm fresh fruit bunch production from continued land use for oil palm planted on mineral soil (part 2). J. Oil Palm Res. 2010, 22, 887–894. [Google Scholar]
  18. Yee, K.F.; Tan, K.T.; Abdullah, A.Z.; Lee, K.T. Life cycle assessment of palm biodiesel: Revealing facts and benefits for sustainability. Appl. Energy 2009, 86, S189–S196. [Google Scholar] [CrossRef]
  19. Roundtable on Sustainable Palm Oil (RSPO). RSPO Principles and Criteria for Sustainable Palm Oil Production; RSPO: Kuala Lumpur, Malaysia, 2007. [Google Scholar]
  20. International Sustainability & Carbon Certification (ISCC). ISCC 202-01 Checklist for the Control of Requirements for the Production of Biomass; ISCC: Köln, Germany, 2011. [Google Scholar]
  21. Johnson, A. Ecuador’s national interpretation of the roundtable on sustainable palm oil (RSPO): Green-grabbing through green certification? J. Latin Am. Geogr. 2014, 13, 183–204. [Google Scholar] [CrossRef]
  22. Anonymous. Greens Slam EU Certification of Palm-Oil Biodiesel as ‘Hypocrisy’; Hart Energy: Houston, TX, USA, 2013; Volume 17, p. 8. [Google Scholar]
  23. Greenpeace. Certifying Destruction—Why Consumer Companies Need to go Beyond Rspo and Stop Forest Destruction; Greenpeace International: Amsterdam, NY, USA, 2013. [Google Scholar]
  24. GreenPalm. Committing to Sustainable Palm Oil Does Not Have to be Complex for Cosmetics Brands. Available online: http://greenpalm.org/ (accessed on 5 April 2015).
  25. Stinchcombe, K.; Gibson, R.B. Strategic environmental assessment as a means of pursuing sustainability: Ten advantages and ten challenges. J. Environ. Assess. Policy Manag. 2001. [Google Scholar] [CrossRef]
  26. Rosen, K.; Lindner, M.; Nabuurs, G.; Paschalis-Jakubowicz, P. Challenges in implementing sustainability impact assessment of forest wood chains. Eur. J. For. Res. 2012, 131, 1–5. [Google Scholar] [CrossRef]
  27. Reap, J.; Roman, F.; Duncan, S.; Bras, B. A survey of unresolved problems in life cycle assessment. Int. J. Life Cycle Assess. 2008, 13, 374–388. [Google Scholar] [CrossRef]
  28. Otto, H.; Mueller, K.; Kimura, F. Efficient information visualization in lca: Application and practice. Int. J. Life Cycle Assess. 2004, 9, 2–12. [Google Scholar] [CrossRef]
  29. Morrison-Saunders, A.; Pope, J.; Bond, A. Handbook of Sustainability Assessment; Edward Elgar Publishing: Cheltenham, UK, 2015. [Google Scholar]
  30. Federal Office for Spatial Development (ARE). Sustainability Assessment: Conceptual Framework and Basic Methodology; Department of Environment, Transport, Energy and Communications (DETEC): Bern, Switzerland, 2004. [Google Scholar]
  31. Devuyst, D. Sustainability assessment: The application of a methodological framework. J. Environ. Assess. Policy Manag. 1999. [Google Scholar] [CrossRef]
  32. Kucukvar, M.; Tatari, O. Towards a triple bottom-line sustainability assessment of the U.S. Construction industry. Int. J. Life Cycle Assess. 2013, 18, 958–972. [Google Scholar] [CrossRef]
  33. Pope, J.; Annandale, D.; Morrison-Saunders, A. Conceptualising sustainability assessment. Environ. Impact Assess. Rev. 2004, 24, 595–616. [Google Scholar] [CrossRef]
  34. Ekins, P.; Simon, S.; Deutsch, L.; Folke, C.; de Groot, R. A framework for the practical application of the concepts of critical natural capital and strong sustainability. Ecol. Econ. 2003, 44, 165–185. [Google Scholar] [CrossRef]
  35. Ness, B.; Urbel-Piirsalu, E.; Anderberg, S.; Olsson, L. Categorising tools for sustainability assessment. Ecol. Econ. 2007, 60, 498–508. [Google Scholar] [CrossRef]
  36. Jeswani, H.K.; Azapagic, A.; Schepelmann, P.; Ritthoff, M. Options for broadening and deepening the LCA approaches. J. Clean. Prod. 2010, 18, 120–127. [Google Scholar] [CrossRef]
  37. Srdić, A.; Šelih, J. Integrated quality and sustainability assessment in construction: A conceptual model. Technol. Econ. Dev. Econ. 2011, 17, 611–626. [Google Scholar] [CrossRef]
  38. Buytaert, V.; Muys, B.; Devriendt, N.; Pelkmans, L.; Kretzschmar, J.G.; Samson, R. Towards integrated sustainability assessment for energetic use of biomass: A state of the art evaluation of assessment tools. Renew. Sustain. Energy Rev. 2011, 15, 3918–3933. [Google Scholar] [CrossRef]
  39. Wood, R.; Hertwich, E. Economic modelling and indicators in life cycle sustainability assessment. Int. J. Life Cycle Assess. 2013, 18, 1710–1721. [Google Scholar] [CrossRef]
  40. James, P. Urban Sustainability in Theory and Practice; Routledge: London, UK, 2015. [Google Scholar]
  41. Sustainable Society Foundation. Available online: http://www.ssfindex.com/ (accessed on 15 December 2015).
  42. Biswas, W.K.; Cooling, D. Sustainability assessment of red sand as a substitute for virgin sand and crushed limestone. J. Ind. Ecol. 2013, 17, 756–762. [Google Scholar] [CrossRef]
  43. Alsulami, B.; Mohamed, S. Incorporating system complexity in sustainability assessment for civil infrastructure systems: An innovative approach. In Proceedings of the 6th International Conference on Innovation in Architecture, Engineering and Construction (AEC), Pennsylvania State University, University Park, PA, USA, 9–11 June 2010.
  44. Berkel, R.V.; Power, G.; Cooling, D. Quantitative methodology for strategic assessment of the sustainability of bauxite residue management. Clean Techn. Environ. Policy 2008, 10, 359–370. [Google Scholar] [CrossRef]
  45. International Institution for Sustainable Development (IISD). Seven Questions to Sustainability: How to Assess the Contribution of Mining and Minerals Activities; International Institution for Sustainable Development: Winnipeg, MB, Canada, 2002; p. 54. [Google Scholar]
  46. Rosenström, U.; Kyllönen, S. Impacts of a participatory approach to developing national level sustainable development indicators in finland. J. Environ. Manag. 2007, 84, 282–298. [Google Scholar] [CrossRef] [PubMed]
  47. Hák, T.; Moldan, B.; Dahl, A. Sustainability Indicators: A Scientific Assessment; Island Press: Washington, DC, USA, 2007. [Google Scholar]
  48. Blanchet, K.; Girois, S. Selection of sustainability indicators for health services in challenging environments: Balancing scientific approach with political engagement. Eval. Program Plan. 2013, 38, 28–32. [Google Scholar] [CrossRef] [PubMed]
  49. Gallego Carrera, D.; Mack, A. Sustainability assessment of energy technologies via social indicators: Results of a survey among european energy experts. Energy Policy 2010, 38, 1030–1039. [Google Scholar] [CrossRef]
  50. Ekins, P. Environmental sustainability. Prog. Phys. Geogr. 2011, 35, 629–651. [Google Scholar] [CrossRef]
  51. European Commission Environment Website. Available online: http://ec.europa.eu/environment/basics/natural-capital/index_en.htm (accessed on 6 April 2015).
  52. Greene, G. Caring for the earth: The world conservation union, the united nations environment programme, and the world wide fund for nature. Environ. Sci. Policy Sustain. Dev. 1994, 36, 25–28. [Google Scholar] [CrossRef]
  53. Daly, H.E. Sustainable Economic Development: Definitions, Principles, Policies; World Bank: Washington, DC, USA, 2003; pp. 62–79. [Google Scholar]
  54. Roosa, S.A. Sustainable Development Handbook; Fairmont Press: Lilburn, GA, USA, 2008. [Google Scholar]
  55. Lawn, P. Sustainable Development Indicators in Ecological Economics; Edward Elgar Publishing Limited: Cheltenham, UK, 2006. [Google Scholar]
  56. Guidance, Air Pollution from Farming: Preventing and Minimising. Available online: https://www.gov.uk/reducing-air-pollution-on-farms (accessed on 20 May 2015).
  57. Environmental Protection Agency. 2014 standards for the renewable fuel standard program, proposed rule. In Federal Register; No. 230; Environmental Protection Agency: Washington, DC, USA, 2013; Volume 78. [Google Scholar]
  58. European Union (EU). Directive 2009/28/EC of the European Parliment and of the Council of 23 April 2009 on the Promotion of the Use of Energy from Renewable Sources and Amending and Subsequently Repealing Directives 2001/77/EC and 2003/30/EC; European Union: Brussels, Belgium, 2009. [Google Scholar]
  59. Organisation for Economic Co-operation and Development (OECD). Environment at a Glance—OECD Environmental Indicators; OECD: Pairs, France, 2005. [Google Scholar]
  60. Sizer, N.S.N.; Anderson, J.; Stolle, F.; Minnemeyer, S.; Higgins, M.; Leach, A.; Alisjahbana, A. Fires in Indonesia at Highest Levels Since 2013 Haze Emergency; The Guardian: London, UK, 2014. [Google Scholar]
  61. Yacob, S.; Hassan, M.A.; Shirai, Y.; Wakisaka, M.; Subash, S. Baseline study of methane emission from open digesting tanks of palm oil mill effluent treatment. Chemosphere 2005, 59, 1575–1581. [Google Scholar] [CrossRef] [PubMed]
  62. Chase, L.D.C.; Henson, I. A detailed greenhouse gas budget for palm oil production. Int. J. Agric. Sustain. 2010, 8, 199–214. [Google Scholar] [CrossRef]
  63. World Health Organization (WHO). WHO Air Quality Guidelines for Particulate Matter, Ozone, Nitrogen Dioxide and Sulfur Dioxide, Global Update 2005; WHO: Geneva, Switzerland, 2005. [Google Scholar]
  64. MPOB. Oil Palm & the Environment (updated March 2014). Available online: http://www.mpob.gov.my/palm-info/environment/520-achievements (accessed on 6 May 2015).
  65. Environmental Protection Agency. Water: Monitoring & Assessment. Available online: http://www.epa.gov (accessed on 10 May 2015).
  66. Hailu, A.; Chambers, R. A luenberger soil-quality indicator. J. Product. Anal. 2012, 38, 145–154. [Google Scholar] [CrossRef]
  67. United States Department of Agriculture (USDA). Soil Quality Test Kit Guide; USDA: Washington, DC, USA, 2001.
  68. Reijnders, L.; Huijbregts, M.A.J. Palm oil and the emission of carbon-based greenhouse gases. J. Clean. Prod. 2008, 16, 477–482. [Google Scholar] [CrossRef]
  69. Roundtable on Sustainable Palm Oil (RSPO). Principles and Criteria for the Production of Sustainable Palm Oil 2013; RSPO: Kuala Lumpur, Malaysia, 2013. [Google Scholar]
  70. National Wildlife Federation. What is Biodiversity? Available online: http://www.nwf.org/Wildlife/Wildlife-Conservation/Biodiversity.aspx (accessed on 9 May 2016).
  71. International Union for Conservation of Nature and Natural Resources. The IUCN Red List of Threatened Species. Available online: http://www.iucnredlist.org (accessed on Day Month Year).
  72. The Environmental Literacy Council. Measuring Biodiversity. Available online: http://enviroliteracy.org/ (accessed on Day Month Year).
  73. Gotelli, N.J.; Colwell, R.K. Quantifying biodiversity: Procedures and pitfalls in the measurement and comparison of species richness. Ecol. Lett. 2001, 4, 379–391. [Google Scholar] [CrossRef]
  74. World Wildlife Foundation (WWF). Oil Plam and Soy: The Expanding Threats to Forests; WWF: Washington, DC, USA, 2003. [Google Scholar]
  75. Luskin, M.S.; Potts, M.D. Microclimate and habitat heterogeneity through the oil palm lifecycle. Basic Appl. Ecol. 2011, 12, 540–551. [Google Scholar] [CrossRef]
  76. Doane, D.; MacGillivra, A. Economic Sustainability—The Business of Staying in Business; New Economics Foundation: London, UK, 2001. [Google Scholar]
  77. International Organization for Standardization (ISO). ISO 22301:2012—Business Continuity Management Systems—Requirements; ISO: Geneva, Switzerland, 2012. [Google Scholar]
  78. Business Continuity Institute (BCI). What Is Business Continuity? Available online: http://www.thebci.org (accessed on 10 August 2015).
  79. Higgins, R.C. How much growth can a firm afford? Financ. Manag. 1977, 6, 7–16. [Google Scholar] [CrossRef]
  80. Ministry of Natural Resources and Environment Malaysia. Malaysia Second National Communication to the UNFCCC; Ministry of Natural Resources and Environment: Putrajaya, Malaysia, 2005. [Google Scholar]
  81. United Nations Development Programme, Malaysia. Malaysia Human Development Report 2013—Redesigning an Inclusive Future; United Nations Development Programme, Malaysia: Kuala Lumpur, Malaysia, 2014. [Google Scholar]
  82. Economic Planning Unit. Household Income and Poverty; Economic Planning Unit, Prime Minister’s Department: Putrajaya, Malaysia, 2015. [Google Scholar]
  83. Central Data Exchange (CDX). What is Community Empowerment? National Empowerment Network; CDX: Sudbury, MA, USA, 2008. [Google Scholar]
  84. Department of Environment. Environment Quality (Prescribed Premises) (Crude Palm Oil) Regulation 1977; Attorney General Chamber: Putrajaya, Malaysia, 1977. [Google Scholar]
  85. Timms, R. Palm oil—The oil for the 21st century? Eur. J. Lipid Sci. Technol. 2007, 109, 287–288. [Google Scholar] [CrossRef]
  86. United Nations Framework Convention on Climate Change (UNFCCC). Copenhagen Accord; United Nations: New York, NY, USA, 2009. [Google Scholar]
  87. Choi, T.W. Malaysia Aims for 40pc Cut in Carbon Intensity per GDP. The Star Online. 17 December 2009. Available online: http://www.thestar.com.my/news/nation/2009/12/17/malaysia-aims-for-40pc-cut-in-carbon-intensity-per-gdp/ (accessed on 1 July 2015).
  88. MPOB. Malaysia Palm Oil Statistic 2015. Available online: http://bepi.mpob.gov.my (accessed on 20 July 2015).
  89. Consultancy, B. Greenhouse Gas Emissions from Palm Oil Production: Literature Review and Proposals from the RSPO Working Group on Greenhouse Gases; RSPO: Kuala Lumpur, Malaysia, 2009. [Google Scholar]
  90. Performance Management and Delivery Unit (PEMANDU). Deepening Malaysia’s palm oil advantage. In Economic Transformation Programm: A Roadmap for Malaysia; PEMANDU: Putrajaya, Malaysia, 2010. [Google Scholar]
  91. Gerbens-Leenes, P.; Hoekstra, A.; van der Meer, T. The water footprint of energy from biomass: A quantitative assessment and consequences of an increasing share of bio-energy in energy supply. Ecol. Econ. 2009, 68, 1052–1060. [Google Scholar] [CrossRef]
  92. Bernama. Monthly Household Income of Malaysians Increase. The Star Online. 22 June 2015. Available online: http://www.thestar.com.my/business/business-news/2015/06/22/monthly-household-income-of-malaysians-increases/?style=biz (accessed on 1 July 2015).
  93. Raghu, A. Labour Crunch Hurts Malaysian Palm Oil Growers as Indonesians Stay Home; Reuters: New York, NY, USA, 2014. [Google Scholar]
  94. Ludin, N.A.; Bakri, M.A.M.; Kamaruddin, N.; Sopian, K.; Deraman, M.S.; Hamid, N.H.; Asim, N.; Othman, M.Y. Malaysian oil palm plantation sector: Exploiting renewable energy toward sustainability production. J. Clean. Prod. 2014, 65, 9–15. [Google Scholar] [CrossRef]
  95. Sustainable Palm Oil Platform. Smallholders. Available online: http://www.sustainablepalmoil.org (accessed on 23 Jun 2015).
  96. Friends of the Earth, Life Mosaic and Sawit Watch. Losing Ground—The Human Rights Impacts of Oil Palm Plantation Expansion in Indonesia; Friends of the Earth, Life Mosaic and Sawit Watch: London, UK, 2008. [Google Scholar]
  97. Colchester, M.; Chao, S.; Dallinger, J.; Sokhannaro, H.E.P.; Dan, V.T.; Villanueva, J. Oil Palm Expansion in South East Asia—Trends and Implications for Local Communities and Indigenous Peoples; Forest Peoples Programme and Perkumpulan Sawit Watch: Bogor, Indonesia, 2011. [Google Scholar]
  98. Colchester, M. Palm Oil and Indigenous pEople in South East Asia; The International Land Coalition: Rome, Italy, 2011. [Google Scholar]

