Article

Hazard Assessment of Debris Flows in the Reservoir Region of Wudongde Hydropower Station in China

1
College of Construction Engineering, Jilin University, Ximinzhu Street 938, Changchun 130000, China
2
The Third Railway Survey and Design Institute Group Corporation, Tianjin 300143, China
3
Jilin Institute of Geological Environment Monitoring, Changchun 130000, China
*
Author to whom correspondence should be addressed.
Sustainability 2015, 7(11), 15099-15118; https://doi.org/10.3390/su71115099
Submission received: 9 September 2015 / Revised: 9 November 2015 / Accepted: 10 November 2015 / Published: 13 November 2015

Abstract

:
The outbreak of debris flows in a reservoir region can affect the stability of hydropower stations and threaten the lives of the people living downstream of dams. Therefore, determining the hazard degree of debris flows in a reservoir region is of great importance. SPOT5 remote sensing images and digital elevation models are introduced to determine the characteristics of debris-flow catchments. The information is acquired through comprehensive manual investigation and satellite image interpretation. Ten factors that influence debris flow are extracted for the hazard assessment. The weight of these factors is determined using the analytic hierarchy process method. As a multi-criterion decision analysis method, fuzzy synthetic evaluation is applied for hazard assessment.

1. Introduction

Debris flows are important geomorphic agents in mountainous terrains [1,2]. Large volumes of solid materials in catchments could be transported and deposited on urbanized fans because of large rainfall amounts in short time intervals, thereby endangering people and structures [3,4]. Based on comprehensive examinations of daily rainfall data in debris flow occurrence areas in China, a small limiting value of daily rainfall (=60 mm) was proposed for Sichuan, Yunnan, and Guizhou Provinces in Southwest China [5]. In geomorphology, approximately 66.7% of the area of China is occupied by mountains. Therefore, China is one of the countries that are the most seriously affected by debris flows. Annual estimates of losses caused by debris flows reach 2 billion RMB and 300 to 600 deaths [6]. In particular, debris flow is a common hazard in Southwest China.
Debris flows occur when masses of poorly-sorted sediment, agitated and saturated with water, surge down slopes [7,8,9,10,11]. Solid and fluid forces influence the motion of debris flows, which distinguishes debris flows from phenomena, such as rock avalanches and water floods. Thus, the solid and fluid forces must act in concert to produce a debris flow [7]. Like water floods, debris flows are fluid enough to travel long distances in channels and to inundate vast areas. All debris flows involve gravity-driven motion of a finite but possibly-changing mass of poorly-sorted, water-saturated sediment that deforms irreversibly. Total sediment concentrations slightly differ from those of static, unconsolidated sediment masses.
The outbreak of a large-scale debris flow in a reservoir region severely affects the construction and stability of a hydropower station. According to Liu [12], a large-scale debris flow indicates that the debris-flow catchment, main channel length, and maximum elevation differences are large. Furthermore a large-scale debris flow catchment may contain massive volume of loose material. The discharge from debris-flow catchments may affect rivers and therefore cause a huge mass of water to surge quickly, thereby hindering the construction process of nearby hydropower stations and threatening the lives of people living downstream hydropower stations [13]. Therefore, the assessment of debris flows in reservoir regions is the most important task to ensure the success and safety of the construction process of a hydropower-station.
When debris flow occurs, the rushing out of material considerably impacts hydropower stations. A debris flow hazard can be defined as a combination of debris flow probability of occurrence and magnitude. Considerable research was motivated by the potential for loss or damage by debris flows and the need to assess and mitigate the hazard. The speed and volume of debris flows make them very dangerous. Many people are killed annually by debris flows worldwide [14]. This hazard can be reduced by identifying areas that can potentially produce debris flows, educating people who live in those areas and govern them, limiting development in debris flow hazard areas, and developing a debris flow mitigation plan [15,16]. The hazard assessment of debris flows interests toward debris-flow hazard assessments grew over the last decade [17,18,19,20]. Implementing prevention projects for debris flow catchments with higher hazard as a priority is an effective way to mitigate economic loss and fatalities. The process of the hazard assessment of debris flows consists of three steps. The first step is to acquire information on debris flow catchments, which is the fundamental work in assessing the hazard degree of debris flows. Debris flow catchments are characterized by a significant altimetric gradient and numerous cliffs that are often extremely vast and rugged, rendering these areas inaccessible. These features pose a significant challenge to engineers and geologists in conducting manual investigations to gather information on the characteristics of debris-flow catchments [21]. Therefore, geographic information systems have been applied to hazard assessment in recent years as a useful tools for processing spatial data and displaying results [17,22]. In this study, information on 239 debris flow catchments in the reservoir region of the Wudongde Dam was acquired through manual investigation and satellite image interpretation. We visited the sites of 26 debris flow catchments to obtain a better understanding of the landscape’s changes and associated consequences faced by local communities. The second step is to select the influencing factors that are critical to debris flow hazard assessment. These factors include topography, geology, hydrology, and meteorology. In this work, 10 factors were chosen to assess the hazard degree of 239 debris flow catchments. The third step is to use an evaluation method to calculate the hazard degree of debris flows. In the evaluation process, the weight of each influencing factor is critical to the assessment result. Different weights directly influence the evaluation result. Consequently, the validity of the weights must be ensured. The analytic hierarchy process (AHP), proposed by Saaty [23,24], was applied in this study to determine the weight of each influencing factor. Fuzzy synthetic evaluation (FSE) is a multi-criterion decision analysis method used in many different fields [25,26,27,28]. In this study, FSE was adopted for the calculation of the hazard degree of the 239 debris flow catchments in the reservoir region of the Wudongde hydropower station.

2. Study Area

The study area covers both banks of the Jinsha River in the reservoir region of the Wudongde hydropower station. The Wudongde Dam is a massive hydropower station to be constructed in the lower reaches of the Jinsha River. The dam is located in Wudongde Village, Luquan County, Yunnan Province (Figure 1). The water level of the Jinsha River is approximately 810 m at the dam site. The normal water storage level is expected to reach 975 m after the construction of the dam. The upstream extremity of the reservoir is covered by the Jinsha River in Panzhihua City. The reservoir is 209 km. The study area is located in the central mountain and alpine region with 3600 m as the highest altitude. The topography gradually increases from west to east of the study area (Figure 2).
The study area also covers the dry-hot valley of the Jinsha River and has a low-latitude plateau subtropical monsoon climate. This climate is characterized by plentiful sunlight and large evaporation capacity, with concentrated rainfall and discriminative succession of wet and dry seasons. According to the local rainfall monitoring station the maximum daily rainfall of the study area ranges between 834 and 1309 mm. The heaviest rainfall occurs from May to October and peaks in July. The average peak of 24 h rainfall is 110 mm. The annual average temperature of the study area is between 9 and 18 °C. The vegetal cover is characterized by natural savanna and sparse broad-leaved woods. The vegetation in the study area covers less than 30%.
A total of 239 debris-flow catchments can be found along the Jinsha River in the study area. Of the 239 debris-flow catchments, 135 are on the left bank of the river, and the remaining 104 debris-flow catchments are on the right bank of the river.
Figure 1. Study area.
Sustainability 07 15099 g001
Figure 2. The terrain of the study area.
Sustainability 07 15099 g002

3. Data Acquisition

Data acquisition of the debris flow catchments is the fundamental work of hazard assessment. The factors that influence the occurrence of debris flows include topography, geology, hydrology, meteorology, vegetation, and human activity [29,30]. Table 1 shows the details of these influencing factors. The traditional approach for the information acquisition of debris flow catchments is field investigation. However, these investigations are generally time consuming. Moreover, some debris flow catchments are inaccessible. With the development of remote sensing technology, satellite images, and aerial photos have been widely used to determine and study engineering geological hazards [31,32,33,34,35]. In this present study, information on debris flow catchments in the reservoir region under investigation was acquired through satellite image interpretation.
Table 1. Influencing factors for debris-flow occurrences.
CategoryInfluencing Factors
TopographyBasin area, main channel length, maximum elevation difference, average slope of material source region, average gradient of the main channel, ravine density, main channel sinuosity
GeologyLoose material volume, active main channel proportion
HydrologyMaximum daily rainfall, Average annual rainfall
VegetationVegetation coverage, the normalized difference vegetation index
Human activityReclaim wasteland index, population density

4. Methodology

4.1. Interpretation of Satellite Images

4.1.1. SPOT5 Remote Sensing Images

SPOT5 was launched in May 2002 by France. SPOT5 remote sensing images have been widely used to identify and assess geological hazards. The resolution of SPOT5 multispectral images is 10 m, and that of panchromatic images is 2.5 m. The interpretation range of the satellite images in this investigation is within 15 km on both banks of the Jinsha River in the reservoir region. The total area is approximately 6000 km2 (Figure 1). A resolution of 2.5 m and the scale of 1:10,000 are employed.
The alluvial fans, watershed boundaries and ravine systems of the debris flow catchments are identifiable from the SPOT5 images (Figure 3). Using the function of MapGIS software, several characteristics of a debris flow catchment are acquired, such as the location, basin area, ravine density, main channel length, main channel sinuosity, and area of the alluvial fan. The vegetation coverage and population density can also be calculated from the SPOT5 images. The vegetation coverage is calculated based on the normalized difference vegetation index, which can be easily extracted from the SPOT5 images [36,37]. The buildings are also easily identified in SPOT5 images (Figure 3). The population density is estimated based on the number of buildings.
Figure 3. SPOT5 image of a catchment.
Sustainability 07 15099 g003

4.1.2. Digital Elevation Model (DEM)

Several characteristics of debris-flow catchments can be obtained in the two-dimensional SPOT5 images. However, the characteristics related to height are unavailable. Therefore, we introduce DEM, which is established based on topographic base maps with scales of 1:10,000. Figure 4 shows a slice of DEM. By combining DEM and SPOT5 images, three-dimensional images of a catchment prone to debris flow can be obtained (Figure 5). The watershed boundaries and ravine system are more well-defined in the three-dimensional images than in the two-dimensional images. Three-dimensional information on debris-flow catchments, such as maximum elevation difference, average gradient of the main channel and average slope of the material source region, can be obtained from the three-dimensional images.
Figure 4. A slice of DEM.
Sustainability 07 15099 g004
Figure 5. Three-dimensional image of a catchment prone to debris flow.
Sustainability 07 15099 g005

4.2. Influencing Factors

The hazard degree of debris flows is determined by their characteristics. Thus, the choice of influencing factors is critical to the assessment results. Liu [12] conducted a questionnaire survey to determine the primary influencing factors according to experts in the field of debris flow. After analyzing the survey results using the grey relation analysis, he proposed that magnitude and frequency are the two primary influencing factors. Liu then studied the relationship between the primary and secondary influencing factors using the grey relation theory and determined eight secondary influencing factors. These secondary influencing factors include the basin area, main channel length, maximum elevation difference, ravine density, main channel sinuosity, active main channel proportion, maximum daily rainfall, and population density. These ten factors are introduced in detail as follows:
(1) Debris flow magnitude M
Debris flow magnitude refers to the maximum depositional volume of a debris flow. This parameter can be represented by the maximum single debris flow deposits in the depositional area. Hungr et al. [38] considered the discharge volume to be a comprehensive index that reflects the degree of hazard of debris flows.
(2) Frequency F
Frequency is the number of debris flow occurrence in 100 years. The higher the debris flow frequency, the higher the probability of debris flow hazards. Frequency is a direct indicator of debris flow hazard and should also be considered as a primary influencing factor. The value is then scaled to the occurrence times 100 years regardless of the time span. Frequency is obtained through a number of related history records, literature review, and local geological data. Frequency can also be obtained through interviews with local elders, considering landscape changes and associated consequences faced by local communities. Thereby, we could obtain the outbreak of debris flow near the village.
(3) Basin area S1
Basin area reflects the volume of the loose material and collected water. The basin area is generally directly proportional to the volume of the loose material and collected water [39].
(4) Main channel length S2
A greater main channel length results in greater flow length and influx of loose material along the channel. Therefore, the main channel length is an influencing factor.
(5) Maximum elevation difference S3
Maximum elevation difference is the elevation difference between the highest and the lowest points in a watershed. This value reflects the potential energy of a debris flow. A larger maximum elevation difference generally results in a larger potential energy and greater destructive force of debris flow.
(6) Ravine density S4
Ravine density is the ratio of the total ravine length to the basin area. This value comprehensively reflects the geological structure, lithology, and degree of rock weathering because ravines commonly develop in weak areas. With an increase in ravine density, the volume of debris flow increases [19,20].
(7) Main channel sinuosity S5
Main channel sinuosity is the ratio of the actual length to the linear length of the main channel. This value reflects the blockage of a debris flow gully. A larger value indicates that a channel is easier to block. This value also indirectly reflects the flow volume.
(8) Active main channel proportion S6
The active main channel proportion is the ratio of the length of the portion of the channel containing loose material to the total channel length. This value comprehensively reflects the supply range and volume of loose material.
(9) Maximum daily rainfall S7
Water is an important component of debris flows, and rainfall triggers the occurrence of such phenomena. The maximum daily rainfall reflects the potential kinetic energy of debris flows.
(10) Population density S8
Population density and occurrence of debris flows are closely related. Human activity, such as deforestation and slope cutting, seriously accelerates the formation and development of debris flows.
In this study, the above-mentioned ten influencing factors are chosen for the hazard assessment of debris flows. Based on grey relation theory, Liu determined the order of importance of these ten factors as follows: M = F > S1 > S4 > S2 > S3 > S6 > S7 > S8 > S5.

4.3. Analytic Hierarchy Process

In the evaluation process, the weight of each influencing factor is critical to the assessment result. Hence, the validity of the weights must be ensured. The Analytic Hierarchy Process (AHP), as proposed by Saaty [23,24], is an effective measure to determine the weight set. The process is as follows:
(1) Structure of the judgment matrix
The AHP method builds on pairwise comparison to determine the relative importance of one factor over another. The matrix of pairwise comparisons for n factors can be written as:
D = [ d i j ] = [ C 1 / C 1 C 1 / C 2 C 1 / C n C 2 / C 1 C 2 / C 2 C 2 / C n C i / C j C n / C 1 C n / C 2 C n / C n ]
where C i / C j represents the comparison of factor C i to factor C j , and d i j denotes the relative importance of factor C i with respect to factor C j .
A numerical scale is necessary to indicate the magnitude of the importance of one factor over another. The classical 1–9 scale is applied in this work because of its advantages of good original order-keeping, uniformity of scale and perceptibility [40]. The scale is shown in Table 2.
Table 2. The 1–9 pairwise comparison scale.
Intensity of WeightDefinitionExplanation
1Equal importanceTwo factors contribute equally to objectives
3Weak/moderate importance of one over anotherExperience and judgment slightly favored one factor over another
5Essential or strong importanceExperience and judgment strongly favor one factor over another
7Very strong or demonstrated importanceOne factor is favored very strongly over another; its dominance demonstrated in practice
9Absolute importanceEvidence favoring one factor over another is of the highest possible order of affirmation
2,4,6,8Intermediate values between the two adjacent scale valuesUsed to represent compromise between the priorities listed above
Reciprocals of above non-zero numbers If factor i has one of the above non-zero numbers assigned to it when compared to factor j, then factor j has the reciprocal value when compared with factor i
(2) Calculation of the weight set
The weight of C i is obtained using the row geometric mean method [41].
w i = j = 1 n d i j n
The weight set W = ( w 1 , w 2 , , w i , , w n ) is normalized according to the following:
W = ( w 1 w i , w 2 w i , , w n w i )
From this normalized set of weights, the priority or importance of the factors is obtained.
(3) Verification of consistency
To guarantee that the judgments are reasonable, consistency verification should be conducted. The consistency index C I is given by:
C I = λ max n n 1
where λ max is the largest eigenvalue of the judgment matrix and n is the order of the matrix.
The criterion of the consistency verification is given by:
C R = C I R I < 0.1
where R I can be obtained from the value table of the consistency index R I . The values of R I when the order of the matrix is between 3 and 10 are listed in Table 3. When C R is less than 0.1, the judgment matrix D can be considered completely consistent. If C R is larger, the matrix should be modified to satisfy the consistency check.
Table 3. The values of consistency index RI.
Order345678910
RI0.580.901.121.241.321.411.451.49

4.4. Fuzzy Synthetic Evaluation

The following procedure describes the Fuzzy Synthetic Evaluation (FSE) method.
(1) Selection of factor set U: U = {ui}, i = 1, 2,…, n.
where n is the number of selected evaluation factors. In this study, n is equal to 10 and the details of the ten factors are given in Section 4.2.
(2) Construction of the evaluation criteria set V: V = {vj}, j = 1, 2,…, m.
where m is number of evaluation criteria categories, and v j is the threshold of the jth criteria category. The details of the threshold of each factor used in this study are given in 
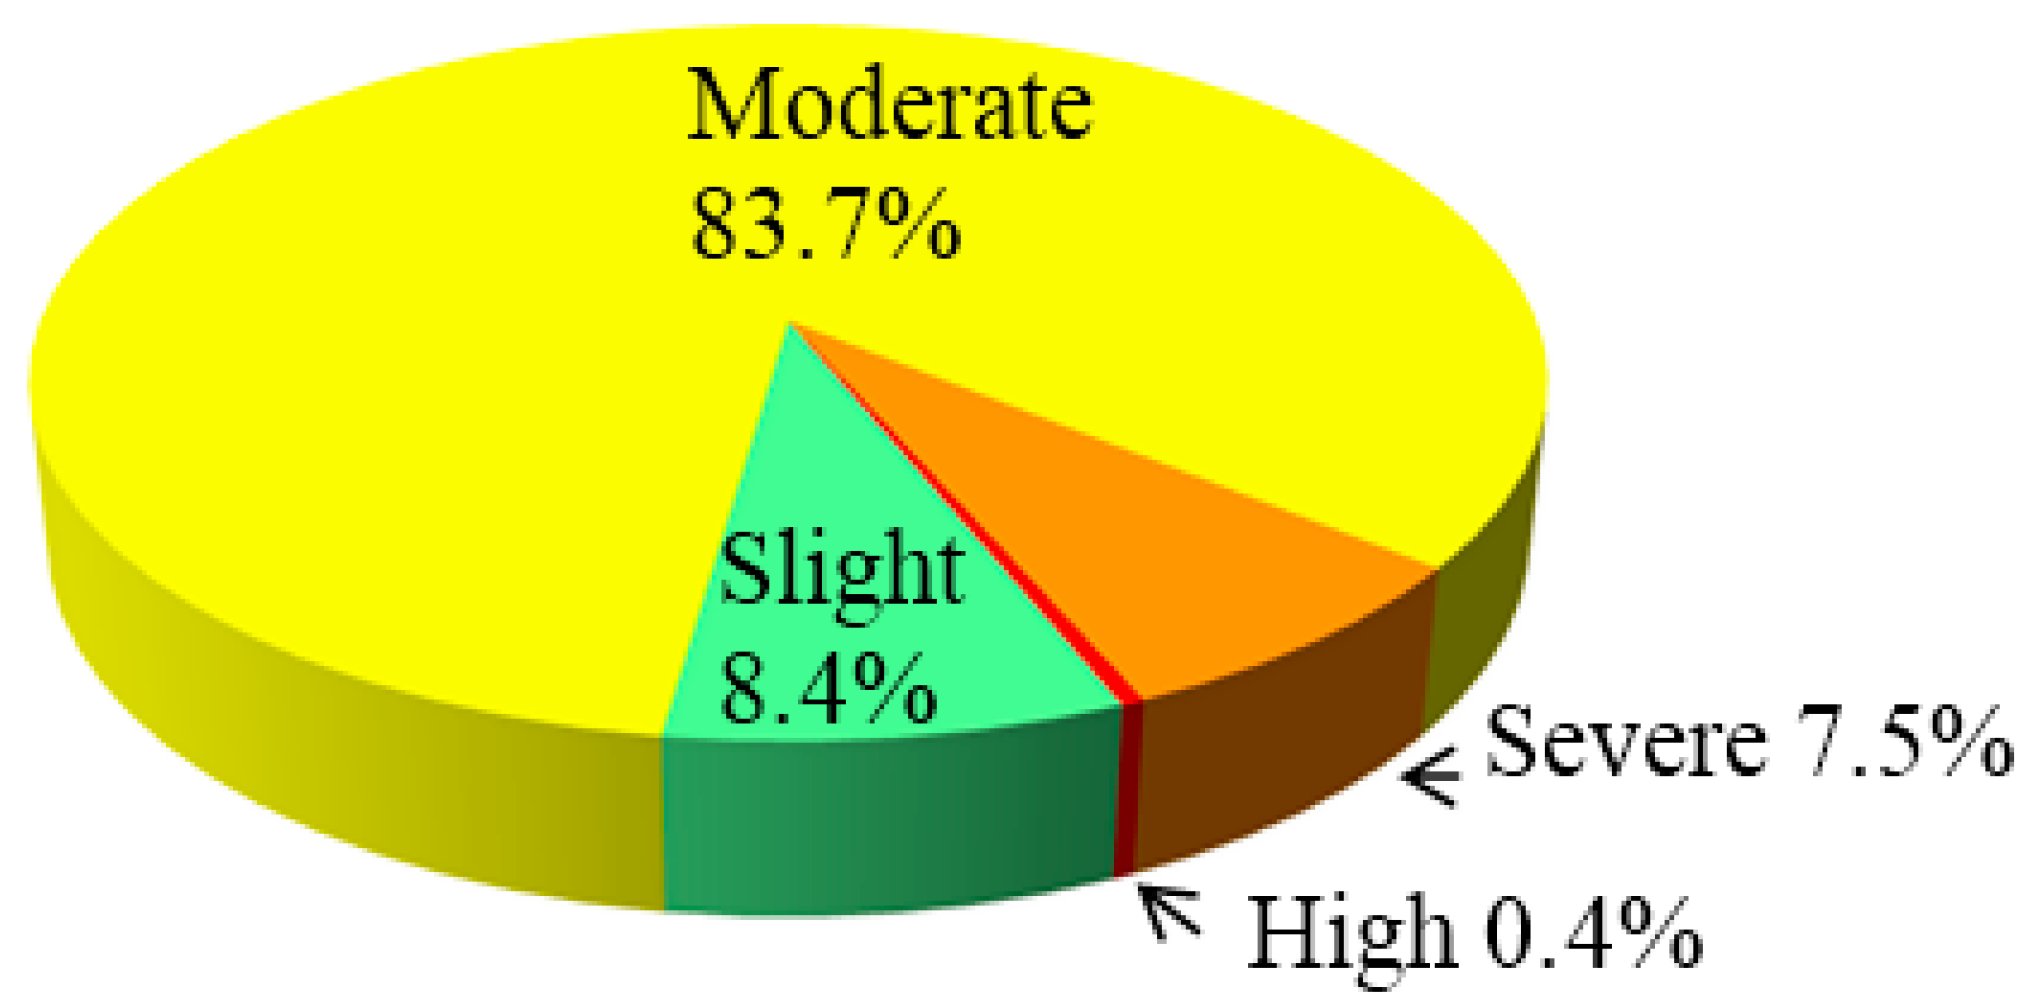
Section 4.2. In this study, the outputs of hazard assessment are classified into four levels: slight, moderate, severe and high. Therefore, we choose V = { v 1 , v 2 , v 3 , v 4 } , and m = 4 .
(3) Establish membership functions
In fuzzy logic, the set A is defined in terms of its membership function by A = { f A ( x ) , x X , f A ( x ) [ 0 , 1 ] } . where X is a domain, with a generic element of X denoted by x ; f A ( x ) is the membership function of the set A , which maps the domain X onto the interval [0,1], and f A ( x ) represents the degree that x belongs to set A . x is a full member of A when f A ( x ) = 1 , is not member of A when f A ( x ) = 0 , and is a partial member of A when f A ( x ) ( 0 , 1 ) [42].
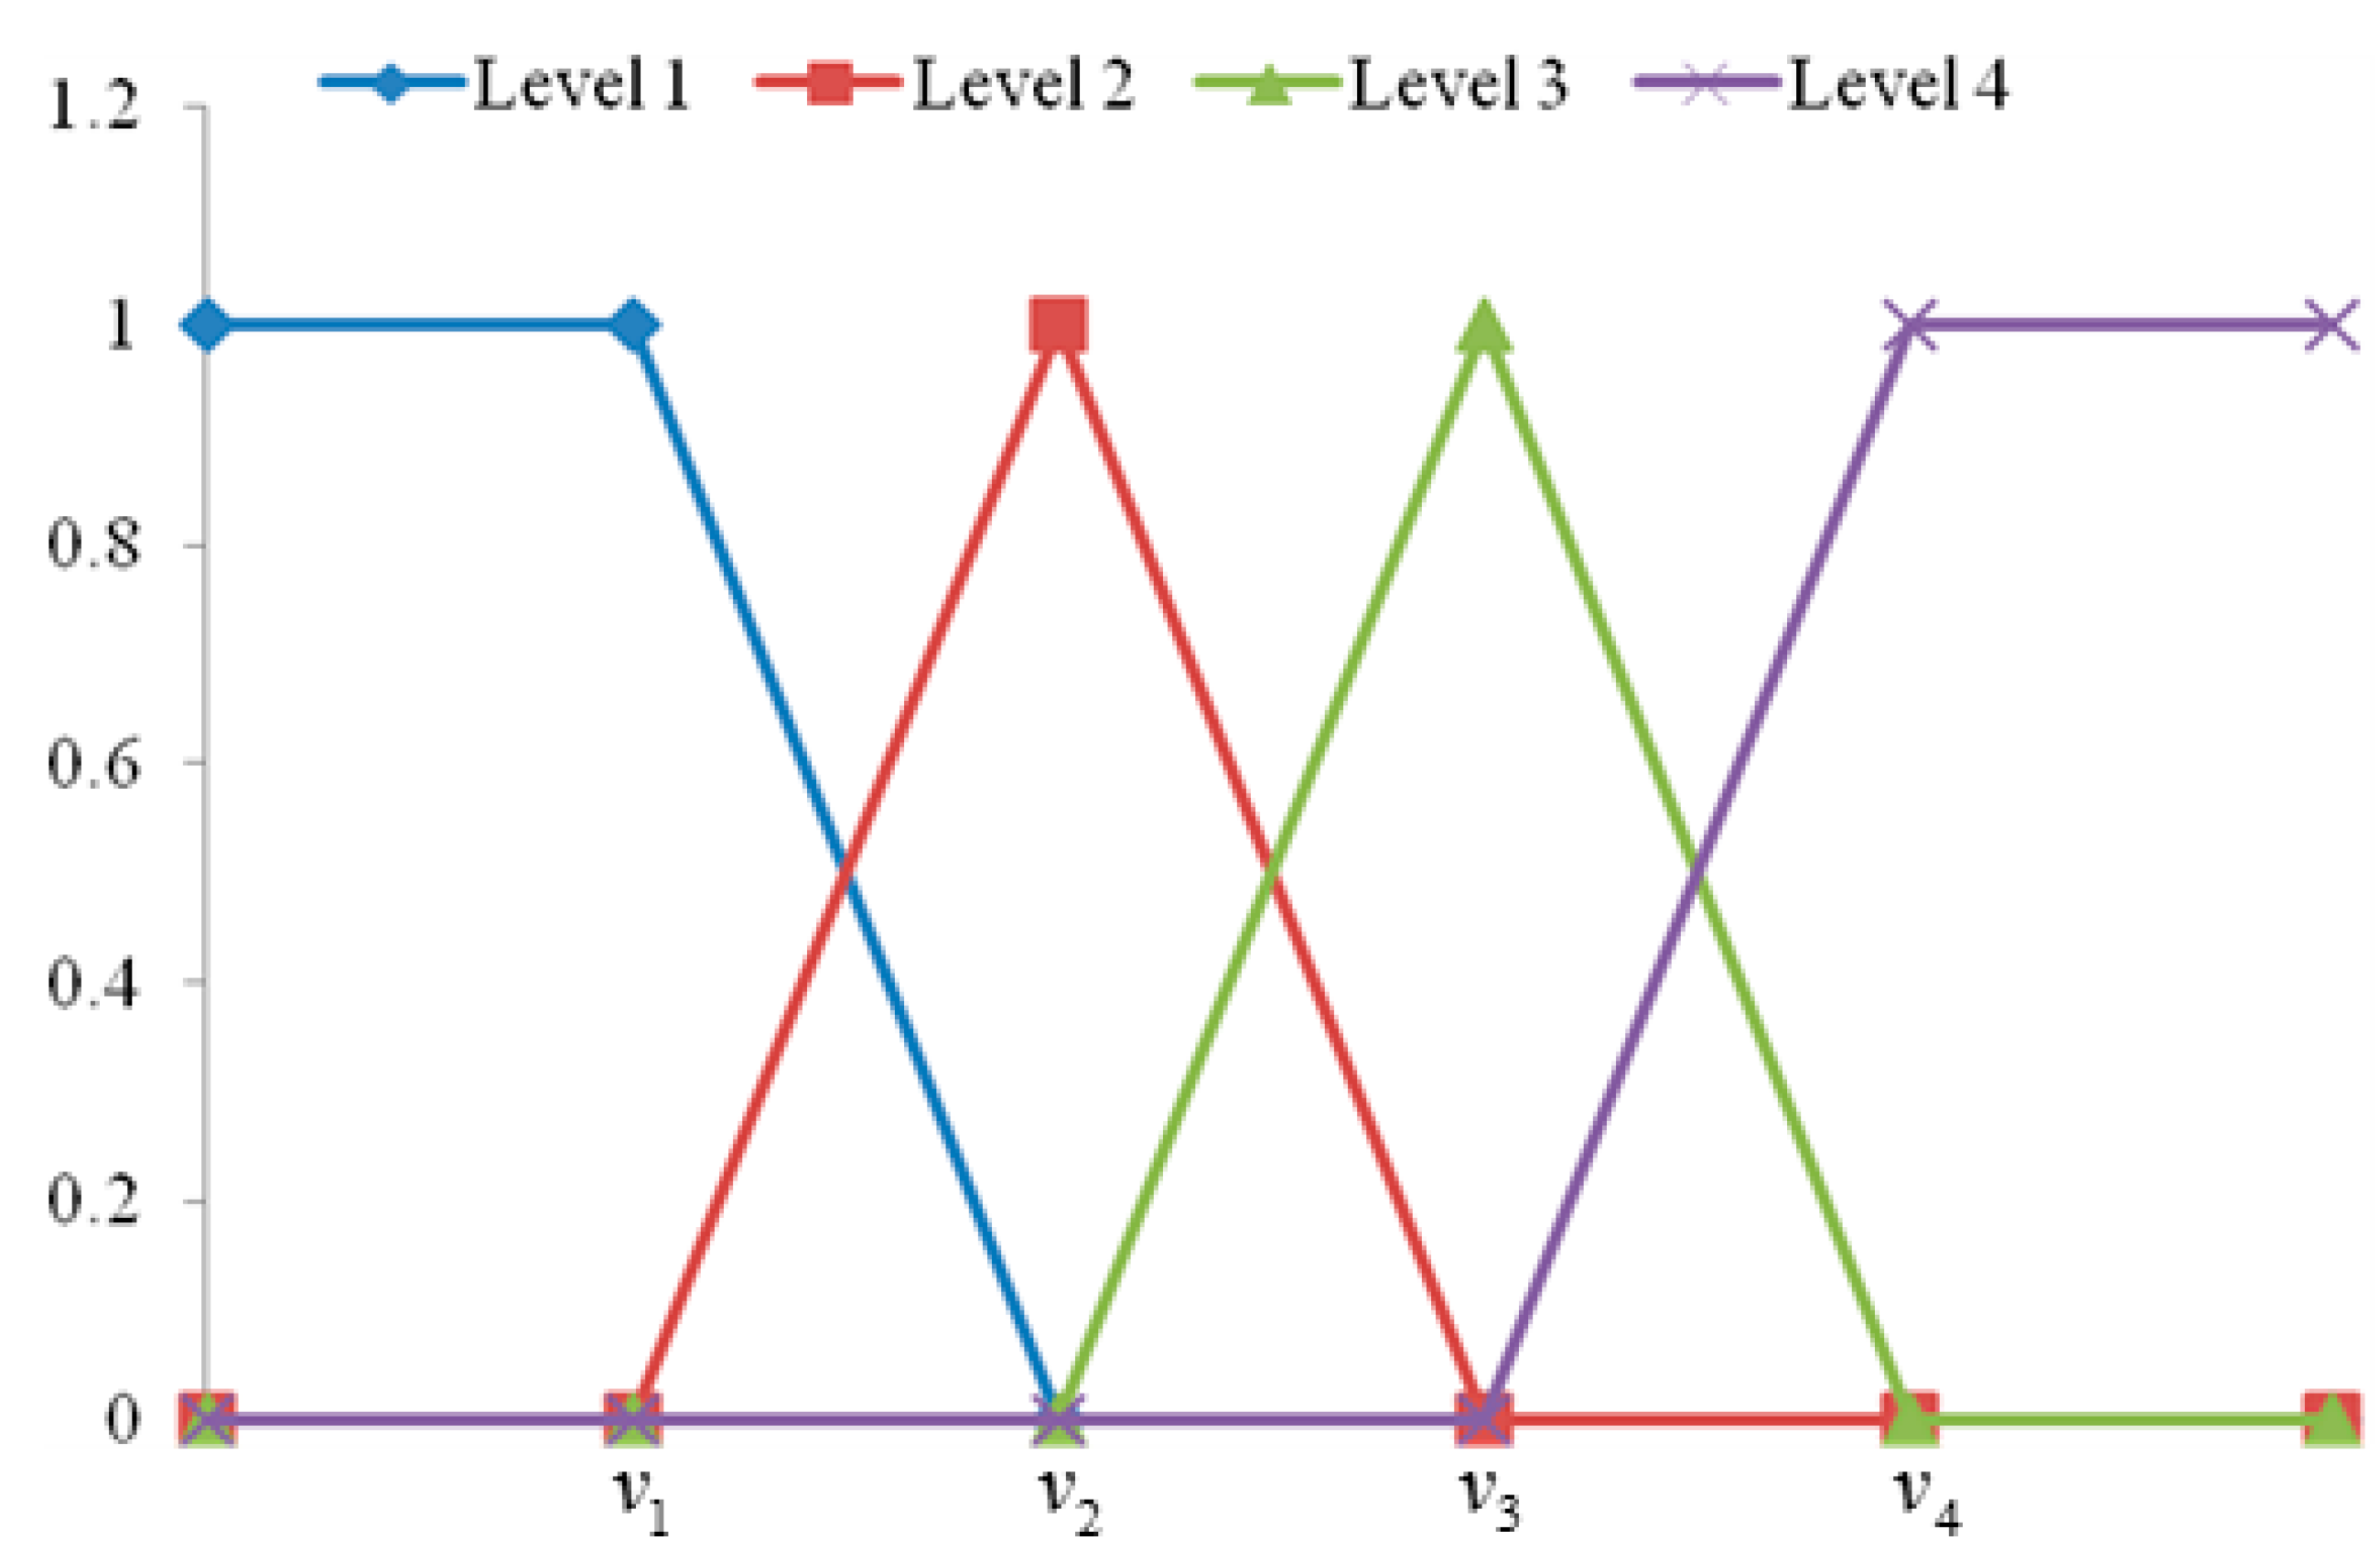
The membership functions of each assessment factor to the assessment criteria at each level can be described quantitatively by a set of formulas. The factors directly proportional to the hazard degree are called increasing factors. By contrast, the factors inversely proportional to the hazard degree are called decreasing factors. The membership functions of increasing factors are different from those of decreasing factors. All the factors chosen in this study are increasing factors. Therefore, the membership functions of the increasing factors are given as follows:
f i j ( x i ) = { 0 x i > v i ( j + 1 ) v i ( j + 1 ) x i v i ( j + 1 ) v i j v i j x i v i ( j + 1 ) 1 x i < v i j j = 1
f i j ( x i ) = { 0 x i > v i ( j + 1 ) , x i < v i ( j 1 ) x i v i ( j 1 ) v i j v i ( j 1 ) v i ( j 1 ) x i v i j v i ( j + 1 ) x i v i ( j + 1 ) v i j v i j < x i v i ( j + 1 ) j = 2 , 3
f i j ( x i ) = { 0 x i < v i ( j 1 ) x i v i ( j 1 ) v i j v i ( j 1 ) v i j x i v i ( j + 1 ) 1 x i > v i j j = 4
where i is the number of assessment factors (i = 1, 2,…, 10); j is the number of assessment criteria levels (j = 1, 2, 3, 4); x i is the actual value of assessment factor i ; v i j , v i ( j 1 ) , and v i ( j + 1 ) are the assessment criteria threshold of the ith assessment factor at levels j , j 1 and j + 1 , respectively; and f i j ( x i ) is the membership degree of assessment factor i at level j . The constructed membership functions for the factors are shown in Figure 6.
Figure 6. Ten influencing factors’ membership functions.
Sustainability 07 15099 g006
(4) Calculation of fuzzy relationship matrix R
Substituting the data of each assessment factor and the gradation criteria into the constructed membership functions above, the fuzzy matrix R can be expressed as follows:
R = [ r 11 r 12 r 1 m r 21 r 22 r 2 m r i j r n 1 r n 2 r n m ]
where r i j = f i j ( x i ) is the membership degree of the ith assessment factor to the assessment criteria at jth level. In this study, n = 10 ; m = 4 ; (i = 1, 2,…, 10); and (j = 1, 2, 3, 4).
(5) Determination of the weight set W
The weight set W is obtained using the AHP method.
(6) Calculation of the relative importance set B
B = W * R = ( b 1 , b 2 , b m )
where W and R are the weight set and the fuzzy relationship matrix determined above, respectively; * is a fuzzy composite operator; and B is a fuzzy set. The fuzzy composite operator is critical and affects the final evaluation results. The weighted average fuzzy composite operator is used widely in a variety of resource and environmental evaluation systems [43,44]. The weighted average fuzzy composite is shown in the following equation:
b i = i = 1 n w i r i j
(7) Determination of the final evaluation result
The final evaluation result is determined by the following equation: Level = max{b1, b2, …, bm}. where the maximum value of b i determines the level of hazard degree.

5. Results

As mentioned in Section 4.2, the selected ten evaluation indicators include debris flow magnitude M, frequency F, basin area S1, main channel length S2, maximum elevation difference S3, ravine density S4, main channel sinuosity S5, active main channel proportion S6, maximum daily rainfall S7, and population density S8. The weight set of the ten factors is calculated using the AHP method. The judgment matrix is given as:
D = [ 1 1 2 4 5 3 9 6 7 8 1 1 2 4 5 3 9 6 7 8 1 / 2 1 / 2 1 3 4 2 8 5 6 7 1 / 4 1 / 4 1 / 3 1 2 1 / 2 6 3 4 5 1 / 5 1 / 5 1 / 4 1 / 2 1 1 / 3 5 2 3 4 1 / 3 1 / 3 1 / 2 2 3 1 7 4 5 6 1 / 9 1 / 9 1 / 8 1 / 6 1 / 5 1 / 7 1 1 / 4 1 / 3 1 / 2 1 / 6 1 / 6 1 / 5 1 / 3 1 / 2 1 / 4 4 1 2 3 1 / 7 1 / 7 1 / 6 1 / 4 1 / 3 1 / 5 3 1 / 2 1 2 1 / 8 1 / 8 1 / 7 1 / 5 1 / 4 1 / 6 2 1 / 3 1 / 2 1 ]
Consequently, the weight set of the influencing factors is established according to Equations (2) and (3) as follows: W = (0.239, 0.239, 0.167, 0.081, 0.056, 0.116, 0.015, 0.039, 0.028, 0.020). The value of the consistency index C R is 0.035, which is less than 0.1. The judgment matrix D meets the consistency requirements.
All the indicator values of the 239 debris flow catchments cannot be listed in a table in this paper given the limitations in space; Table 4 shows only the indicator values of the selected 26 debris flow catchments.
Table 4. The indicator values of the selected 26 debris-flow catchments.
GullyM (×104 m3)F (Numbers/100 Years)S1 (km2)S2 (km)S3 (km)S4 (km−1)S5S6S7 (mm)S8 (Person/km2)
Xiabaitan7.04543.13.081.265.511.190.2211040
Shangbaitan5.7740.911.870.6710.291.080.59110110
Zhugongdi6.89236.54.981.346.241.150.511050
Yindi23.63560.520.172.255.081.230.2411020
Canyu25.732325629.631.482.261.470.261104
Xiushui3.958.582.21.676.91.20.351105
Menggu31.410237.110.521.746.731.130.4611010
Jiache68.759915.65.071.337.41.220.561106
Fujia12.9668.625.161.536.341.260.4411010
Aiba35.23236.665.091.438.431.190.8711040
Zhuza31.211152.626.31.34.321.70.081104
Heizhe15.035251.713.91.315.121.150.121109
Yanshuijing18.5548.5814.431.359.251.220.291102
Nuozhacun77.957732.6110.51.154.961.170.6211030
Lalakuang22.9712017.887.141.415.521.080.721105
Zhangmu5.54474.625.390.739.71.420.611010
Hepiao5.1209.16.831.089.91.320.2911020
Hongmenchang30.53746.912.91.926.61.290.5411020
Tianfang2317113.15.61.069.31.170.6111030
Zhili46.519120.615.81.616.31.280.4511012
Yajiede6.86622.39.31.614.71.310.1811011
Pingdicun11.511024.29.91.475.91.140.7311030
Fangshanguo47.9279820.21.394.631.380.6711030
Daqian13.57418.95.10.5910.951.110.74411015
Fapa16.411224.113.121.435.221.260.4711030
Daqing7.22631.87.320.646.021.10.4911010
The evaluation criteria set V = { v 1 , v 2 , v 3 , v 4 } is chosen to correspond to the four hazard degrees as mentioned earlier. Based on previous studies [21,29,45,46], the threshold of each indicator at each level is listed in Table 5.
Table 5. Gradation criteria threshold for each evaluation factor on hazard assessment of debris flows.
FactorClassification Level ThresholdFactorClassification Level Threshold
SlightModerateSevereHigh SlightModerateSevereHigh
M (×104 m3)110100200S4 (km−1)5102050
F (numbers/100 years)1050100200S51.11.251.41.6
S1 (km2)0.5103550S60.10.30.61
S2 (km)151020S7 (mm)2550100200
S3 (km)0.20.512S8 (person/km2)50150250350
All the evaluation indicators are increasing factors. The fuzzy matrix R of the debris-flow catchments can be calculated using Equations (6)–(8). The weight set W was obtained in Section 5. The relative importance set B is computed using Equations (10) and (11). The final evaluation results of the debris flows are determined by the relative importance set B . The final evaluation results and the relative importance of the set of 26 debris flows are listed in Table 6. Figure 7 shows the hazard assessment results of the 239 debris flow catchments in the reservoir region.
Table 6. The relative importance set and the final hazard assessment results.
Debris-Flow CatchmentThe Relative Importance SetAssessment LevelExtension TheoryGrey Relation
SlightModerateSevereHigh
Xiabaitan0.3850.5120.0860.017ModerateModerateModerate
Shangbaitan0.3600.4370.2000.003ModerateModerateModerate
Zhugongdi0.4230.4670.0890.022ModerateModerateModerate
Yindi0.2410.3910.0610.307ModerateModerateModerate
Canyu0.3060.3050.1060.283SlightSlightSlight
Xiushui0.5790.3300.0500.041SlightSlightSlight
Menggu0.1080.2440.5720.077SevereSevereSevere
Jiache0.0840.3650.2910.260ModerateModerateModerate
Fujia0.1290.6790.1590.033ModerateModerateModerate
Aiba0.1210.4480.1380.292ModerateModerateModerate
Zhuza0.4120.1850.1210.282SlightModerateSlight
Heizhe0.418 0.2370.1270.219SlightSlightSlight
Yanshuijing0.281 0.3640.1450.209ModerateModerateModerate
Nuozhacun0.144 0.0810.5180.256SevereSevereModerate
Lalakuang0.139 0.3770.4000.084SevereSevereSevere
Zhangmu0.259 0.6270.1100.004ModerateModerateModerate
Hepiao0.349 0.5300.1140.007ModerateModerateModerate
Hongmenchang0.1790.3990.2110.211ModerateModerateModerate
Tianfang0.0440.5290.2510.177ModerateModerateModerate
Zhili0.2900.2590.2010.251SlightSlightSlight
Yajiede0.4820.2760.2050.037SlightSlightSlight
Pingdicun0.1260.3330.4740.066SevereSevereSevere
Fangshanguo0.2710.2440.2050.280HighHighHigh
Daqian0.0340.6920.2570.017ModerateModerateModerate
Fapa0.3590.3410.2470.052SlightSevereSevere
Daqing0.4400.3090.2490.003SlightSlightSlight

6. Discussion

The fuzzy comprehensive evaluation method could transform qualitative to quantitative evaluation based on the membership degree theory of fuzzy mathematics. This method has numerous advantages including clear results and strong system characteristics. It can solve fuzzy and hard-to-quantify problems and is also suitable for all types of problems. The hazard assessment of debris flows is a complex problem. The hazards of debris flow are determined using many influencing factors, in which fuzziness and uncertainty in the assessment process exist. The qualitative and quantitative indices are difficult to transform, which makes the assessment inaccurate. Identifying the hazard degree of debris flows with an ordinary method is difficult. However, this paper used the fuzzy comprehensive evaluation method to evaluate the hazard degree of debris flow including many indices. The hazard degree is divided into four classifications, namely, slight, moderate, severe, and high. The calculated results are listed in Table 6. In the four hazard degrees, the value of the relative importance set corresponding degree is the debris flow catchment assessment result. Taking the Xiabaitan debris flow catchment for example, the four calculated hazard degree results were 0.385, 0.512, 0.086, and 0.017 respectively. The moderate hazard degree value was 0.512, which is the largest among the four values. Thus, the Xiabaitan debris flow catchment was assessed as moderate hazard. The other debris flow catchment assessment results were determined using the above mentioned method.
According to the results of the hazard assessment, 20 of the debris flow catchments in the reservoir region have a slight hazard degree accounting for 8.4%, 200 have a moderate hazard degree accounting for 83.7%, 18 have a severe hazard degree accounting for 7.5%, and only one gully has a high hazard degree. The magnitude and frequency of Jiache and Nuozhacun in the 26 gullies are both high, but the two gullies are classified as moderate and severe. The weights of the two factors weights are similar (0.239), and the weight of basin area is 0.167. The basin area also exhibits a great weight. Nuozhacun is twice as large as Jiache, implying that Nuozhacun is more hazardous than Jiache. Nuozhacun is severe hazardous, and Jiache is reasonably moderate hazardous. This study also compared the results of the new method with two similar approaches: extension theory and the grey relation analysis. The latter two methods have been widely used in debris flow hazard assessment [12,21,29], and in many current engineering projects. However, these two methods exhibit their own limitations, such as instances of inaccuracy of the approach evaluation results. The results from the assessment of 23 of the debris flows using our new methods are comparable to those of the validation methods (Table 6). The extension theory and grey correlation are widely used in many engineering applications. A method that can accurately predict 100% in engineering is not available. However, many references demonstrated that the two methods used for validation are appropriate [47,48,49].
By contrast, the results for the three debris-flow catchments, Zhuza, Nuozhacun and Fapa, are inconsistent. It could be verified by the original manual investigation and qualitative recognition. Floods, rather than debris flows, easily occur in gully basin areas of more than 100 km2. The Zhuza catchment covers 152.6 km2. Moreover, the slight hazard degree value is 0.412, which is much larger than those of the other three hazard degree values. And the hazard degree of Zhuza is slight, better than moderate. The values of the two most weighted variables of Nuozhacun, magnitude and frequency, are considerably large. The frequency is particularly 577 times per 100 years, which is much more frequent than other debris flow catchments. Thus, the Nuozhacun is severely hazardous. Similarly, the values of two most weighted variables of Nuozhacun are approximately the same. Amongst the 26 debris-flow catchments, the two values of Fapa are slightly smaller than those of Zhuza gully. Accordingly, the Fapa catchment is assessed as slightly hazardous.
The number of catchments with each assessment level is also displayed graphically in Figure 8. A large majority of debris flow catchments have slight and moderate hazard degrees, with only a few catchments having severe and high hazard degrees. Amongst the catchments with severe hazard degree, the nearest to the dam is 6 km away from the hydropower station. Only one debris flow catchment has a high hazard degree. The distance between the catchment and the dam is 74 km.
Figure 7. Hazard degree of debris flows in the reservoir region.
Sustainability 07 15099 g007
Figure 8. Statistics of the hazard assessment results of debris flows.
Sustainability 07 15099 g008

7. Conclusions

In case of the occurrence of a future debris flow event the discharge of a debris and water would block the river, causing a huge mass of water to surge quickly, thereby hindering construction processes in nearby hydropower stations and threatening the lives of people living downstream of these stations. Therefore, the hazard assessment of debris flows in this area is of the utmost importance.
The traditional approach to acquire information on debris flow catchments is generally very costly and time consuming. Moreover, debris flow catchments are widely distributed and consist of numerous cliffs, thereby rendering these places inaccessible. In this study, SPOT5 images and DEM are introduced to acquire information on debris flows, which is helpful in the effective evaluation of the hazard degree of debris flows.
The choice of influencing factors is critical to the assessment results. In this study, the selected influencing factors include debris flow magnitude, frequency, basin area, main channel length, maximum elevation difference, ravine density, main channel sinuosity, active main channel proportion, maximum daily rainfall, and population density. The AHP method is applied to determine the weight set of the influencing factors. The weights of each factor are 0.239, 0.239, 0.167, 0.081, 0.056, 0.116, 0.015, 0.039, 0.028, and 0.02. FSE is adopted to calculate the hazard degrees of the 239 debris flow catchments in the reservoir region of the Wudongde hydropower station. The hazard assessment results reveal that 20 debris flow catchments have a slight hazard degree, 200 have a moderate hazard degree, 18 have a severe hazard degree, and only one has a high hazard degree. Overall, the hazard caused by debris flows in the reservoir region is low, and the construction and stability of the hydropower station are not significantly affected by the debris flows. The results of our new method are comparable with those of extension and grey correlation theories, except for those in the Zhuza, Nuozhacun, and Fapa gullies. After a detailed analysis of the original datasets, our method demonstrates its superiority and validity for the hazard assessment of debris flows. To complement debris flow hazard assessment, we will conduct further investigation that focuses on debris flow propagation, to be applied to the Jinsha river and adjacent catchments.

Acknowledgments

This work was supported by grants of the State Key Program of National Natural Science Foundation of China (Grant number: 41330636), 2010 non-profit scientific special research funds of Ministry of Water Resources (Grant number: 201001008), Natural Science Foundations of China (Grant numbers: 41402242, 41402243, 40872170 and 40902077) and Jilin University’s 985 project (Grant number: 450070021107).

Author Contributions

Cencen Niu contributed to data analysis and manuscript writing. Qing Wang and Jianping Chen proposed the main structure of this study. Wen Zhang provided useful advice and revised the manuscript. Liming Xu and Ke Wang collected and processed the data. All authors read and approved the final manuscript.

Conflicts of Interest

The authors declare no conflict of interest.

References

  1. Swanson, F.J.; Kratz, T.K.; Caine, N.; Woodmansee, R.G. Landform effects on ecosystem patterns and processes. BioScience 1988, 38, 92–98. [Google Scholar] [CrossRef]
  2. Swanson, F.J.; Johnson, S.L.; Gregory, S.V.; Acker, S.A. Flood disturbance in a forested mountain landscape. BioScience 1998, 48, 681–689. [Google Scholar] [CrossRef]
  3. Hürlimann, M.; Copons, R.; Altimir, J. Detailed debris flow hazard assessment in Andorra, A multidisciplinary approach. Geomorphology 2006, 78, 359–372. [Google Scholar] [CrossRef]
  4. Tang, C.; Vanasch, T.W.J.; Chang, M.; Chen, G.Q.; Zhao, X.H.; Huang, X.C. Catastrophic debris flows on 13 August 2010 in the Qingping area, southwestern China: The combined effects of a strong earthquake and subsequent rainstorms. Geomorphology 2012, 139–140, 559–576. [Google Scholar] [CrossRef]
  5. Cheng, Z.L.; Zhu, P.Y.; Liu, L.J. Study on the relationship between the debris flow and the rainfall factor. Nat. Hazards 1998, 7, 118–120. (In Chinese) [Google Scholar]
  6. Cui, P.; Liu, S.J.; Tan, W.P. Progress of debris flow forecast in China. J. Nat. Disasters 2000, 9, 10–15. [Google Scholar]
  7. Iverson, R.M. Physics of debris flows. Rev. Geophys. 1997, 35, 245–296. [Google Scholar] [CrossRef]
  8. Chiou, I.J.; Chen, C.H.; Liu, W.L.; Huang, S.M.; Chang, Y.M. Methodology of disaster risk assessment for debris flows in a river basin. Stoch. Environ. Res. Risk Assess. 2015, 29, 775–792. [Google Scholar] [CrossRef]
  9. Liang, W.J.; Zhuang, D.F.; Jiang, D.; Pan, J.J.; Ren, H.Y. Assessment of debris flow hazards using a Bayesian Network. Geomorphology 2012, 171, 94–100. [Google Scholar] [CrossRef]
  10. Liu, G.X.; Dai, E.F.; Ge, Q.S.; Wu, W.X.; Xu, X.C. A similarity-based quantitative model for assessing regional debris-flow hazard. Nat. Hazards 2013, 69, 295–310. [Google Scholar] [CrossRef]
  11. Eidsvig, U.M.K.; Papathoma-Köhle, M.; Du, J.; Glade, T.; Vangelsten, B.V. Quantification of uncertainty in debris flow vulnerability assessment. Eng. Geol. 2014, 181, 15–26. [Google Scholar] [CrossRef]
  12. Liu, X.L.; Tang, C. Debris-Flow Risk Evaluation; Science Press: Beijing, China, 1995. [Google Scholar]
  13. Waythomas, C.F. Formation and failure of volcanic debris dam in the Chakachatna River valley associated with eruptions of the spur volcanic complex, Alaska. Geomorphology 2001, 39, 111–129. [Google Scholar] [CrossRef]
  14. Petley, D. Global patterns of loss of life from landslides. Geology 2012, 40, 927–930. [Google Scholar] [CrossRef]
  15. Liu, X.; Yue, Z.Q.; Tham, L.G.; Lee, C.F. Empirical assessment of debris flow risk on a regional scale in Yunnan province, Southwestern China. Environ. Manag. 2002, 30, 249–264. [Google Scholar] [CrossRef] [PubMed]
  16. Jordan, P.; Covert, S.A. Debris Flows and Floods Following the 2003 Wildfires in Southern British Columbia. Eviron. Eng. Geosci. 2009, 15, 217–234. [Google Scholar] [CrossRef]
  17. Lin, P.S.; Lin, J.Y.; Hung, J.C.; Yang, M.D. Assessing debris-flow hazard in a watershed in Taiwan. Eng. Geol. 2002, 66, 295–313. [Google Scholar] [CrossRef]
  18. Liu, X.L.; Lei, J.Z. A method for assessing regional debris flow risk: An application in Zhaotong of Yunnan province (SW China). Geomorphology 2003, 52, 181–191. [Google Scholar] [CrossRef]
  19. Chang, T.C.; Chao, R.J. Application of back-propagation networks in debris flow prediction. Eng. Geol. 2006, 85, 270–280. [Google Scholar] [CrossRef]
  20. Chang, T.C. Risk degree of debris flow applying neural networks. Nat. Hazards 2007, 42, 209–224. [Google Scholar] [CrossRef]
  21. Procter, J.N.; Cronin, S.J.; Zernack, A.V.; Lube, G.; Stewart, R.B.; Nemeth, K.; Keys, H. Debris flow evolution and the activation of an explosive hydrothermal system; Te Maari, Tongariro, New Zealand. J. Volcanol. Geotherm. Res. 2014, 286, 303–316. [Google Scholar] [CrossRef]
  22. Di, B.F.; Chen, N.S.; Cui, P.; Li, Z.L.; He, Y.P.; Gao, Y.C. GIS-based risk analysis of debris flow: An application in Sichuan, southwest China. Int. J. Sediment. Res. 2008, 23, 138–148. [Google Scholar] [CrossRef]
  23. Saaty, T.L. Modeling unstructured decision problems-the theory of analytical hierarchies. Math. Comput. Simul. 1977, 20, 147–158. [Google Scholar] [CrossRef]
  24. Saaty, T.L. The Analytic Hierarchy Process: Planning, Priority Setting Resource Allocation; McGraw-Hill: New York, NY, USA, 1980. [Google Scholar]
  25. Mi, C.Q.; Zhang, X.D.; Li, S.M.; Yang, J.Y.; Zhu, D.H.; Yang, Y. Assessment of environment lodging stress for maize using fuzzy synthetic evaluation. Math. Comput. Model. 2011, 54, 1053–1060. [Google Scholar] [CrossRef]
  26. Wang, J.H.; Lu, X.G.; Jiang, M. Fuzzy Synthetic Evaluation of Wetland Soil Quality Degradation: A Case Study on the Sanjiang Plain Northeast China. Pedosphere 2009, 19, 756–764. [Google Scholar] [CrossRef]
  27. Duan, Z.F.; Pang, Z.H.; Wang, X.Y. Sustainability evaluation of limestone geothermal reservoirs with extended production histories in Beijing and Tianjin, China. Geothermics 2011, 40, 125–135. [Google Scholar] [CrossRef]
  28. Lu, X.W.; Loretta, Y.L.; Lei, K.; Wang, L.J.; Zhai, Y.X.; Zhai, M. Water quality assessment of Wei River, China using fuzzy synthetic evaluation. Environ. Earth Sci. 2010, 60, 1693–1699. [Google Scholar] [CrossRef]
  29. Kuang, Y.H.; Xu, L.R.; Liu, B.C.; Yao, J.C. A new method for choosing zonation indicators of mudflow danger degrees based on the rough set theory. J. Geomech. 2006, 12, 236–241. [Google Scholar]
  30. Liu, T.; Zhang, H.J.; Wu, J.D.; Hou, X.F.; Zheng, G.Q.; Ye, Z.H. Application of analytic hierarchy process in debris flow risk degree assessment—A case study of Miyun County, Beijing City. Bull. Soil Water Conserv. 2008, 28, 6–10. [Google Scholar]
  31. Li, C.K.; Goldstein, R.M. Studies of multibaseline spaceborne interferometric synthetic aperture radars. IEEE Trans. Geosci. Remote Sens. 1990, 28, 88–97. [Google Scholar] [CrossRef]
  32. Antrop, M.; Eetvelde, V.V. Changing patterns in the urbanized countryside of Western Europe. Landsc. Ecol. 2004, 15, 257–270. [Google Scholar] [CrossRef]
  33. Thomlinsson, J.R.; Rivera, L.Y. Suburban growth in Luquillo, Puerto Rico: Some consequences of development on natural and semi-natural systems. Landsc. Urban. Plan. 2006, 49, 19–23. [Google Scholar] [CrossRef]
  34. Wan, S.; Lei, T.C.; Huang, P.C.; Chou, T.Y. The knowledge rules of debris flow event: A case study for investigation Chen Yu Lan River, Taiwan. Eng. Geol. 2008, 98, 102–114. [Google Scholar] [CrossRef]
  35. Wan, S.; Lei, T.C. A knowledge-based decision support system to analyze the debris-flow problems at Chen-Yu-Lan River, Taiwan. Knowl. Based Syst. 2009, 22, 580–588. [Google Scholar] [CrossRef]
  36. Chen, J.; Chen, Y.H.; He, C.Y.; Shi, P.J. Sub-pixel model for vegetation fraction estimation based on land cover classification. J. Remote Sens. 2001, 5, 416–422. [Google Scholar]
  37. Dan, S.M.; Xu, H.X.; Dan, B.; He, F.; Shi, C.C.; Ren, G.Y. Monitoring and evaluation of grassland desertification in litang county using multi-temporal remote sensing images. In Proceedings of the 14th Youth Conference on Communication, Dalian, China, 24–26 July 2009; pp. 209–213.
  38. Hungr, O.; Morgan, G.C.; Kellerhals, R. Quantitative analysis of debris torrent hazards for design of remedial measures. Canad. Geotech. J. 1984, 21, 663–677. [Google Scholar] [CrossRef]
  39. Ning, N.; Shu, H.P.; Liu, D.F.; Ma, J.Z. Hazard assessment of debris flow based on the entropy weight method and fuzzy evaluation method. J. Lanzhou Univ. Nat. Sci. 2014, 3, 369–375. [Google Scholar]
  40. Luo, Z.; Yang, S. Comparative study on several scales in AHP. Syst. Eng. Theor. Pract. 2004, 9, 51–60. [Google Scholar]
  41. Crawford, G.; Williams, C. A note on the analysis of subjective judgment matrices. J. Math. Psychol. 1985, 29, 387–405. [Google Scholar] [CrossRef]
  42. Sudhir, D.; Bupinder, S.; Shalini, G. Analysis of groundwater quality using fuzzy synthetic evaluation. J. Hazard. Mater. 2007, 147, 938–946. [Google Scholar] [CrossRef] [PubMed]
  43. Guleda, O.E.; Ibrahim, D.; Halil, H. Assessment of urban air quality in Istanbul using fuzzy synthetic evaluation. Atmos. Environ. 2004, 38, 3809–3815. [Google Scholar] [CrossRef]
  44. Chang, N.B.; Chen, H.W.; Ning, S.K. Identification of river water quality using the Fuzzy synthetic evaluation approach. J. Environ. Manag. 2001, 63, 293–305. [Google Scholar] [CrossRef] [PubMed]
  45. Zhang, W.; Chen, J.P.; Wang, Q. Susceptibility analysis of large-scale debris flows based on combination weighting and extension methods. Nat. Hazards 2013, 66, 1073–1100. [Google Scholar] [CrossRef]
  46. Niu, C.C.; Wang, Q.; Chen, J.P.; Wang, K.; Zhang, W.; Zhou, F.J. Debris-flow hazard assessment based on stepwise discriminant analysis and extension theory. Q. J. Eng. Geol. Hydrogeol. 2014, 47, 211–222. [Google Scholar] [CrossRef]
  47. Zhang, W.; Li, H.Z.; Chen, J.P.; Zhang, C.; Xu, L.M.; Sang, W.F. Comprehensive hazard assessment and protection of debris flows along Jinsha River close to the Wudongde dam site in China. Nat. Hazards 2011, 58, 459–477. [Google Scholar] [CrossRef]
  48. Zhao, B.; Xu, W.Y.; Liang, G.L.; Meng, Y.D. Stability evaluation model for high rock slope based on element extension theory. Bull. Eng. Geol. Environ. 2015, 74, 301–314. [Google Scholar] [CrossRef]
  49. Kuang, H.B.; Kilgour, D.M.; Hipel, K.W. Grey-based PROMETHEE II with application to evaluation of source water protection strategies. Inf. Sci. 2015, 294, 376–389. [Google Scholar] [CrossRef]

