Article

Stabilization of Organic Matter by Biochar Application in Compost-amended Soils with Contrasting pH Values and Textures

1
Department of Soil and Water Conservation, National Pingtung University of Science and Technology, Pingtung 91201, Taiwan
2
Department of Agricultural Chemistry, National Taiwan University, Taipei 10617, Taiwan
3
Department of Geography, National Taiwan Normal University, Taipei 10610, Taiwan
*
Author to whom correspondence should be addressed.
Sustainability 2015, 7(10), 13317-13333; https://doi.org/10.3390/su71013317
Submission received: 17 August 2015 / Revised: 18 September 2015 / Accepted: 24 September 2015 / Published: 29 September 2015
(This article belongs to the Section Sustainable Agriculture)

Abstract

:
Food demand and soil sustainability have become urgent concerns because of the impacts of global climate change. In subtropical and tropical regions, practical management that stabilizes and prevents organic fertilizers from rapid decomposition in soils is necessary. This study conducted a short-term (70 days) incubation experiment to assess the effects of biochar application on the decomposition of added bagasse compost in three rural soils with different pH values and textures. Two rice hull biochars, produced through slow pyrolization at 400 °C (RHB-400) and 700 °C (RHB-700), with application rates of 1%, 2%, and 4% (w/w), were separately incorporated into soils with and without compost (1% (w/w) application rate). Experimental results indicated that C mineralization rapidly increased at the beginning in all treatments, particularly in those involving 2% and 4% biochar. The biochar addition increased C mineralization by 7.9%–48% in the compost-amended soils after 70 days incubation while the fractions of mineralized C to applied C significantly decreased. Moreover, the estimated maximum of C mineralization amount in soils treated with both compost and biochar were obviously lower than expectation calculated by a double exponential model (two pool model). Based on the micromorphological observation, added compost was wrapped in the soil aggregates formed after biochar application and then may be protected from decomposing by microbes. Co-application of compost with biochar may be more efficient to stabilize and sequester C than individual application into the studied soils, especially for the biochar produced at high pyrolization temperature.

1. Introduction

Climate change and food demand are currently the two most crucial concerns for agricultural scientists throughout the world. How to maintain the soil organic matter (SOM) levels in soils is a key consideration in agricultural productivity and carbon sequestration, particularly in agricultural lands in subtropical and tropical regions. Mekuria et al. (2014) [1] mentioned that mulches, compost, or manure can be effective in enhancing soil organic carbon pool and agricultural productivity in the tropic regions, but these amendments were often short-lived. The added organic matters were usually mineralized to CO2 rapidly leading to large-scale leakage in subtropical/tropical regions. Therefore, developing strategies for reducing the mineralization of added OM and increasing carbon sequestration in subtropical/tropical rural soils is necessary to facilitate land sustainability [2,3].
Biochar is the by-product of the pyrolysis of organic wastes and is regarded as a chemically- and biologically-stable C pool [4]. Applying biochar to agricultural soils is considered to improve soil quality effectively [5,6,7,8] while sequestering carbon and reducing greenhouse gas emission from soils [7,8]. Recently, co-application of biochars and other organic amendments has been determined to be an effective management practice for compensating for the limitations of applying biochar or an organic amendment alone [9,10,11,12]. Nevertheless, most of those studies were conducted at arid, Mediterranean, and temperate regions, and the biochars were incorporated into the soils for stimulating microbial activities to facilitate decomposition of added organic matters. Awad et al. (2013) [11] considered that rapid decomposition of plant residue was desired in double-cropping systems in temperate climates in order to maintain a proper supply of nutrients for crop growth and substrates for soil microorganisms. Several inconsistent results including facilitation and inhibition of SOM decomposition in soils co-amended with biochar and other organic amendments have been reported [2,12,13,14], which resulted from the original characteristics of biomass, differences in biochar properties (pyrolization processes and temperatures), and soil environments, such as soil pH value, native SOC contents, and soil texture. Van Veen and Kuikman (1990) [15] and Qayyum et al. (2012) [10] indicated that fine soil texture can physically protect SOM from decomposition caused by microbes through the adsorption of organic matter onto clay surfaces.
Regarding C mineralization in biochar-amended soils, Hamer et al. (2004) [16] and Kuzyakov et al. (2009) [14] reported that co-metabolism occurs in soils incorporated with a biochar and a fresh C source, thus facilitating cumulative CO2 emission from the amended soils. Zimmerman et al. (2011) [17] observed both positive (< 90 days) and negative priming (>250 days) effects of incubating grass and wood biochars in sandy soils. This negative effect could be due to the adsorption of native SOM onto the surfaces and pore spaces of biochars, thus protecting the SOM from decomposition. Furthermore, Keith et al. (2011) [18] indicated that adding biochar can lead to a positive priming effect on native SOM but not on added organic matter (OM); however, the added OM can cause a positive priming effect on the biochar.
Many of the aforementioned studies clearly demonstrated the enhancing effects of biochar application on the physiochemical properties of soil. However, to further clarify the interaction between biochar and added organic fertilizers, we aimed to (1) determine the effects of rice husk biochar application on the C mineralization of compost-amended soils with various soil pH values and textures, and (2) examine the micro-structure by using a polarized microscope to determine the possible processes of interaction among the biochar, added organic fertilizer, and clay particles.

2. Materials and Methods

2.1. Soil Collection and Biochar Preparation

Surface soil samples (0–15 cm) were collected from three agricultural slopelands in Taiwan. Laopi (Lo) soil is generated from quaternary-aged materials and is widely distributed in the terrace landscapes of Southern Taiwan. Shanhuipu (Sp) and Choutseunlun (Ct) soils are slate alluvial sediments along streams in Southern Taiwan. These three soils were selected because of their wide range of physical and chemical properties (Table 1). The soil samples were air-dried, sieved through a 2-mm screen, and stored in covered plastic containers at 25 °C.
Rice hull was used as a feedstock to separately produce two types of biochar through slow pyrolysis in a furnace equipped with an N2-purged retort referred to Streubel et al. (2011) [19] at 400 °C (RHB-400) and700 °C (RHB-700), respectively. The furnace was initially heated to 100 °C, and the temperature was then increased to 400 °C and 700 °C, respectively at a rate of 5 °C min−1 with a resident time of 30 min. The biochars were subsequently cooled overnight while the N2 flush was maintained. The biochars were then gently crushed and ground to pass a 2-mm sieve before use and analysis.

2.2. Analytical Methods

The pH values of the soil samples and biochars were mixed with deionized water and determined using a glass electrode (1:1 w/v for soil; 1:10 w/v for biochar) [20]. The electrical conductivity (EC) of the saturated paste extracts of soils was measured using a conductivity meter [21]. The soil particle-size distribution was determined using a pipette method [22]. The cation exchange capacity (CEC) was determined using an ammonium acetate method (pH 7.0) [23]. The organic C content of the tested soils was determined using a wet oxidation method [24]. The total N was measured using the semi-micro-Kjeldahl procedure [25]. The inorganic N was extracted using 2 M KCl (1:10 w/v); concentrations of NH4+-N and NO3-N were estimated using steam distillation involving MgO and the Devarda alloy [26]. The calcium carbonate contents were determined by simple titrimetric method [27], which finely-ground soil and biochar samples (2.0 g) were reacted with 2 M HCl for 16 h. The emitted CO2 in the reacted bottle was captured by NaOH, and then the base solution was titrated with 0.1 M HCl to calculate carbonate contents. All chemical analyses were conducted intriplicate. Table 1 and Table 2 present summaries of the relevant properties of the soils and biochars.
The readily-oxidizable carbon (ROC) was determined using a method proposed by Blair et al. (1995) [28]. Air-dried soil samples containing 15 mg of C were weighed into centrifuge tubes and reacted with333 mM KMnO4 for 1 h at 25 °C. After centrifugation, the supernatants were diluted at a ratio of 1:250 with deionized water. The absorbance of the diluted samples and standards was recorded using a split-beam spectrophotometer at 565 nm. The change in the KMnO4 concentration was used to estimate the amount of C oxidized, assuming that 1 mM KMnO4wasconsumedin the oxidation of 0.75 mM or 9 mg of C. The KMnO4-C fraction, suggested by Blair et al. (1995) [28], encompasses all the organic components that can be readily oxidized by KMnO4, including labile humic material and polysaccharides [29], and accounts for 5%–30% of total organic carbon.

2.3. Incubation Experiment

A 70-days incubation experiment was conducted to investigate the effects of applying biochars and compost on CO2 emission in three agricultural slopeland soils. Twenty grams of each air-dried soil sample was placed in small plastic cups. A commercial bagasse compost was added as a substrate to the soils for each treatment at a rate of 20 t ha−1. The biochars were then thoroughly mixed with the soilsat 0%, 2%, and 4% (w/w) (approximately 0, 40, and 80 t ha−1, respectively). The experimental design consisted of 10 treatments for each soil in triplicate: (1) O (control; soil only), (2) O + C (soil with 1% compost), (3) O + C + 2% RHB-400, (4) O + C + 4% RHB-400, (5) O + C + 2% RHB-700, (6) O + C + 4% RHB-700, (7) O + 2% RHB-400, (8) O + 4% RHB-400, (9) O + 2% RHB-700, and (10) O + 4% RHB-700. Deionized water was added to the soils to reach 60% water-holding capacity. Each cup with the treated soil and a plastic vessel containing 10 mL of 1 N NaOH solution was placed in a wide-mouth plastic jar, which was subsequently sealed. Jars without treated soils were used as blanks. After 3, 7, 14, 21, 28, 42, and 70 days, the emitted CO2 was measured in nondestructive determination by titrating the NaOH solution with 0.5 N HCl following addition of BaCl2. The jars were then sealed again for incubation until the next measurement. The incubation experiment was performed in the dark at 25 ± 2 °C [30]. The 70 days of incubation duration was conducted based on Novak et al. (2010) [31] and Streubel et al. (2011) [19] who denoted that the CO2 evolution rate may approach to a minimum value after 67–75 days.

2.4. Calculations and Statistical Analysis

The percentage of applied C mineralized (ACM) in the treatments involving compost and/or biochar was calculated according to Ribeiro et al. (2010) [32]:
ACM ,  % = CMC t r e a t m e n t ( 70   d a y ) CMC c o n t r o l ( 70   d a y ) o r g a n i c   C   a p p l i e d   × 100
where CMC is the cumulative C mineralized in the form of CO2-C emitted during incubation.
The measured carbon emission results under the treatment of co-application of the biochar and the compost (O + C + RHB) indicate the final results of an overall interaction between the organic amendments. Expected results were calculated from the values of related treatments as follows: (O + C) + (O + RHB) – (O). The expected values indicate no interactions between the compost and biochars. Although the priming effects between compost and biochars were difficult to be determined, the difference between the expected and measured values could be explained as the interaction effect. We used the double exponential model to fit the expected and measured carbon emission of the incubation experiment. The two-pool model involved a labile fraction and a resistant fraction, which can well describe the decomposition of soil N and C [31]:
C min =  C l × (   1 exp ( k l × t ) ) +  C r × (   1 exp ( k r × t ) )
where Cmin is the mineralized C amount at time t (day), Cl and Cr mean the amounts of potentially mineralizeable C (mg C/g C applied) of the labile and resistant fractions, respectively, and kl and kr are the respective mineralization rate constants (day−1). The model fitting was carried out using the statistical program of Sigmaplot 8. The maximum values of the unstable C pool were calculated by Cl plus Cr which were derived from the model fitting.

2.5. Soil Micromorphology

Kubiena boxes were used to collect undisturbed soil blocks from the experimental pots (Stoops, 2003) [33]. The same solid mixture of each treatment was placed into a pot with a size larger than the Kubiena box followed by the same incubation process as described. After the 70-days incubation, the soil blocks were taken using Kubiena boxes. Thin sections of 30-µm thickness were then prepared following air drying using a microtome by Spectrum Petrographics Inc. (Washington, USA). The thin sections were then used for observing distribution and structure of organic matters among soil particles under a polarized microscope (Leica DM EP, TX, USA).

2.6. Statistical Methods

The effects of soil type, biochar type, and application rate of the biochar on the total CO2-C evolution and their interactions were tested using a multivariate analysis of variance (MANOVA). Significant effects were identified when p < 0.05. Multiple mean comparisons were performed using Fisher’s protected least significant difference (LSD) procedures at p < 0.05. All the statistical analyses were performed with IBM SPSS Statistics, Version 22 (Somers, NY, USA).

3. Results

3.1. Characteristics of Soils, Compost, and Biochars

Table 1 shows the characteristics of the studied soils. Lo soil is acidic and enriched with silt. Sp soil exhibits a texture similar to that of Lo soil but is pH neutral. The soil textures are silty clay loam and silt loam for Lo and Sp soils, respectively, based on Soil Taxonomy (Soil Survey Staff, 2010) [34]. By contrast, Ct soil exhibits high pH and EC levels, and it has a considerably higher proportion of sand than the other two soils. The Ct soil was classified as a sandy soil [34]. Low total C content was determined in all studied soils; it was below 0.2% in the Ct soil. The CECs of the Lo and Sp soils were approximately 15 cmol (+) kg−1, which was considerably higher than that of the Ct soil. The CECs were consistent with the contents of clay and organic carbon in these soils. Regarding the total nitrogen content (TN) and inorganic nitrogen content (IN; NH4+-N + NO3-N), the Ct soil exhibited a lower TN and IN than the other two soils did. Table 2 lists the properties of the bagasse compost and biochars produced at various temperatures. The pH value of the compost was 5.5, and the pH values of the two biochars were approximately 8.0. The total carbon (TC) of the compost and biochars was in the range of 30%–33%, and the compost contented more TN than the biochars did. The TN content in RHB-400 and RHB-700 were <0.5%. The C/N ratios of the two biochars were >70, which was considerably higher than that of the compost. The exchangeable K content of the compost and biochars were considerably higher than other exchangeable cations. In addition, the compost exhibited more exchangeable Ca and Mg than the biochars did.
Table 2 also reveals that the ROC contents were 3.2 g kg−1 and 2.1 g kg−1 in the RHB-400 and RHB-700, respectively. The biochars could contribute 64 mg and 42 mg ROC kg−1 soil at the application rate of 2% and 128 mg and 84 mg kg−1 ROC at the rate of 4%, respectively.
Table 1. Selected properties of the studied soils.
PropertiesSoils
Laopi (Lo)Shashuipu (Sp)Choutseulun (Ct)
pH4.436.908.25
EC + (dS m−1)0.080.191.96
Sand (%)141795
Silt (%)57664.0
Clay (%)29171.0
Texture #SiCLSiLS
OC (%)1.781.380.12
CaCO3 (g kg−1)0.120.275.08
CEC (cmol(+) kg−1) 15.014.64.00
TN § (%)0.160.190.01
NH4+-N (mg kg−1)2.8411.2ND e
NO3--N (mg kg−1)14.247.88.33
ROC (g kg−1) ǂ0.420.75ND
+: Electric conductivity; #: SiCL: silty clay loam; SiL: silt loam; S: sand; : Cation exchange capacity: CEC (cmol(+) kg–1); §:Total nitrogen content; ǂ: Readily oxidizable carbon; e: data not detected.
Table 2. Characteristics of the bagasse compost and the rice hull biochars in this study.
CompostRHB-400RHB-700
pH (1:10 w/v)5.507.998.03
TC (%)30.231.032.9
TN (%)1.080.410.35
C/N ratio287694
CEC (cmol(+) kg−1)82.526.135.6
Exchangeable K (g kg1)6.947.017.02
Exchangeable Na (g kg1)0.440.280.24
Exchangeable Ca (g kg−1)4.610.470.54
Exchangeable Mg (g kg−1)2.120.220.23
Carbonate (g kg−1)ND1.521.88
ROC (g kg−1)36.03.222.10
RHB-400 and RHB-700 are the rice hull biochars produced at 400 °C and 700 °C, respectively. Explanation of the abbreviations are the same of those in Table 1.

3.2. Carbon Dioxide Emissions from Soils
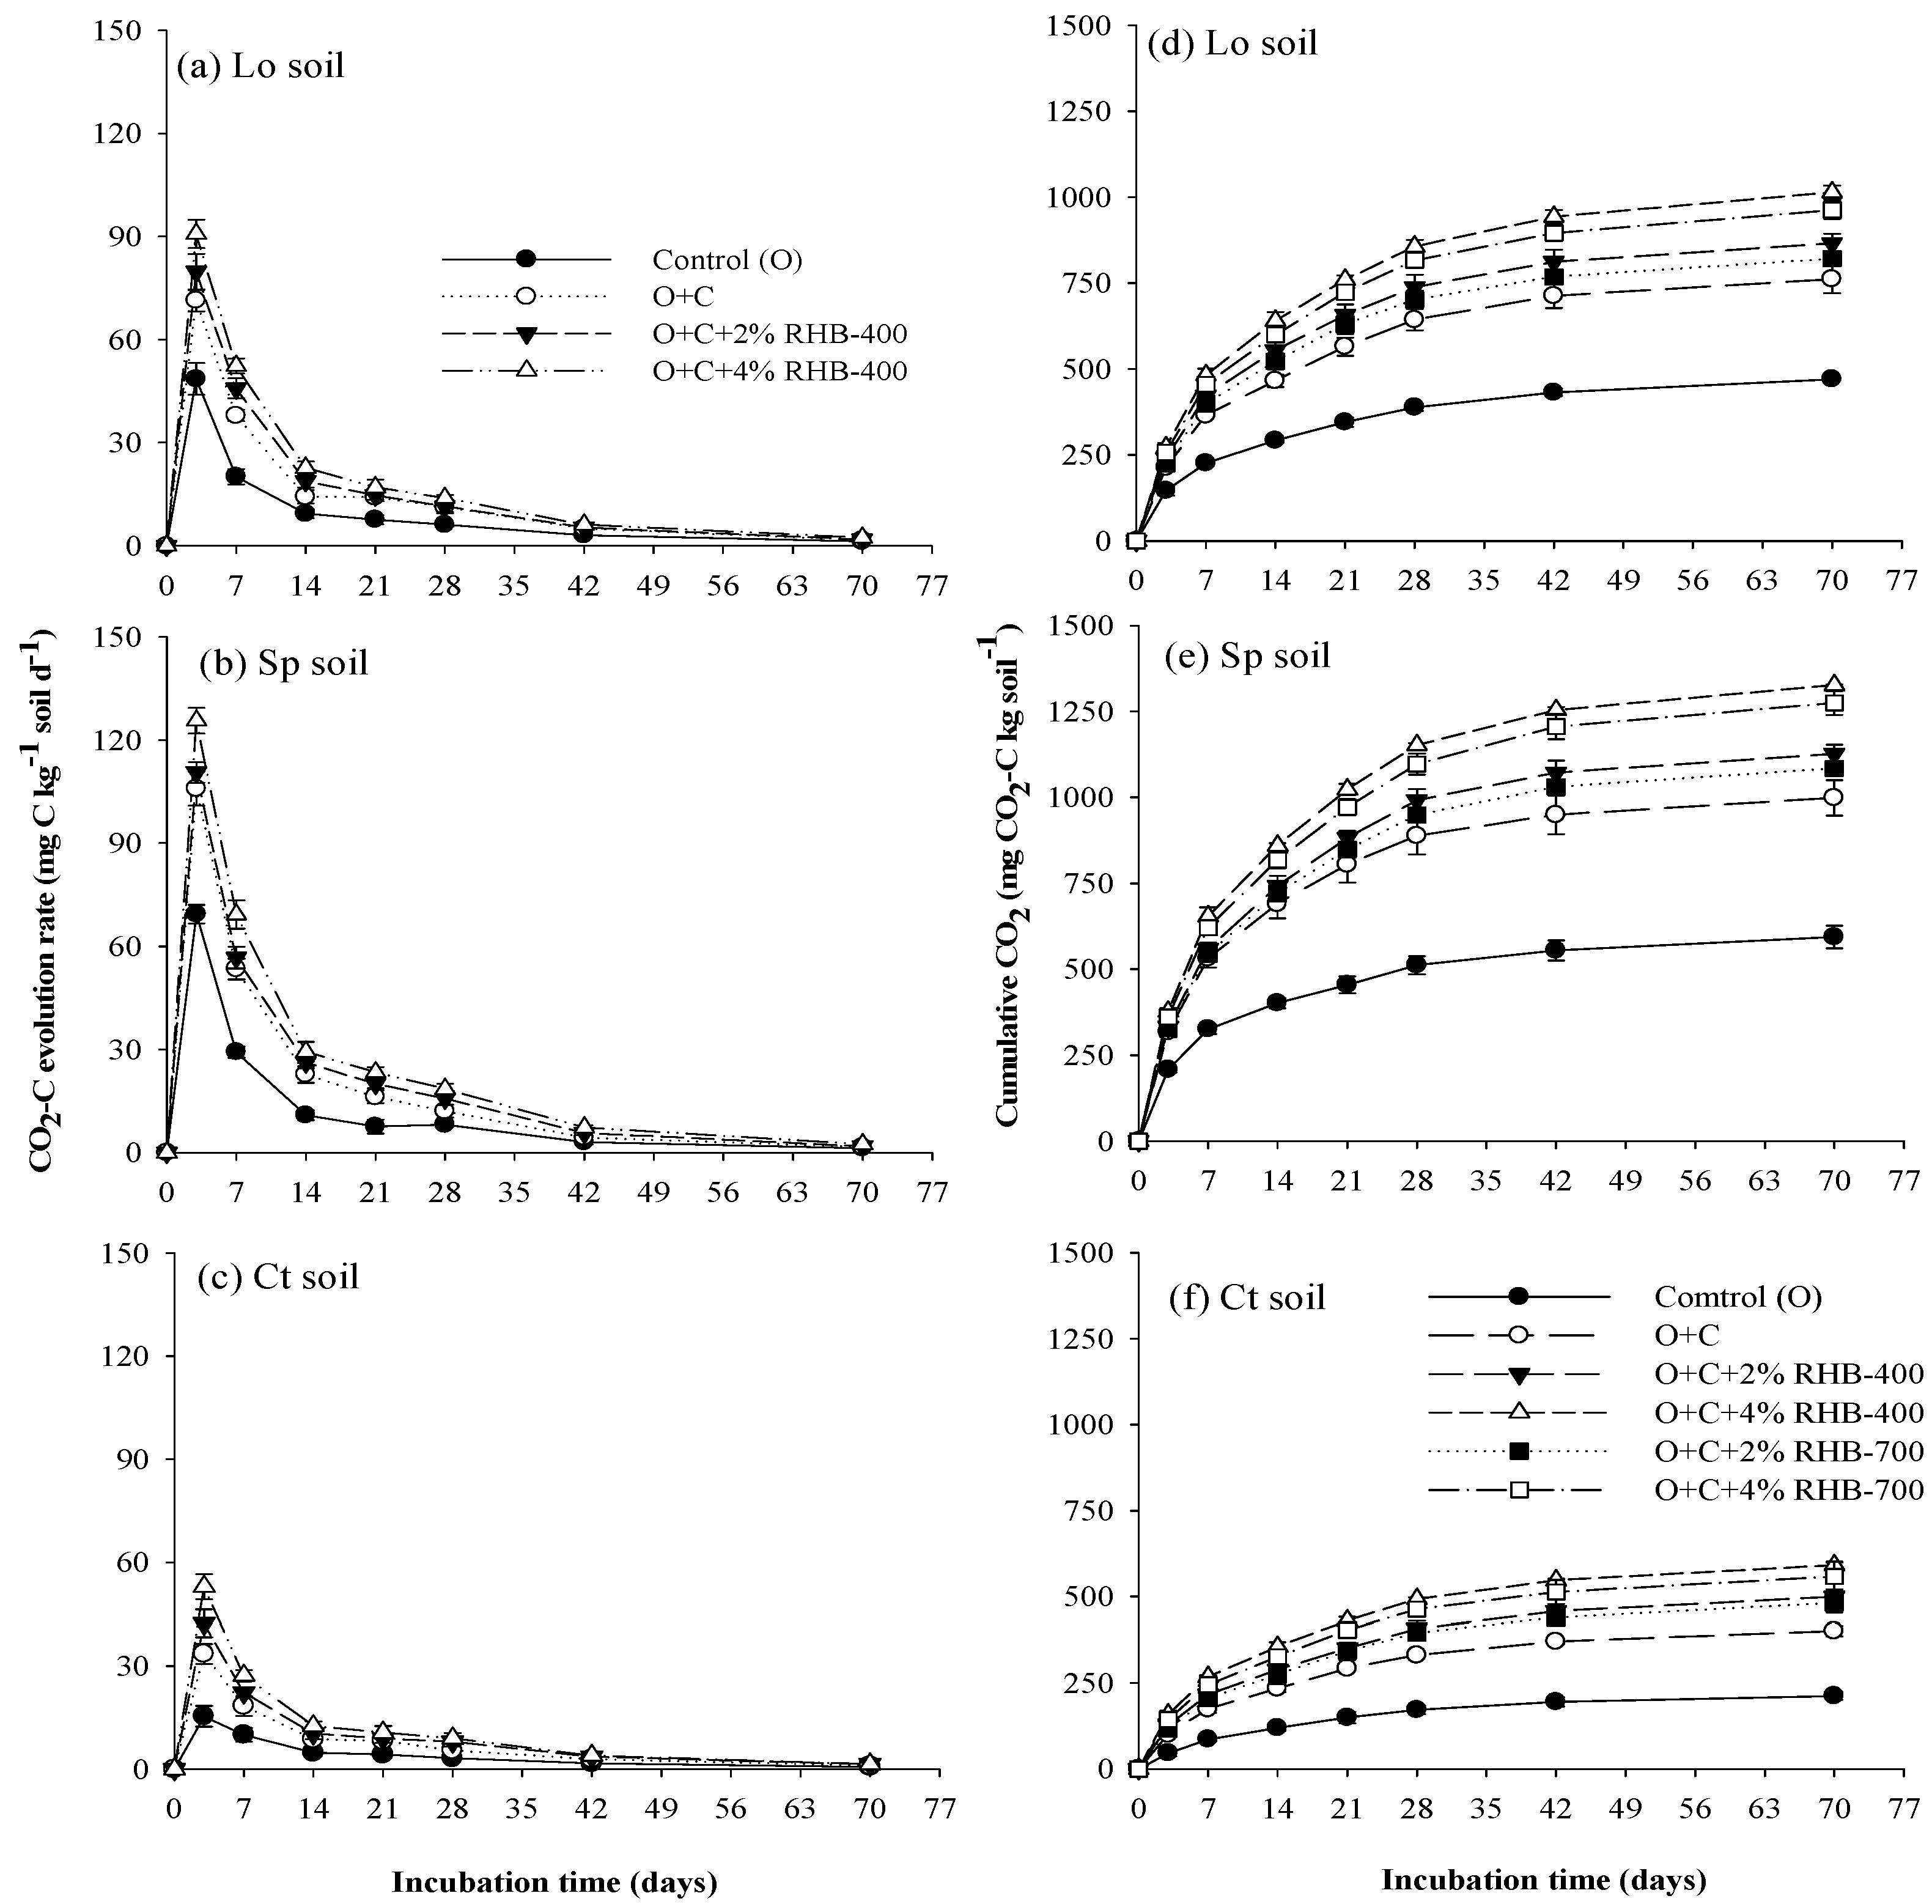
The CO2 evolution rates and cumulative CO2 emission of the treated soils during 70 days of incubation are shown in Figure 1. The CO2 evolution rate was slightly lower in RHB-700 than in RHB-400 and exhibited a similar trend between the two biochars for a given treatment. As a representative, the results of RHB-400 treatments were shown in Figure 1.The CO2 evolution rates were obviously higher in the first two weeks for all tested soils than in the following period. The control (O) maintained a low CO2 evolution rate and consequent cumulative CO2 emission throughout the incubation period compared with the other treatments (Figure 1), which exhibited final accumulative CO2 emission of 470, 594, and 213 mg CO2-C kg soil−1 for the Lo, Sp, and Ct soils, respectively. Compared with control (O), application of the compost (O + C) considerably increased the cumulative emission of CO2 in all studied soils, while co-application of biochars with the compost resulted in even higher values. Maximum amounts of CO2 emission was observed in the treatment involving co-application of compost and 4% biochar, particularly for the RHB-400and for the Sp soil. The amounts of the cumulative CO2 emission of each treatment followed the order of Sp soil > Lo soil > Ct soil (p < 0.05) (Table 3).
Figure 1. CO2 evolution rate ((a), (b), and (c)) and cumulative CO2 evolution ((d), (e), and (f)) for the Lo, Sp, and Ct soils amended with compost and biochars. The vertical error bars indicate the standard deviation. O (control): without compost and biochars; O + C: only compost (1%).
Sustainability 07 13317 g001
Table 3. Characteristics of the bagasse compost and the rice hull biochars in this study.
ControlO + CO + C + 2% RHB-400O + C + 4% RHB-400O + C + 2% RHB-700O + C + 4% RHB-700
Lo470 ± 4.00 a761 ± 40.6 a865 ± 27.5 a1014 ± 20.2 a821 ± 19.9 a963 ± 25.7 a
Sp594 ± 33.1 b999 ± 51.7 b1127 ± 26.4 b1327 ± 2.12 b1085 ± 11.8 b1274 ± 34.9 b
Ct212 ± 11.3 c400 ± 15.0 c499 ± 21.2 c591 ± 8.09 c482 ± 27.9 c558 ± 43.9 c
Different letters along the column (different soil types) mean significant difference (p < 0.05) between each soil.
The three soils revealed the similar trends of differences in the ACM (%) among treatments (Figure 2). Application of the compost (O + C treatment) exhibited the highest ACM (%), namely 10.2%, 14.2%, and 6.6% for the Lo, Sp, and Ct soils, respectively, while the values were clearly lower in the treatments of co-application of the compost and biochars. Compared with the O+C treatment, the ACM (%) for the soils amended with compost and biochars significantly decreased by 66%–76%, 65%–76%, and 61%–72% for the Lo, Sp, and Ct soils, respectively. However, for a given biochar application rate, the pyrolization temperature of the biochar did not result in significant differences in the proportion of the ACM. For all treatments, the ACM was apparently higher in the Sp soil than in the other soils, and the Ct soil exhibited the lowest ACM. According to the MANOVA results (Table 4), the soil type and application rate significantly affected the cumulative CO2 emission (p < 0.001), while biochar type had no significant effect. Moreover, a significant interaction between the soil type and the application rate was found (p < 0.001).
Table 4. Multivariate Analysis of Variance (MANOVA) of the total amounts of CO2-C evolved after 70 day incubation for each treatment.
Parametermg C kg-1 soil
Freedom degreeF-valueSignificance
Soil type (S)22626.6< 0.001
Biochar type (B)10.260.6094
Application rate (R)2243.2< 0.001
S × R49.02< 0.001
S × B20.750.4802
B × R20.200.8166
S × B × R40.040.9960
Figure 2. Percentage of the applied carbon mineralized (ACM %) of the Lo (a), Sp (b), and Ct (c) soils amended with compost (1%) and biochars at the end of the incubation. The vertical error bars indicate the standard deviation.
Sustainability 07 13317 g002

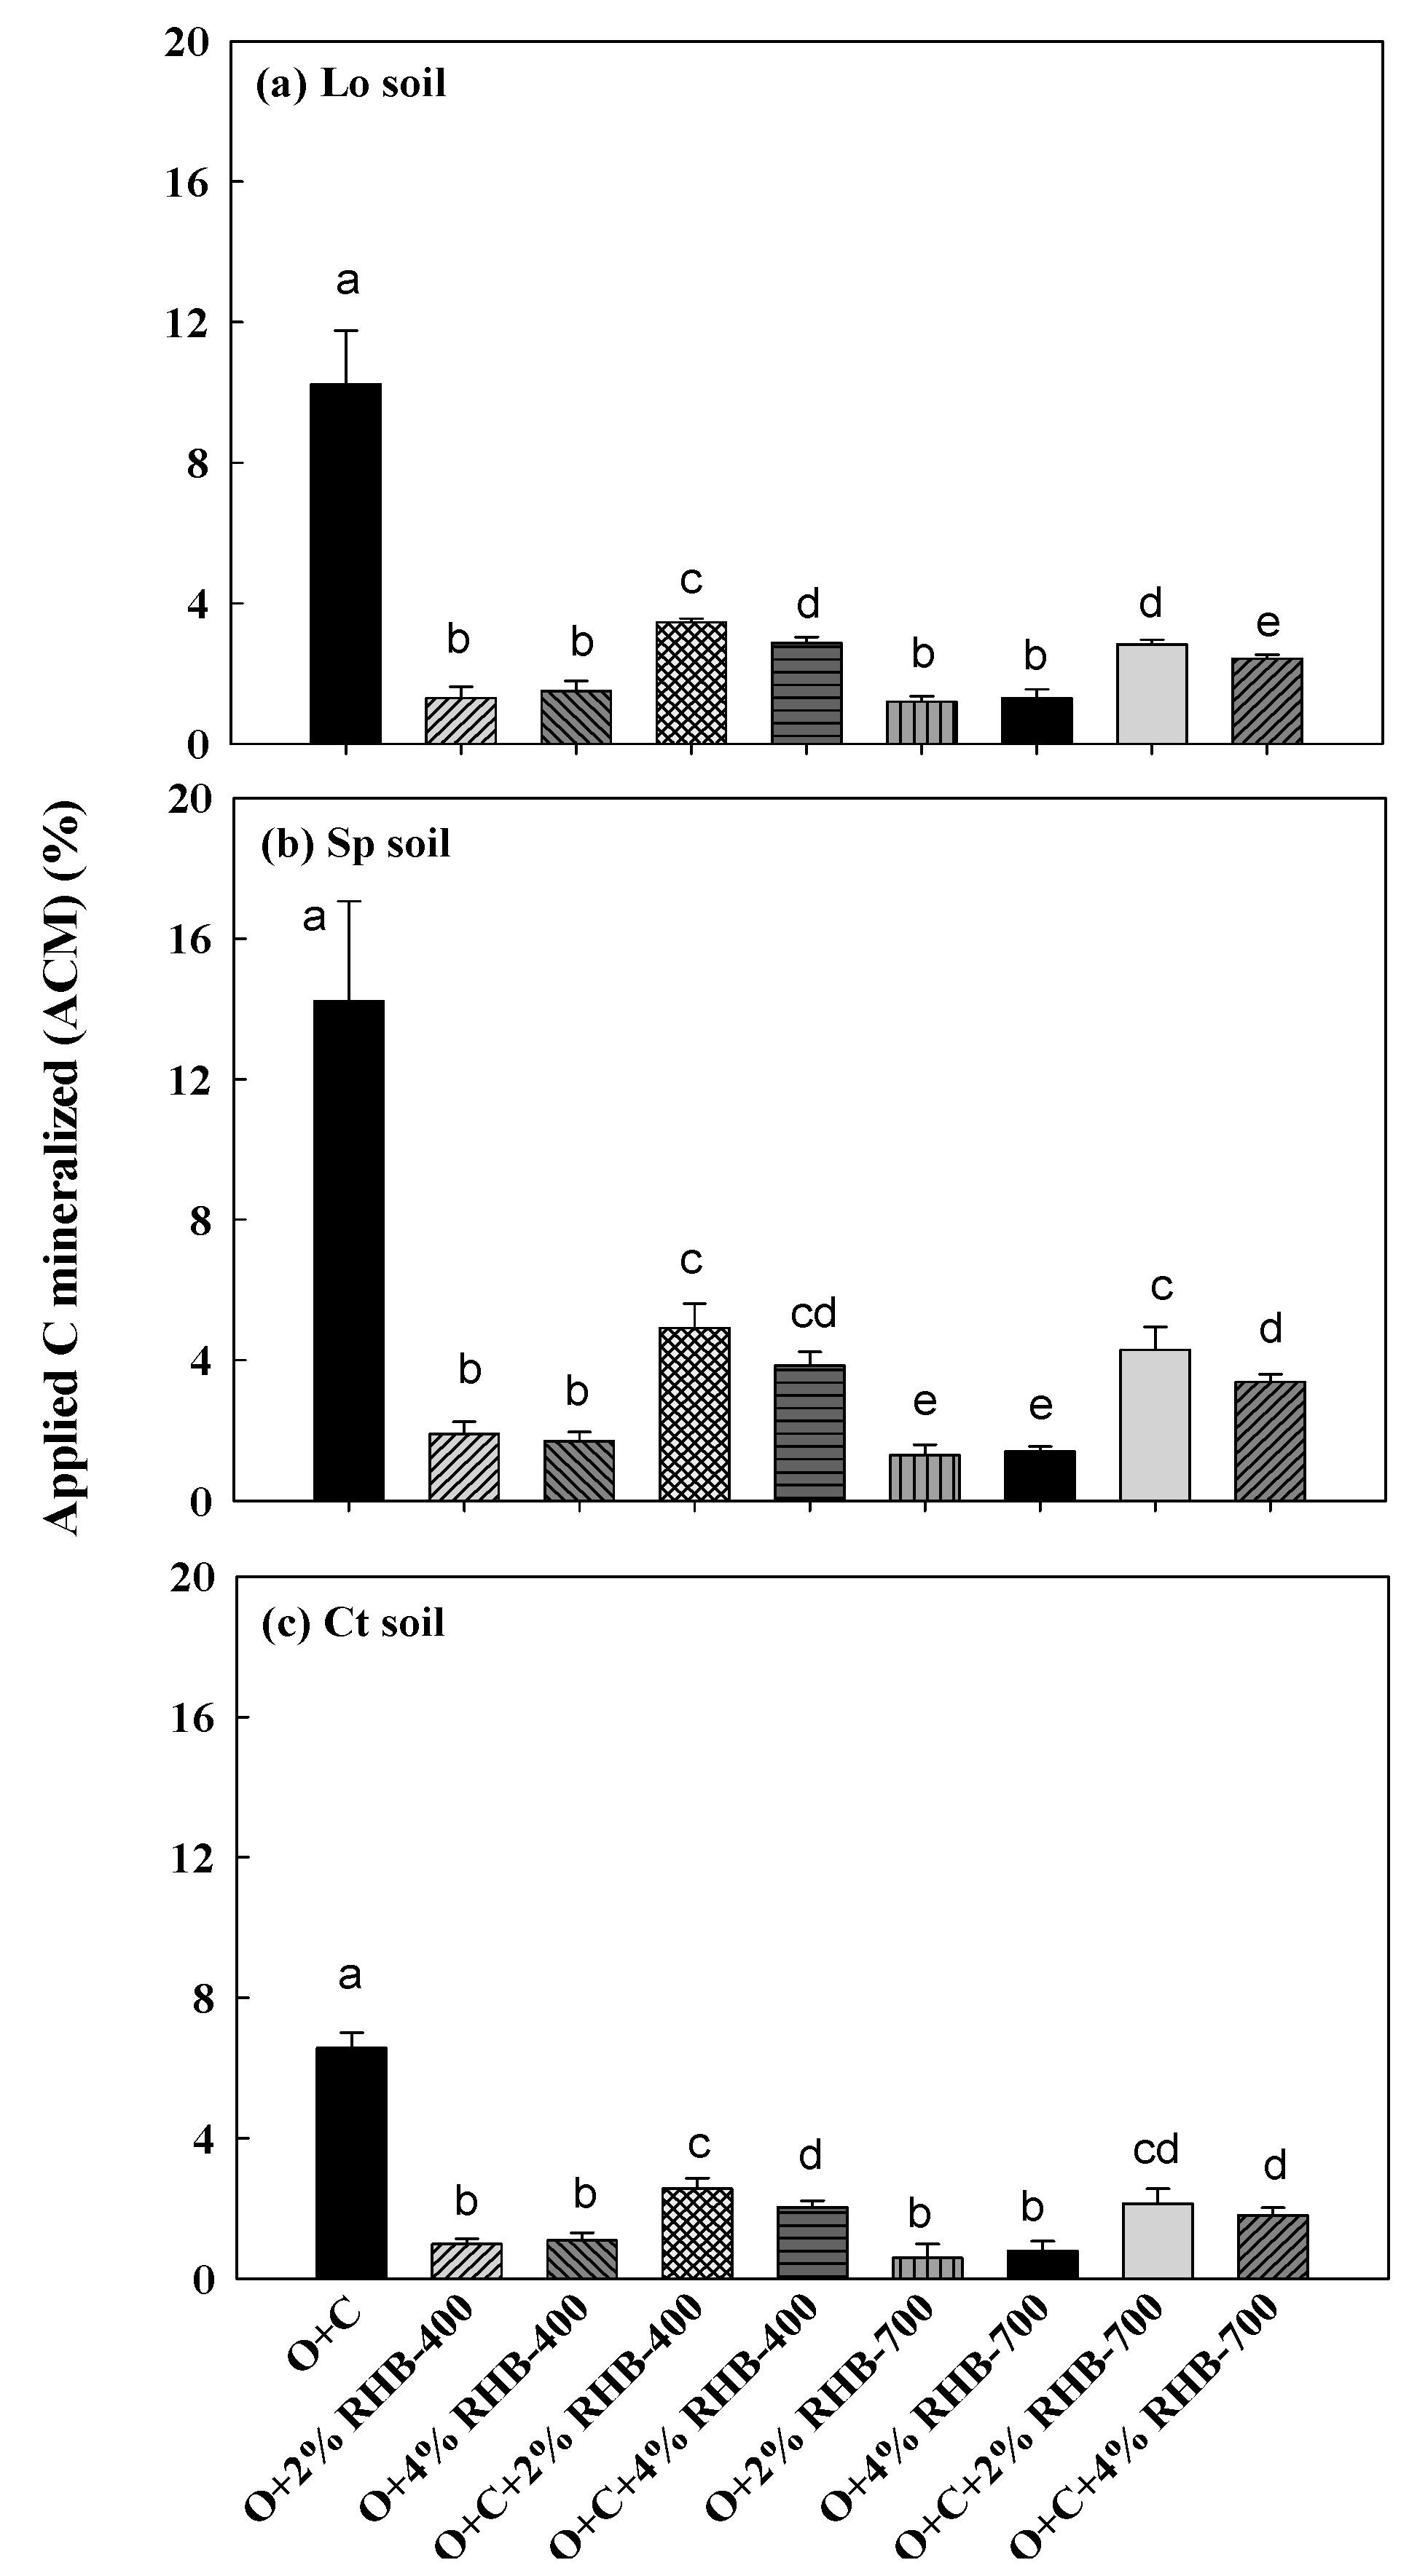
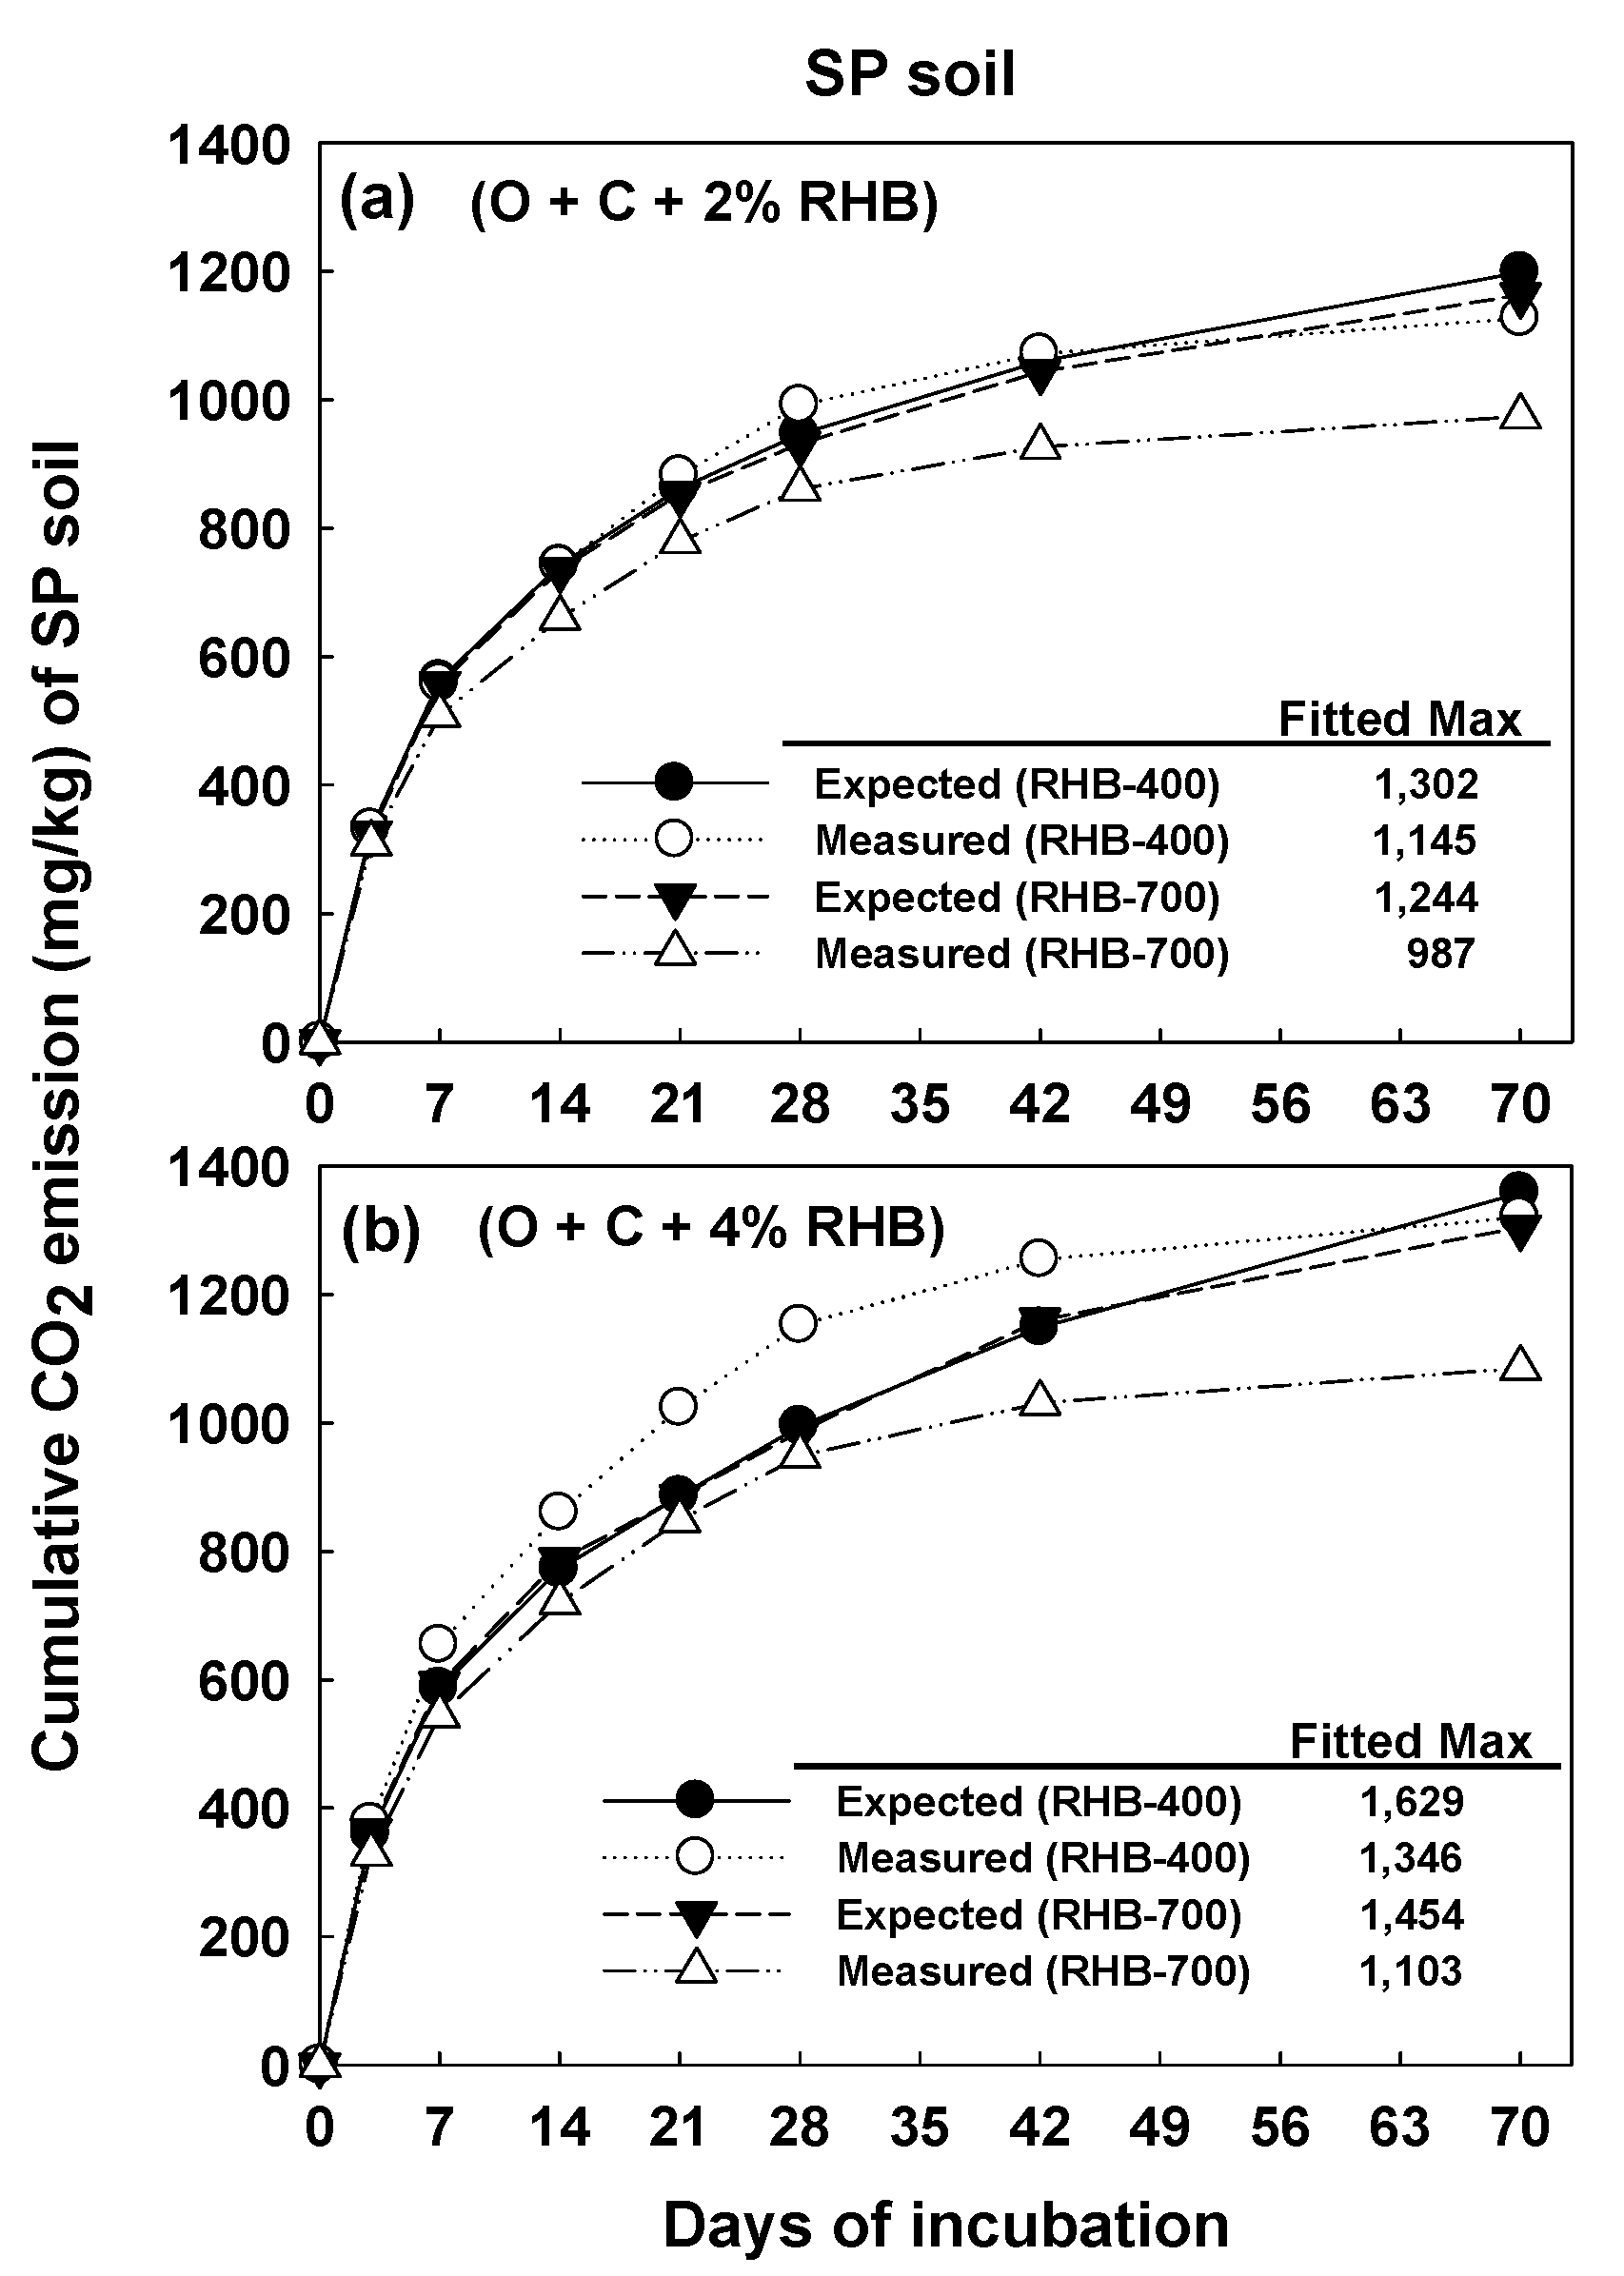
3.3. Kinetics of Carbon Mineralization

To clarify the interaction between compost and biochars, a comparison was conducted between the expected values and measured values of cumulative CO2 emission in the treatment of co-applications (O + C + RHB) (Figure 3a,b). The expected values were calculated with the values from the individual applications of the compost and biochars as follows: (O + C) + (O + RHB) – O. Therefore, the differences between expected and measured values could be attributed to the effect of co-applications. In this study, the three soils exhibited a similar trend in the comparison. The trend found in the Sp soil was illustrated in Figure 3 as a representative of the three soils. The cumulative CO2 emission curves of the measured values approximately reached a plateau while those of the expected values kept increasing, which indicates that the unstable C pool might decline by co-application.
Double-exponential model (two-pool kinetic model) was used to describe C mineralization of soils amended with biochar and compost. Molina et al. (1980) [35] has proposed a two-pool kinetic model of nitrogen mineralization, which was also successfully used to predict carbon mineralization [36]. We fitted the results with the model and estimated the maximum of unstable carbon pool as given in Figure 3. The results of Sp soil were revealed only because the similar trends were found among three studied soils. Co-application of biochar with compost obviously decreased the maximum of unstable carbon pool by 12.1%–17.4% and 20.7%–24.1% for RHB-400 and RHB-700 (Figure 3a,b), respectively.
Figure 3. The expected and measured cumulative CO2 emission in the Sp soil amended with the compost at the rate of 1% and biochars at the rates of 2% (a) and 4% (b). Expected values were calculated from the treatments of control (O), compost only (O + C) and biochar only (O + RHB). Fitted Max: the maximum value estimated via two-pool kinetic model fitting.
Sustainability 07 13317 g003

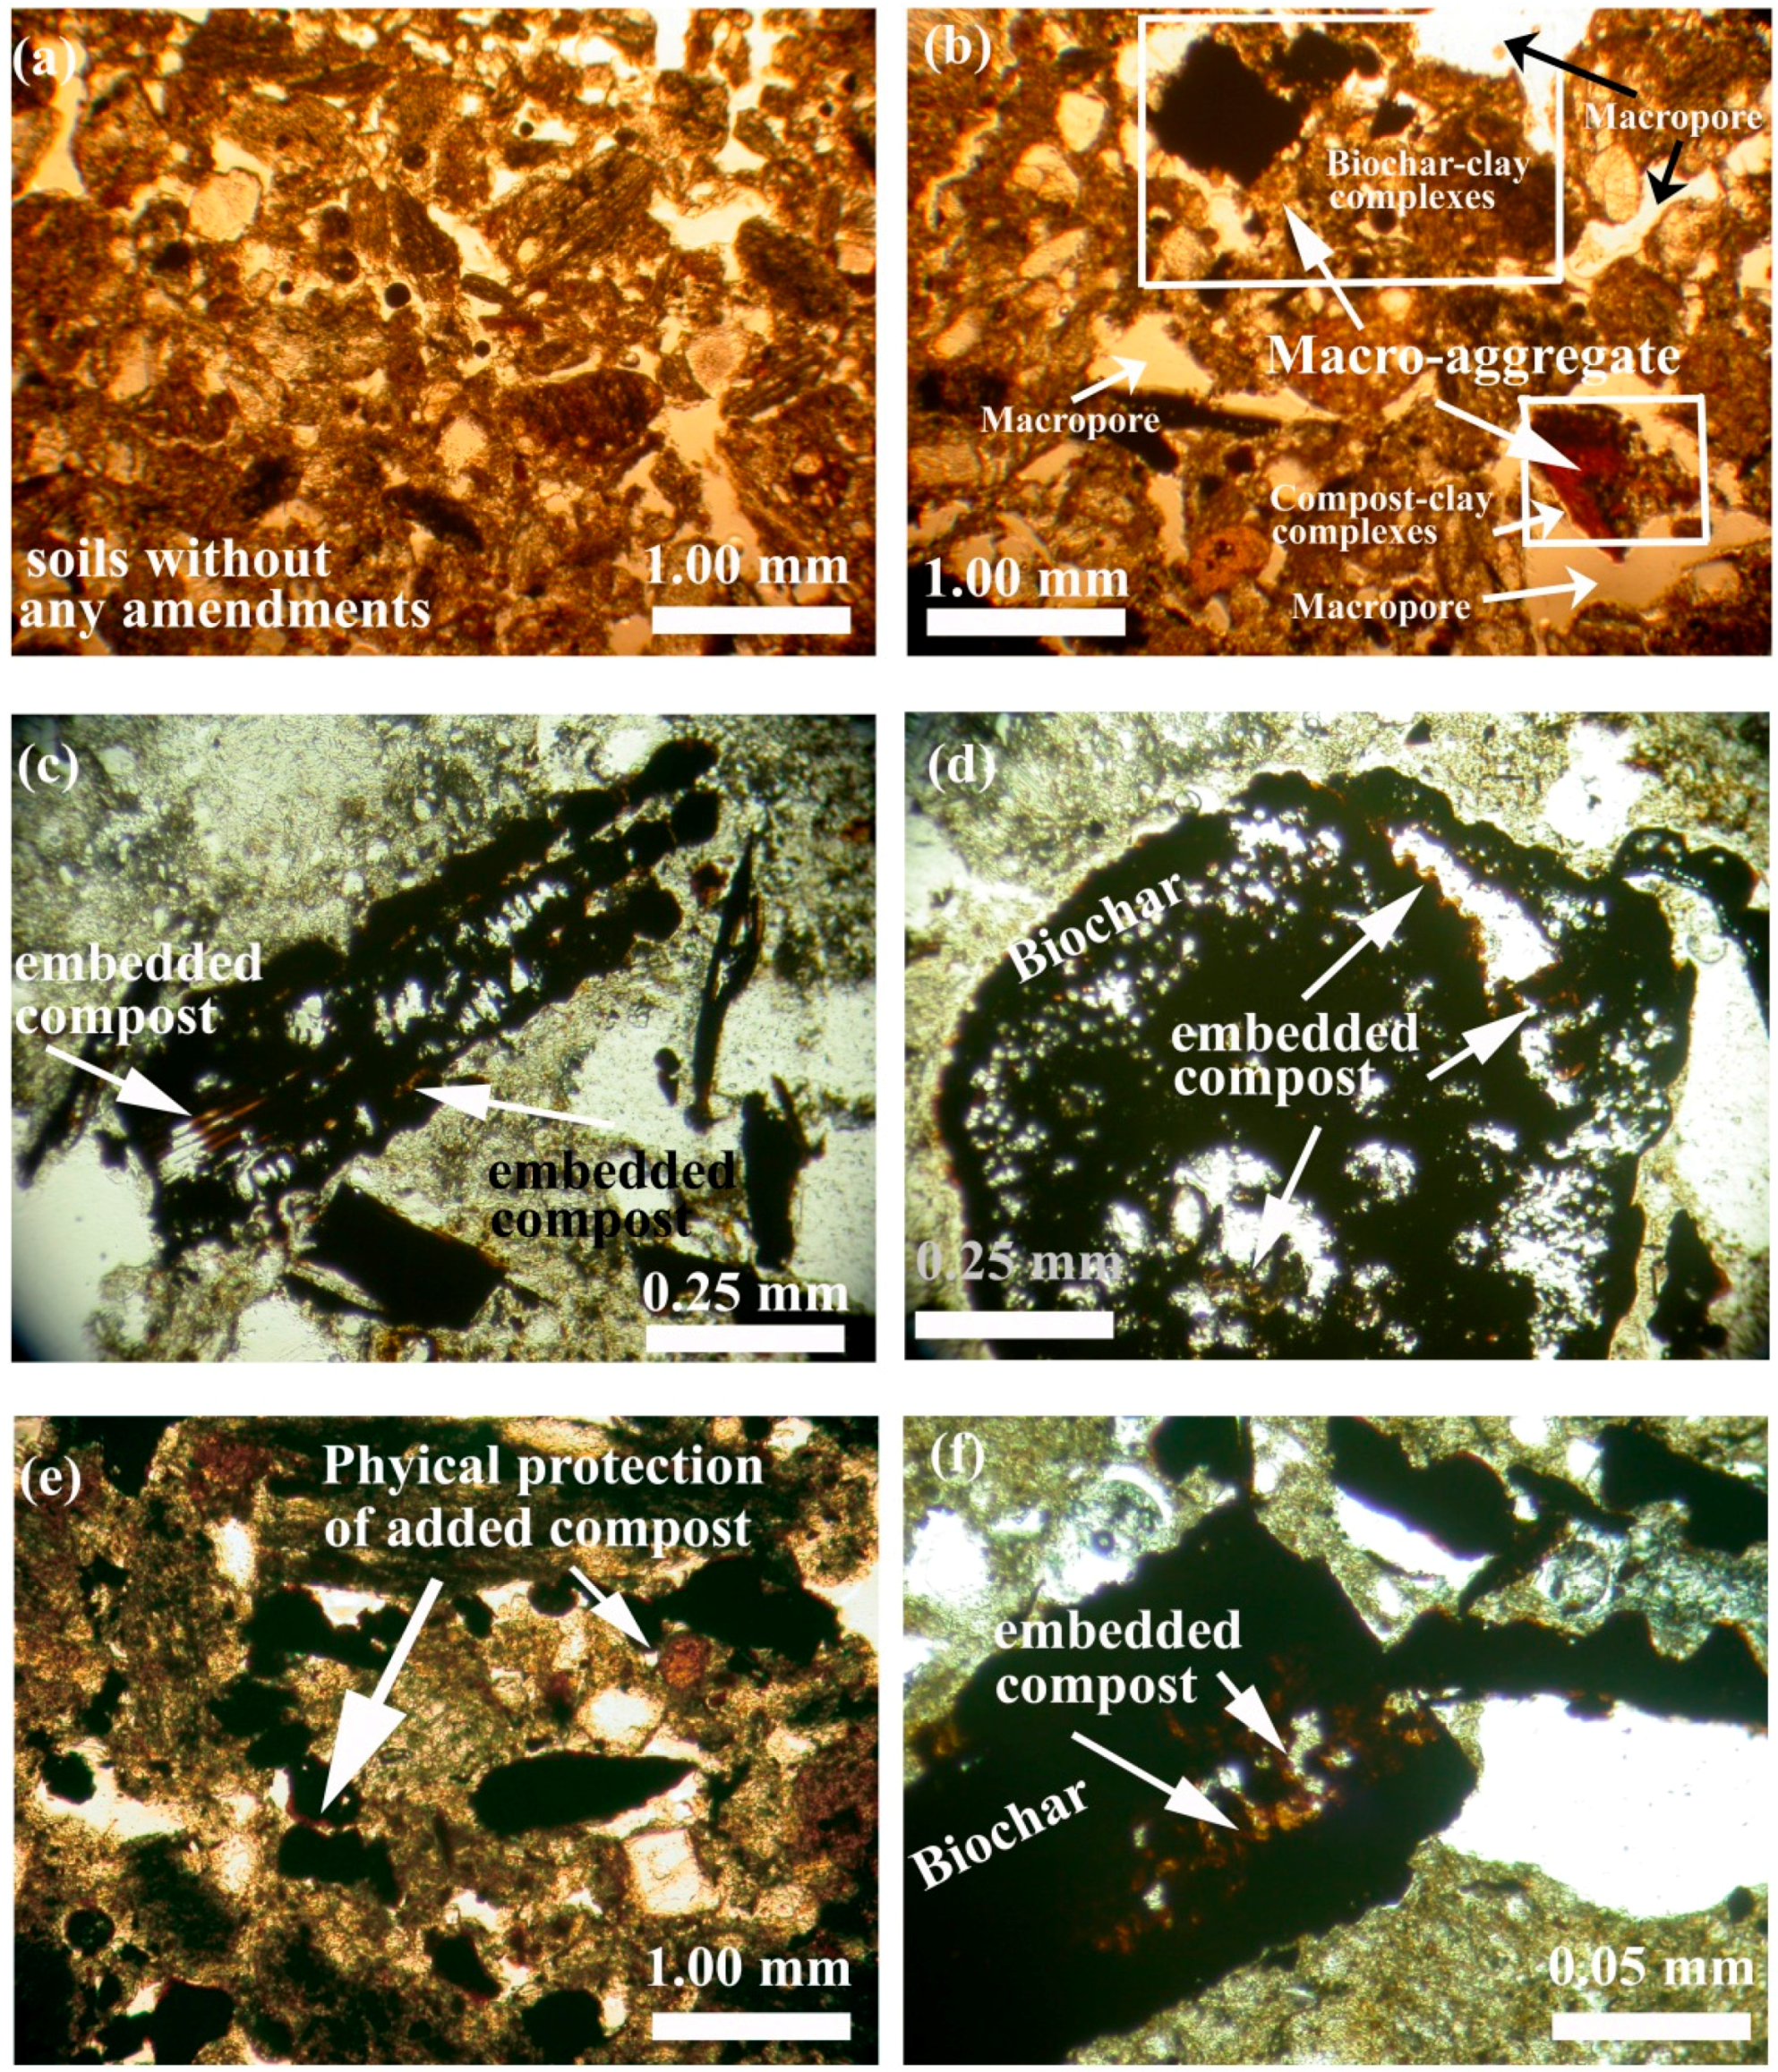
3.4. Soil Micromorphology

To determine the interactions among the compost, biochar, and soil particles, micro-structures were observed using a polarized microscope. As representatives, the microscope images of the thin section of the Lo soil and Sp soil treated with 1% compost and 2% biochars are shown in Figure 4. After 70 days, macroaggregates formed during the mutual interaction among the soil particles, biochar, and compost (Figure 4a,b). Microstructure changed from single spaced porphyric (unamended treatment) to single spaced equal enaulic (biochar treatment) based on the micromorpholigical description guidelines [33]. Figure 4c–f further indicated that added compost (brown color) was obviously embedded or adsorbed into the micropores and surface of the biochar.
Figure 4. Microstructural observations in the biochar- and compost-amended soils (Lo soil and Sp soil) by using a polarized microscope: (a) un-amended Lo soil; (b) (c)the treatment of 2% RHB-400 + 1% compost in Lo soil, plain polarized light (PPL); (d)–(f) the treatment of 2% RHB-700 + 1% compost in Sp soil with PPL.
Sustainability 07 13317 g004

4. Discussions

4.1. CO2 Emissions from Soils Amended with the Compost and Biochars

Some researchers have suggested that biochar application in soils might facilitate the decomposition rate of organic matter to maintain nutrients for crops in temperate regions [9,10,11,18,35]. On contrary, in subtropical or tropical regions, it is better to stabilize OM from rapidly decomposing inducing financial lose while reducing compost application for land sustainability. Therefore, a new management strategy to slow down decomposition of organic amendments is necessary, particularly in subtropical and tropical regions.
The current results show that the treatments involving biochar exhibited higher cumulative CO2 emission than biochar-free treatments (Figure 1). This could be due largely to the significantly higher emission of CO2 in the first two weeks. Similar results have been reported by some studies [3,9,18], which indicated that labile C in biochars could effectively lead to an increase in CO2 emission because of priming effects. Deenik et al. (2011) [37] demonstrated that biochars with high volatile matter (VM) contents also provide a source of bioavailable C, which stimulates microbial growth and increases C mineralization in soils. Therefore, we deduced that the increased CO2 emission occurred after biochar addition because of (1) the mineralization of labile C (including VM) in the biochars, (2) interactive priming effects among the biochars, compost, and native SOM, and (3) the facilitation of soil aeration by biochar addition, which could be demonstrated by microstructure observation (Figure 4).
With incubation time, this study verified that added OM could be gradually stabilized through biochar addition. Figure 3 indicates that the cumulative CO2 emission curves of the measured values approximately reached a plateau while those of the expected values kept increasing, which expressed that the unstable C pool might decline by co-application.
Furthermore, in this study, the biochar produced at a lower pyrolization temperature seemed to induce more cumulative CO2 emissions in the biochar-amended soils than the biochar produced at a higher temperature did (Figure 1). This may be attributable to a greater proportion of recalcitrant C [12] and lower ROC content in RHB-700 than in RHB-400 (Table 2) [17,18]. We supposed that co-application of biochars with composts may be a better way to stabilized SOM and sequestrate carbon in the soils than individual application, especially for a biochar produced with higher temperatures.
To clarify the interaction among biochar, compost, and soil component, a micro-scale observation was carried out by polarized microscope. From our microstructure observation (Figure 4), a mechanism of SOM stabilization by biochar addition could be deduced as follows: soil structure was changed and some macro-aggregate were formed after biochar incorporation (Figure 4a;4b), which was also provided by our previous studies [38,39]. The formation of the new aggregates wrapped the biochar and compost in the aggregates, and therefore might prevent from rapidly decomposing by microbes (Figure 4c–f). Accordingly, the decreases in unstable carbon pool (Figure 3) may also result from the sorption of compost-derived carbon onto the biochar, either within the biochar pores (Figure 4c,d,f) or onto the external biochar surfaces (Figure 4e). Cornelissen et al. (2005) [40] and Sobek et al. (2009) [41] reported that biochars exhibit extremely high adsorption affinity for organic matter and might suppress organic C mineralization. In addition, Kasozi et al. (2010) [42] reported that the organic matter sorption onto biochar surfaces is kinetically limited by slow diffusion into the subnanometer-sized pores dominating biochar surfaces. The various organomineral interactions lead to aggregations of clay particles and organic materials, which stabilizes both soil structure and the carbon compounds within the aggregates.

4.2. Effect of Soil Type on Carbon Mineralization with Compost and Biochar Amendment

According to the results shown in Figure 1, the differences in cumulative CO2 emission between the treatments with and without biochar were approximately 59.9–252, 85.8–327, and 81.0–190 mg/kg for the Lo, Sp, and Ct soils, respectively. Sigua et al. (2014) [43] has incorporated several biochars into loamy and sandy soils, and the loamy soil exhibited a cumulative CO2-C emission that was two to three-fold higher than that of the sandy soil, which was explained by the higher content of labile SOC in the loamy soil. In this study, the highest cumulative CO2 emission was observed in the Sp soil for all treatments (Figure 1), which may be attributable to the higher ROC content of the Sp soil compared with other soils (Table 1).
Except for the effects of the initial labile C pool on the cumulative CO2 emission, soil texture, and soil pH are also suggested to be critical control factors in carbon decomposition or CO2 emission. Sissoko and Kpomblekou-A (2010) [44] indicated that the stabilizing effect of organic matter in soils contributed to the encapsulation between clay particles and entrapment of organic matter in small pores of aggregates, which are inaccessible to microbes. Qauuym et al. (2012) [11] revealed that charcoal is considerably more stable in Oxisol than in Alfisol, because Oxisol generally contains higher clay and Fe/Al oxide content. Furthermore, fine soil texture can physically protect SOM against decomposition by microbes through the adsorption of organic matter onto the inorganic clay surface and the entrapment of organic matter in small aggregates [15,45].However, the lowest rate and cumulative amount of CO2 emission for all treatments were found in the Ct soil, which had much lower clay than the other two soils (Figure 1). Moreover, the ACM (%) was higher in the Sp soil for all treatments than the Lo and Ct soils (Figure 2), which indicates that carbon derived either from the compost or biochars decomposed more rapidly in the Sp soil despite its clay content not being the lowest.
The highest pH value (pH 8) of the Ct soil might alter the microbial population and therefore lead to a lower cumulative CO2 emission than that of the other two soils. Soil pH value might influence the microbial activity and consequently limit the decomposition of applied organic amendments [46,47]. Therefore, the neutral Sp soil may be more suitable for microbial activity and consequently exhibited higher CO2 emission than the other two soils. Our results implied that the efficiency of carbon stabilization caused by biochar application may be more sensitive to the soil pH than the clay content.

5. Conclusions

One of the best management practices (BMPs) for land sustainability in subtropics and tropics is long-term stabilization of SOM. Based on our results, the potential benefits of biochar application could reduce the C mineralization of the added compost through mutual interaction of biochars and compost and, thus, extend the efficiency of the compost application. Co-application of compost with biochar may be more efficient to sequester C than individual application into soils, especially for the biochar produced at high pyrolization temperature. In this study, applying 4% of both husk biochars produced at 400 and 700 °C to soils with 1% compost provided the highest efficiency in reducing the C loss in soils.

Acknowledgments

The authors thank the Ministry of Science and Technology, Republic of China, for financially supporting this research under contract number NSC-101-2313-B-020-013-MY2. The authors are also grateful to Chuan-Chi Chien from the Industrial Technology Research Institute, Tainan, Taiwan, for providing the rice hull biochar.

Author Contributions

Dr. Shih-Hao Jien designed all research, made all tables and figures and finished this paper writing; Chung-Chi Wang, who was the master student graduated from Dr. Jien’s lab performed this research and analyzed the data; Dr. Chia-Hsing Lee and Tsung-Yu Lee provided their valuable opinions during the manuscript writing. All authors read and approved the final manuscript.

Conflicts of Interest

The authors declare no conflict of interest.

References

  1. Mekuria, W.; Noble, A.; Sengtaheuanghoung, O.; Hoanh, C.T.; Bossio, D.; Sipaseuth, N.; McCartney, M.; Langan, S. Organic and Clay-Based Soil Amendments Increase Maize Yield, Total Nutrient Uptake, and Soil Properties in Lao PDR. Agroecol. Sustain. Food Syt. 2014, 38, 936–961. [Google Scholar] [CrossRef]
  2. Bolan, N.S.; Kunhikrishnan, A.; Choppala, G.K.; Thangarajan, R.; Chung, J.W. Stabilization of carbon in composts and biochars in relation to carbon sequestration and soil fertility. Sci. Total Environ. 2012, 424, 264–270. [Google Scholar] [CrossRef] [PubMed]
  3. Troy, S.M.; Lawlo, P.G.; O’Flynn, C.J.; Healy, M.G. Impact of biochar addition to soil on greenhouse gas emissions following pigmanure application. Soil Biol. Biochem. 2013, 60, 173–181. [Google Scholar] [CrossRef]
  4. Lehmann, J.; Czimczik, C.; Laird, D.; Sohi, S. Stability of biochar in the soil. In Biochar for Environmental Management: Science and Technology; Lehmann, J., Joseph, S., Eds.; Earthscan: London, UK, 2009; pp. 183–205. [Google Scholar]
  5. Yuan, J.H.; Xu, R.K.; Zhang, H. The forms of alkalis in the biochar produced from crop residues at different temperatures. Bioresour. Technol. 2011, 102, 3488–3497. [Google Scholar] [CrossRef] [PubMed]
  6. Zhao, X.; Wang, J.W.; Xu, H.J.; Zhou, C.J.; Wang, S.Q.; Xin, G.X. Effects of crop-straw biochar on crop growth and soil fertility over a wheat-millet rotation in soils of China. Soil Use Manag. 2014, 30, 311–319. [Google Scholar] [CrossRef]
  7. Gaunt, J.; Lehmann, J. Energy balance and emissions associated with biochar sequestration and pyrolysis bioenergy production. Environ. Sci. Technol. 2008, 42, 4152–4158. [Google Scholar] [CrossRef] [PubMed]
  8. Laird, D.A. The charcoal vision: A win-win-win scenario for simultaneously producing bioenergy, permanently sequestering carbon, while improving soil and water quality. Agron. J. 2008, 100, 178–181. [Google Scholar] [CrossRef]
  9. Rogovska, N.; Laird, D.; Cruse, R.; Fleming, P.; Parkin, T.; Meek, D. Impact of Biochar on Manure Carbon Stabilization and Greenhouse Gas Emissions. Soil Sci. Soc. Am. J. 2011, 75, 871–879. [Google Scholar] [CrossRef]
  10. Awad, Y.M.; Blagodatskaya, E.; Ok, Y.S.; Kuzyakov, Y. Effects of polyacrylamide, biopolymer, and biochar on decomposition of soilorganic matter and plant residues as determined by 14C and enzyme activities. Eur. J. Soil Biol. 2012, 48, 1–10. [Google Scholar] [CrossRef]
  11. Awad, Y.M.; Blagodatskaya, E.; Ok, Y.S.; Kuzyakov, Y. Effects of polyacrylamide, biopolymer and biochar on the decomposition of 14C-labelled maize residues and on their stabilization in soil aggregates. Eur. J. Soil Sci. 2013, 64, 488–499. [Google Scholar] [CrossRef]
  12. Qayyum, M.F.; Steffens, D.; Reisenauer, H.P.; Schubert, S. Biochars influence differential distribution and chemical composition of soil organic matter. Plant Soil Environ. 2014, 60, 337–343. [Google Scholar]
  13. Fernández, J.M.; Nieto, M.A.; López-de-sá, E.G.; Gascó, G.; Méndez, A.; Plaza, C. Carbon dioxide emmisions from semi-arid soils amended with biochar alone or combined with mineral and organic fertilizers. Sci. Total Environ. 2014, 482–483, 1–7. [Google Scholar] [CrossRef] [PubMed] [Green Version]
  14. Kuzyakov, Y.; Subbotina, I.; Chen, H.; Bogomolova, I.; Xu, X. Black carbon decomposition and incorporation into soil microbeal biomass estimated by 14C labeling. Soil Biol. Biochem. 2009, 41, 210–219. [Google Scholar] [CrossRef]
  15. Van Veen, J.A.; Kuikman, P.J. Soil structure aspects of decomposition of organic matter by micro-organisms. Biogeochemistry 1990, 11, 213–233. [Google Scholar] [CrossRef]
  16. Hamer, U.; Marschner, B.; Brodowski, S.; Amelung, W. Interactive priming of black carbon and glucose mineralisation. Org. Geochem. 2004, 35, 823–830. [Google Scholar] [CrossRef]
  17. Zimmerman, A.R.; Gao, B.; Ahn, M.Y. Positive and negative carbon mineralization priming effects among a variety of biochar-amended soils. Soil Biol. Biochem. 2011, 43, 1169–1179. [Google Scholar] [CrossRef]
  18. Keith, A.; Singh, B.; Singh, B.P. Interactive Priming of Biochar and Labile Organic Matter Mineralization in a Smectite-Rich Soil. Environ. Sci. Technol. 2011, 45, 9611–9618. [Google Scholar] [CrossRef] [PubMed]
  19. Streubel, J.D.; Collins, H.P.; Garcia-Perez, M.; Tarara, J.; Granatstein, D.; Kruger, C.E. Influence of contrasting biochar types on five soils at increasing rates of application. Soil Sci. Soc. Am. J. 2011, 75, 1402–1413. [Google Scholar] [CrossRef]
  20. Thomas, G.W. Soil pH and soil acidity. In Methods of Soil Analysis: Soil Science Society of America Book Series 5 Part 3—Chemical Methods; Sparks, D.L., Ed.; ASA and SSSA: Madison, WI, USA, 1996; pp. 487–488. [Google Scholar]
  21. Rhoades, J.D. Soluble salts. In Methods of Soil Analysis Part 2—Chemical and Microbiological Properties; Page, A.L., Ed.; ASA and SSSA: Madison, WI, USA, 1982; pp. 167–179. [Google Scholar]
  22. Gee, G.W.; Bauder, J.W. Particle-size analysis. In Methods of Soil Analysis Part 1—Physical and Mineralogical Methods; Klute, A., Ed.; ASA and SSSA: Madison, WI, USA, 1986; pp. 383–411. [Google Scholar]
  23. Sumner, M.E.; Miller, W.P. Cation exchange capacity and exchange coefficients. In Methods of Soil Analysis: Soil Science Society of America Book Series 5 Part 3—Chemical Methods; Sparks, D.L., Ed.; ASA and SSSA: Madison, WI, USA, 1996; pp. 1218–1220. [Google Scholar]
  24. Nelson, D.W.; Sommers, L.E. Total carbon, organic carbon, and organic matter. In Methods of Soil Analysis: Soil Science Society of America Book Series 5 Part 3—Chemical Methods; Sparks, D.L., Ed.; ASA and SSSA: Madison, WI, USA, 1996; pp. 961–1010. [Google Scholar]
  25. Bremner, J.M.; Mulvaney, C.S. Nitrogen-total. In Methods of Soil Analysis, Part 2—Chemical and Microbiological Properties; Page, A.L., Ed.; ASA and SSSA: Madison, WI, USA, 1982; pp. 595–624. [Google Scholar]
  26. Mulvaney, R.L. Nitrogen-Inorganic forms. In Methods of Soil Analysis: Soil Science Society of America Book Series 5 Part 3—Chemical Methods; Sparks, D.L., Ed.; ASA and SSSA: Madison, WI, USA, 1996; pp. 1123–1184. [Google Scholar]
  27. Loeppert, R.H.; Suarez, D.L. Carbonate and gypsum. In Methods of Soil Analysis Part 2—Chemical and Microbiological Methods, 2nd ed.; Agronomy Monograph 9; America Society of Agronomy and Soil Science Society of America: Madison, WI, USA, 1982; pp. 437–451. [Google Scholar]
  28. Blair, G.J.; Lefroy, R.D.B.; Lisle, L. Soil carbon fractions based on their degree of oxidation, and the development of a carbon management index for agricultural systems. Aust. J. Agric. Res. 1995, 46, 1459–1466. [Google Scholar] [CrossRef]
  29. Conteh, A.; Lefroy, R.D.B.; Blair, G.J. Dynamics of organic matter in soils as determined by variations in 13C/12C isotopic ratios and fractionation by ease of oxidation. Aust. J. Soil Res. 1997, 35, 881–890. [Google Scholar] [CrossRef]
  30. Zibilske, L.M. Carbon mineralization. In Methods of Soil Analysis: Soil Science Society of America Book Series 5 Part 2—Microbial and Biochemical Properties; Weaver, R.W., Ed.; ASA and SSSA: Madison, WI, USA, 1994; pp. 835–863. [Google Scholar]
  31. Novak, J.M.; Busscher, D.W.; Watts, D.W.; Laird, D.A.; Ahmedna, M.A.; Niandou, M.A.S. Short-term CO2 mineralization after additions of biochar and switchgrass to a TypicKandiudult. Geoderma 2010, 154, 281–288. [Google Scholar] [CrossRef]
  32. Riberio, H.M.; Fanqueiro, D.; Alves, F.; Vasconcelos, E.; Coutinho, J.; Bol, R.; Cabral, F. Carbon-mineralization kinetics in an organically managed Cambic Arenosol amended with organic fertilizers. J. Plant Nutr. Soil Sci. 2010, 173, 39–45. [Google Scholar] [CrossRef]
  33. Stoops, G. Guidelines for Analysis and Description of Soil and Regolith Thin Sections; Soil Science Society of Amenrica, Inc.: Madison, WI, USA, 2003. [Google Scholar]
  34. Soil Survey Staff. Keys to Soil Taxonomy, 11th edn USDA-NRCS, Agricultural Handbook No. 436; US Government Printing Office: Washington, DC, USA, 2010.
  35. Molina, J.A.E.; Clapp, C.E.; Larson, W.E. Potentially mineralizable nitrogen in soil: the simple exponential model does not apply to the first 12 weeks of incubation. Soil Sci. Soc. Am. J. 1980, 44, 442–443. [Google Scholar] [CrossRef]
  36. Liang, B.Q.; Lehmann, J.; Solomon, D.; Kinyangi, J.; Grossman, J.; O’Neill, B.; Skjemstad, J.O.; Thies, J.; Luizão, F.J.; Petersen, J.; et al. Black carbon increases cation exchange capacity in soils. Soil Sci. Soc. Am. J. 2006, 70, 1719–1730. [Google Scholar] [CrossRef]
  37. Deenik, J.L.; Diarra, A.; Uehara, G.; Campell, S.; Sumiyoshi, Y.; Antal, M.J., Jr. Charcoal ash and volatile matter effects on soil properties and plant growth in an acid Ultisol. Soil Sci. 2011, 176, 336–345. [Google Scholar] [CrossRef]
  38. Jien, S.H.; Wang, C.S. Effects of biochar on soil properties and erosion potential in a highly weathered soil. Catena 2013, 110, 225–233. [Google Scholar] [CrossRef]
  39. Hseu, Z.Y.; Jien, S.H.; Chien, W.S.; Liou, R.C. Impacts of biochar on physical properties and erosion potential of a mudstone slopeland soil. Sci. World J. 2014. [Google Scholar] [CrossRef] [PubMed]
  40. Cornelissen, G.; Gustafsson, O.; Bucheli, T.D.; Jonker, M.T.O.; Koelmans, A.A.; VanNoort, P.C.M. Extensive sorption of organic compounds to black carbon, coal, and kerogen in sediments and soils: Mechanisms and consequences for distribution, bioaccumulation, and biodegradation. Environ. Sci. Technol. 2005, 39, 6881–6895. [Google Scholar] [CrossRef] [PubMed]
  41. Sobek, A.; Stamm, N.; Bucheli, T.D. Sorption of phenyl urea herbicides to black carbon. Environ. Sci. Technol. 2009, 43, 8147–8152. [Google Scholar] [CrossRef] [PubMed]
  42. Kasozi, G.N.; Zimmerman, A.R.; Nkedi-Kizza, P.; Gao, B. Catechol and humic acid sorption onto a range of laboratory-produced black carbons (biochars). Environ. Sci. Technol. 2010, 44, 6189–6195. [Google Scholar] [CrossRef] [PubMed]
  43. Sigua, G.C.; Novak, J.M.; Watts, D.W.; Cantrell, K.B.; Shumaker, P.D.; Szogi, A.A.; Johnson, M.G. Carbon mineralization in two ultisols amended with different sources and particle sizes of pyrolyzed biochar. Chemosphere 2014, 103, 313–321. [Google Scholar] [CrossRef] [PubMed]
  44. Sissoko, A.; Kpomblekou-A, K. Carbon decomposition in broiler litter-amended soils. Soil Biol. Biochem. 2010, 42, 543–550. [Google Scholar] [CrossRef]
  45. Sørensen, L.H. Size and persistence of the microbial biomass formed during the humification of glucose, hemicellulose, cellulose, and straw in soils containing different amounts of clay. Plant Soil 1983, 75, 121–130. [Google Scholar] [CrossRef]
  46. Motavalli, P.P.; Palm, C.A.; Parton, W.J.; Elliott, E.T.; Frey, S.D. Soil pH and organic C dynamics in tropical forest soils: evidence from laboratory and simulation studies. Soil Biol. Biochem. 1995, 27, 1589–1599. [Google Scholar] [CrossRef]
  47. Huang, C.C.; Chen, Z.S. Carbon and nitrogen mineralization of sewage sludge compost in soils with different initial pH. Soil Sci. Plant Nutr. 2009, 55, 715–724. [Google Scholar] [CrossRef]

