1. Introduction
Healthcare is one of the most complex and rapidly-changing industries. It is continually transformed by new technologies, techniques, as well as pharmaceutical and delivery systems [
1]. Hospital design incorporates a development process that is based on the following main concerns: the adequacy of technological advances in healthcare; compliance with rules and regulations (that ensure the good quality of the designed environments); the complexity and flexibility required for the project; and the life-cycle cost constrains.
In Europe, about 10% of the GDP of each country is used in the construction and operation phases of healthcare buildings and this type of construction contributes to about 5% of total CO
2 emissions from European Union countries [
2]. In hospital buildings, the intensive use of energy and water resources and the production of waste have brought this type of building into discussions in the field of sustainability. However, at the present moment there are still some healthcare building stakeholders who are not concerned about the efficiency of these buildings and do not implement better practices. Fortunately, there is, around the world, a rising awareness about the relevance of these aspects and the need to increase the efficiency of these buildings.
Early environmental design initiatives focused only on the reduction of energy demands. Different institutes and governmental initiatives developed tools and policies to address this problem. In the 1980s and the 1990s, some of the initiatives started to reflect concerns about the sustainability of the construction industry and, in 1993, the UIA/AIA Word Congress of Architects concluded that it was a bold challenge to the profession of an architect to put a broader sustainability agenda into practice [
3]. In 2000 many of these initiatives began to incorporate sustainable design strategies as basic and fundamental in standard practice. In 2005, the American Institute of Architects (AIA) established a more aggressive position on the responsibility of design professionals, supporting the position that the architects would have to change their professional input and work together with the clients, thus changing the actual paradigm of designing and operating a building [
4].
Therefore, the three major challenges of any country’s healthcare system are: its sustainability, which depends on the full long-term balance between revenue and expenditure; accountability, because this demonstrates, systematically and objectively, the proper use of available resources; and innovation, which is the ability to attain new knowledge and new technologies in clinical practice [
5].
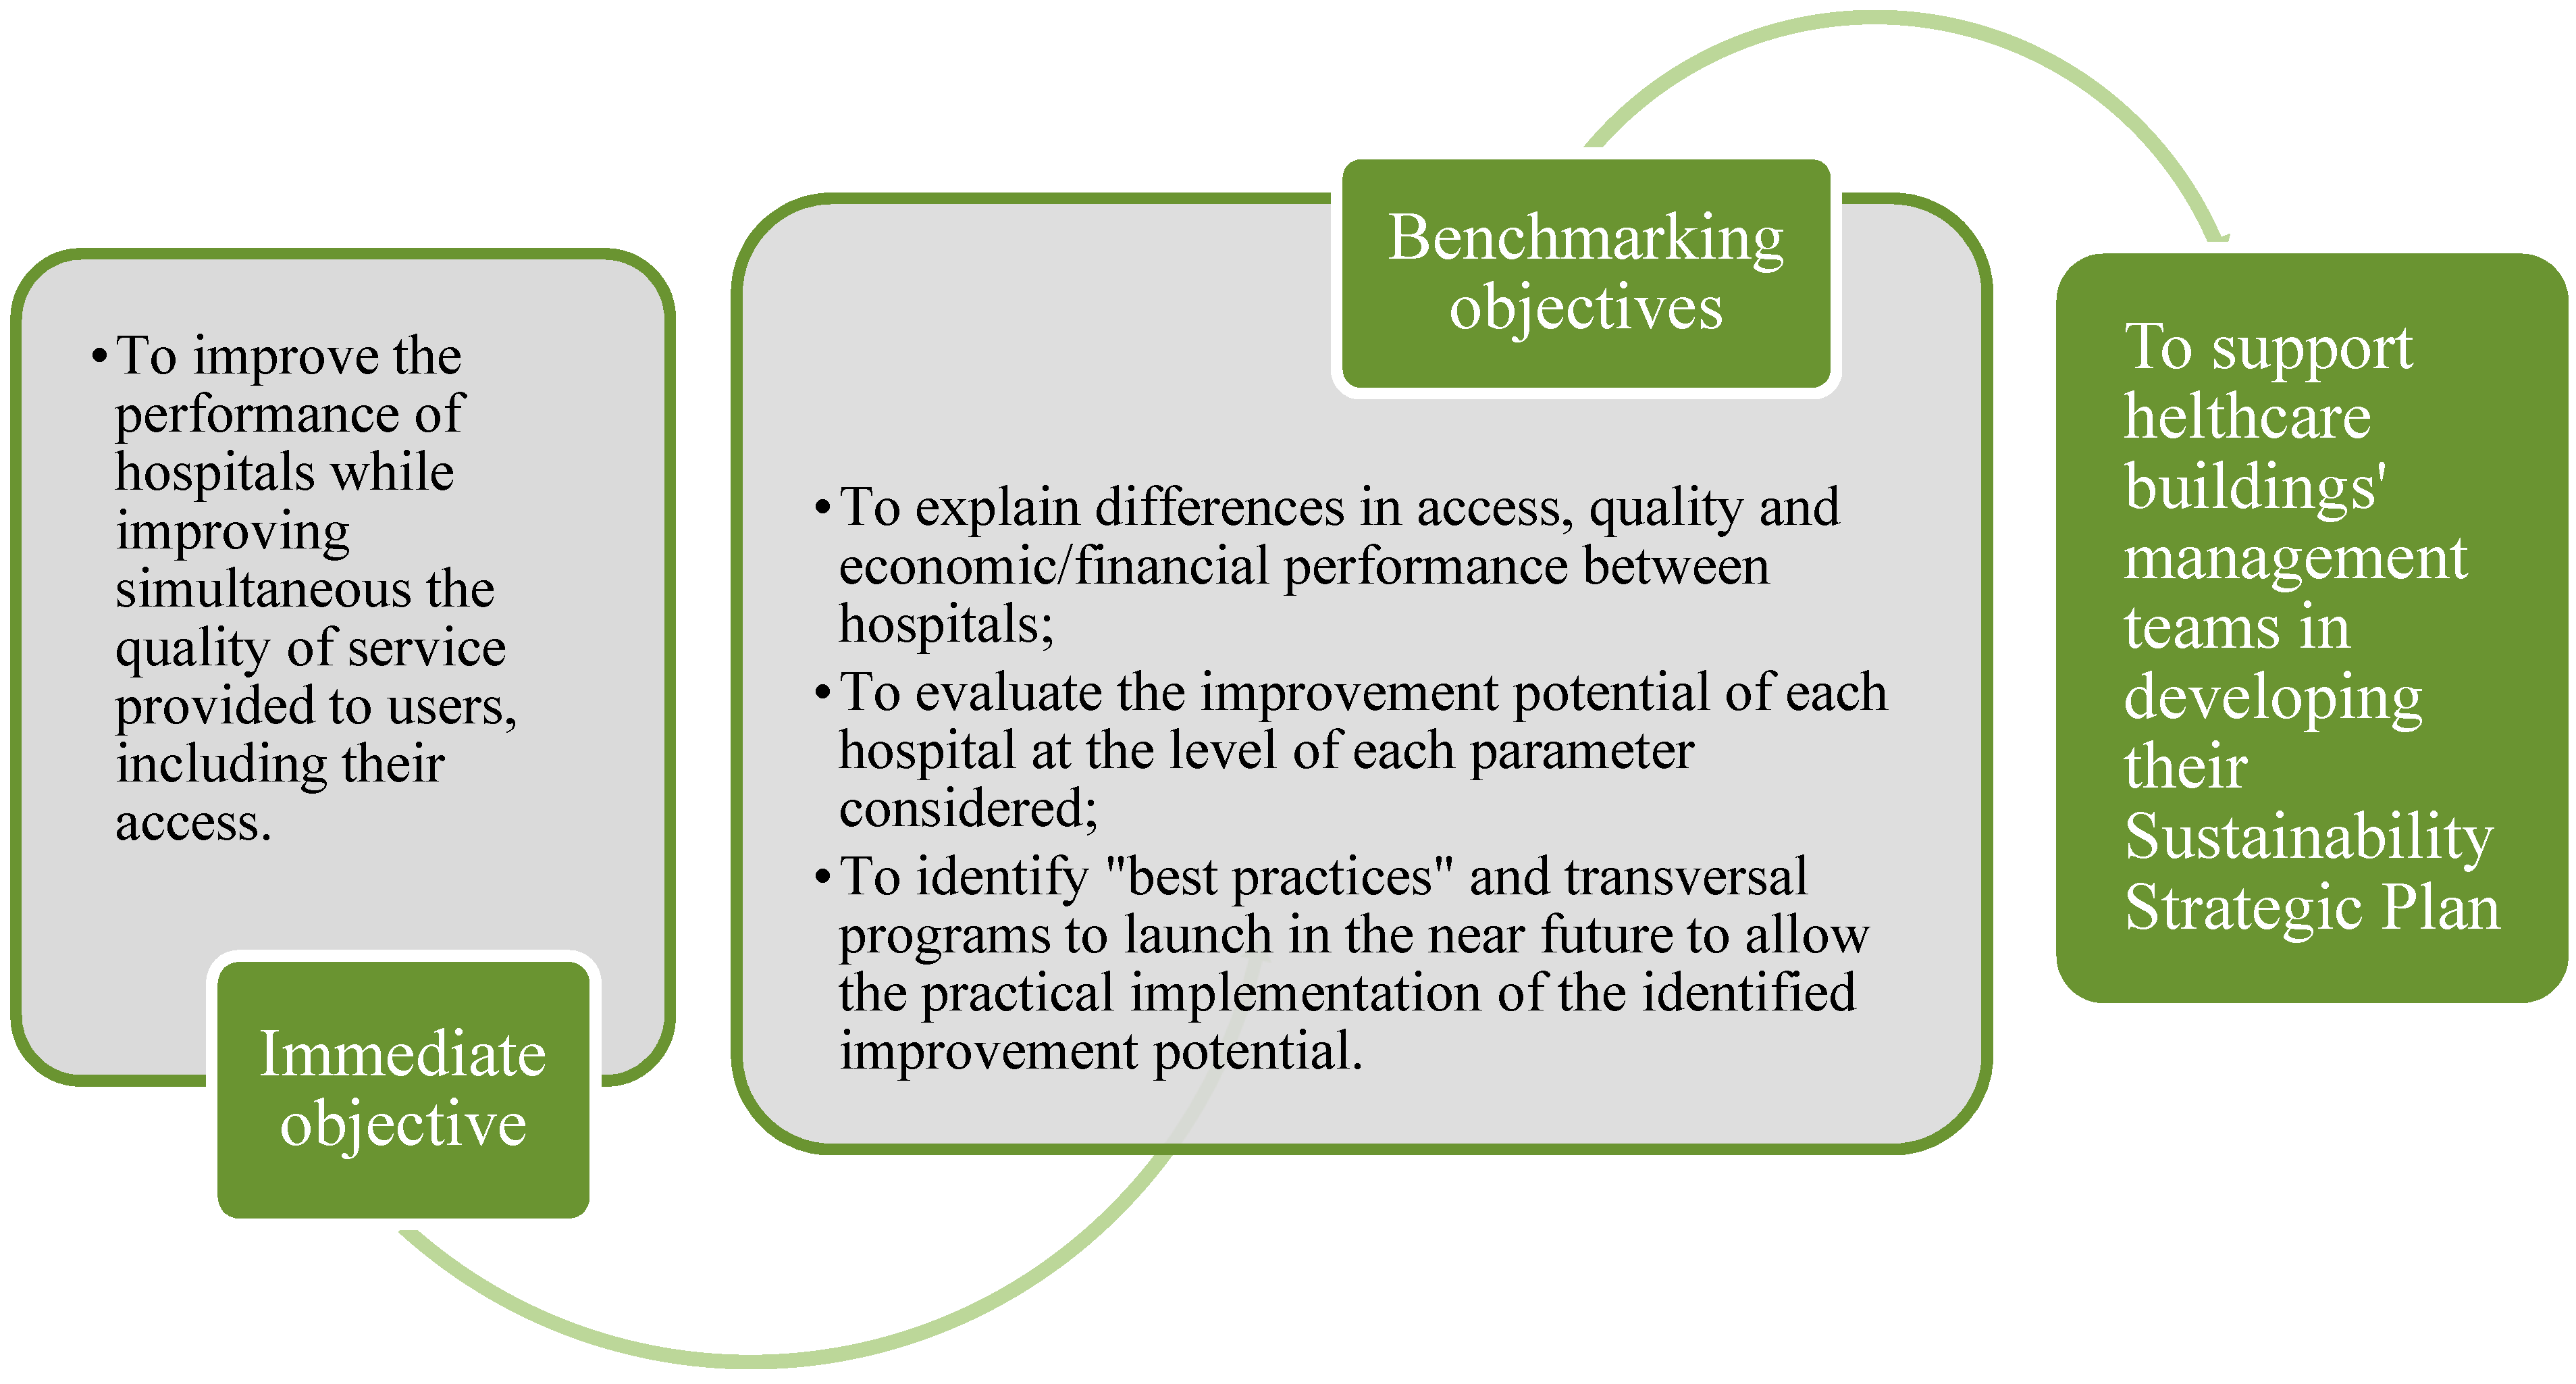
In order to guide and support the development of strategic plans for healthcare buildings, it is fundamental that benchmarks for comparison between institutions can be established. This is important because it allows for identifying: the causes of the differences between hospitals at the resources consumption, accessibility, quality, economic, and financial performance levels; the potential for improvement of each hospital at the level of each assessed performance category or sustainability parameter; the best and conventional building use practices (e.g., best operational energy efficiency practices); and the transversal different programs (including healthcare activities themselves) to be launched for the practical implementation of the identified improvement potential. Thus, the benchmarking process in the field of healthcare buildings, aims at improving both the environmental and societal quality of hospitals, while enhancing their economic and financial performances.
Therefore, benchmarking is a continuous and systematic process for evaluating each organization’s products, services, and/or work processes for the purpose of organizational improvement [
6]. It is a business tool that has blossomed in the 1980s and is now widely used in Total Quality Management (TQM) for comparing performance and identifying improvement opportunities [
6].
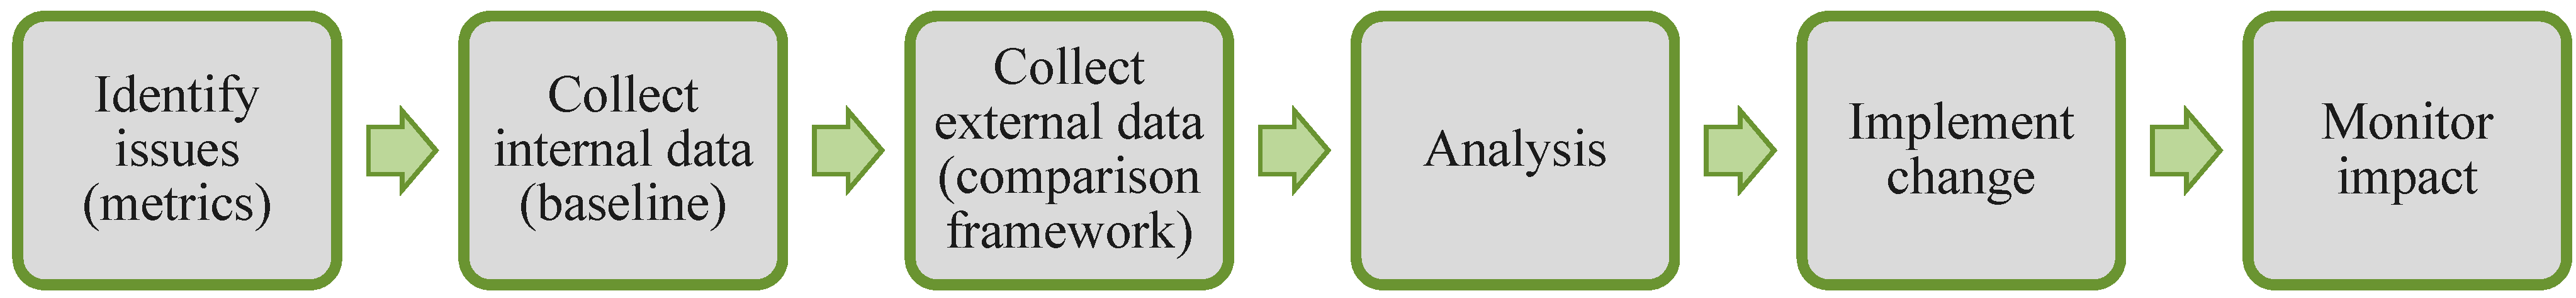
Fundamentally, a “benchmark” is a reference or measurement standard used for comparison. “Benchmarking” is the continuous activity of identifying, understanding and developing better practices and processes that will lead to higher performance [
7]. It is the process of comparing one’s business processes and performance metrics to industry’s best practices. In
Figure 1a typical benchmarking process is presented.
Figure 1.
Example of a typical benchmarking process (adapted from [
8]).
Figure 1.
Example of a typical benchmarking process (adapted from [
8]).
For building and facility management professionals, benchmarking is a strategic management tool which allows operating costs or other metrics to be assessed against similar properties and to evaluate how a given property or portfolio performs relative to its peers [
9]. Through detailed comparative analysis, the benchmarking process can identify priority areas for the implementation of both more efficient operations and management practices by trimming costs or adjusting service levels.
Nevertheless, the quality of a construction work, in order to be considered completely reliable, should meet two fundamental requirements, which are measurability and objectivity. Therefore, the main goal of this research is to reduce, as much as possible, the subjectivity of the assessment method of a new sustainability assessment tool by defining adequate methods to set the benchmarks for the sustainability indicators.
In this paper, a possible method to define benchmarks for resources consumption, waste production, running costs, and operational environmental impacts of healthcare buildings is proposed. This method is based in the analysis of reference buildings, as typical examples of a certain type of construction. This method is presented and tested in the specific context of Portuguese healthcare buildings.
The benchmarks for the sustainability assessment of buildings have been studied and discussed by several authors. For example: Hernandez
et al. [
10] developed energy performance benchmarks and building energy ratings for non-domestic buildings; Chung
et al. [
11] studied the same topics for commercial buildings; Murray
et al. [
12] provided a study that summarized and evaluated the scope for energy-efficiency improvements in small health buildings in the public sector; Kneifel [
13] published a study about cost analysis of energy efficiency measures in new commercial buildings; and Wong
et al. [
14] and Hunt
et al. [
15] studied the water consumption benchmarks for residential buildings. Analyzing the outcomes of these studies, it is possible to conclude that developing the benchmarks for specific resource consumption, like energy or water, is important in order to have a global idea about the consumption and costs of the major resources consumed by a specific type of building. It is clear that in the case of healthcare buildings there is a lot of research potential since there are no previous studies relating to benchmarks for this type of buildings.
Regarding the context of healthcare buildings, there are initiatives around the world that argue that benchmarking is the first step towards efficiency, with energy consumption being one of the most studied and reported parameters. For example, Natural Resources Canada, a department of the Government of Canada, publishes annual reports of the energy use in hospitals. These are aimed at reducing the costs in healthcare buildings by promoting the efficient use of energy [
16]. Additionally, the Chartered Institution of Building Services Engineers (CIBSE) developed the TM22 Energy Assessment and Reporting Methodology (EARM). This document describes a method for assessing the energy performance of an occupied building based on metered energy use, cost, and CO
2 emissions and includes a software implementation of the method. The methodology can be applied both to residential and non-residential buildings and allows calculating savings from changes in use, technology or management, following initial research for BRE by William Bordass Associates [
17].
Another example, from the United Kingdom, is the England’s Estates Return Information Collection (ERIC). This information is collected and published by the Health and Social Care Information Centre (HSCIC) on behalf of the Department of Health. It is the main data collection for estates and facilities services from the National Health Service (NHS), containing information dating back to 1999/2000, and is added to as future returns are completed. The data provided enables the analysis of Estates and Facilities information from the NHS Trusts and Primary Care Trusts (PCT) in England. It is a compulsory requirement that NHS Trusts submit an Estates Return. The data is provided by reporting organizations and is not amended [
18], since the accuracy and completeness is the responsibility of the reporting organizations.
By analyzing also the state of the art concerning HBSA methods, it is possible to identify the following that are specific to evaluate healthcare buildings: BREEAM New Construction, LEED for Healthcare, Green Star—Healthcare and CASBEE for New Construction. All these initiatives are important to support and promote major or minor economic, social and environmental decisions, which should be considered when designing sustainable healthcare buildings. By presenting minimum practices or benchmarks for different sustainability indicators, these methods turn the sustainability goals into tangible performance targets [
19].
Compared with other buildings, the complexity inside hospital buildings is much higher since there are many aspects that influence the quality of the indoor environments and improvement needs. For instance, this is very important in the context of sustainability assessments of this type of building and in the comparison of their performance with the performance of other types of buildings. Although this paper does not address this aspect, there are several studies and published papers in the field. For example: Bromley [
20] studied hospital design at the patient’s point of view; Wurzer [
21] developed research in the field of digital architecture and planning, publishing about agent simulation for different stages of hospital planning; and Chung
et al. [
22] published a study about process simulation techniques to value engineering mode, taking into account the case of hospital buildings.
1.1. Importance of Analyzing and Developing Benchmarks for Healthcare Buildings
The analysis of operation costs, resources consumption, and waste production is very important in the field of Healthcare Building Sustainability Assessment (HBSA) methods [
23], because it allows for the definition of the best practices for each of these important indicators of sustainable development.
In the economic dimension of sustainable development it is imperative to evaluate the life-cycle cost of each design alternative, in order to identify and promote the implementation of the scenario that results in reduced life-cycle costs. Moreover, the aspect that most influences the operational costs of a Healthcare Building is the consumption of resources, mainly energy. The consumption of resources is also related to the environmental dimension of sustainability.
Benchmarks can be used as an important support decision tool, in the process of designing and managing a sustainable healthcare building (
Figure 2).
Figure 2.
The goal of the benchmarking process in the field of healthcare buildings.
Figure 2.
The goal of the benchmarking process in the field of healthcare buildings.
On the other hand, benchmarks are fundamental for sustainability rating methods, since they are reference performance levels against which the different sustainability parameters are compared and assessed. According to “ISO 21931-1-Sustainability in building construction”, reference levels and/or scale of values can be used in the quantification of indicators within the sustainability assessment method [
24]. Therefore, it is necessary to develop quantitative information related with the performance of each type of building to create predefined baseline scales of sustainability levels.
For example, the information sources for the development of benchmarks are: minimum requirements from codes and regulations; statistical analysis of operational performance values; and political target values. In this study, the benchmarks are developed based on the statistical analysis of the operational performance of different types of healthcare buildings in Portugal. The benchmarks for resources consumption, including related environmental impacts, waste production, and running costs can then be used for the following purposes: to compare the performance of different healthcare buildings located in the same context; to present and promote best practices for this type of buildings; and to improve the reliability and objectivity of Healthcare Building Sustainability Assessment (HBSA) methods.
1.2. Aims and Objectives
As stated before, at present there are some studies on good management practices in the field of healthcare buildings and studies concerning the definition of benchmark in building sustainability assessment methods. Nevertheless, after analyzing the state of the art, it is possible to conclude that there are no specific studies that have analyzed and developed benchmarks for resources consumption, including related environmental impacts, waste production and running costs of healthcare buildings.
Based on the results from a state-of-the-art analysis, the aim of this paper is to improve this lack of information, by proposing and analyzing a method to benchmark the performance of healthcare buildings. At the end, the method will be applied to a case study. The chosen case study relates to Portuguese healthcare buildings and how benchmarks for Portuguese healthcare buildings are developed. This study developed the benchmarks for the following parameters:
Resources consumption (water and energy);
Waste production;
Operation costs (related to waste production and water and energy consumption);
Operation environmental impacts (related to water and energy consumption).
The final results are critically analyzed in order to: (i) identify the improvement potential of healthcare buildings at the level of each sustainability indicator analyzed; and (ii) present some future development needs to improve the representativeness of the results obtained. To summarize, the specific objectives of this paper are to:
Survey the resources consumption and running costs of healthcare buildings (related with water and energy demands) and production of waste;
Develop a method to establish the benchmarks for resources consumption, waste production, environmental impacts, and running costs of healthcare buildings, according to each particular healthcare building established group;
Identify healthcare buildings where the best practices exist, i.e., those where the resources consumption, associated costs and waste production are smaller;
Discuss how designers, promoters, and managers of healthcare buildings can use the outcomes of this research in the process of designing more sustainable healthcare buildings.
2. Methodology for Data Collection and Processing
This research is targeted at healthcare buildings. This is considered to be a building sector with reasonably homogeneous building needs at the level of both occupancy and activities. Given that, the first step of data analysis is to define the different groups, based on the identification of the variable that has more direct connection with the parameter that most influences the global sustainability of a healthcare building, namely energy consumption. This is not a perfect approach since “borderline” institutions (where performance is between two groups) can be penalized, but it makes it possible to compare similar institutions.
In this chapter the steps of the methodology developed are going to be presented. They are:
2.1. Collection and Processing of Data
The proposed benchmarking method is based on the collection and statistical analysis of data from the Portuguese healthcare building stock. The method considers data from a complete year and, according to the latest data available when writing this study, the year of 2012 was chosen.
In applying this method to the Portuguese context, only public and public/private partnerships healthcare buildings were considered.
Before beginning the data collection, the method started with preliminary contacts with some hospital administrations. This preliminary step is recommended in other studies, such as Stapenhurst [
6] and is aimed at:
Evaluating the expectations of the hospital administrations regarding the benchmarking study;
Identifying potential barriers that can hinder the normal development of this study;
Catching up the hospital administrations’ commitment to make the necessary data available.
In order to obtain the necessary data, the Portuguese Health Administrations, namely the North Health Regional Administration and the Central Administration of Health Services were contacted. From them, it was possible to obtain data related to the “Strategic Plan of Low Carbon” (PBEC) and the “Energetic Efficiency Program of the Public Administration” (ECO-AP). The main goal of this last program is to achieve an increase in energy efficiency of about 30% until 2020, in all services of Portuguese public administration, in which healthcare buildings are included. The accuracy and completeness of the used data is the responsibility of the reporting organizations. From the ECO-AP program database it was possible to obtain the necessary data to carry out this study, namely:
Net and gross floor area of each building;
Water consumption;
Electricity consumption (total, including active and reactive power);
Gas consumption;
Waste production.
From the database, 55 similar hospital units were selected (51 public hospitals and four public/private partnerships). They are similar in the following aspects: number of health services; required social responsibilities; and mean annual number of patients.
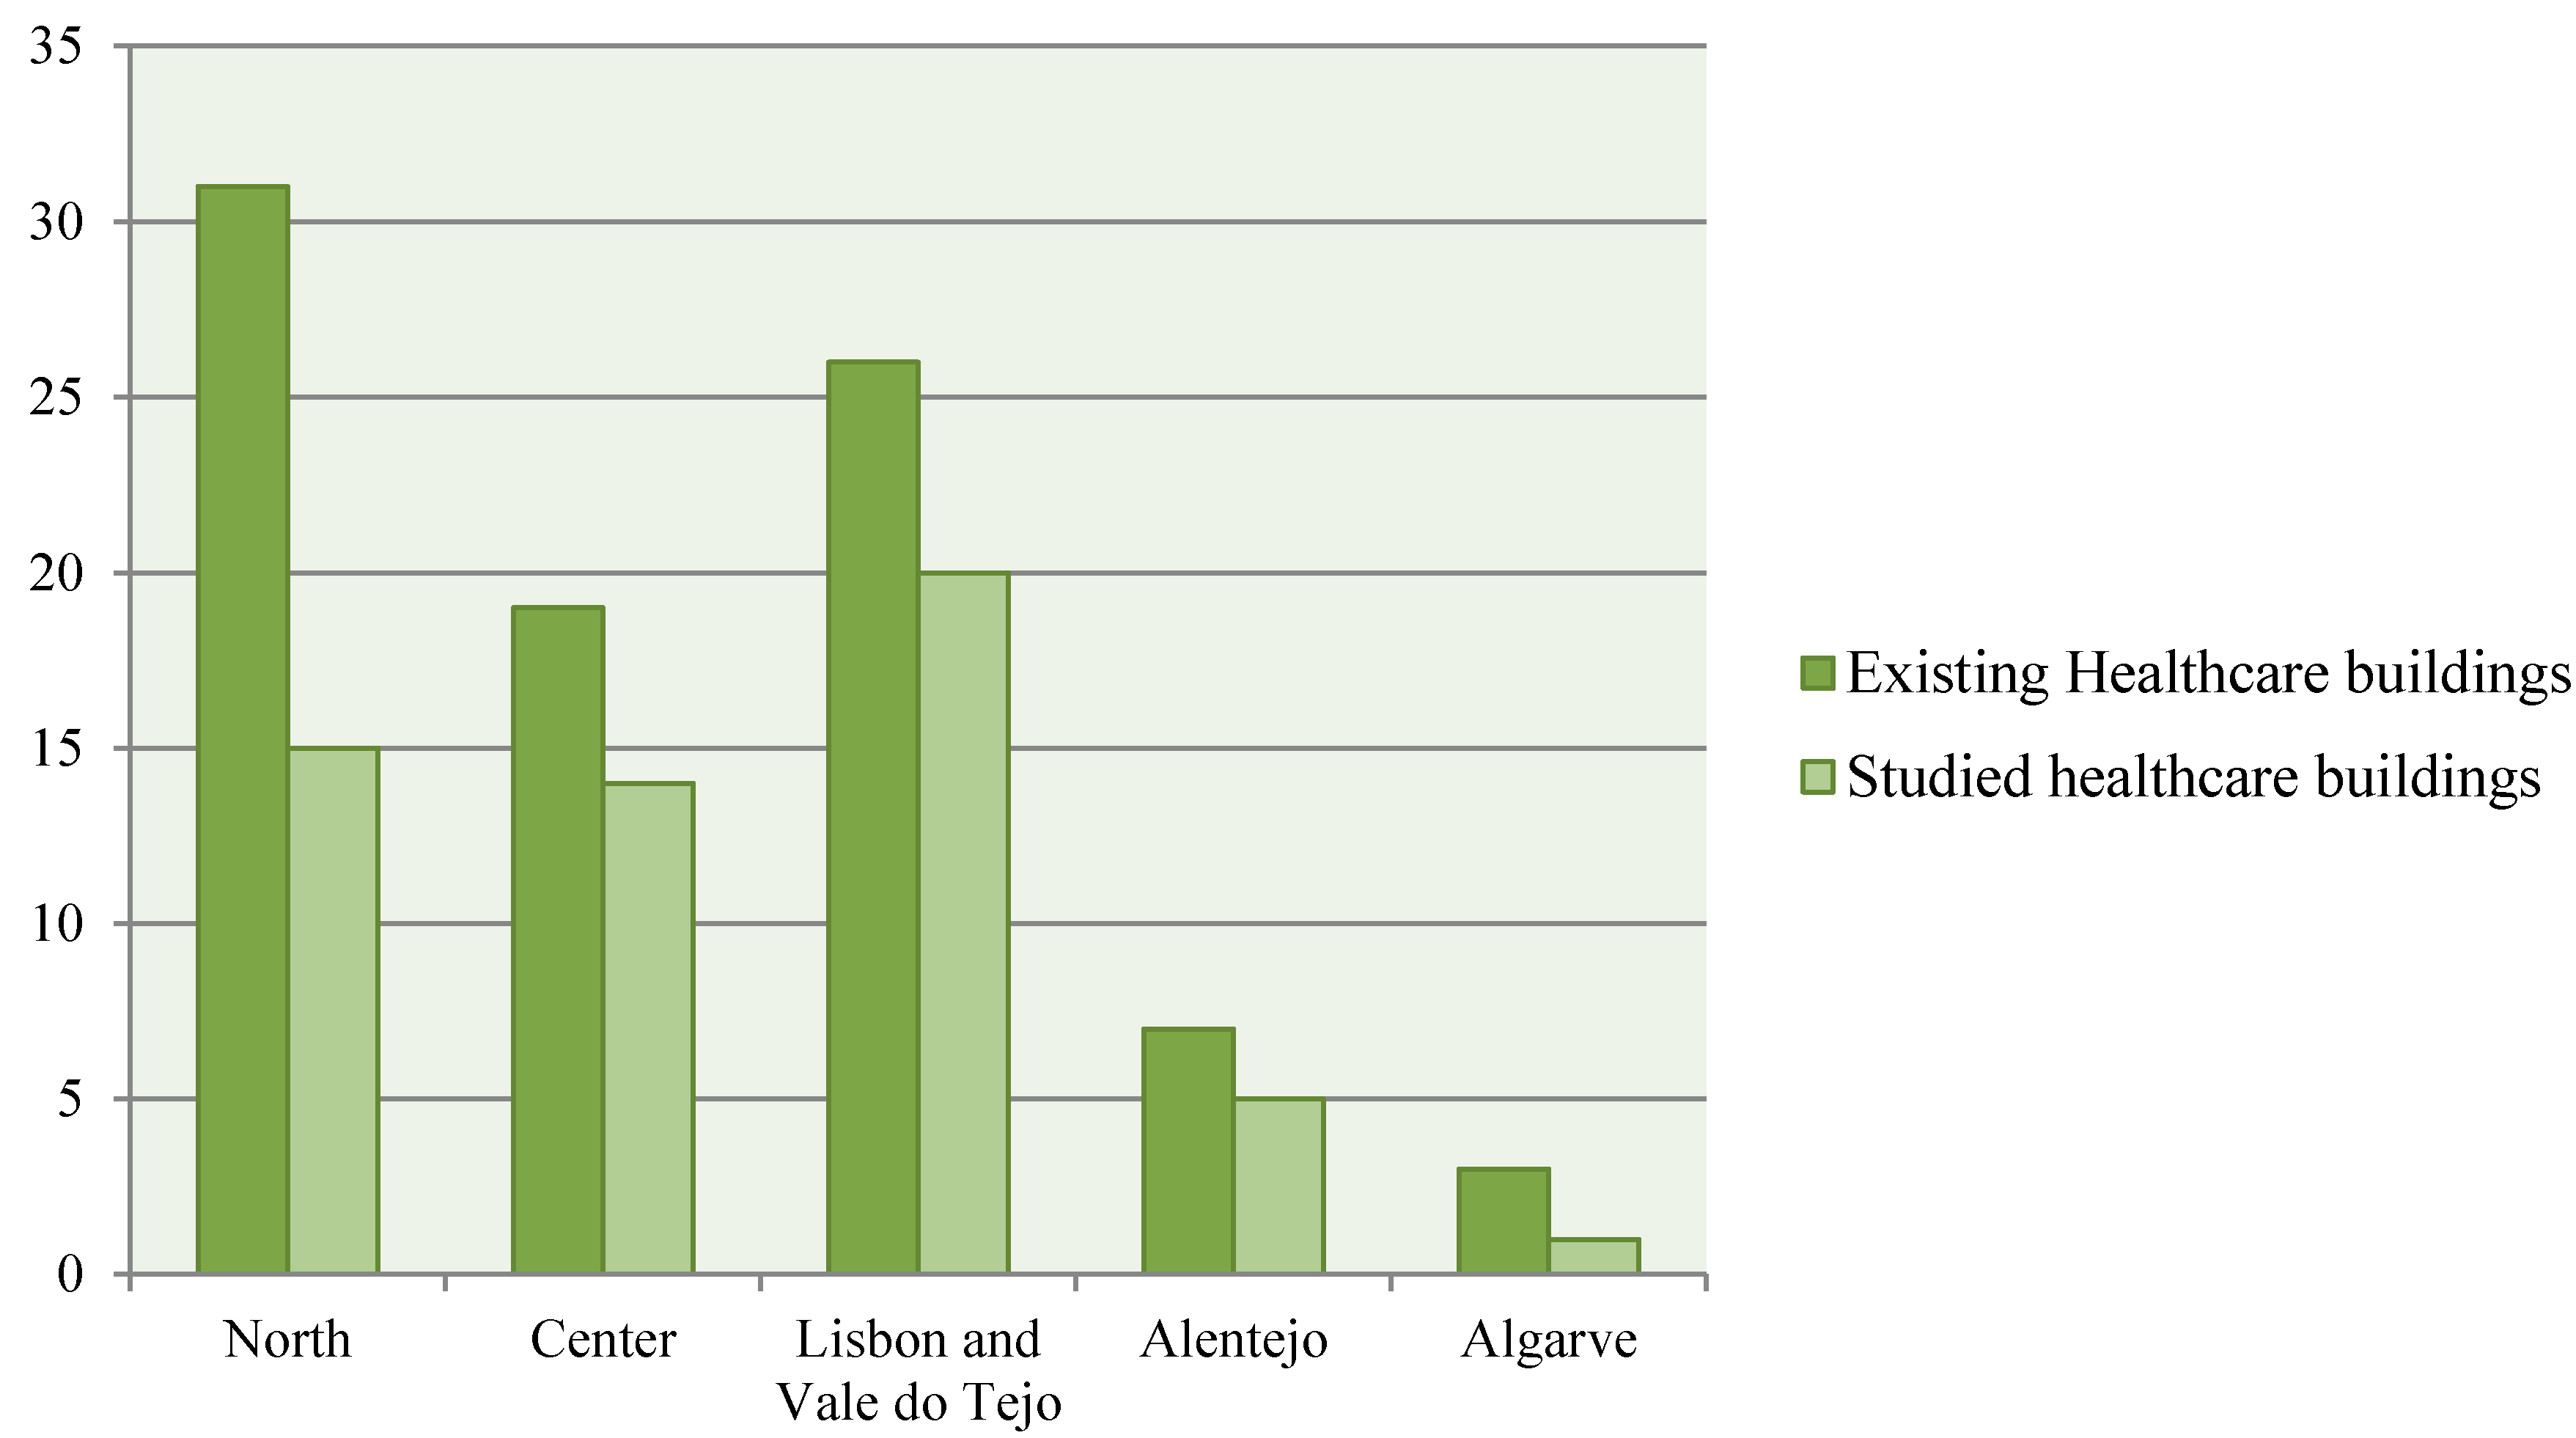
The hospitals studied are located in different regions of mainland Portugal and, as presented in
Figure 3, they are a representative sample of all existing healthcare buildings in the country.
For this study no hospital names will be revealed, and therefore each of these units will be labeled as H1 to H55.
Figure 3.
Comparison of the number of healthcare buildings in the study and the total number of existing healthcare buildings per region.
Figure 3.
Comparison of the number of healthcare buildings in the study and the total number of existing healthcare buildings per region.
2.2. Grouping of Data
After the process of data collection, it is necessary to group the data in order to establish benchmarks for hospitals with comparable characteristics. In order to obtain more information about each selected healthcare building, such as the number of beds, year of construction, and geographical area covered, the information available in each hospital’s website as well as in the Health Portal and in the Central Administration of Health Services was used [
25,
26]. In the case of the geographical area covered, it was necessary to make use of the 2011 census, provided by the National Institute of Statistics [
27].
After the data analysis, it was shown that the increase of net floor area is proportional to the increase of resources consumption and costs. This does not happen for example, with the number of beds parameter. For the same number of beds, the resources consumption and consequently the related costs are very distinct between hospitals, as it is possible to conclude from the analysis of
Table 1.
The parameter of geographical area covered was not used due to the fact that some bigger and more important hospitals receive patients from outside their area and therefore the running costs of these units would be higher when compared with less important hospitals. The year of construction was also discarded since it was not possible to obtain the construction and/or the renewable dates of all healthcare units.
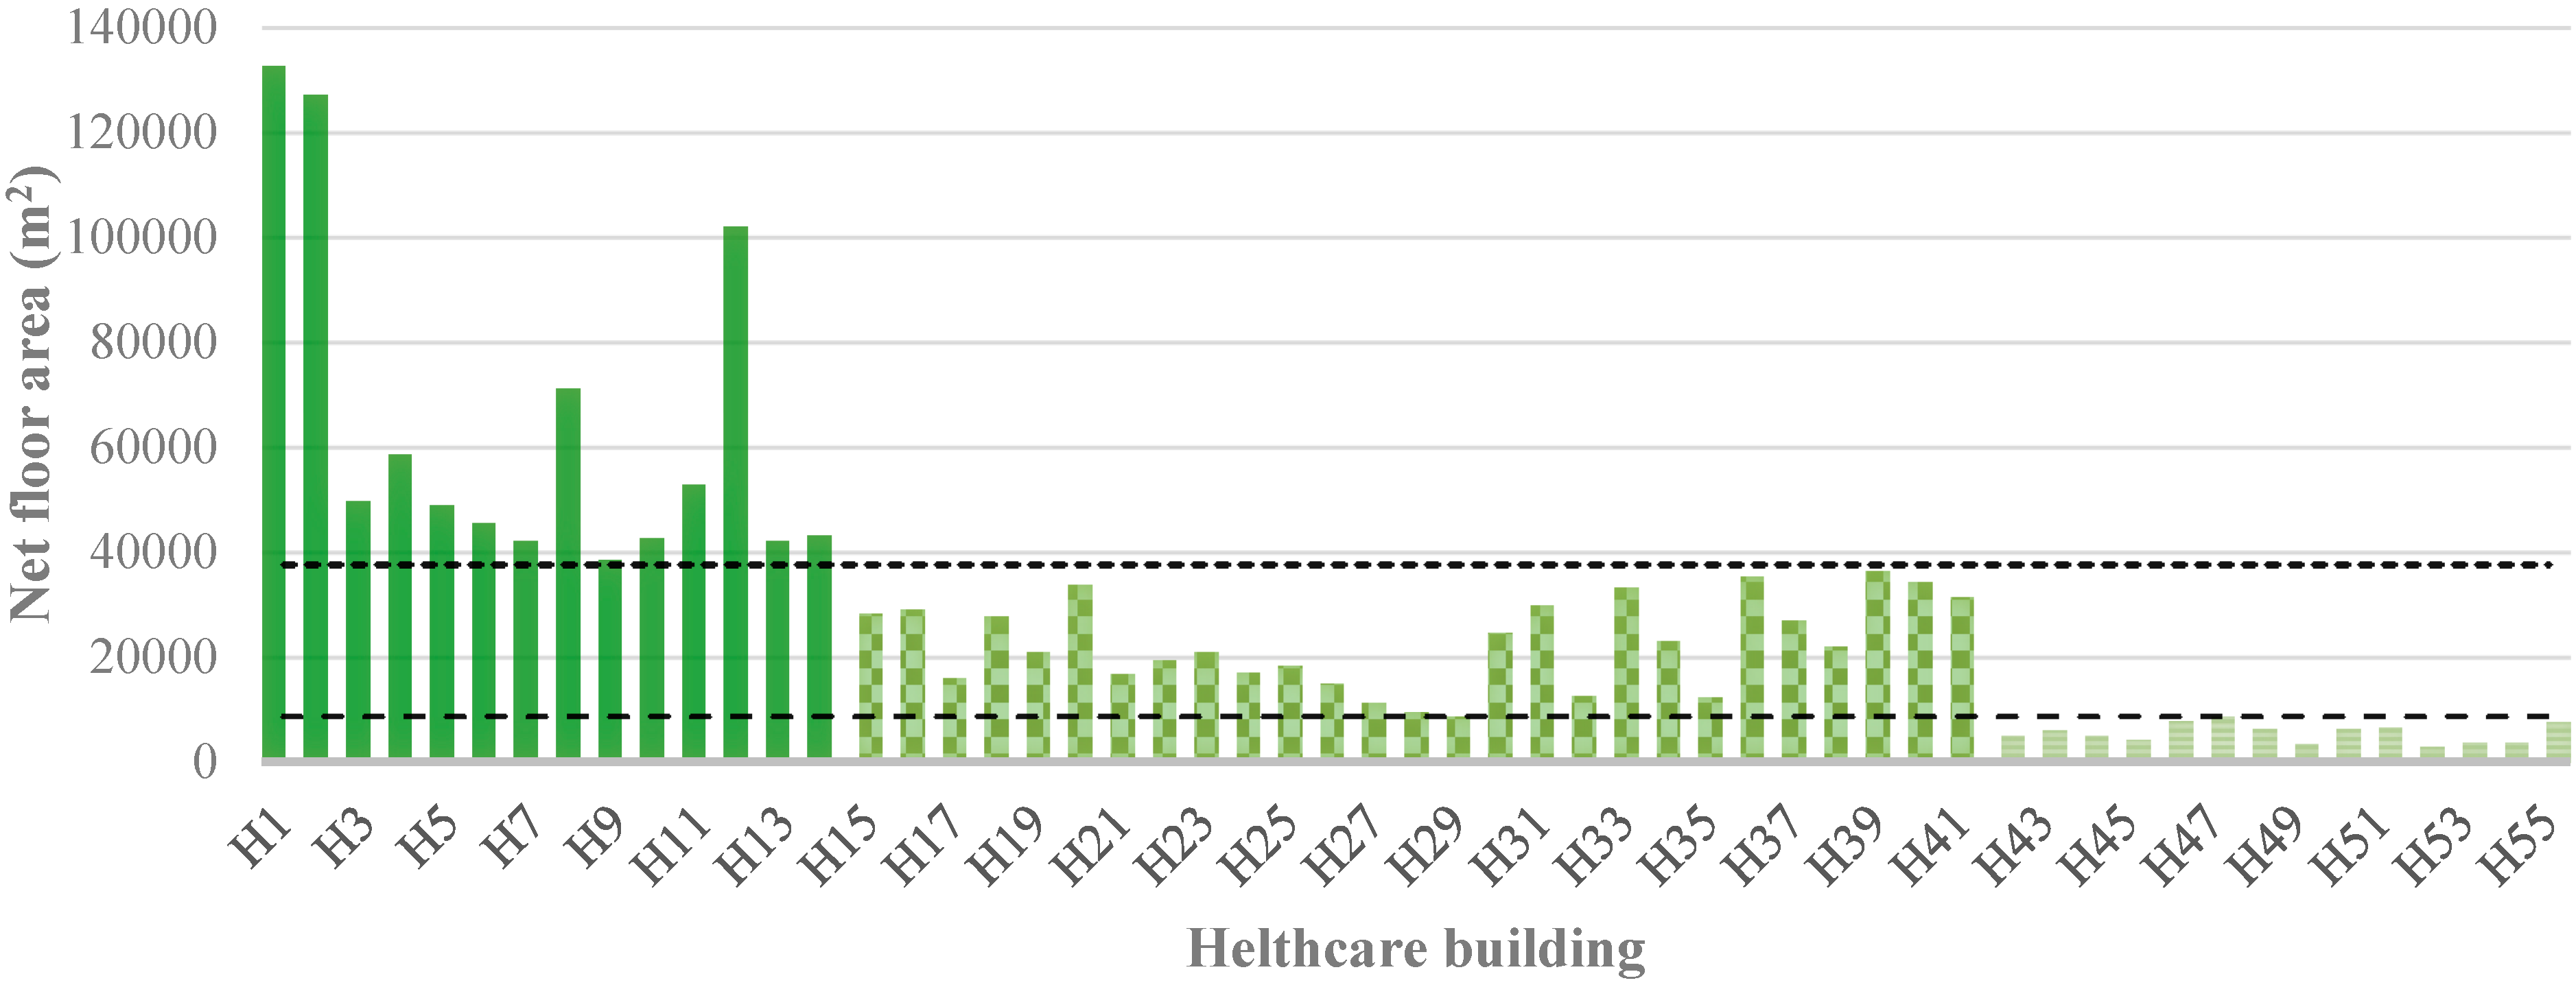
The grouping of healthcare units was then made by the use of quartiles of net floor area. Thus it was possible to define three distinct groups of hospitals for the development of benchmarks:
Group I—healthcare buildings with net floor area higher than 37,663.00 m2 (3rd quartile);
Group II—healthcare buildings with net floor area comprised between 8807.00 m2 and 37,663.00 m2 (2nd quartile);
Group III—healthcare buildings with net floor area lower than 8807.00 m2 (1st quartile).
Table 1.
Comparison between the annual data of some hospitals with similar number of beds.
Table 1.
Comparison between the annual data of some hospitals with similar number of beds.
| Hospital | Number of Beds | Net Floor Area | Water (Consumption and Cost) | Energy (Consumption and Cost) | Waste (Production and Cost) |
|---|
| H8 | 401 | 71,245 m2 | 277,591 m3 | 74,053,827 kWh | 631,000 kWh |
| €644,221.30 | €2,411,188.13 | €444,900.00 |
| H36 | 400 | 35,565 m2 | 101,403 m3 | 18,920,061 kWh | 303,000 kg |
| €234,293.12 | €1,054,816.01 | €263,589.00 |
| H28 | 111 | 9468 m2 | 31,432 m3 | 8,130,130 kWh | 33,707 kWh |
| €275,798.51 | €1,262,536.63 | €73,871.82 |
| H43 | 106 | 6266 m2 | 21,042 m3 | 8,621,822 kWh | 16,973 kWh |
| €72,485.84 | €376,942.65 | €10,668.19 |
| H15 | 306 | 28,281 m2 | 59,492 m3 | 17,272,746 kWh | 957,677 kWh |
| €299,999.17 | €1,228,122.75 | €184,91410 |
| H37 | 303 | 27,088 m2 | 66,799 m3 | 13,889,877 kWh | 258,170 kWh |
| €157,158.34 | €759,568.93 | €269,118.98 |
Figure 4 presents the organization of the considered 55 hospitals considered within the three different groups, based on the net floor area parameter.
Figure 4.
Division by groups of the Portuguese healthcare buildings in study.
Figure 4.
Division by groups of the Portuguese healthcare buildings in study.
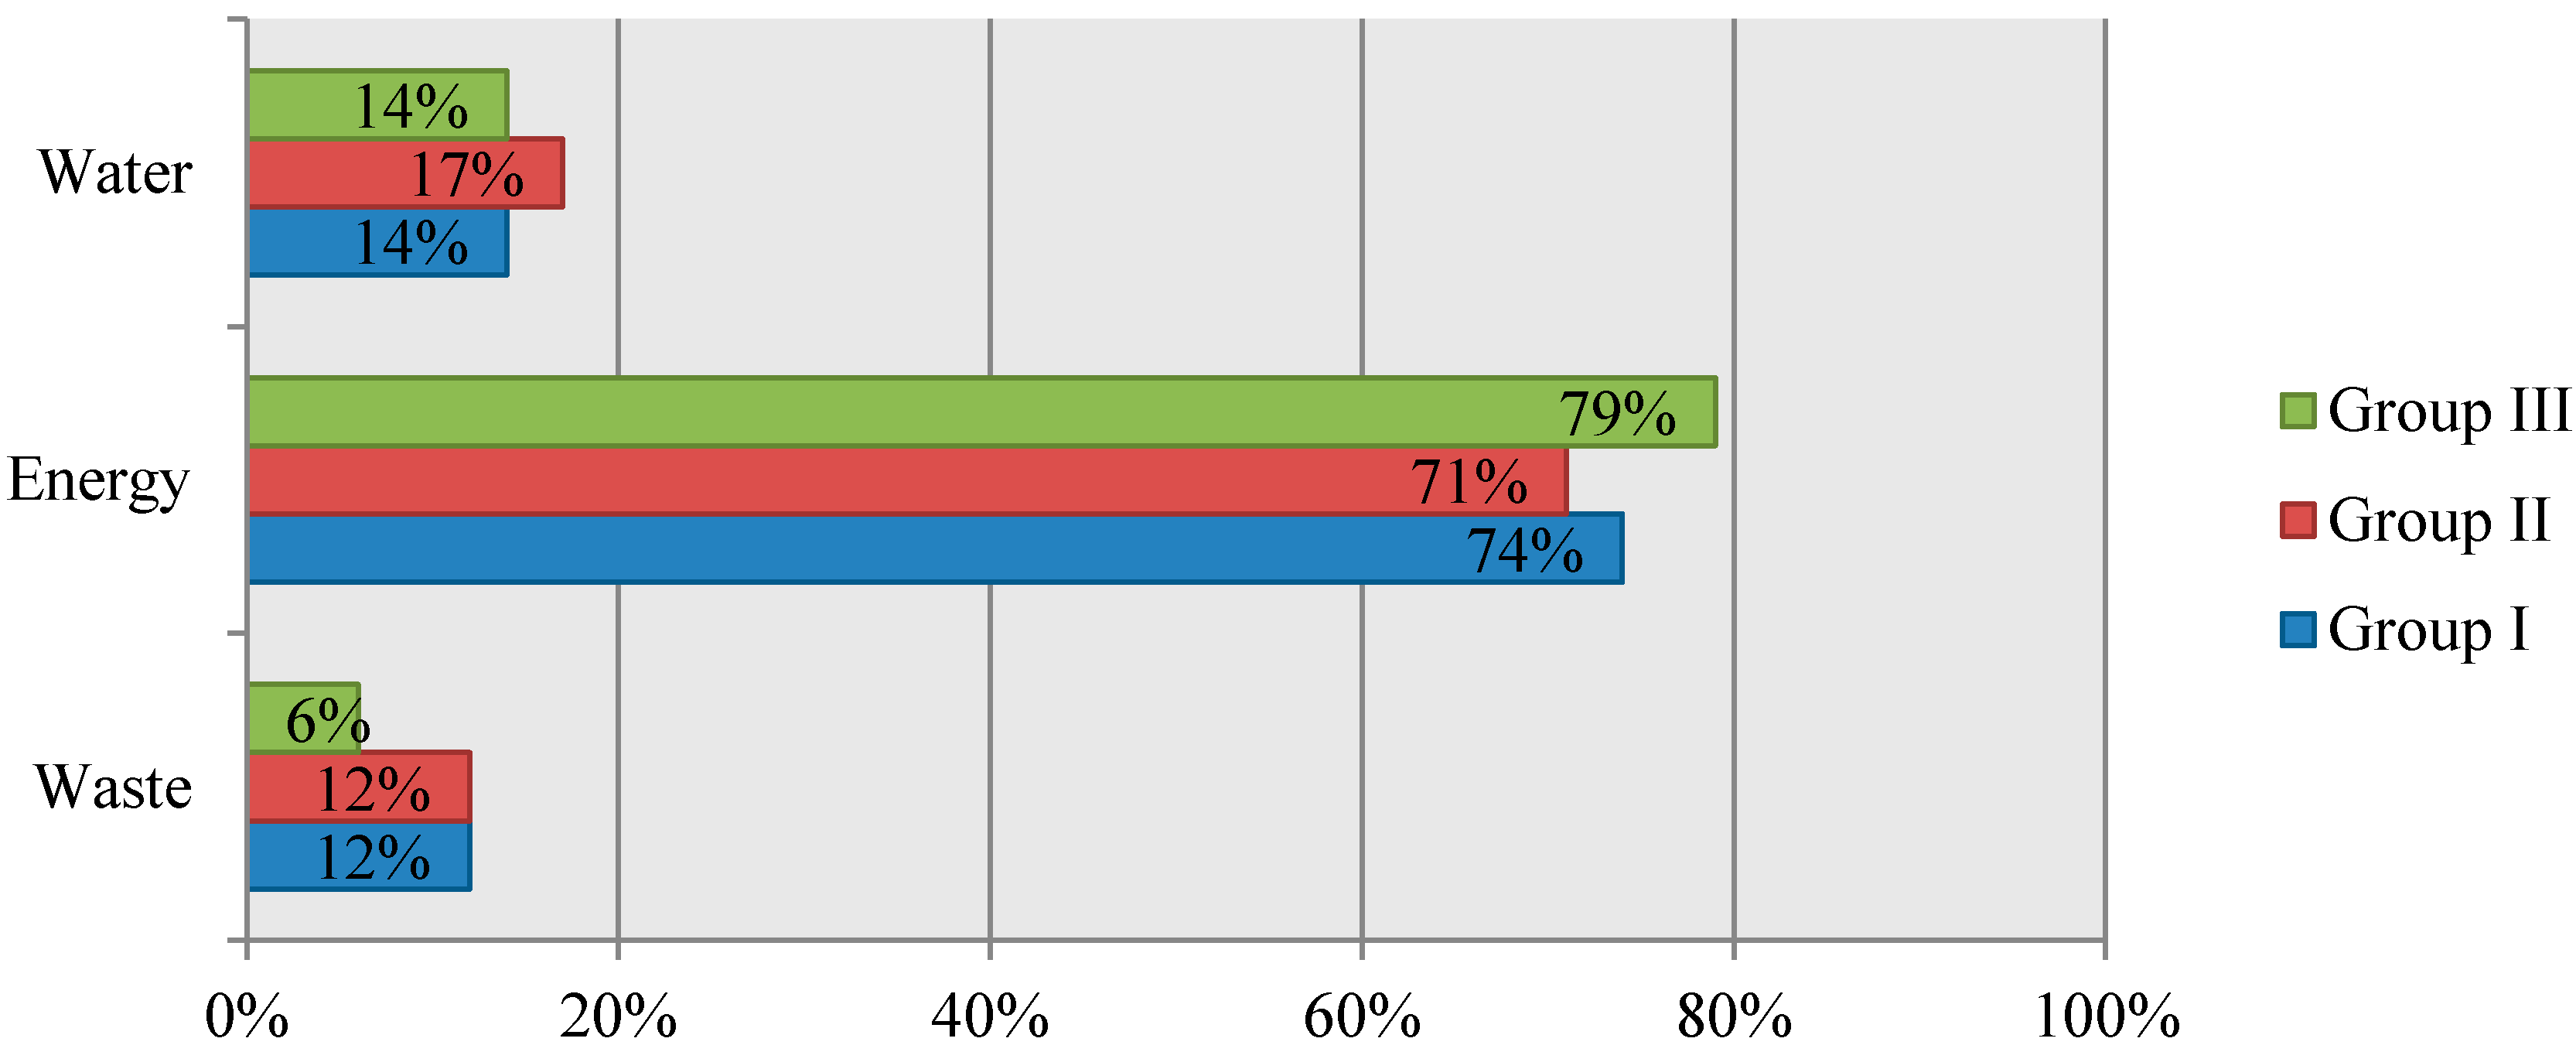
By analyzing also the operational costs considered in this study (cost related to water consumption, energy consumption and waste production), it is possible to verify that the two resources with the highest influence on the total costs are electricity and gas, as presented in
Figure 5.
2.3. Conversion of Resources Consumptions into Environmental Impacts
Another goal of this research is to develop the benchmarks for the operational environmental impacts of healthcare buildings, namely the impacts related to the energy and water. For this purpose the resources consumptions of resources was converted into environmental impacts.
Figure 5.
Influence of resource consumption costs in each group of healthcare buildings (costs per m2).
Figure 5.
Influence of resource consumption costs in each group of healthcare buildings (costs per m2).
The environmental performance assessment is based on the following six impact categories: (i) global warming; (ii) ozone depletion; (iii) acidification for soil and water; (iv) eutrophication; (v) photochemical ozone creation; (vi) depletion of abiotic resources-elements, and (vii) depletion of abiotic resources-fossil fuels. Therefore, this study produces benchmarks for the operational environmental impacts, according to the list of the impact categories present in the “EN15804: 2012—Sustainability of construction works” [
28].
Table 2 presents the considered indicators that describe the environmental impact categories.
Table 2.
Considered environmental indicators, units, and quantification methods.
Table 2.
Considered environmental indicators, units, and quantification methods.
| Environmental Indicators | Units | Methods |
|---|
| Global warming potential (GWP) | (Kg CO2 equiv.) | CML-IA V3.0.2 |
| Depletion of the stratospheric ozone layer (ODP) | (Kg CFC-11 equiv.) | CML-IA V3.0.2 |
| Acidification potential (AP) | (Kg SO2 equiv.) | CML-IA V3.0.2 |
| Eutrophication potential (EP) | (Kg PO4 equiv.) | CML-IA V3.0.2 |
| Formation potential of tropospheric ozone (POCP) | (Kg C2H4 equiv.) | CML-IA V3.0.2 |
| Abiotic depletion potential of fossil resources (ADP_FF) | (MJ) | CML-IA V3.0.2 |
| Abiotic depletion potential of elements (ADP_E) | (Kg Sb equiv.) | CML-IA V3.0.2 |
The calculation of the environmental indicators (Life Cycle Impact Assessment—LCIA) also demands specific knowledge of life cycle inventory datasets, in particular, how these are composed and what is included,
i.e., the system boundary and allocation rules are crucial [
29]. Nowadays, there is still a considerable lack of specific environmental information for the major part of the construction products,
i.e., Environmental Product Declarations (EPD). Since the development of specific environmental information for products is very time and cost consuming, initial LCIA studies, whose main goal is to compare design alternatives, are normally based on generic (average) life-cycle inventory data. For this reason, this study is based on one of the most internationally-accepted generic life cycle inventory databases, the Ecoinvent report V3.0 [
30]. This database covers the average inventory flows of the main building materials in different regional contexts. The Portuguese context, namely energy mix, was considered in the study and only the active electric energy was considered in the assessment of the environmental impacts.
Another important source of energy in hospitals is gas, both natural and propane, and this is used mainly for heating purposes. Natural gas is consumed in most hospitals and just six healthcare buildings consume only propane gas. There are also some buildings that consume both types of gas. In the calculation of the gas related environmental impacts, it was considered that the gas is burned in condensing boilers, since this is conventional practice. For natural gas, the impacts related to the transportation in the distribution network are also considered. In the case of the propane gas, it is assumed that this is transported by road, from the nearest Portuguese refinery to the hospital.
In this context, gas and active electric energy were taken together in this study to quantify the primary energy consumption benchmarks. This is because gas and electricity can be used for different purposes in different buildings. For example there are buildings that only use electricity in the control of the indoor temperatures and others that use gas for heating and electricity for cooling. Therefore, rather than creating benchmarks for electricity and gas consumption, it is much more reasonable to develop benchmarks for the total energy consumption.
To take electricity and gas consumption together it is necessary to convert Delivered Energy (DE) into Primary Energy (PE). In this conversion, the methodology of the Portuguese thermal regulation was used, namely the energy efficiency indicators (EEI) defined for office buildings both in Ministerial Dispatch n° 15793-D/2013 [
31] and Decree-Law n° 118/2013 [
32]. In this process, the following Equation (1) is used:
In this equation, DEE is the delivered electricity energy and DEG is the delivered gas energy. FpuE and FpuG are the energy efficiency conversion indicators for electricity and gas, respectively. In Portugal the following energy efficiency conversion indicators are used: (i) FpuE = 2.5 kWhPE/kWh, regardless of the source (renewable or non-renewable); and (ii) FpuG = 1 kWhEP/kWh for solid, liquid, and gaseous non-renewable fuels.
Regarding water consumption, the inputs and outputs related to its treatment, losses in the delivery network and both construction and maintenance impacts were considered, using the inventory of the Ecoinvent report V3.0.
The LCI data was converted into environmental impact categories using the LCIA method presented in
Table 2: V3.0.2 [
33].
In order to facilitate the life cycle impact assessment, a life-cycle analysis software (SimaPro 8) [
34] was used to model the operation phase of the case studies and to assess the abovementioned life-cycle impact categories.
3. Development of Benchmarks for Portuguese Healthcare Buildings
For each of the three groups of healthcare buildings previously defined, benchmarks for building operation costs, resources consumption, waste production, and operational environmental impacts were developed.
The methodology used to establish the “best” and “conventional” benchmarks is based on the statistical analysis of the data obtained in the previous section. The method is applied for each group and therefore different benchmarks are developed for Groups I, II, and III.
The first step is to normalize the value of each parameter, according to the net floor area of each building, i.e., to divide the value of each parameter by the net floor area of the building.
Afterwards, the benchmarks are calculated applying two statistical operations: median, for the conventional practice, and first quartile (Q1)—splits off the lowest 25% of data from the highest 75%—for the best practice.
The next sections explain in detail how the benchmarks are calculated for each parameter.
3.1. Benchmarks for Building Operation Costs
The costs related to water consumption, energy consumption (electricity and gas) and waste production are considered in this method and benchmarks will be developed for each parameter.
Analyzing the costs it is possible to conclude that some healthcare buildings have discrepant operation costs, i.e., costs that are too small or too big when compared with the other values of the group (series). These discrepant values, known as outliers, can give rise to important interpretation problems in the parametric statistical analysis (e.g., means, standard deviations, correlations, and every statistic based on these). The outliers can be caused by errors in data survey or can be the result of a very specific feature in a particular building (e.g., a healthcare building that has a service that consumes much more energy than the other buildings will necessarily have a higher cost and, therefore, it will not represent the conventional practice). Therefore, the outliers must be removed from the series at the beginning of the analysis.
Removing the outliers can be based on several methods. In this study the Gauss curve [
6] method was used and the hospitals with operating costs positioned outside the established interval [μ − 3σ to μ + 3σ], where μ is the average, and σ the standard deviation, were removed from the study and not considered in the calculation of all benchmarks. As a result, in Group I one hospital was removed from the energy costs analysis. In Group II two hospitals were removed from energy costs analysis, one from water costs analysis and nine from the waste costs analysis. In Group III one hospital was removed from energy costs analysis and three from the waste costs analysis. Due to the lack of available data, the waste cost analysis is the parameter where the largest number of hospitals was removed.
The “conventional practice” benchmark is the median of the remaining values of each series and therefore is the midpoint of the final Gauss curve. Compared to the statistical average, the median is a value or quantity lying at the midpoint of a frequency distribution of observed values or quantities and, therefore, there is an equal probability of falling above or below it.
The “best practice” is the upper limit of the first quartile, which means the boundary of the 25% lowest values.
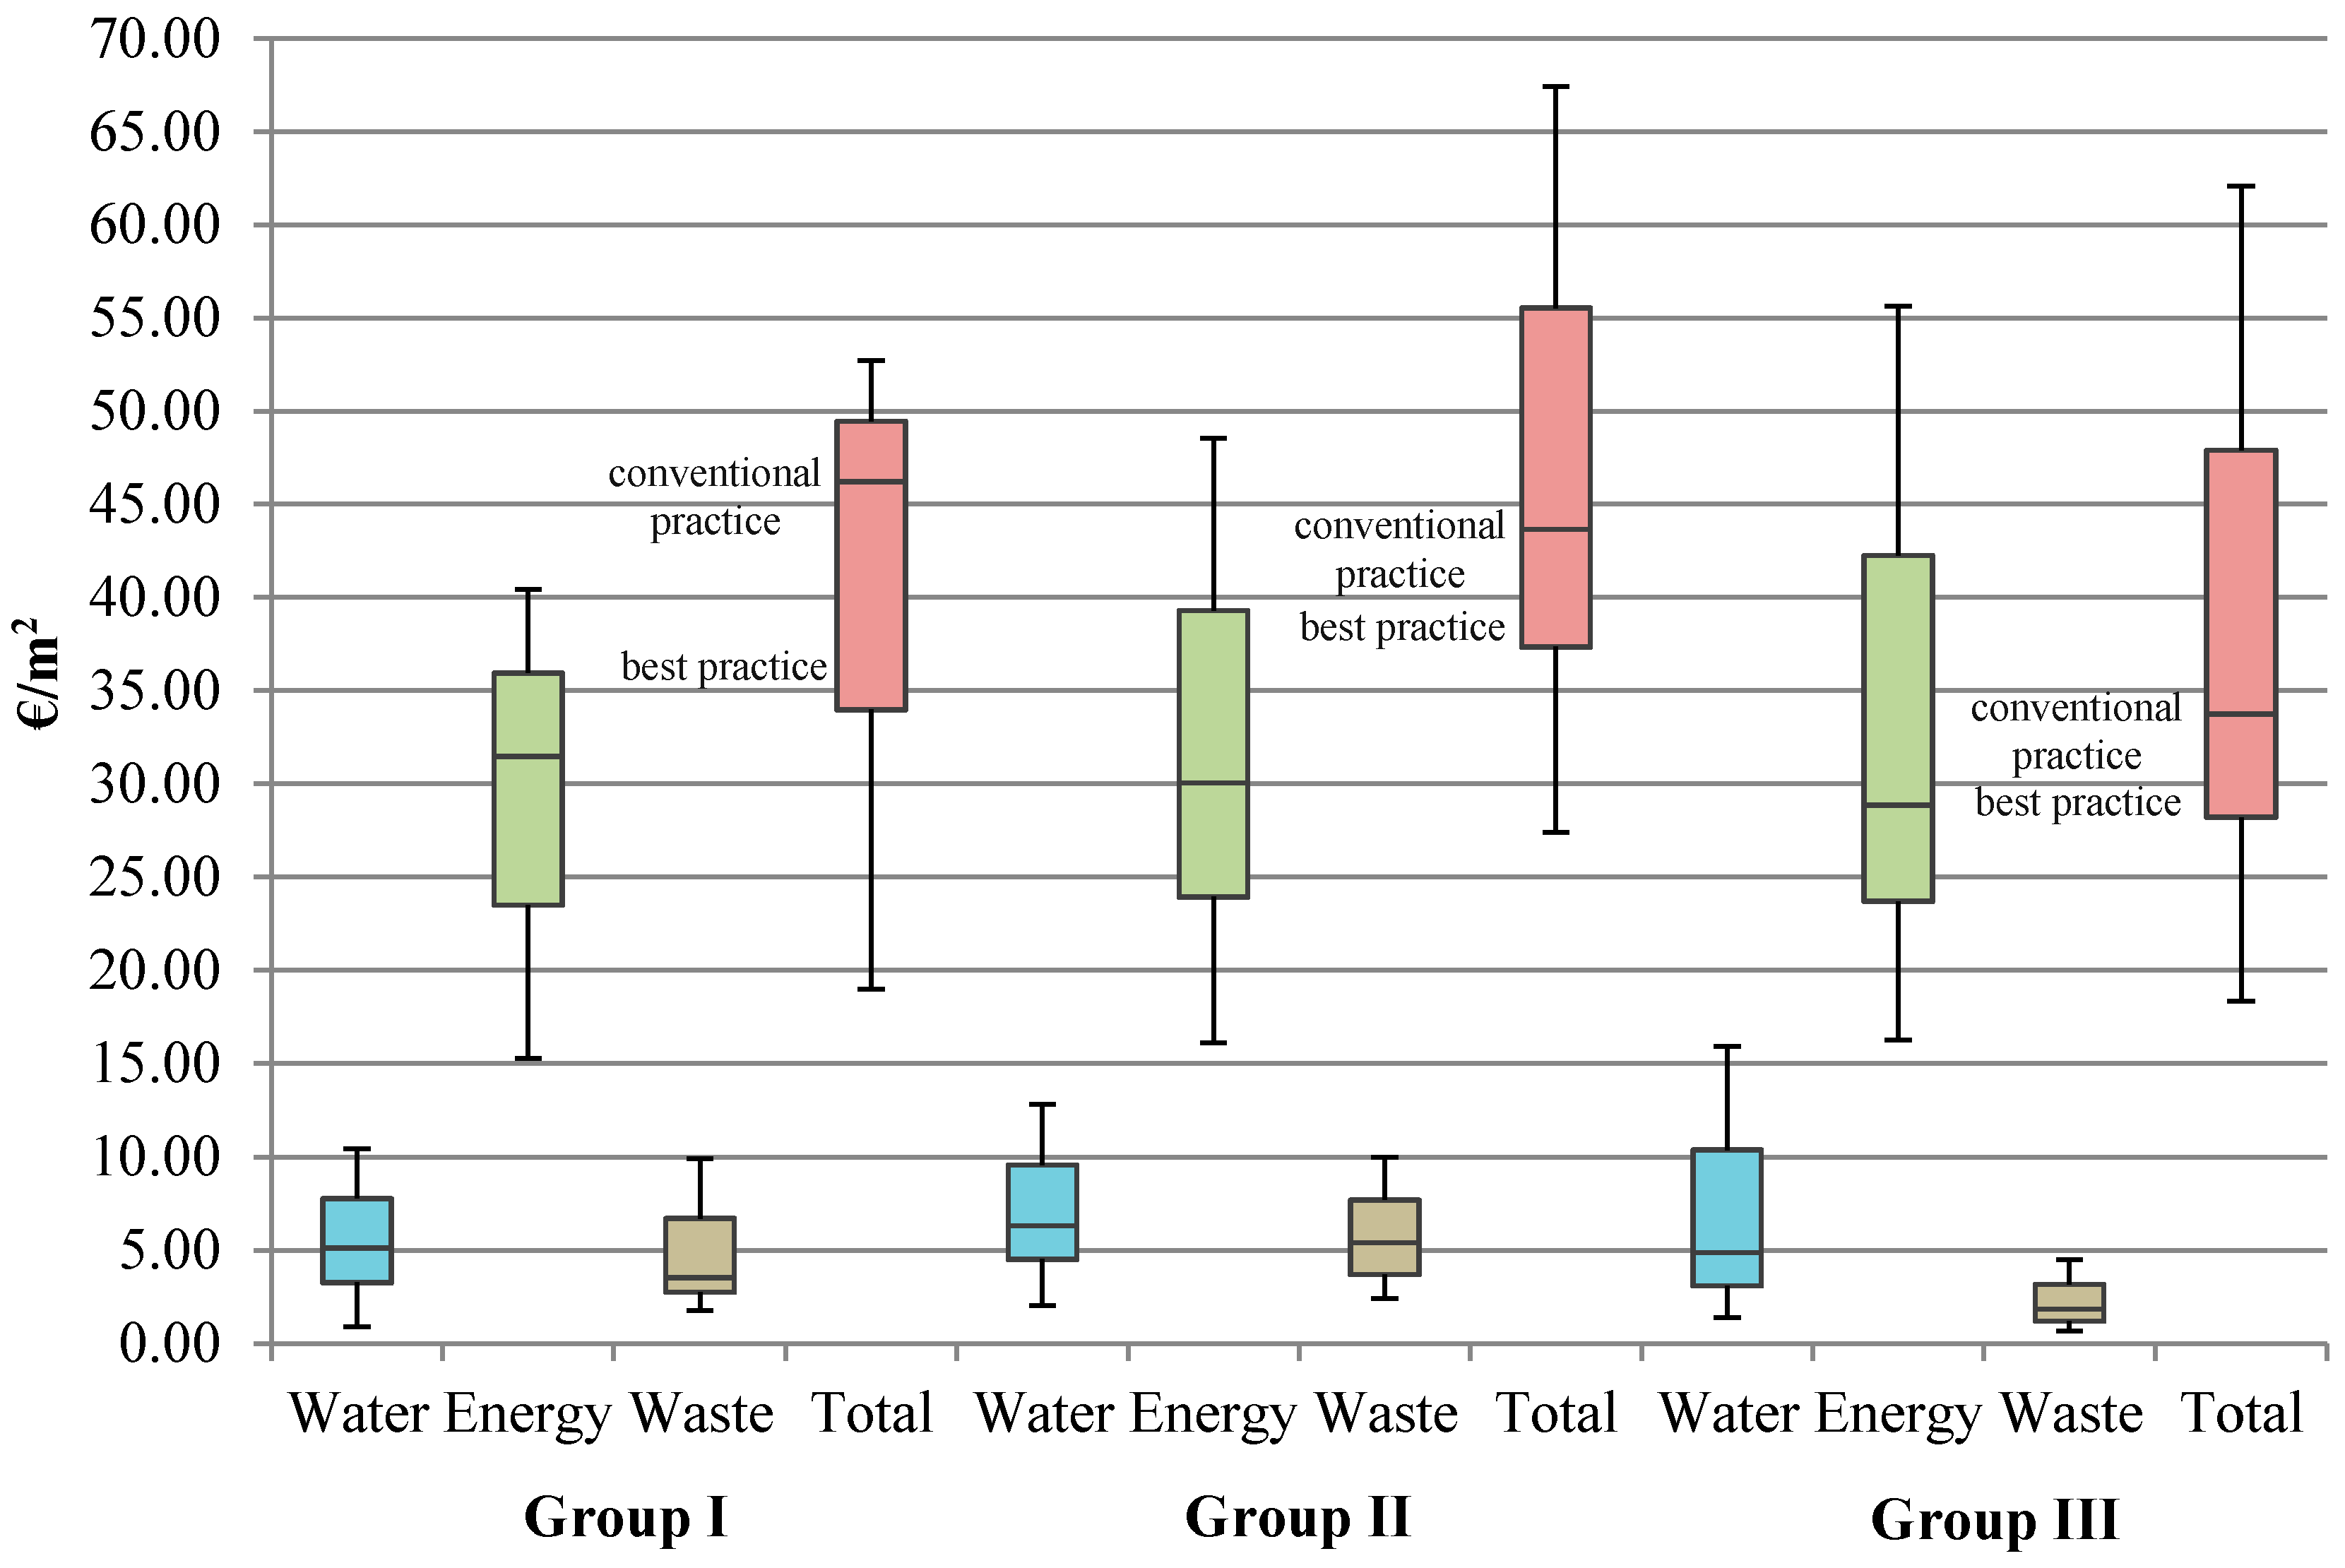
A summary of the “best practice” and “conventional practice” is presented in
Figure 6. It presents the figures for each group of healthcare buildings and the benchmarks for each studied parameter (water, energy and waste).
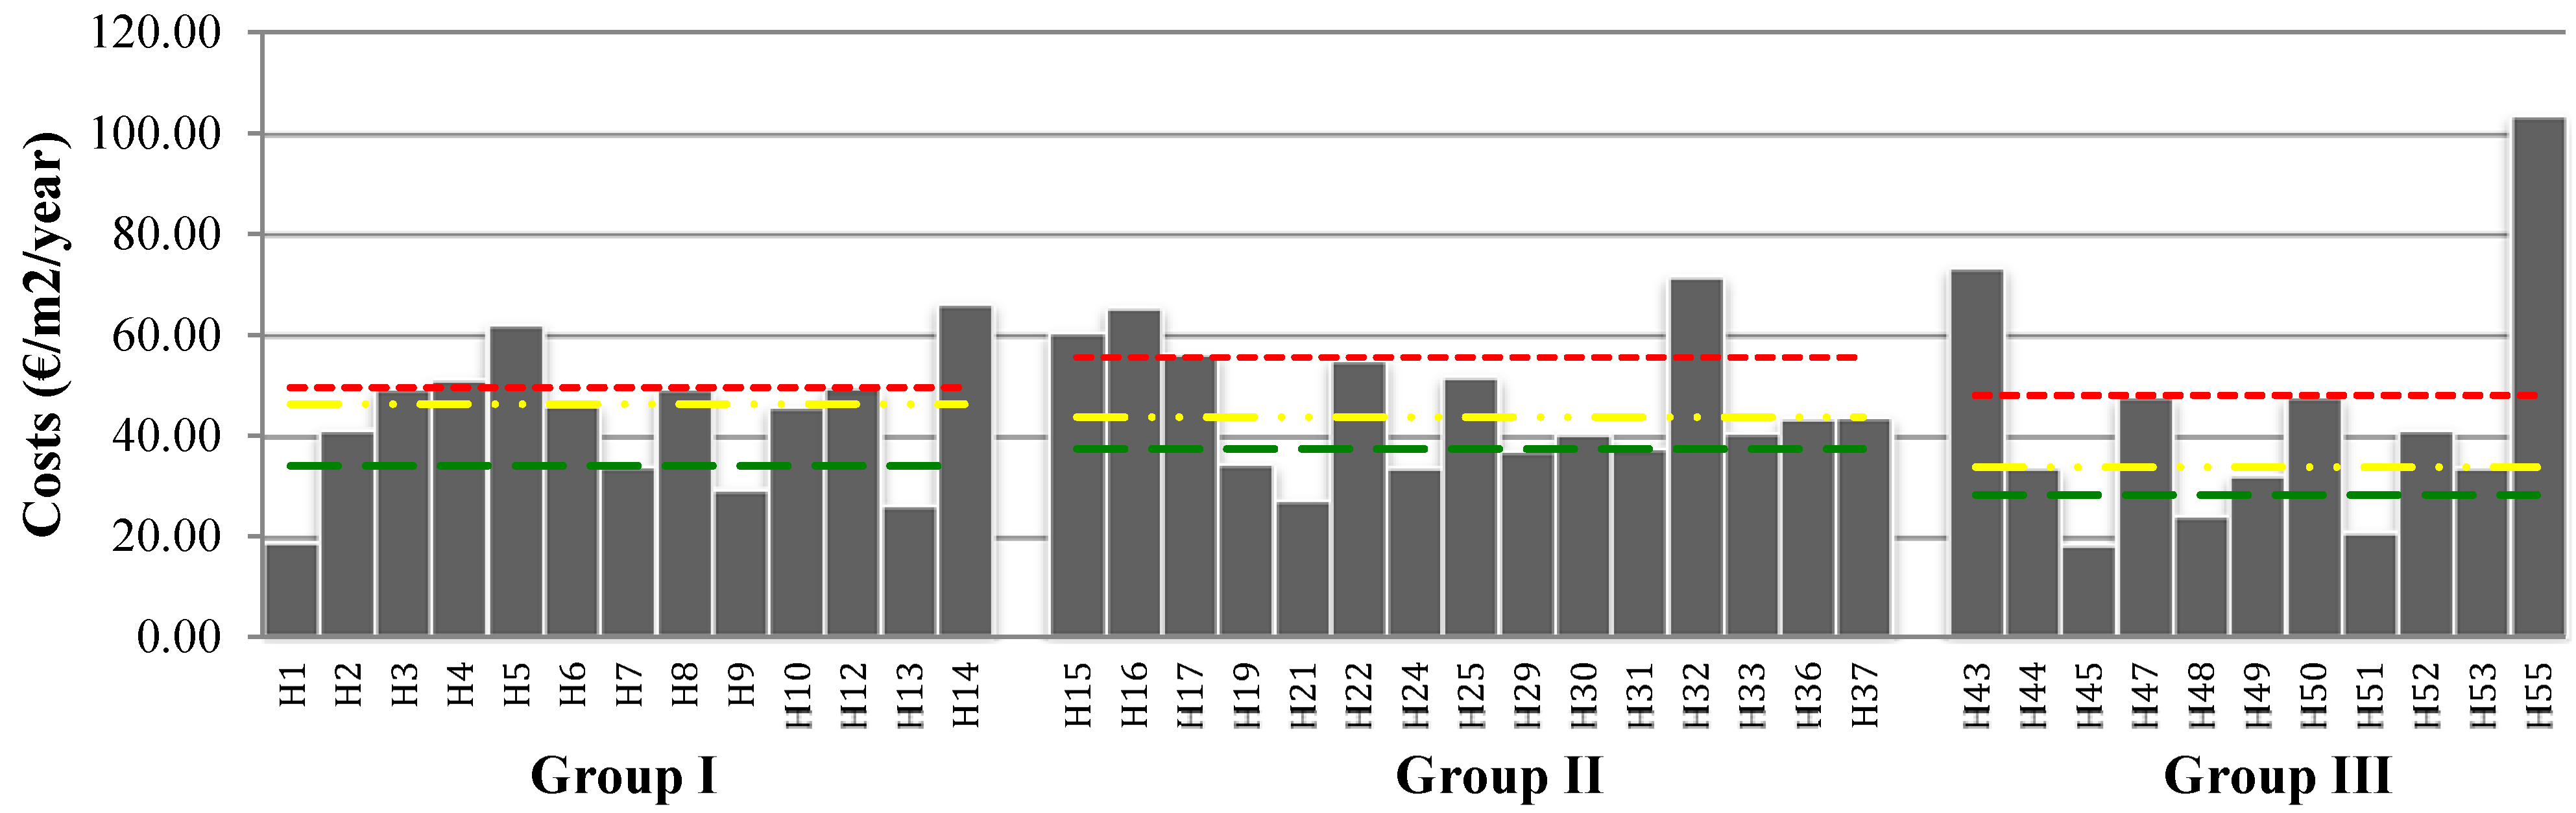
The following
Figure 7 presents, for each hospital and related group, a summary of total operation costs per m
2 of net floor area. The green line represents the benchmark of “best practice”, the “conventional practice” is represented with the yellow line and the red line represents the “worst practice”. The “worst practice” is the lower limit of the third quartile, which means the boundary of the 75% highest values.
Figure 6.
Summary of the “best practice” and “conventional practice” for the operation costs of all studied parameters.
Figure 6.
Summary of the “best practice” and “conventional practice” for the operation costs of all studied parameters.
Figure 7.
Total costs of water and energy consumption and waste per m2 in Portuguese healthcare buildings.
Figure 7.
Total costs of water and energy consumption and waste per m2 in Portuguese healthcare buildings.
Figure 7 allows an easy comparison between the costs of all healthcare buildings in study. Regarding
Figure 6, it can be seen that, for example in Group I, H1, H7, H9, and H13 are healthcare buildings with costs lower or equal to “best practice” (€33.97/m
2). In other words, it means that these buildings are, in Group I, the ones with higher costs efficiency. On the other hand,
i.e., the healthcare buildings with costs equal or superior to the “worst practice” (€4.46/m
2) are H4, H5, and H14.
3.2. Benchmarks for Consumption of Resources and Waste Production
The consumption of resources (energy and water), and waste production were considered in this study and therefore benchmarks for each of these parameters will be presented. In this process, the same method applied in the analysis of the operation costs was used.
As an example,
Table 3 presents the process to set the benchmarks for water consumption per m
2 of Portuguese healthcare buildings studied in Group I. Orange color highlights the same or lower than the corresponding values to the rate that was calculated for the “best practice”.
Table 3.
Benchmarking process for water consumption per m2 of Portuguese healthcare buildings (figures for Group I as an example).
Table 3.
Benchmarking process for water consumption per m2 of Portuguese healthcare buildings (figures for Group I as an example).
| H | Water Consumption (m3) | Net Floor Area (m2) | Water Consumption (m3/m2/year) | Standard Deviation | Average | Conventional Practice (m3/m2/year) | Best Practice (m3/m2/year) | Normal Distribution Graph |
|---|
| H1 | 98,573 | 132,850 | 0.74 | 0.84 | 1.82 | 1.87 | 1.63 | ![Sustainability 07 13222 i001]() |
| H3 | 87,911 | 46,960 | 1.87 |
| H4 | 120,304 | 58,851 | 2.04 |
| H5 | 81,616 | 48,960 | 1.67 |
| H6 | 92,139 | 45,640 | 2.02 |
| H7 | 87,393 | 42,385 | 2.06 |
| H8 | 277,591 | 71,245 | 3.90 |
| H9 | 62,942 | 38,726 | 1.63 |
| H10 | 77,223 | 42,689 | 1.81 |
| H11 | 17,005 | 53,040 | 0.32 |
| H12 | 201,725 | 102,098 | 1.98 | | | | | |
| H13 | 55,494 | 42,321 | 1.31 |
| H14 | 97,671 | 43,388 | 2.25 |
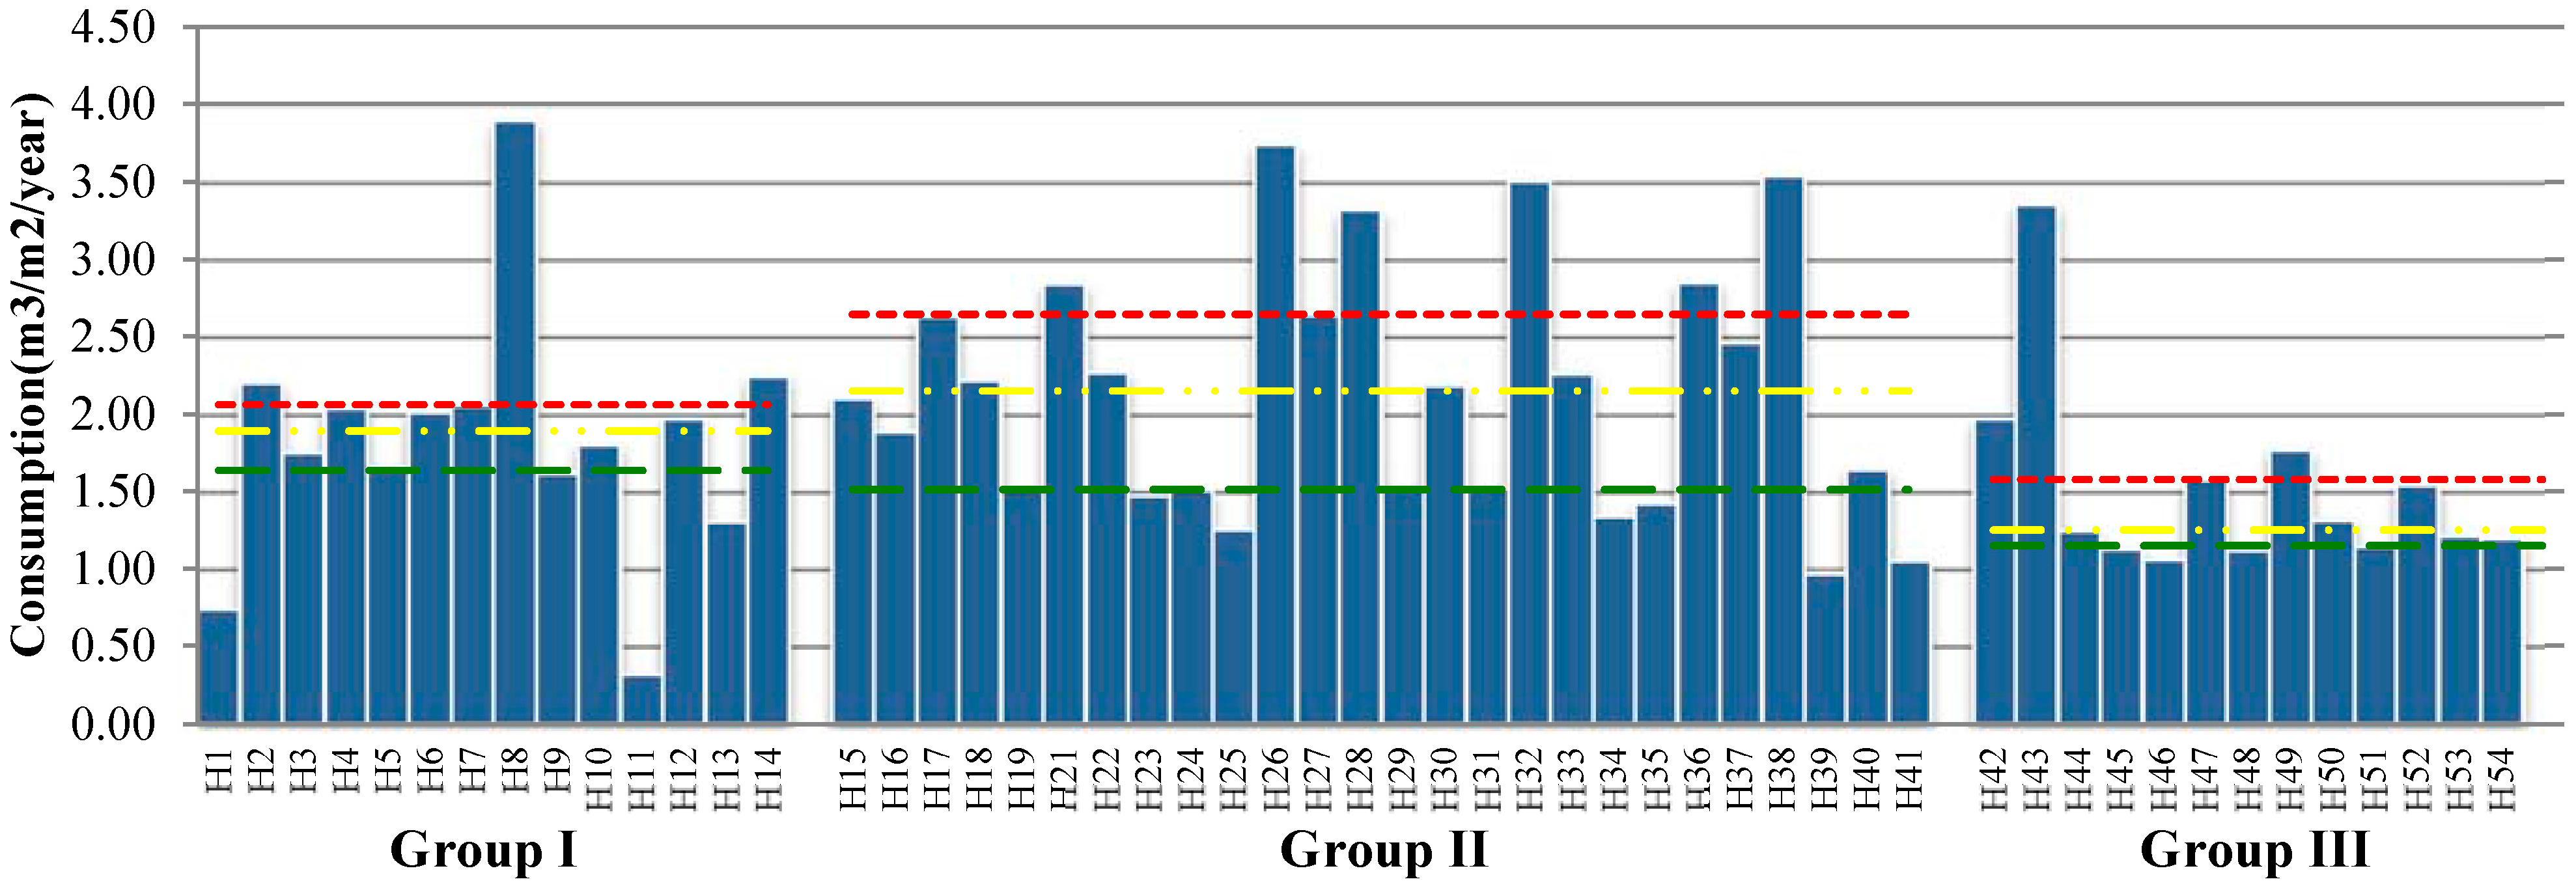
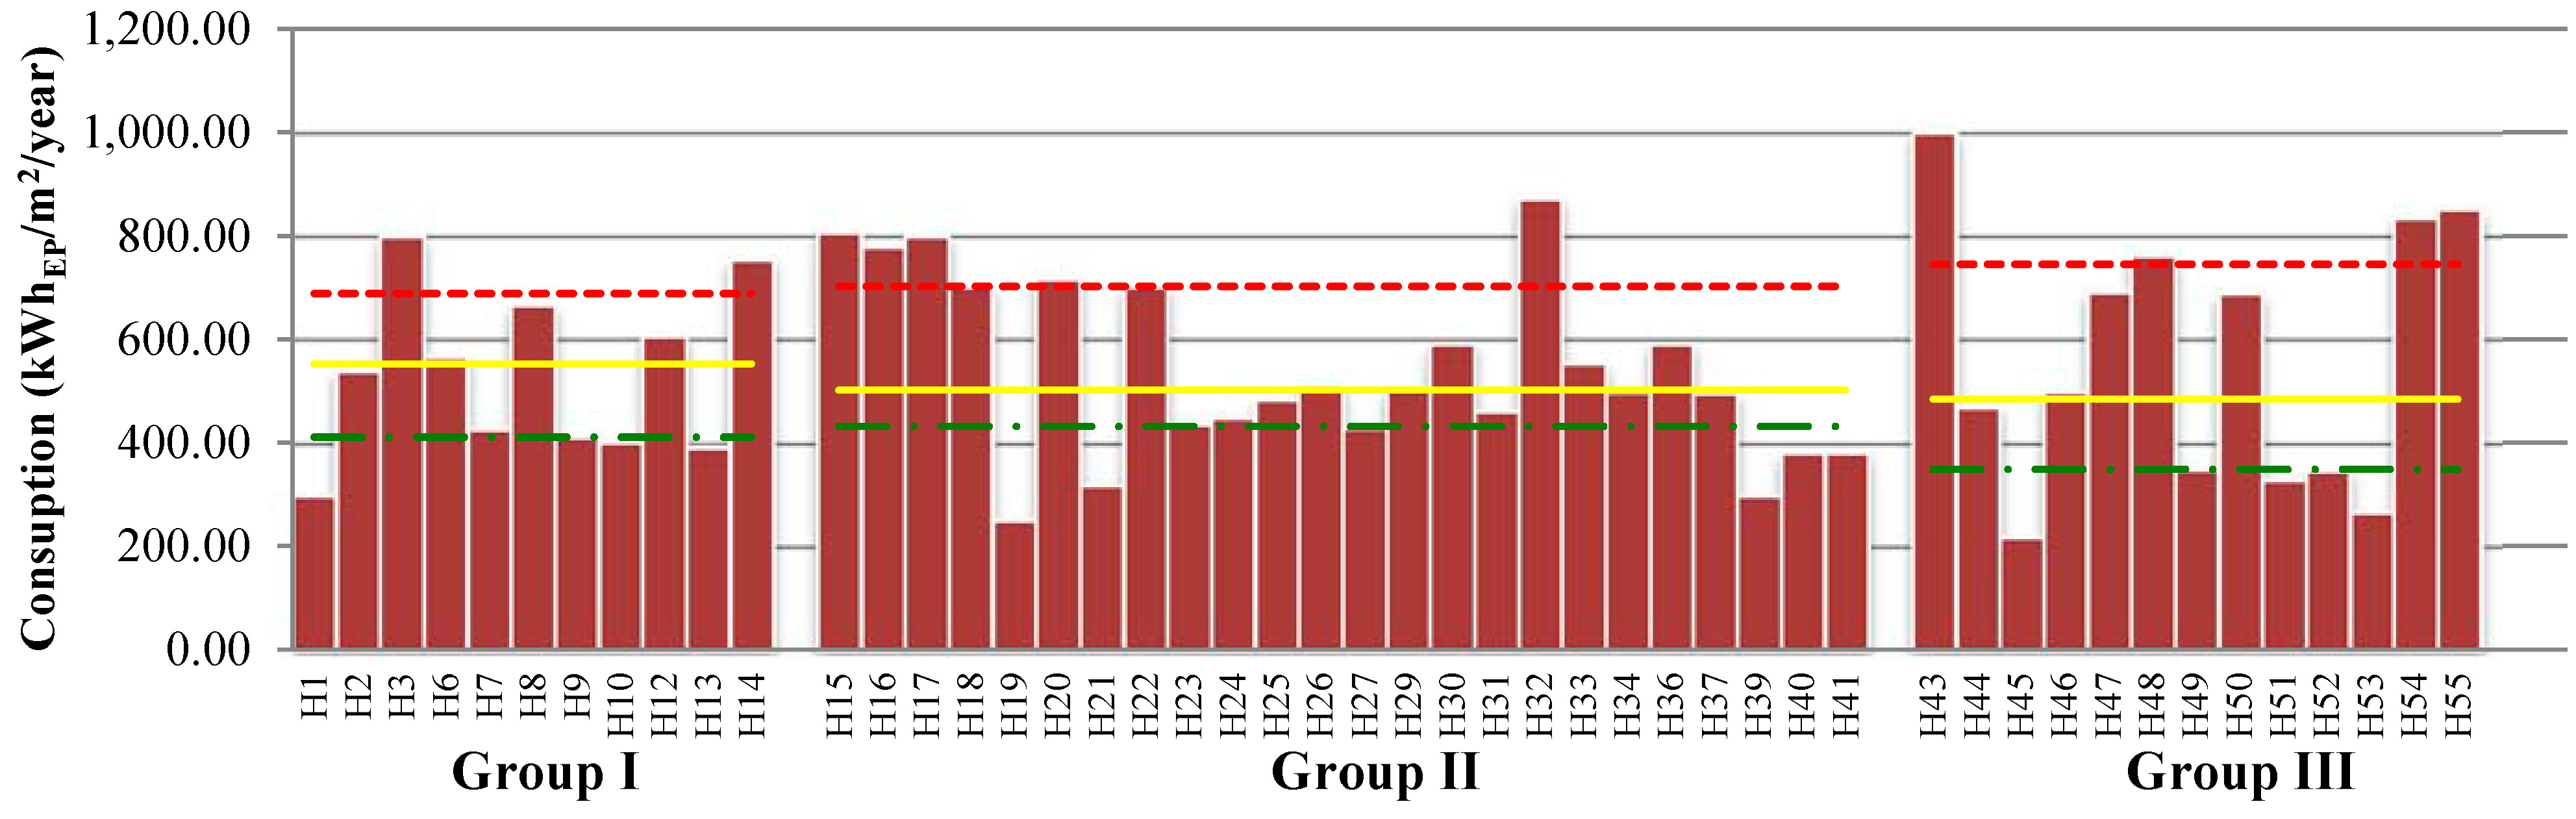
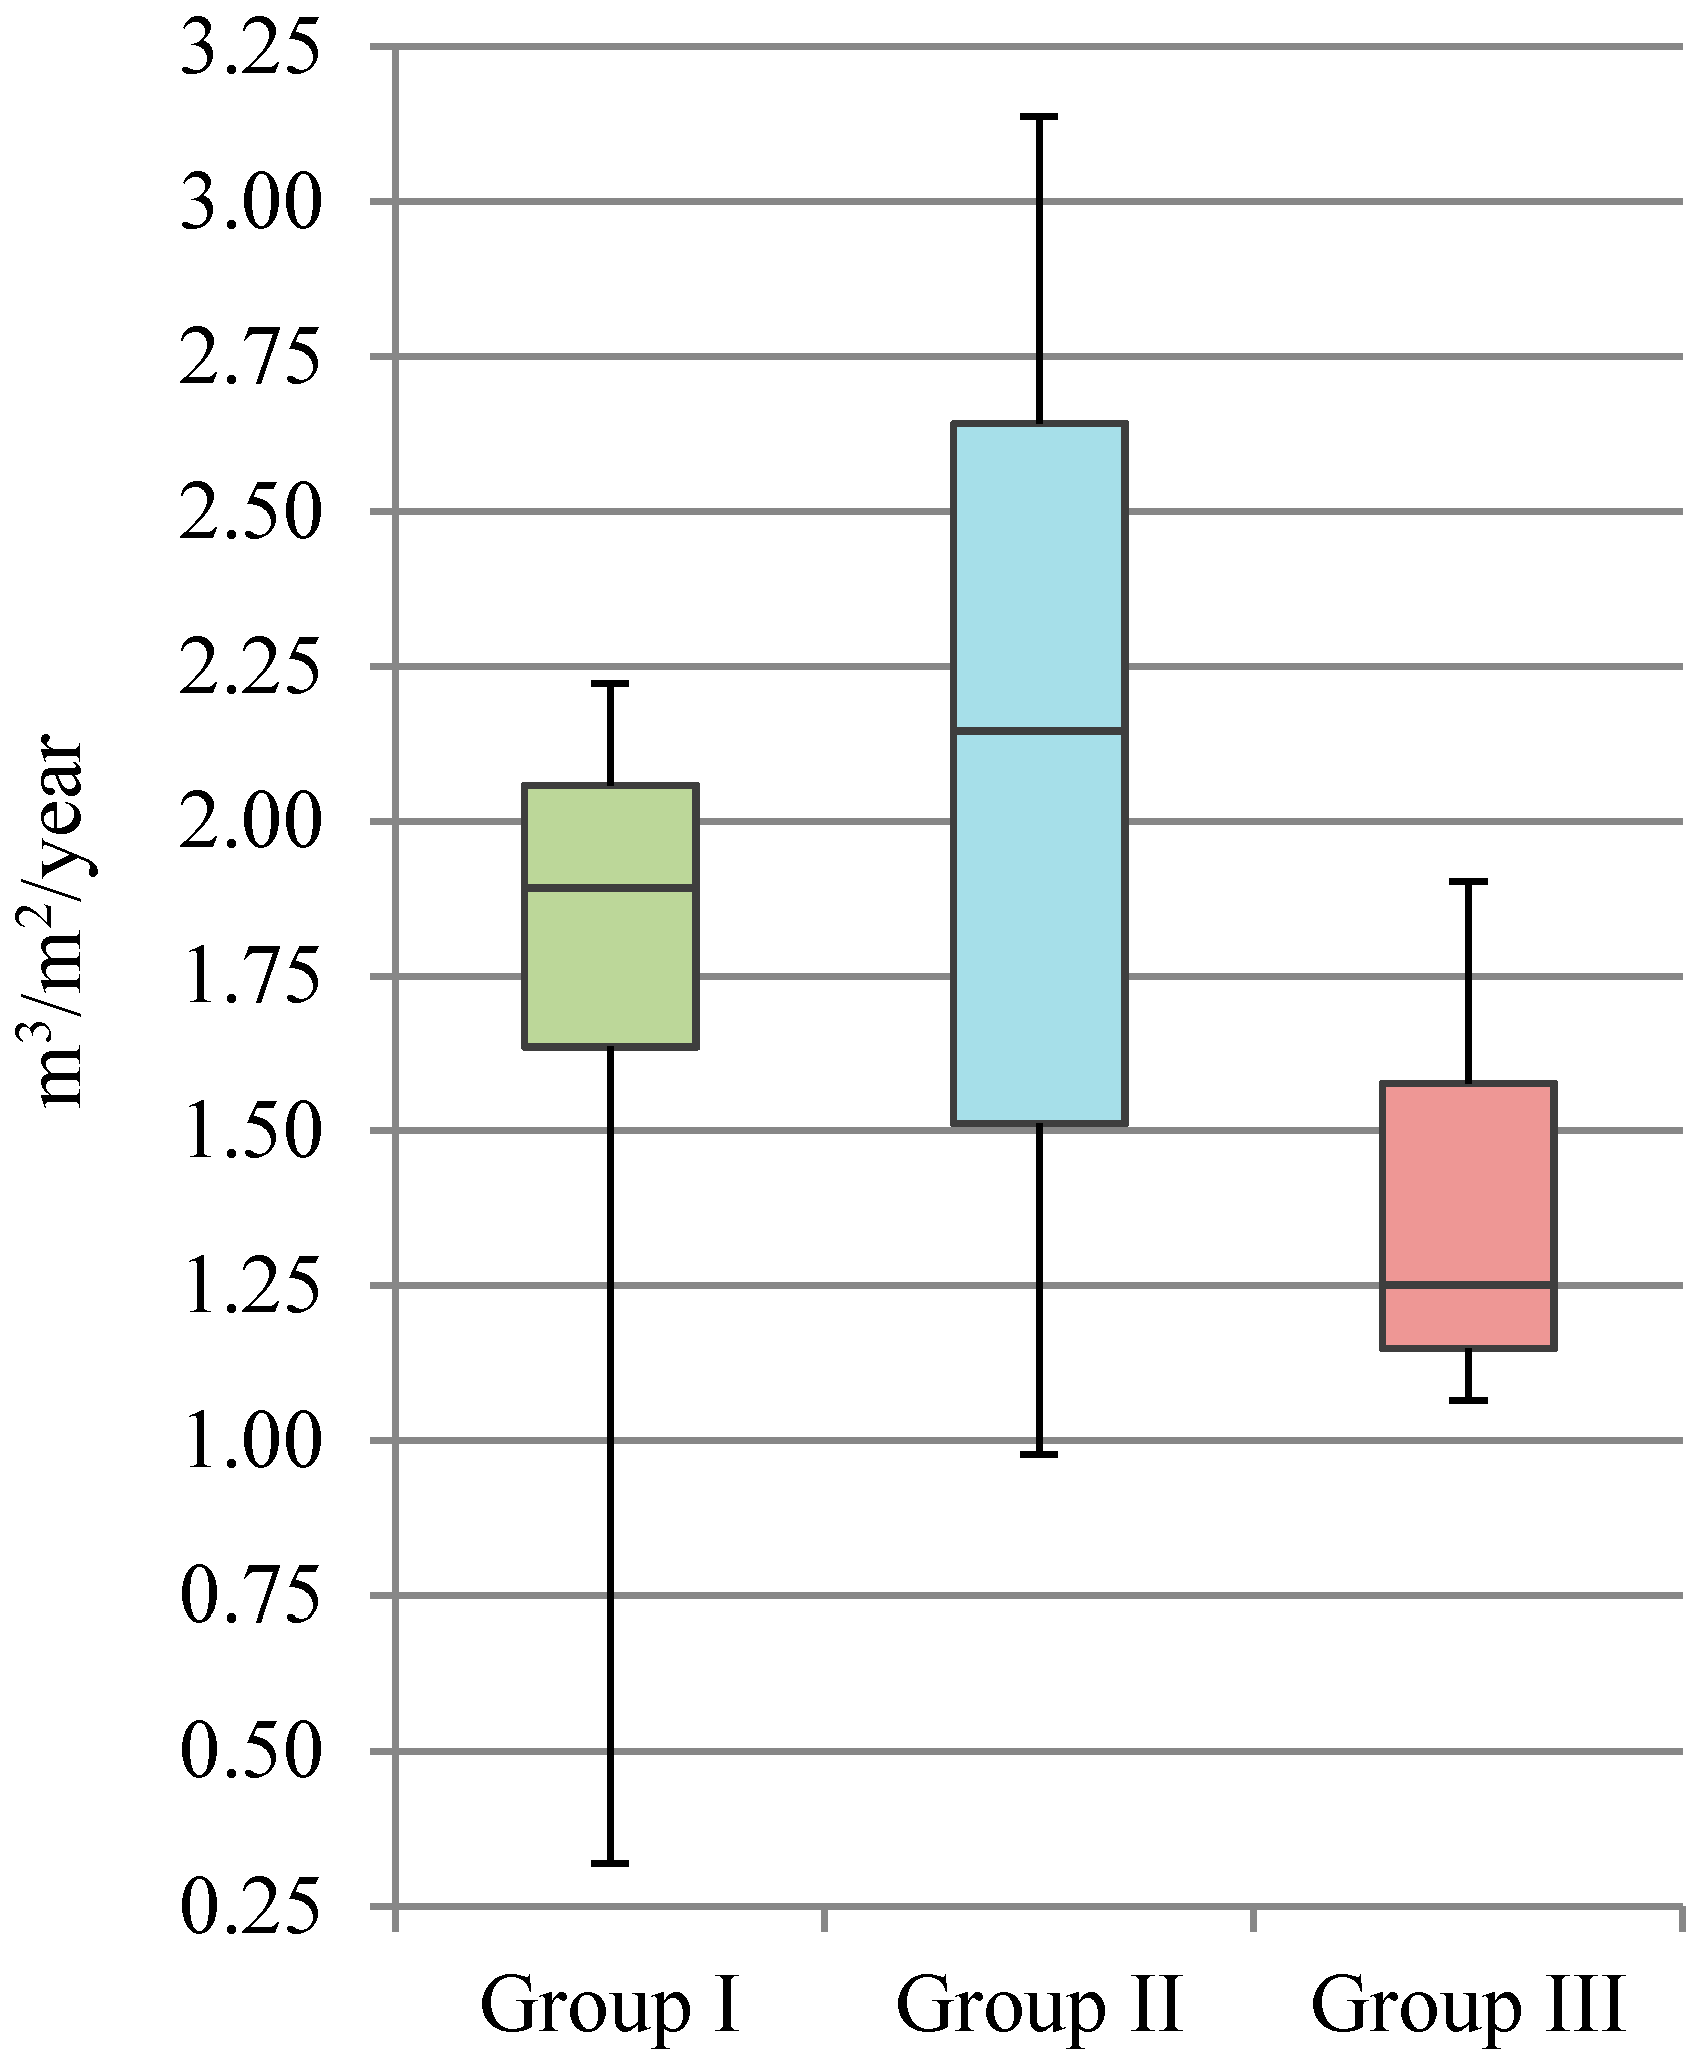
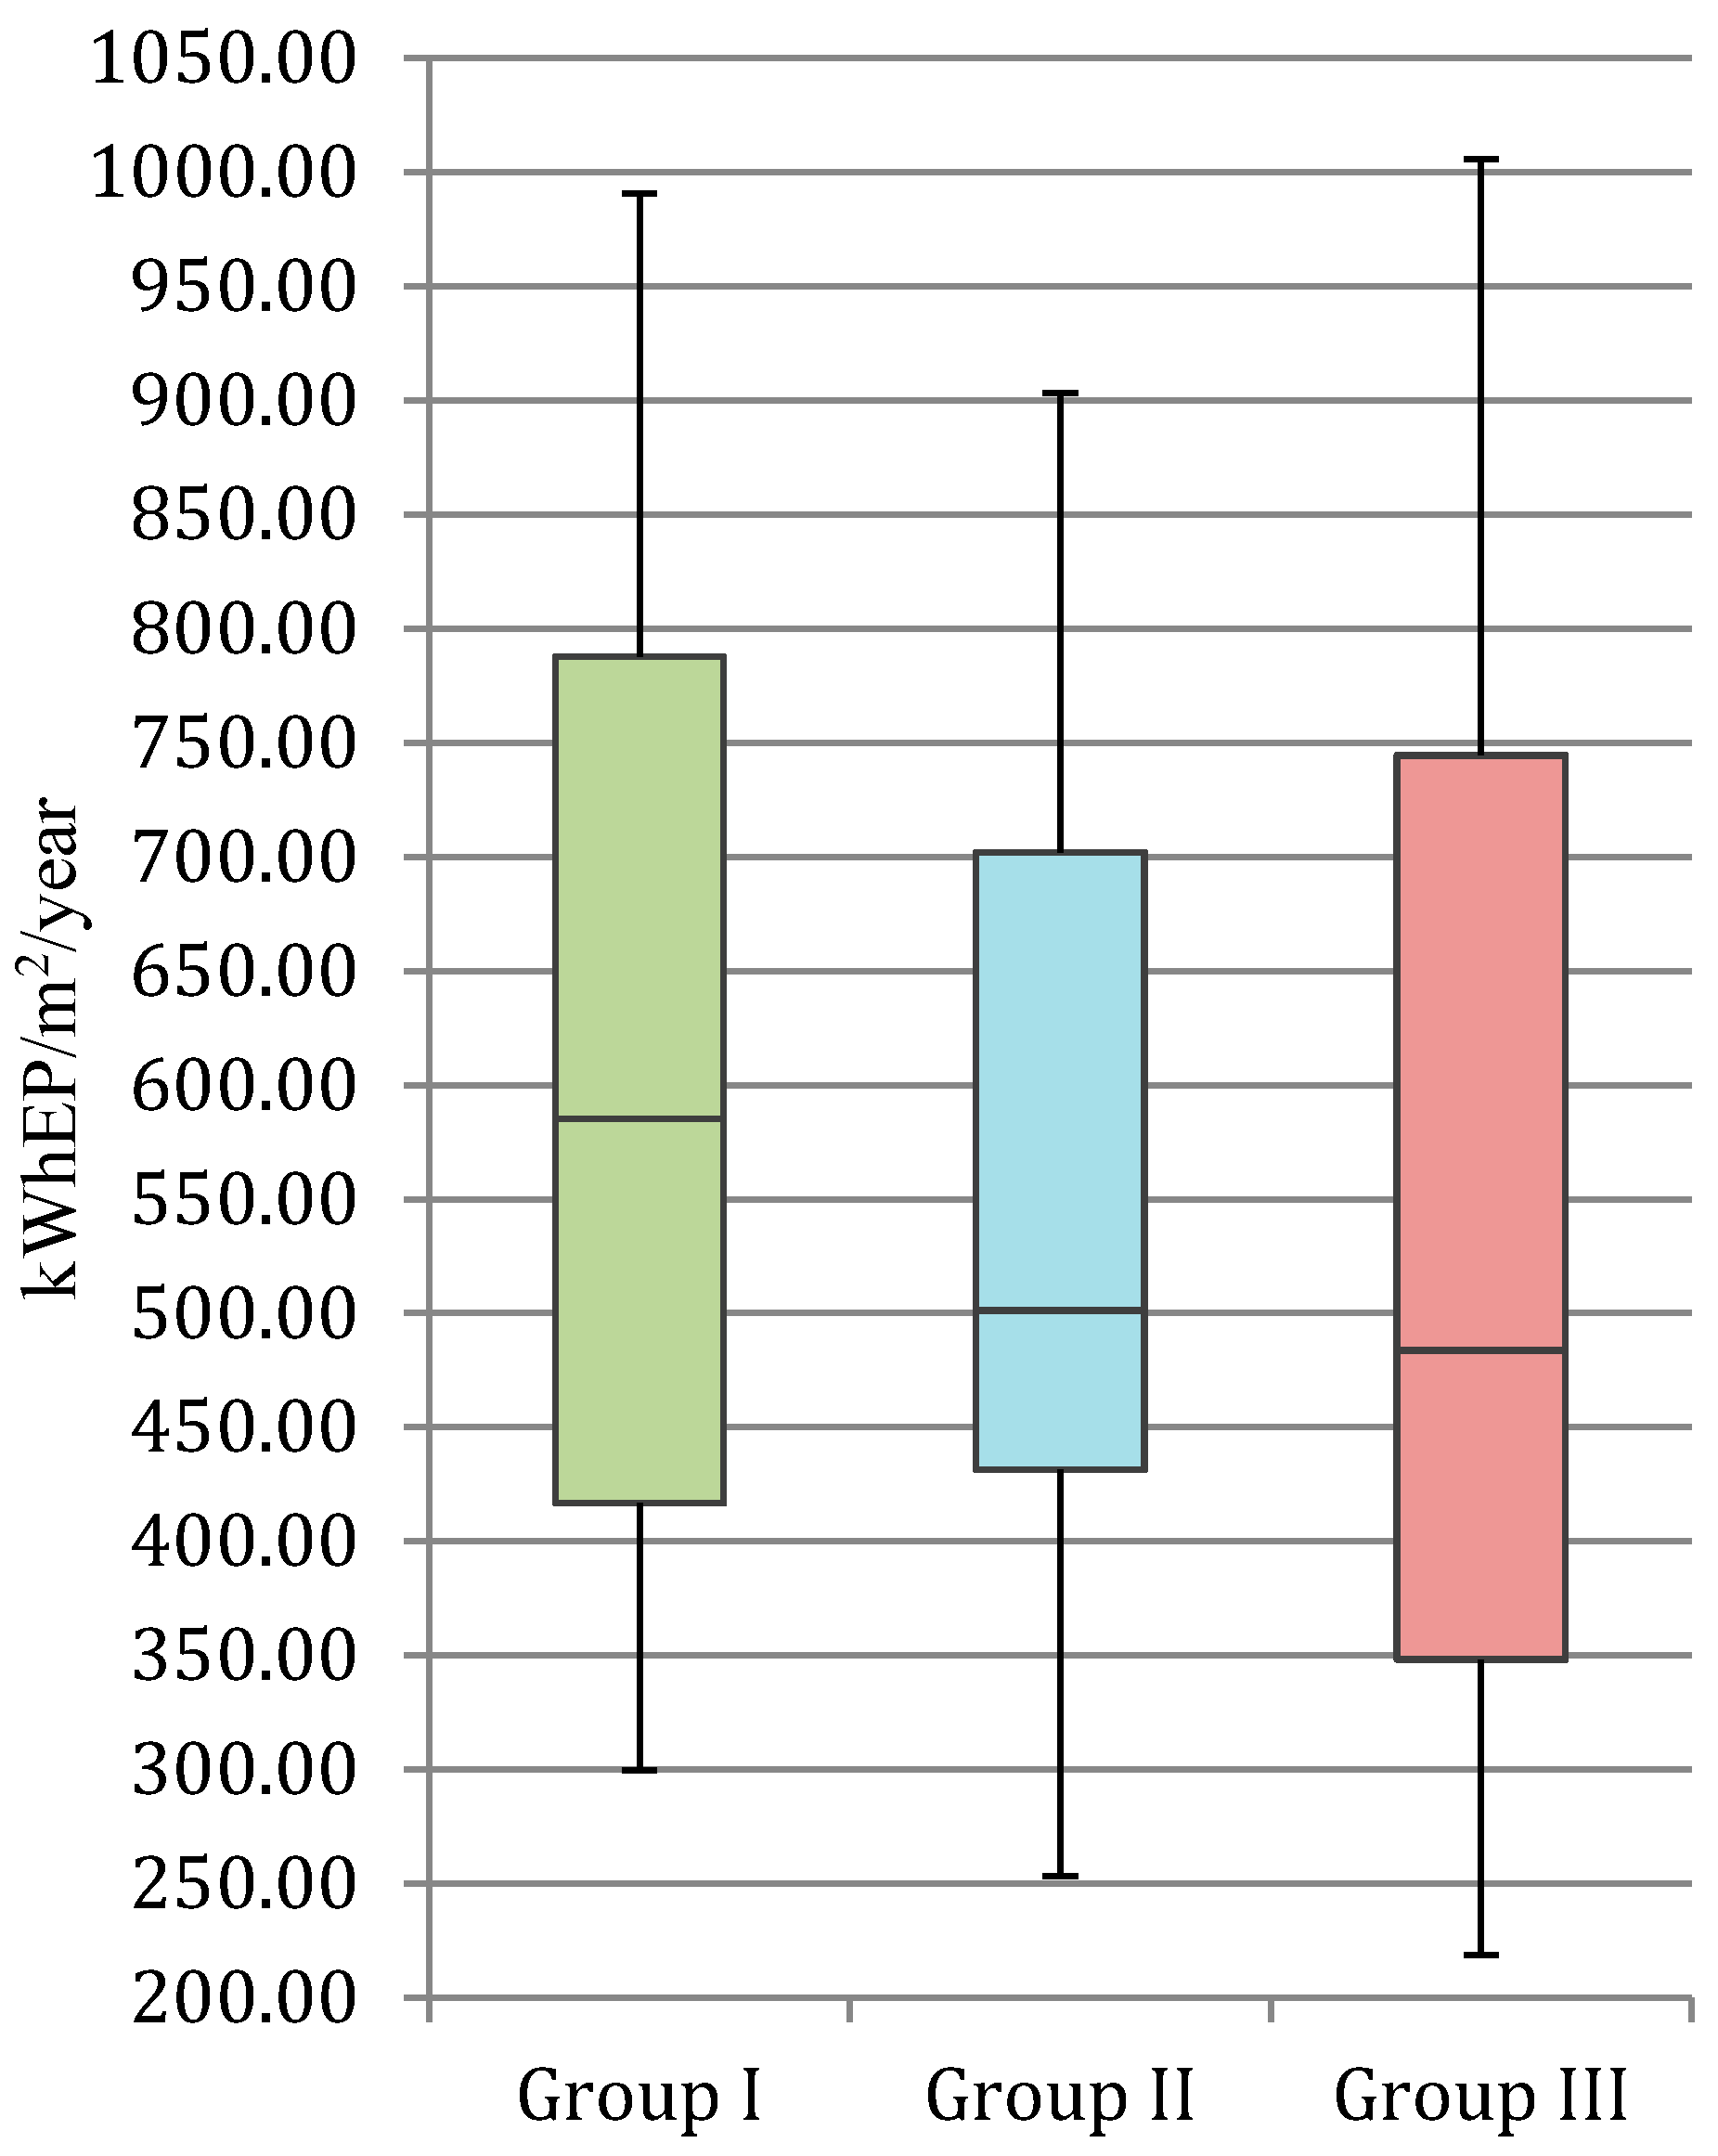
Figure 8,
Figure 9 and
Figure 10, present the values of the annual resources consumption per m
2, corresponding to each healthcare building group, and the “best” and “conventional” practices. Analyzing, for example the water consumption of the Group II (hospitals with an area between 8805 m
2 and 37,663 m
2),
Figure 8, it is possible to note that the “best practice” of these healthcare buildings is 1.51 m
3/m
2/year, and “conventional practice” is 2.15 m
3/m
2/year. Therefore, the hospitals that present better performance at the level of water consumption are: H19, H23, H25, H34, H35, H39 and H41.
As another example and regarding the values for the Group I presented in
Figure 9 it is possible to conclude that the value for the “best practice” of energy consumption is 410.66 kWh
PE/m
2/year, while the “conventional practice” is 552.12 kWh
PE/m
2/year. Thus, analyzing the data of this group, it is possible to conclude that hospitals that have the same or lower energy consumption than the “best practice” are: H1, H10, and H13.
Figure 8.
Water consumption per m2 in Portuguese healthcare buildings.
Figure 8.
Water consumption per m2 in Portuguese healthcare buildings.
Figure 9.
Energy consumption per m2 in Portuguese healthcare buildings.
Figure 9.
Energy consumption per m2 in Portuguese healthcare buildings.
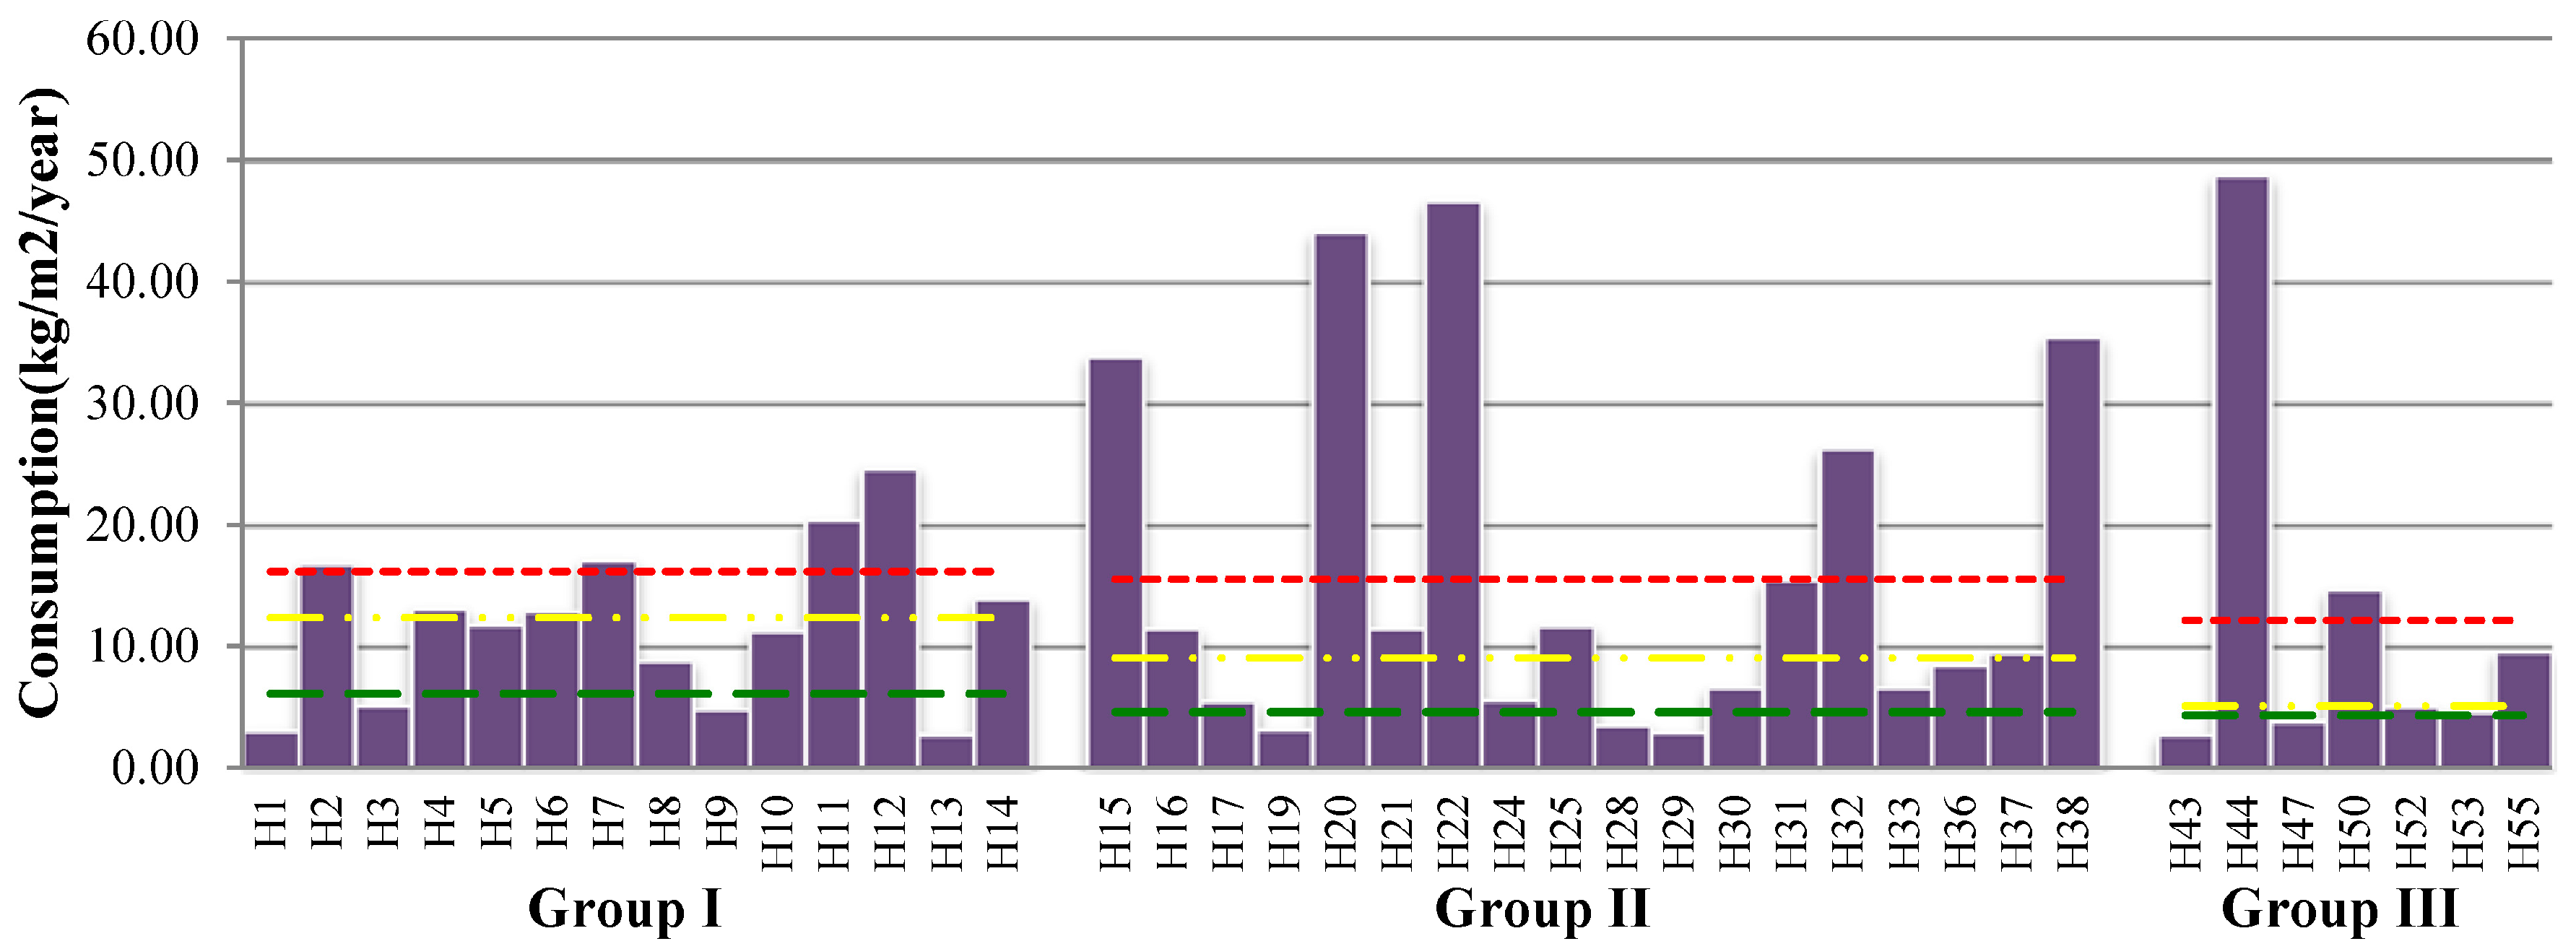
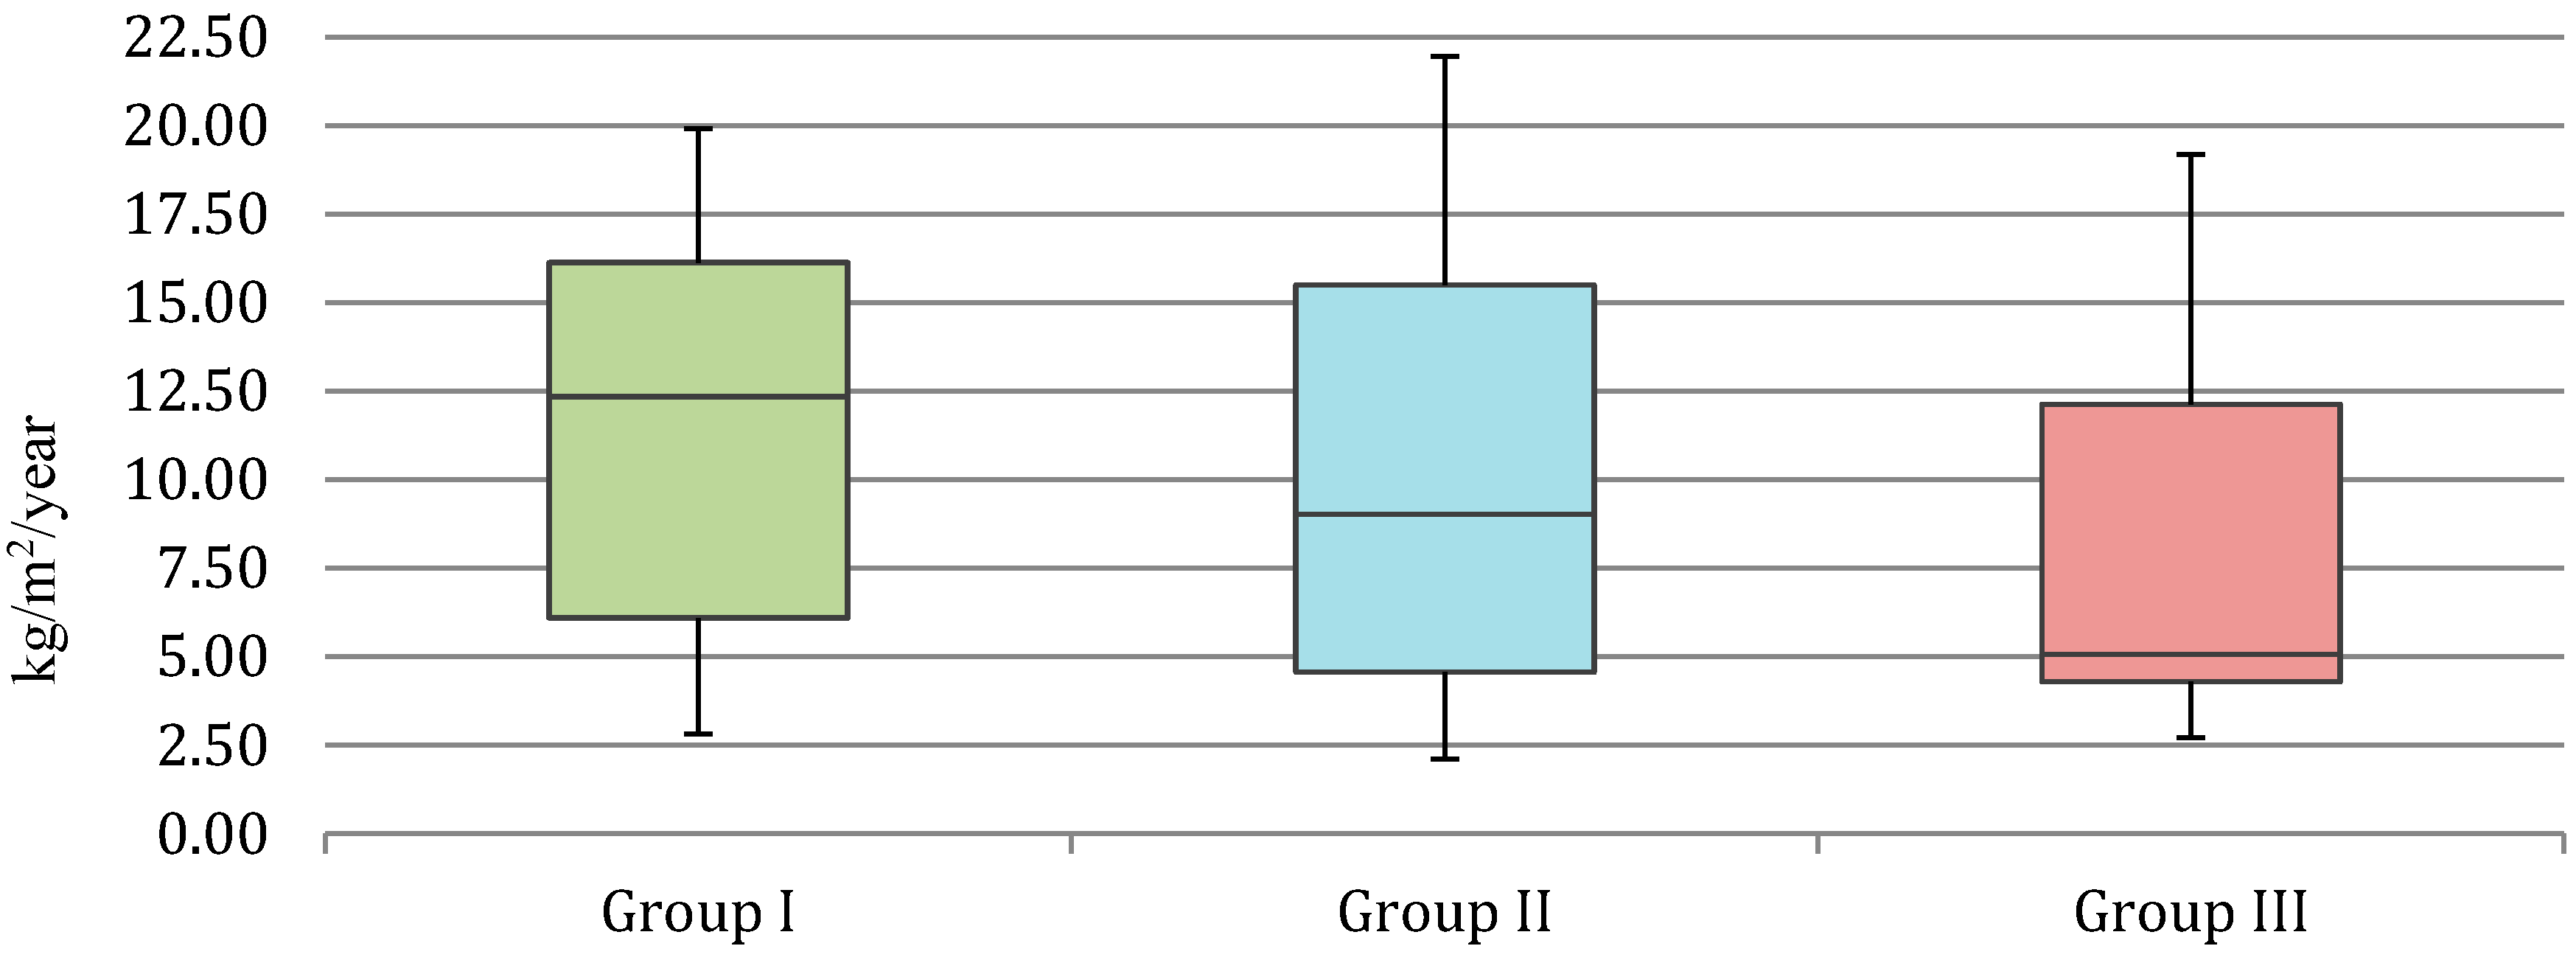
At the level of waste production (
Figure 10) and for example in Group III, 4.30 kg/m
2/year was obtained for the “best practice” and 5.07 kg/m
2/year for the “conventional practice”. The healthcare buildings with a performance higher than the best practice boundary obtained are: H43, H47, H52 and H53. A summary of the “best practice” and “conventional practice” is presented in the
Figure 11,
Figure 12 and
Figure 13. They present the figures for each group of healthcare buildings and the benchmarks for each studied parameter (water, energy, and waste).
Figure 10.
Waste production per m2 in Portuguese healthcare buildings.
Figure 10.
Waste production per m2 in Portuguese healthcare buildings.
Figure 11.
Summary of the “best practice” and “conventional practice” for water consumption.
Figure 11.
Summary of the “best practice” and “conventional practice” for water consumption.
Figure 12.
Summary of the “best practice” and “conventional practice” for energy consumption.
Figure 12.
Summary of the “best practice” and “conventional practice” for energy consumption.
Figure 13.
Summary of the “best practice” and “conventional practice” for waste production.
Figure 13.
Summary of the “best practice” and “conventional practice” for waste production.
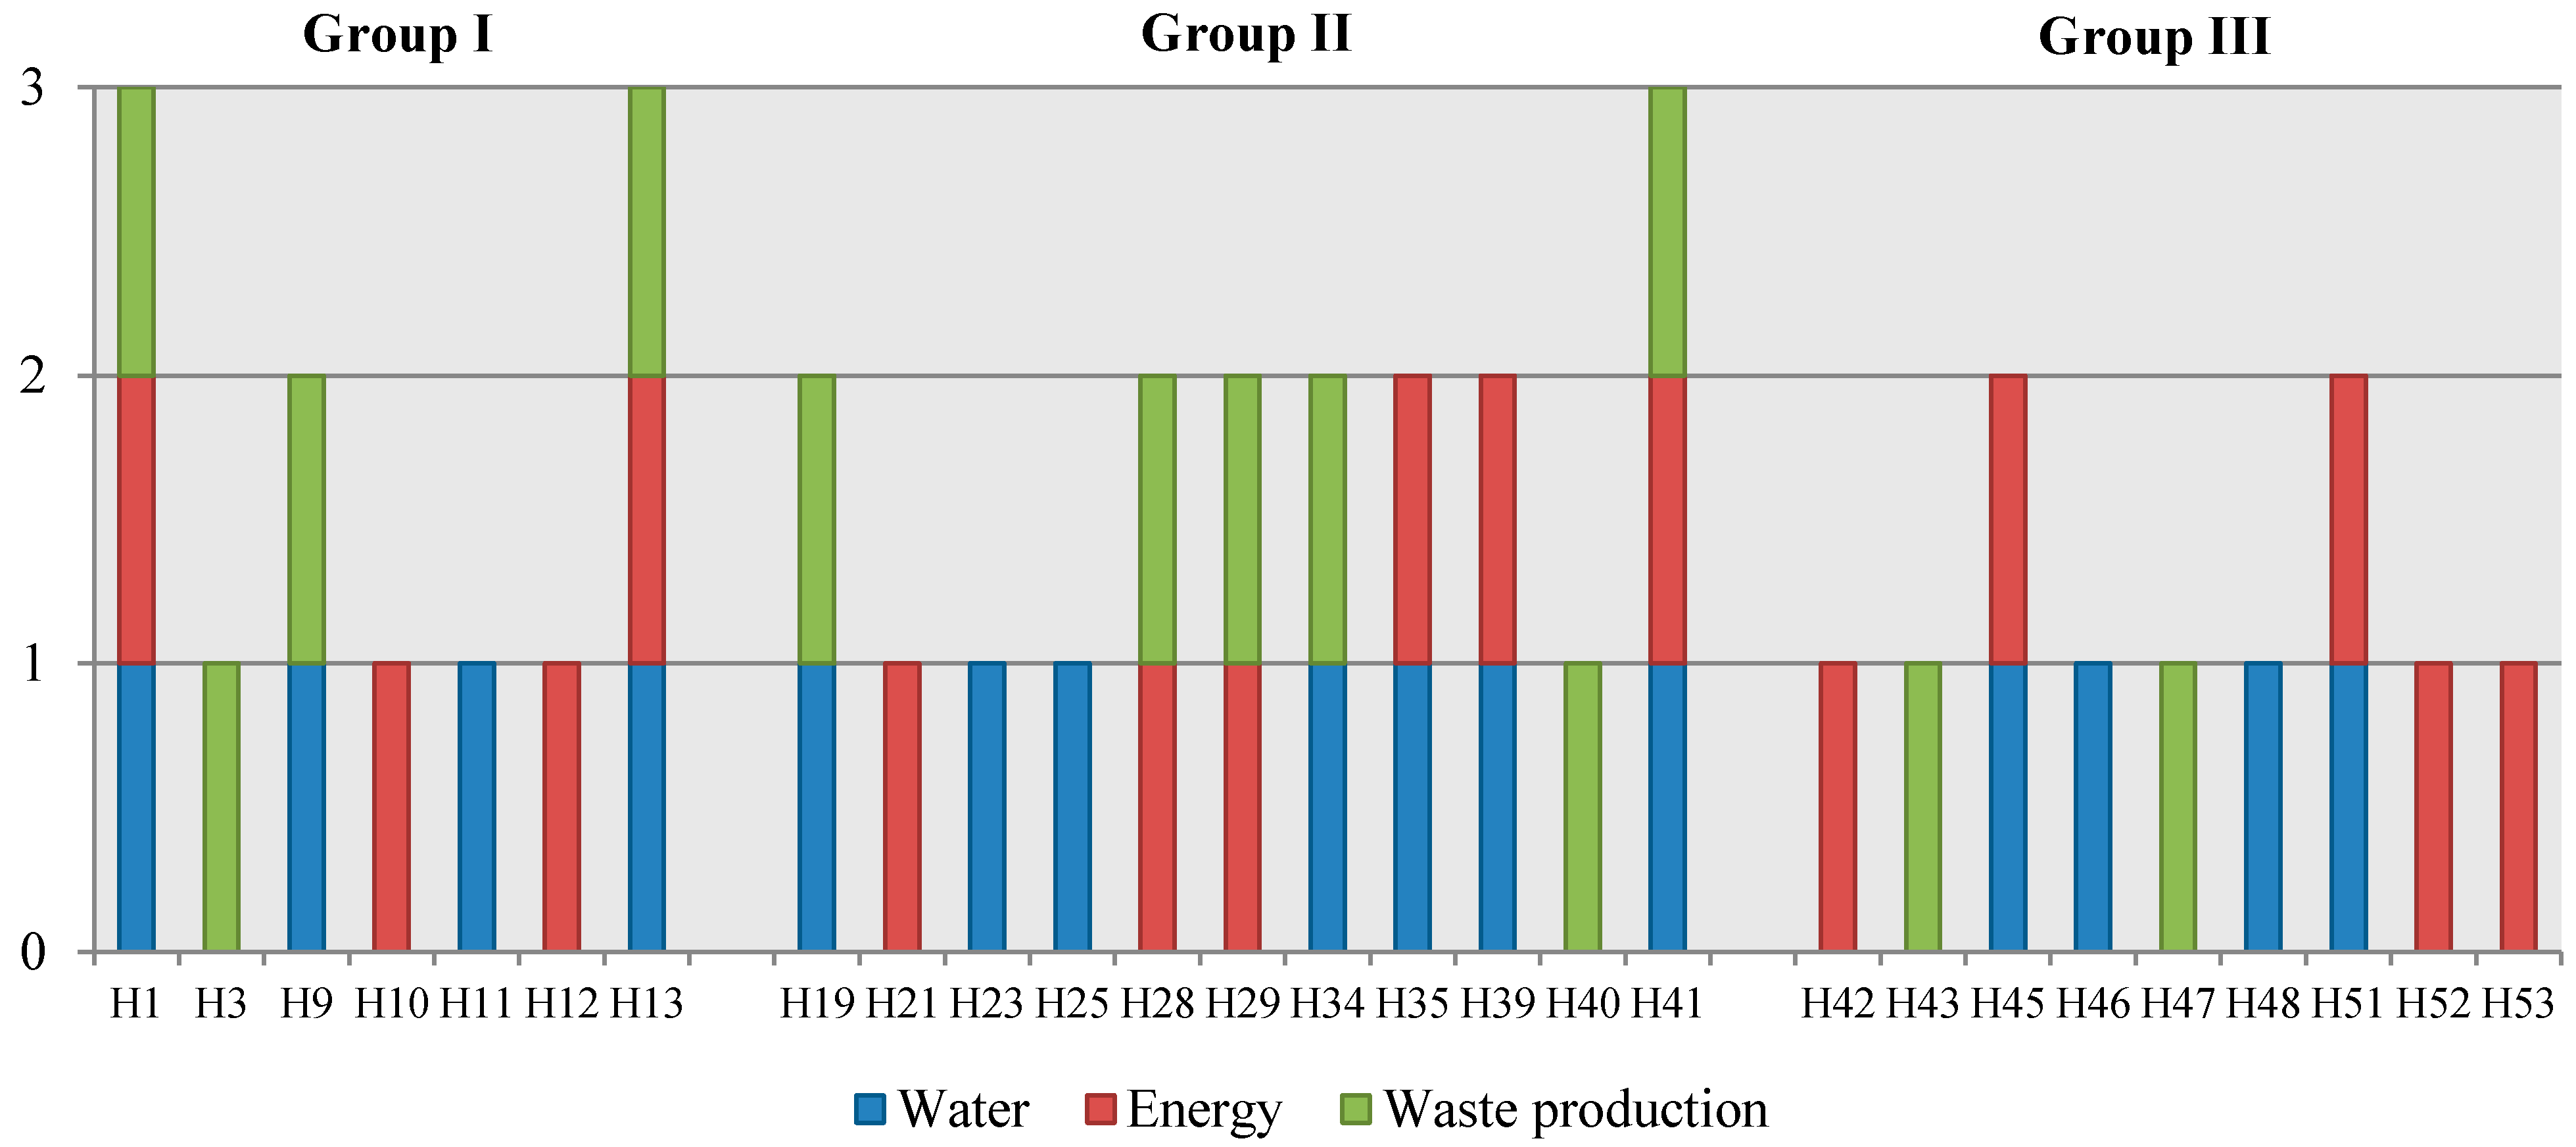
Figure 14 presents a summary of the most efficient healthcare buildings at the level of each parameter studied. Healthcare buildings that have at least one parameter equal or above the best practice boundary are represented in the horizontal axis. The vertical axis identifies how many times and in which parameter the healthcare buildings concerned have a performance above the “best practice”.
Figure 14.
Comparison of Portuguese healthcare buildings that achieve “best practices”.
Figure 14.
Comparison of Portuguese healthcare buildings that achieve “best practices”.
Analyzing the results presented in
Figure 14 it is observed that there are three hospitals that achieve “best practices” at the level of every studied sustainability parameter, namely: H1, H13, and H41.
3.3. Benchmarks for the Operational Stage of Environmental Impacts
For each healthcare building, the environmental impact categories were quantified using the method presented in
Section 2.3. For this analysis, only the impacts related to energy (electricity and gas) and water consumption were considered. Waste generation was not considered, since the related potential environmental impacts depend, above all, on the type of waste that is produced and there is no publicly available data on this.
After quantifying the potential environmental impacts, the “best” and “conventional” practices were defined using the same method presented before, for costs, energy and water consumption, and waste production.
The development of these benchmarks will allow for the comparison of the consumption of healthcare buildings with costs and potential environmental impacts to be made, thus providing a good basis for understanding the potential for the improvement of existing or new buildings. This information is also important for building sustainability assessment methods, since the potential environmental impact during the operational stage is one aspect that should be considered according to EN 15643-1:2010 [
35] standard.
Regarding the potential environmental impacts,
Table 4 presents, for each considered environmental impact category and healthcare building group, the “best” and “conventional” practice.
Table 4.
Benchmarks for potential environmental impacts during the use stage (impacts per m2).
Table 4.
Benchmarks for potential environmental impacts during the use stage (impacts per m2).
| Group I | Group II | Group III |
|---|
| GWP (Kg CO2 eq/m2) | Conventional practice | 1.39 × 10² | 1.17 × 10² | 1.11 × 10² |
| Best practice | 9.81 × 101 | 1.03 × 10² | 8.23 × 101 |
| ODP (Kg CFC-11 eq/m2) | Conventional practice | 9.70 × 10⁻⁶ | 7.97 × 10⁻⁶ | 7.05 × 10⁻⁶ |
| Best practice | 6.89 × 10⁻⁶ | 7.05 × 10⁻⁶ | 5.56 × 10⁻⁶ |
| AP (Kg SO2 eq/m2) | Conventional practice | 8.82 × 10⁻¹ | 7.98 × 10⁻¹ | 7.60 × 10⁻¹ |
| Best practice | 6.78 × 10⁻¹ | 6.45 × 10⁻¹ | 5.86 × 10⁻¹ |
| AP (Kg SO2 eq/m2) | Conventional practice | 8.82 × 10⁻¹ | 7.98 × 10⁻¹ | 7.60 × 10⁻¹ |
| Best practice | 6.78 × 10⁻¹ | 6.45 × 10⁻¹ | 5.86 × 10⁻¹ |
| EP (Kg PO4 eq/m2) | Conventional practice | 1.94 × 10⁻¹ | 1.78 × 10⁻¹ | 1.65 × 10⁻¹ |
| Best practice | 1.55 × 10⁻¹ | 1.56 × 10⁻¹ | 1.45 × 10⁻¹ |
| POCP (Kg C2H4 eq/m2) | Conventional practice | 4.05 × 10⁻² | 3.37 × 10⁻² | 3.22 × 10⁻² |
| Best practice | 2.95 × 10⁻² | 2.95 × 10⁻² | 2.44 × 10⁻² |
| ADP_FF (MJ/m2) | Conventional practice | 1.84 × 10³ | 1.64 × 10³ | 1.57 × 10³ |
| Best practice | 1.39 × 10³ | 1.35 × 10³ | 1.09 × 10³ |
| ADP_E (Kg Sb eq/m2) | Conventional practice | 1.25 × 10⁻⁴ | 1.20 × 10⁻⁴ | 1.16 × 10⁻⁴ |
| Best practice | 1.01 × 10⁻⁴ | 9.97 × 10⁻⁵ | 1.05 × 10⁻⁴ |
At this level it is necessary to highlight that potential environmental impacts are directly related to the amount of resources consumed in a hospital. Therefore, hospitals with the best results regarding water and energy consumption are the ones that have lower potential environmental impacts per m2.
4. Discussion
Healthcare buildings consume important quantities of resources, especially water, electricity, and gas, and produce large amounts of waste. This is due to the role that these buildings play in society.
The definition of benchmarks is very useful in the healthcare building sector, since it allows hospital administrations to identify the position of each hospital in relation to the country’s or region’s “best” and “conventional” practices. This is important both to identify improvement potential and to support the development of strategic plans for the development of more sustainable healthcare buildings. Moreover, it monitors and tracks the implementation phase of better sustainability practices. Therefore, benchmarks are always undergoing improvement and all organizations involved will be advantaged from this. If benchmarking activities do not result in further performance improvement they are just a useless exercise of data collection and processing [
36]. Therefore, it is expected that the benchmarks presented will promote the adoption of more efficient practices, thus contributing to a more sustainably-built environment. Based on these aspects, benchmarking activities are only effective if the following steps are involved in the implementation of the best practices:
To identify opportunities for improvement;
To develop a strategic plan for the practical implementation of best practices;
To monitor and track the progress of implementation of best practices (this is the first step to developing new benchmarks).
A drawback to this approach is that defining benchmarks is not an easy task, since a lot of time is needed to collect the necessary data for characterizing a certain sector and often the necessary data is not made publicly available by the organizations concerned.
Regarding the results presented in the paper, one can conclude that the consumption of primary energy (electricity and gas) benchmarks as total annual energy used per square meter allows for the identification of the following best practices: ≤410.66 kWhPE/m2/year for Group I healthcare buildings (net floor area > 37,663.00 m2); ≤431.33 kWhPE/m2/year for Group II (8807.00 ≤ net floor area m2 ≤ 37,663.00 m2); and ≤348.13 kWhPE/m2/year for Group III (net floor area m2 < 8807.00 m2). Taking into account the average performance of the sample studied, the implementation of best practice in Portuguese healthcare buildings sector could reduce energy use by 2.68 × 10⁸ kWhPE per year.
At the level of water consumption the benchmarks presented in this paper as total annual water use per square meter allows for the identification of the following best practices: ≤1.64 m3/year for Group I; ≤1.51 m3/year for Group II; and ≤1.15 m3/year for Group III. Considering the average performance of the Portuguese healthcare buildings studied, the implementation of best practice in Portugal could reduce water use by 4.94 × 10⁵ m3 per year.
In order to allow international comparison at the level of healthcare buildings it is interesting to compare these results with those from the reports and studies published by different institutions, namely the ones presented in the
Section 1 of this paper.
Since the results of this study are organized in three groups, the results used in the comparisons are the ones from Group II. This is because this group represents the largest number of buildings of the analyzed sample and the intermediate values in terms of gross floor area.
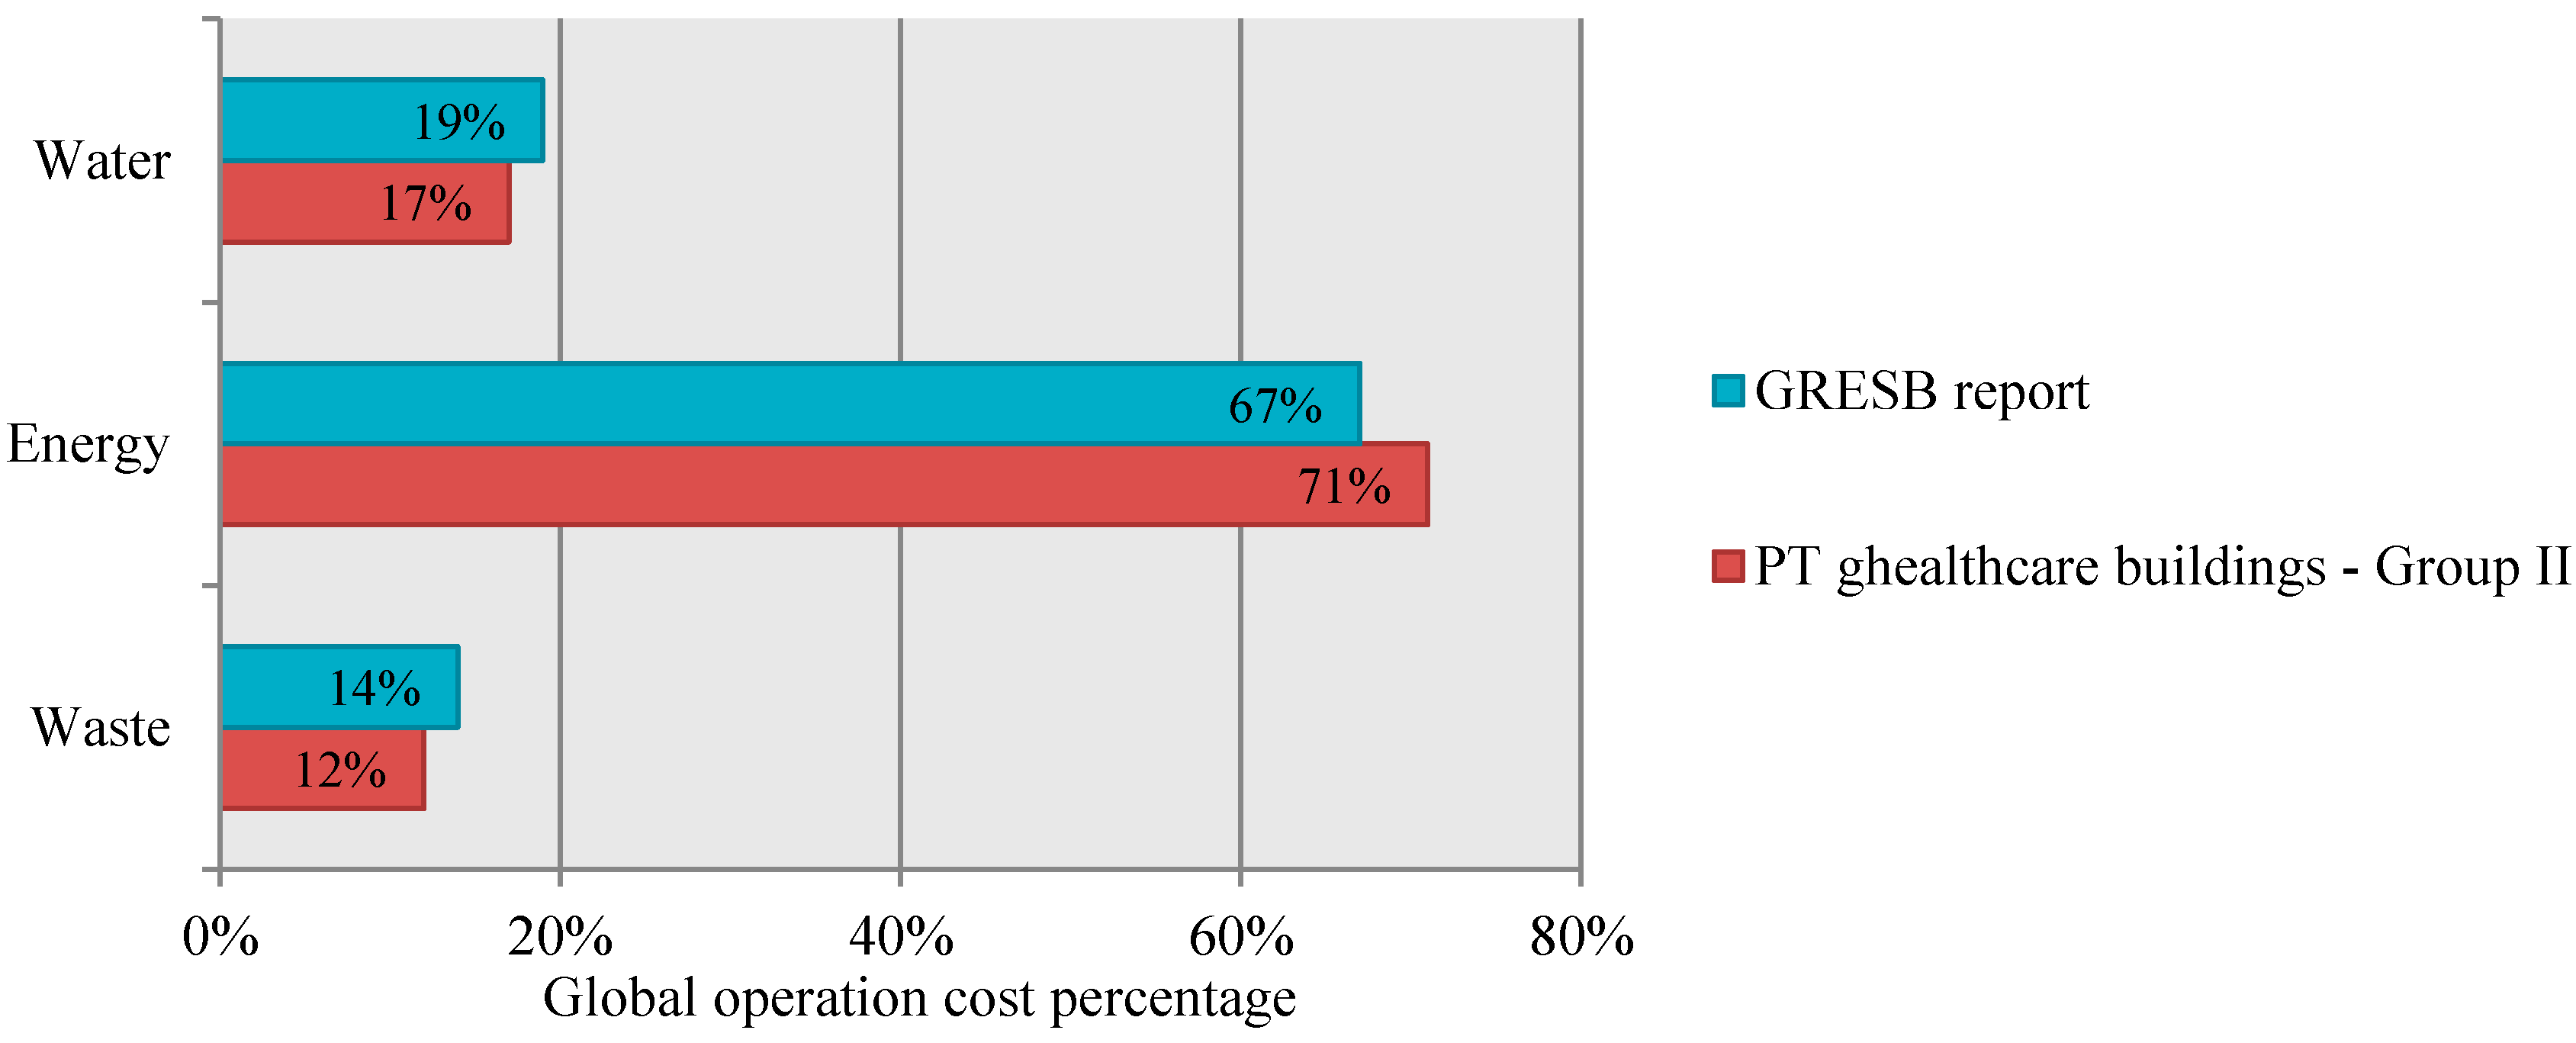
The first comparison is made with the results reported by Global Real Estate Sustainability Benchmark (GRESB) in 2013 report (based in figures from year 2012). This study is based in a sample of 119 non-residential buildings from North and South America, Europe, Asia and Oceania. 3.6% of that sample are healthcare buildings [
37]. By analyzing the operational costs (cost related to water consumption, energy consumption, and waste production) obtained in the study presented in this paper, it is possible to verify that the flow with the highest influence on the total costs (energy), is the same presented in GRESB report, according to healthcare buildings covered by it (
Figure 15). Additionally, the weight of each flow on the total costs is distributed in a similar way in both studies, which allows one to conclude that the distribution of costs in Portuguese healthcare buildings is equivalent to the ones presented in the GRESB report (
Figure 15).
Figure 15.
Comparison between the distribution of costs in Portuguese healthcare buildings and in the healthcare buildings covered by the GRESB report.
Figure 15.
Comparison between the distribution of costs in Portuguese healthcare buildings and in the healthcare buildings covered by the GRESB report.
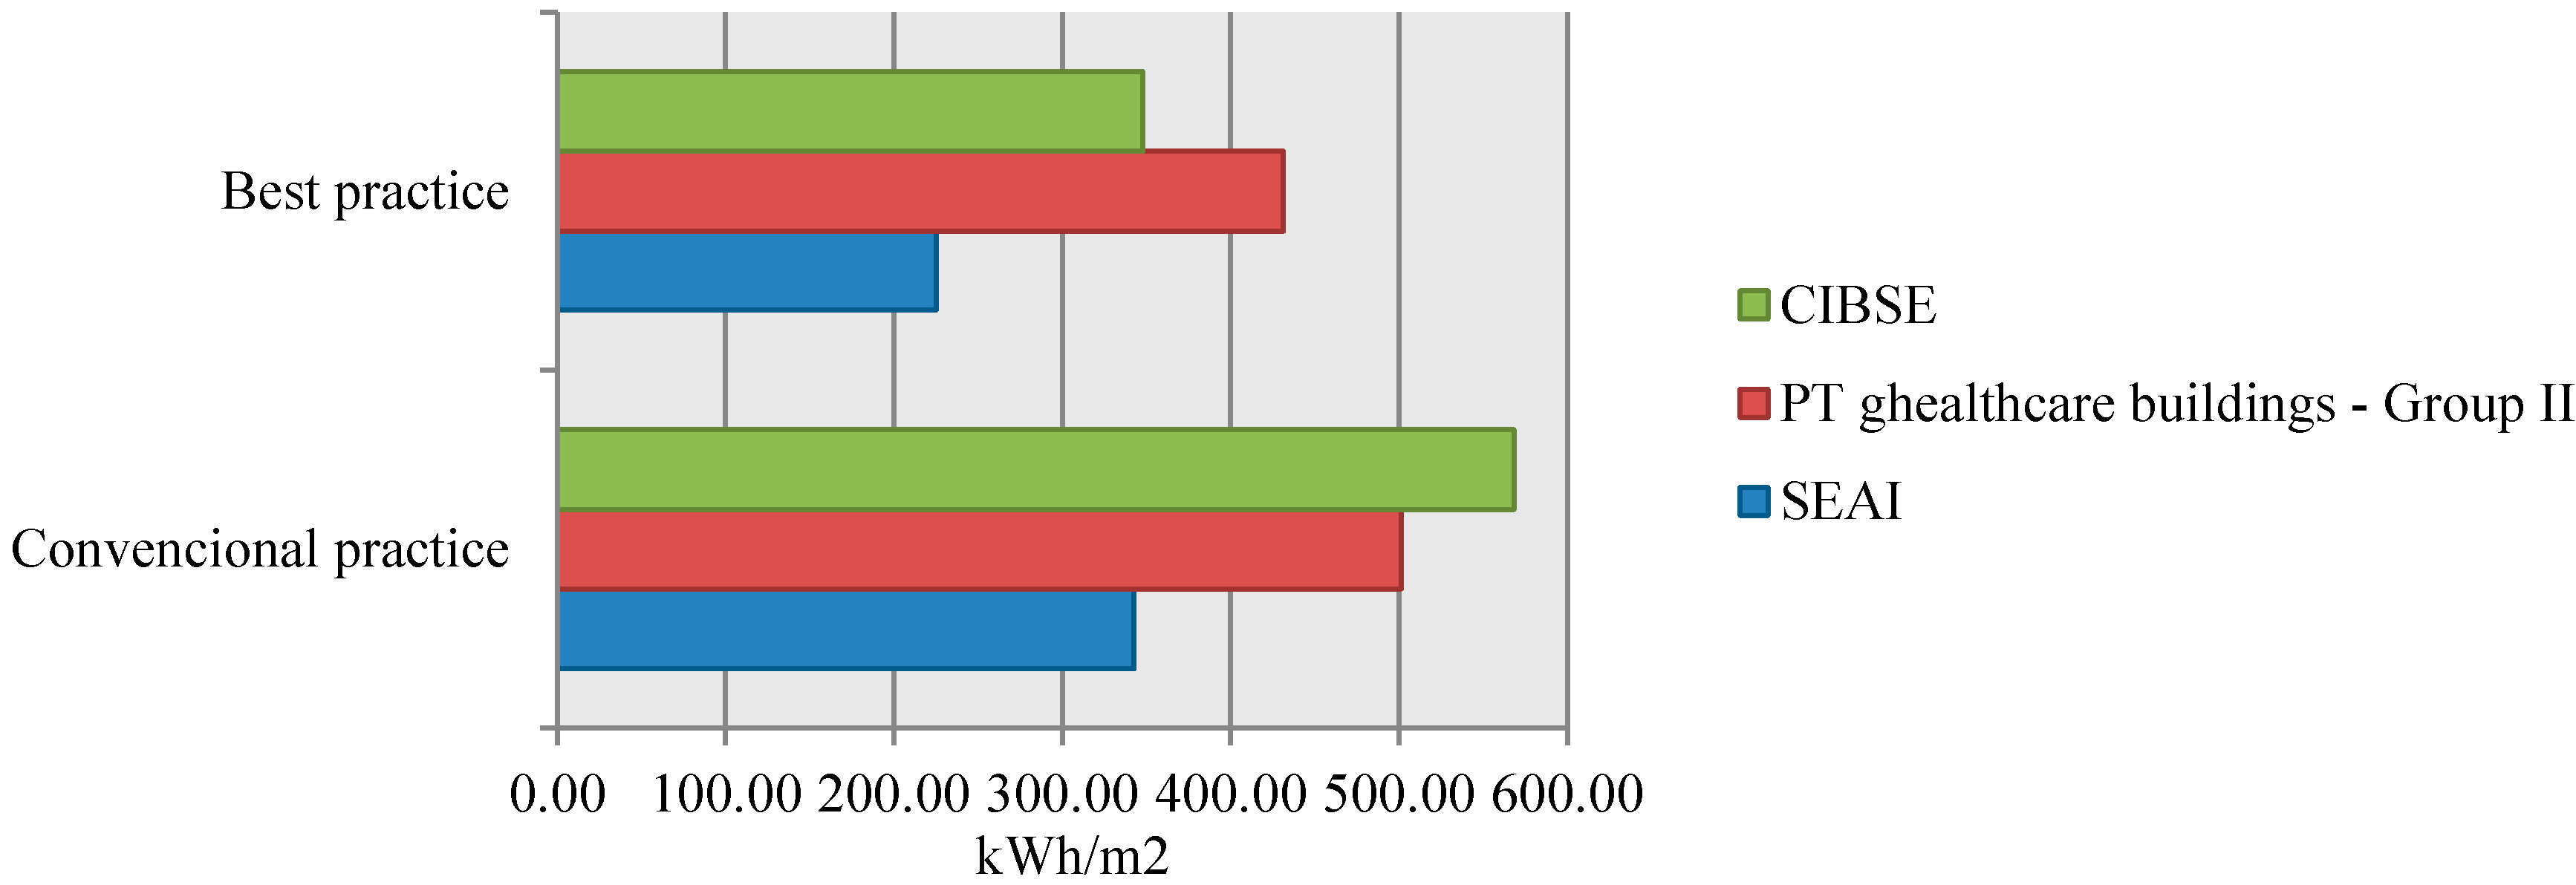
Regarding the benchmarks reported by the CIBSE TM22 [
38] and the ones reported by the Sustainable Energy Authority of Ireland (SEAI) [
39], it is possible to compare them with the “conventional” and “best” practices obtained in the present study. These two initiatives collected data related to energy consumption (fossil fuels plus electricity) per net floor area from general office buildings. Data from the year 2012 was considered in this comparison and
Figure 16 presents the comparison between the “best” and “conventional practices” obtained for the Portuguese healthcare buildings and the ones reported by the two abovementioned studies.
Figure 16.
Comparison between the best and conventional energy consumption practices (kWh per m2) set for the Portuguese healthcare buildings with the ones reported by SEAI and CIBSE TM22 for office buildings.
Figure 16.
Comparison between the best and conventional energy consumption practices (kWh per m2) set for the Portuguese healthcare buildings with the ones reported by SEAI and CIBSE TM22 for office buildings.
From the analysis of
Figure 16, it is possible to conclude that the CIBSE’s benchmarks are closer to the ones presented in this paper. Despite this similarity it is necessary to highlight that these two initiatives do not specifically address hospitals.
In addition to the difference between the building types considered in different studies, there are other important aspects that can hinder proper conclusions from these comparisons. Among others it is possible to highlight the following: (i) differences in the method used to collect data; (ii) the way the statistical analysis is performed; (iii) the specific context (e.g., climate) of each country; (iv) differences in the net floor areas; (v) number and type of equipment and healthcare services inside each building; and (vii) type of energy consumed; and (vii) occupation patterns (number of patients per hour/day). Therefore, the more detailed the benchmarking study is, the greater the potential for comparisons between different international studies and the potential benefits of implementing best practices.
Benchmarks are also very important in the field of building sustainability assessment since they allow for rating a building against the “best” and “conventional” practices in a specific context. In some building sustainability assessment (BSA) tools, e.g., LEED and BREEAM, sustainability ratings are awarded by comparing the building performance with performance thresholds that are based on the sector’s “best” and “conventional” practices or on minimum requirements for a sustainable building. In other tools, benchmarks are used to normalize the building performance at the level of each sustainability parameter, allowing, afterwards, to qualitatively or quantitatively rate the sustainability of a building. As an example, this is the case in the Portuguese Building Sustainability Assessment system SBTool
PT [
19], where the normalization process allows for positioning the performance of the building under assessment within a scale in which the maximum and minimum value represents the best and conventional sustainability practices, respectively. Since the method under development to assess the sustainability of healthcare buildings is within the SBTool
PT system, this is the normalization and rating process that is going to be adopted.
In SBTool
PT the objective of the normalization of parameters is to avoid scale effects in the aggregation of parameters inside each indicator and to solve the problem of some of the parameters being of the type “higher is better” and others being “lower is better”. Normalization is done using Equation (2) [
19].
In this equation, Pi is the value of ith parameter. P*i and P*i are the best and worst value of the ith sustainable parameter. The best value of a parameter represents the best practice available and the worst value represents the standard practice or the minimum legal requirement. In addition to making the value of the parameters considered in the assessment dimensionless, normalization converts the values between conventional and best practices into a scale bounded between 0 (conventional practice level) and 1 (best practice value). Excellent practices will have a score above 1 and performances below the conventional will have a negative normalized value. This equation is valid for both situations: “higher is better” and “lower is better”.
For example, based on the results presented in
Table 3 and for a hospital belonging to Group I that has an annual water consumption of 1.80 m
3/m
2/year, the normalization of the water demand of this healthcare building is done according to the process presented in
Table 5 and Equation (3).
Table 5.
Example of benchmarking for normalization.
Table 5.
Example of benchmarking for normalization.
| Parameter | Annual Water Consumption per m2 |
|---|
| Notation | Wd |
| Unit | m3/m²/year |
| Value | 1.80 |
| Conventional practice | 1.87 |
| Best practice | 1.63 |
As presented in
Table 6, in SBTool
PT the normalized values of each parameter are converted into a graded scale bounded between E (less sustainable/below the conventional practice) and A+ (more sustainable/above the best practice) in order to facilitate the interpretation of results. In this graded scale, level D is equivalent to the conventional practice and A to the best practice.
Table 6.
Conversion of the quantitative normalized parameters into a qualitative graded scale.
Table 6.
Conversion of the quantitative normalized parameters into a qualitative graded scale.
| Sustainability Grade | Values |
|---|
| A+ | |
| A (Best practice) | |
| B | |
| C | |
| D (Conventional practice) | |
| E | |
For the normalized value presented in Equation (2), the building would get a C in the qualitative sustainability grade.
In the case of qualitative ratings, it is necessary to set the performance level corresponding to the conventional practices (e.g., the minimum legal requirement or the median performance of the existing building stock) and best practices (e.g., the performance of outstanding buildings or the performance levels that are only exceeded by a small percentage of the existing building stock). Therefore, to define those reference-building benchmarks, it is necessary to have a detailed picture about the overall performance of the building stock studied in a certain context (e.g., country). At the level of the healthcare sector, although most buildings are under the same owner (i.e., the state, in public buildings), it is also a difficult task to have all the necessary data to set the benchmarks for all sustainability parameters of an assessment method. In this context there are some figures, such as building area, number of beds, costs of energy, monthly water and gas consumptions, etc., that can be easily obtained from hospital managers. However, there is other important information that can be used to improve the benchmarks, but it is not easy to gather, such as: construction details, type and year of eventual retrofitting operations, where and how water and energy are consumed, what type of waste is produced, among others.
From the analysis of results presented in this study it is possible to highlight that the parameter that influences most the resources consumption and the waste generation of a healthcare building is the net floor area. Therefore this is the functional unity for which the benchmarks presented in this study were defined. Additionally, it shows that energy consumption (gas and electricity) represents more than 75% of the overall costs being, therefore, a parameter of major concern in a sustainable rehabilitation process of a healthcare building.
On the basis of available data, benchmarks were defined using one-year data recorded by the Portuguese Health Administrations. To improve the results, a period longer than one year should be considered in the analysis, which would allow for minimizing the effect of a particular month with values outside the normal boundaries.
Nevertheless, this study was able to develop the first basis of comparison for this type of buildings in Portugal. In addition, the methodology presented in this research will be used to develop the benchmarks of the other sustainability parameters of a new tool to assess the sustainability of healthcare buildings.
Once the benchmarks are established for Portuguese healthcare buildings, it is possible to benefit from their main objective: to make a comparative analysis between the performance level of different organizations in order to promote the dissemination of the “best practices”. As a result, the healthcare building managers will understand the market positioning of their buildings and this will promote the adoption of better sustainability practices
5. Conclusions
Extensive use of existing written material and consultation with operational managers and other stakeholder experts in the healthcare buildings sector underpinned the development of benchmarks for energy consumption (electricity and gas), water consumption, waste production, and potential environmental impacts during the operational stage of this type of building in the Portuguese context.
Rather than be based on empirical data or on the performance level of a small group of buildings that are considered representative of good practice in Portugal, the method presented in this paper is based on a total sample of 55 public and public-private partnerships healthcare buildings in Portugal. The statistical analysis of the survey results showed that annual consumption of resources, production of waste, and potential environmental impacts would be better correlated with the net floor area of healthcare buildings. Nevertheless since there are different types of hospitals, covering very different health services coverage and with different net floor area, it was necessary to group the hospitals into three different groups (Group I, Group II, and Group III). Therefore, different benchmarks were developed for each hospital group.
For the definition of the conventional practice, the median performance of the sample studied was considered. The best practice threshold is the upper limit of the first quartile of the Gauss curve, which means the boundary of the 25% better performance buildings. Rather than defining more demanding best practices, i.e., thresholds that are only exceeded by a very small number of buildings (e.g., 5%), this method sets benchmarks that provide challenging, but achievable, targets and highlight considerable improvement potential for healthcare managers. This is considered to be the best approach in the case of a benchmarking method that is beginning to be applied in a certain market.
The benchmarks presented in this study supports the design process for more sustainable, new or renewed healthcare buildings, making it possible to understand to what extent each design scenario can potentially be improved to include best practices. Bottom-up modeling of best practice at the process-level allows hospital managers to develop implementation plans that allow them to achieve the frontrunners’ efficiency. This is very important since until now there has been no publicly available data related to the performance limits of this type of buildings in Portugal. Nevertheless, it is necessary to underline that, although the reduction of resources consumption (energy and water) is both financially and environmentally attractive, there are some aspects that could hinder its application, such as divided responsibilities within this type of large organization and lack of awareness.
In addition to the benchmarks, another important outcome of this research is the benchmarking method, which has been developed. It would be particularly useful for both the continuous assessment of building performance and the evaluation and setting of benchmarks for the parameters studied, allowing for the monitoring of the conservation pattern of a sustainable society based in the consumption of resources and technological development of healthcare equipment and other building integrated systems. Additionally, this method can be used as a template for formulating benchmarks for healthcare buildings elsewhere and for other types of buildings.
Regarding the actual state-of-the-art, the contributions of this study for its development can be summarized as:
Development of a methodology for setting sustainability benchmarks of best and conventional practices that can be applied to different sustainability parameters and used at different regional contexts;
Definition of the benchmarks for some sustainability parameters (energy and water consumption, related potential environmental impacts, and waste production) in the Portuguese context (until now there was no available data in Portugal);
In the Portuguese context, it allows the Portuguese hospital administrations to identify their positioning and improvement potential at the level of each parameter studied. Additionally, it enables international performance comparisons with data already publish in other countries;
In the context of HBSA tools, the developed benchmarks make possible the evaluation of the performance of Portuguese healthcare buildings at the level of the four parameters analyzed.
Furthermore, this research is of interest to commissioners, regulators, and providers of healthcare facilities, specifically healthcare planners, estate/facilities managers, and all those responsible for planning, designing, operating, and maintaining the Portuguese healthcare estate, as well to health and social care policy makers. Additionally, there is a potential to develop benchmarks that can be applied to Portuguese healthcare facilities, in order to improve their sustainability credentials, and to allow performance comparison and improvement, both nationally and internationally. Although the methodology presented in this paper was developed for the Portuguese context, it can be implemented and further developed by other research teams at the international level. In the application of this methodology in other countries the following improvements are proposed:
Rather than obtaining the data from individual reports it would be better to collect data directly from each hospital. This allows using a standardized data collection and storage method and, therefore, to reduce the probability of errors. Since it is very difficult to have the necessary permits from Hospital Administrations (public and private) to collect the required data, it is necessary to settle the adequate collection mechanisms. For instance, in Portugal, all hospital administrations must provide the data to the Estate on an annual basis and they are responsible for its accuracy. The same approach is used, for example, in the UK. The Portuguese Estate supports financially the Central Administration of Health Services that has the mandate to keep and develop the database;
To update the benchmarks on an annual basis. It is recommended to create a public database (preferably a web-based database) of benchmarks that must be updated annually, which allows taking into consideration the improvement measures that are being introduced in the sector (e.g., more efficient equipment and energy retrofitting of the building envelopes). To guarantee the adequate and long-term maintenance of this database this should be under the responsibility of the Estate;
To collect a broader number of parameters, such as the year of construction/refurbishment and the construction solutions used, to enable the creation of more precise groups of buildings to analyze;
To assess for the specific context which parameter (e.g., number of beds, net floor area, number of patients/year) has a better correlation with the consumption of resources and production of waste.


