Article

The Evaluation of Water Footprints and Sustainable Water Utilization in Beijing

1
State Key Laboratory of Urban and Regional Ecology, Research Center for Eco-Environmental Sciences, Chinese Academy of Sciences, Beijing 100085, China
2
Beijing Water Science and Technology Institute, Beijing 100048, China
3
Department of Quantitative & Technical Economics, Graduate School of Chinese Academy of Social Sciences, Beijing 102488, China
*
Author to whom correspondence should be addressed.
Sustainability 2015, 7(10), 13206-13221; https://doi.org/10.3390/su71013206
Submission received: 5 June 2015 / Revised: 24 August 2015 / Accepted: 22 September 2015 / Published: 25 September 2015
(This article belongs to the Special Issue Water Footprints and Sustainable Water Allocation)

Abstract

:
The water footprint approach is superior to the traditional approaches applied in water management. The water footprint can be regarded as a comprehensive indicator of freshwater resources appropriation, next to the traditional and restricted measure of water withdrawal. This study took the megacity of Beijing in North China as a case study to evaluate the sustainability of water utilization by calculating the water footprint in 2007 and 2010, based on real and virtual water consumption. The results show that the water footprint of the inhabitants of Beijing is decreasing, while the degree of water import dependency is increasing. Although the pressure of water scarcity in Beijing was slightly alleviated, the current situation of water shortage remains an enormous challenge, as the water footprint per capita is nearly 10 times higher than the water resources available. Therefore, water utilization in Beijing remains unsustainable. The improvement of water resources utilization efficiency, that encompasses water saving, is proposed as a key measure in the mitigation of water shortage.

Graphical Abstract

1. Introduction

Traditional water resource management mainly focuses on the management of domestic water supply, production, and ecological conservation. However, the current water management strategies, which are concerned with the demand and supply of available water, do not promote water conservation. Water resources include the material recycling of aquatic products, and they also play key roles in local ecology and social water recycling. A water footprint is based on the theory of virtual water [1], and is the amount of water consumption used for the production of commodities and services, especially those supporting particular consumers. The water footprint represents the real water consumption that actually supports the production of commodities and domestic services [2]. Thus, the calculation of the water footprint can include the actual and virtual water consumption, as well as local and extraneous water resources. It reflects the relationship between water resource consumption, and economic and social development due to systematic interactions between anthropogenic production, consumption activity, and water resources.
There have been many domestic and overseas research studies on water footprints. They have mainly focused on areas with water resource shortages [3]. At the spatial and temporal scales, the water footprint represents the distribution of water consumption activities at different spatial positions and at different magnitudes, which means that it has spatial characteristics. International research concerning water footprints tends to focus on large scales, such as the global, national and district scales, but recently more studies have addressed smaller scales [4] or the drainage basin scale, such as the drainage basins of Lake Naivasha and the Guadiana River [3]. However, few studies have evaluated the regional water footprint at a smaller scale and have instead focused on the national scale [5,6]. China is supposed to be one of three countries with the largest water footprint [7], which indicates that water consumption is very high. Furthermore, the water footprints among various provinces or inside the same province are significantly different due to variations in water resource distribution, population, and economic development. Based on this, there is a need to accurately analyze the regional water footprint at a smaller spatial scale in China. Most overseas studies usually calculate the water footprint of agricultural and animal products. Chapagain et al. [8,9] calculated the water footprint caused by the worldwide cotton production, water consumption by tea and coffee production in The Netherlands, and the water footprints of secondary industry and tertiary industry. Most domestic studies mainly target agricultural and animal products with little attention being paid to water consumption by industry and tertiary industry, especially with regards to the environment. The failure to investigate the water footprints caused by these sectors generally causes significant differences between water footprints in the same region. Currently, the quantitative methods for international water footprint calculations are “bottom-up approaches” and “top-down approaches” [2]. In China, these approaches have been limited because most regions in China lack long-term statistics about industrial and household water consumption.
As an international megacity with over ten million people, the sustainable development of Beijing is restricted by water scarcity and pollution. This has led to the overexploitation of underground water and a reduction in influx water. The situation has been exacerbated by a lack of rainfall. This means that the ecosystems in Beijing are severely threatened due to water depletion [10]. Recently, some studies have focused on the analyses and exploration of the Beijing water footprint, and the results have consistently shown that virtual water consumption was far greater than real water consumption [11,12], and that the external water footprint was rising sharply [13,14] as water utilization in Beijing increased. However, few studies have evaluated sustainable water utilization in Beijing. Therefore, this study attempts to analyze the Beijing water footprint characteristics by using “bottom-up approaches” and “input–output (IO) analysis” to evaluate the sustainable utilization of the water resource based on the water footprint calculation. The results should aid the coordinated development of water conservation and an eco-society.

2. Study Area

Beijing is the capital of China. It has a northern latitude from 39°26′ to 41°05′ and an eastern longitude from 39°26′ to 41°05′, and covers an area of 16,410.54 km2. The average precipitation between 1956 and 2000 was about 584.7 mm, with 576.9 mm falling in mountainous areas and 597.2 mm on the plains. The precipitation in the mountainous areas was 3.4% smaller than in the plains. The ground water resource generated by local precipitation was 17.7 × 10⁸ m3, which was made up of 11.6 × 10⁸ m3 from mountainous areas and 6.1 × 10⁸ m3 from the plains. Overall, the ground water resource was 25.6 × 10⁸ m3 or 19.7 × 10⁸ m3 after deducting ground water infiltration. Beiyun River, Yongding River, Chaobai River, Jiyun River, and Juma River are the five river systems in Beijing territory. The Beiyun River originates in inner Beijing and the origins of the other rivers are located outside Beijing. The annual water influx was 21.1 × 10⁸ m3 with an output flow of 19.5 × 10⁸ m3.

3. Methods and Data

3.1. The Calculation Methods of the Water Footprint of Beijing

The Beijing water footprint is the sum of the real water footprint (real water consumption for residential living and environment protection) and the virtual footprint in this study, and represents the total amount of direct and indirect water consumption by commodity and service production for local residents. The water footprint calculation is simplified as follows:
WF = RWF + VWF = IWF + EWF = N × wf
In the above equation, WF, RWF, and VWF represent the total water footprint, real water footprint, and virtual water footprint, respectively; IWF is the internal water footprint caused by production and services supply, and EWF is the external water footprint; N represents the total population size; and wf representing water footprint per capita.
The real and virtual water footprints can be calculated as
RWF = RWC + EWC
VWF = AWC + LWC + TVC
where RWC represents residential water consumption for livelihood and EWC represents the environmental water consumption for the purpose of maintaining the ecological processes and functions of rivers and lakes in Beijing through water supplement. VWF is the virtual water footprint and it can be calculated from the sum of the virtual water needs for commodities and services consumed by humans in the study area [15]. AWC, LWC, and TVC reflect local agricultural water consumption, local non-agricultural water consumption, and net virtual water inflow due to trading, respectively. The data were obtained from the Beijing Municipal Bureau of Statistics and the Beijing Water Authority.

3.2. The Evaluation Indexes for Sustainable Water Resource Utilization in Beijing

In this study, three evaluation indexes were applied. These were the water scarcity (WS), water self-sufficiency (WSS), and water import dependency (WD) indexes. They are calculated as follows:
WS = WF/WA
WSS = IWF/WF
WD = EWF/WF
where WS represents the ratio of the water footprint to available water supply (WA), which indicates the extent of developmental impacts on local water supply. When WS > 1, it shows that the water supply meets human consumption needs. The larger is the WS value, the greater is the water deficit. When 0 < WS < 1, the carrying capacity of the water resource can cover consumption. Generally, WS is greater than 0.
WSS represents the ratio of the internal water footprint to the total water footprint. When WSS = 1, it shows that the local water resource can supply human consumption with high margins of self-sufficiency. When 0 < WSS < 1, then the local water resources cannot meet the local water demand and there needs to be importation of water from an external water resource. When WSS declines, the demand for external water resources becomes greater than the internal resource. Generally, WSS is greater than 0. WD represents the ratio of the external water footprint to the total water footprint.
We obtained data from the statistical yearbooks of the Beijing Municipal Bureau of Statistics and the Beijing Water Authority for 2007 and 2010. Some data about the water consumption by industrial sectors were also provided by the Beijing Water Authority.

4. Results and Analysis

4.1. The Water Footprint of Beijing

4.1.1. Water Consumption by Residents and for Environmental Conservation

The residential water consumption and environmental water consumption data were retrieved from the water consumption data listed in “Energy, Resource and Environment” section in Beijing Statistical Yearbook in 2007 and 2010. In 2007, the water resources consumed by residents and for environmental conservation amounted to 9.65 × 10⁸ m3 and 2.7 × 10⁸ m3, and were 10.76 × 10⁸ m3 and 3.97 × 10⁸ m3 in 2010, respectively.

4.1.2. Agricultural Water Consumption

Water consumption by agricultural activities is the amount of water used to produce plant and animal products. The virtual water consumption for agricultural products included water consumptions due to irrigation and soil absorption, and water consumption by animals, such as water for feeding, cleaning, and slaughter. In this study, agricultural water consumption refers to the total amount of virtual water used through the consumption of agricultural products and relevant services by inhabitants in Beijing, which can be calculated by multiplying the consumption quantity of various agricultural products by their water content factors per unit. Generally, the main sources of agricultural production in Beijing are domestic production and the net import of products from areas external to Beijing after deducting the products exported to other provinces and overseas regions. The former is the local agricultural virtual water consumption and the latter is the agricultural virtual water consumption. Due to the lack of trading statistics for agricultural products in Beijing, we had to estimate them based on the proportional relationship between the quantity of trade value and the domestic consumption value retrieved from “Beijing input–output (IO) table” [16]. We then categorized agricultural water consumption into domestic virtual water consumption and the virtual water consumption by trade.
The data related to the water content of agricultural products was acquired from the CLIMWAT database, which is a climatic database used for the calculation of water demand, irrigation supply, and irrigation scheduling for various crops for a range of climatological stations worldwide. The database for Beijing was provided by the Food and Agriculture Organization (FAO), with reference to the calculation results of some peer studies [17,18] in China. The statistics reflecting the yield of agricultural products were also from agriculture and rural economy section in the Beijing statistical yearbooks in 2007 and 2010. The consumption of agricultural products can be divided into two components: urban resident consumption and rural resident consumption. The data for the rural resident can be required directly from the statistics about the daily food consumption per capita by 3000 families. However, the lack of urban resident consumption data meant that it was calculated from the expenditure on food per capita by 5000 unban families, based on the average food prices over one year. The annual prices of food products in Beijing were estimated by local annual price indices on the basis of Chinese various food products’ prices in 2012. The annual price indices in Beijing were obtained in Beijing statistical yearbook in 2007 and 2010, and the Chinese food products’ prices were obtained in China price statistical yearbook in 2013. The agricultural products were categorized into eight sectors, which were grain, vegetable and mushroom, edible oil, meat, poultry and egg, dairy product, aquatic product, and fruit. Their water footprints were calculated by the method mentioned above, and are shown in 
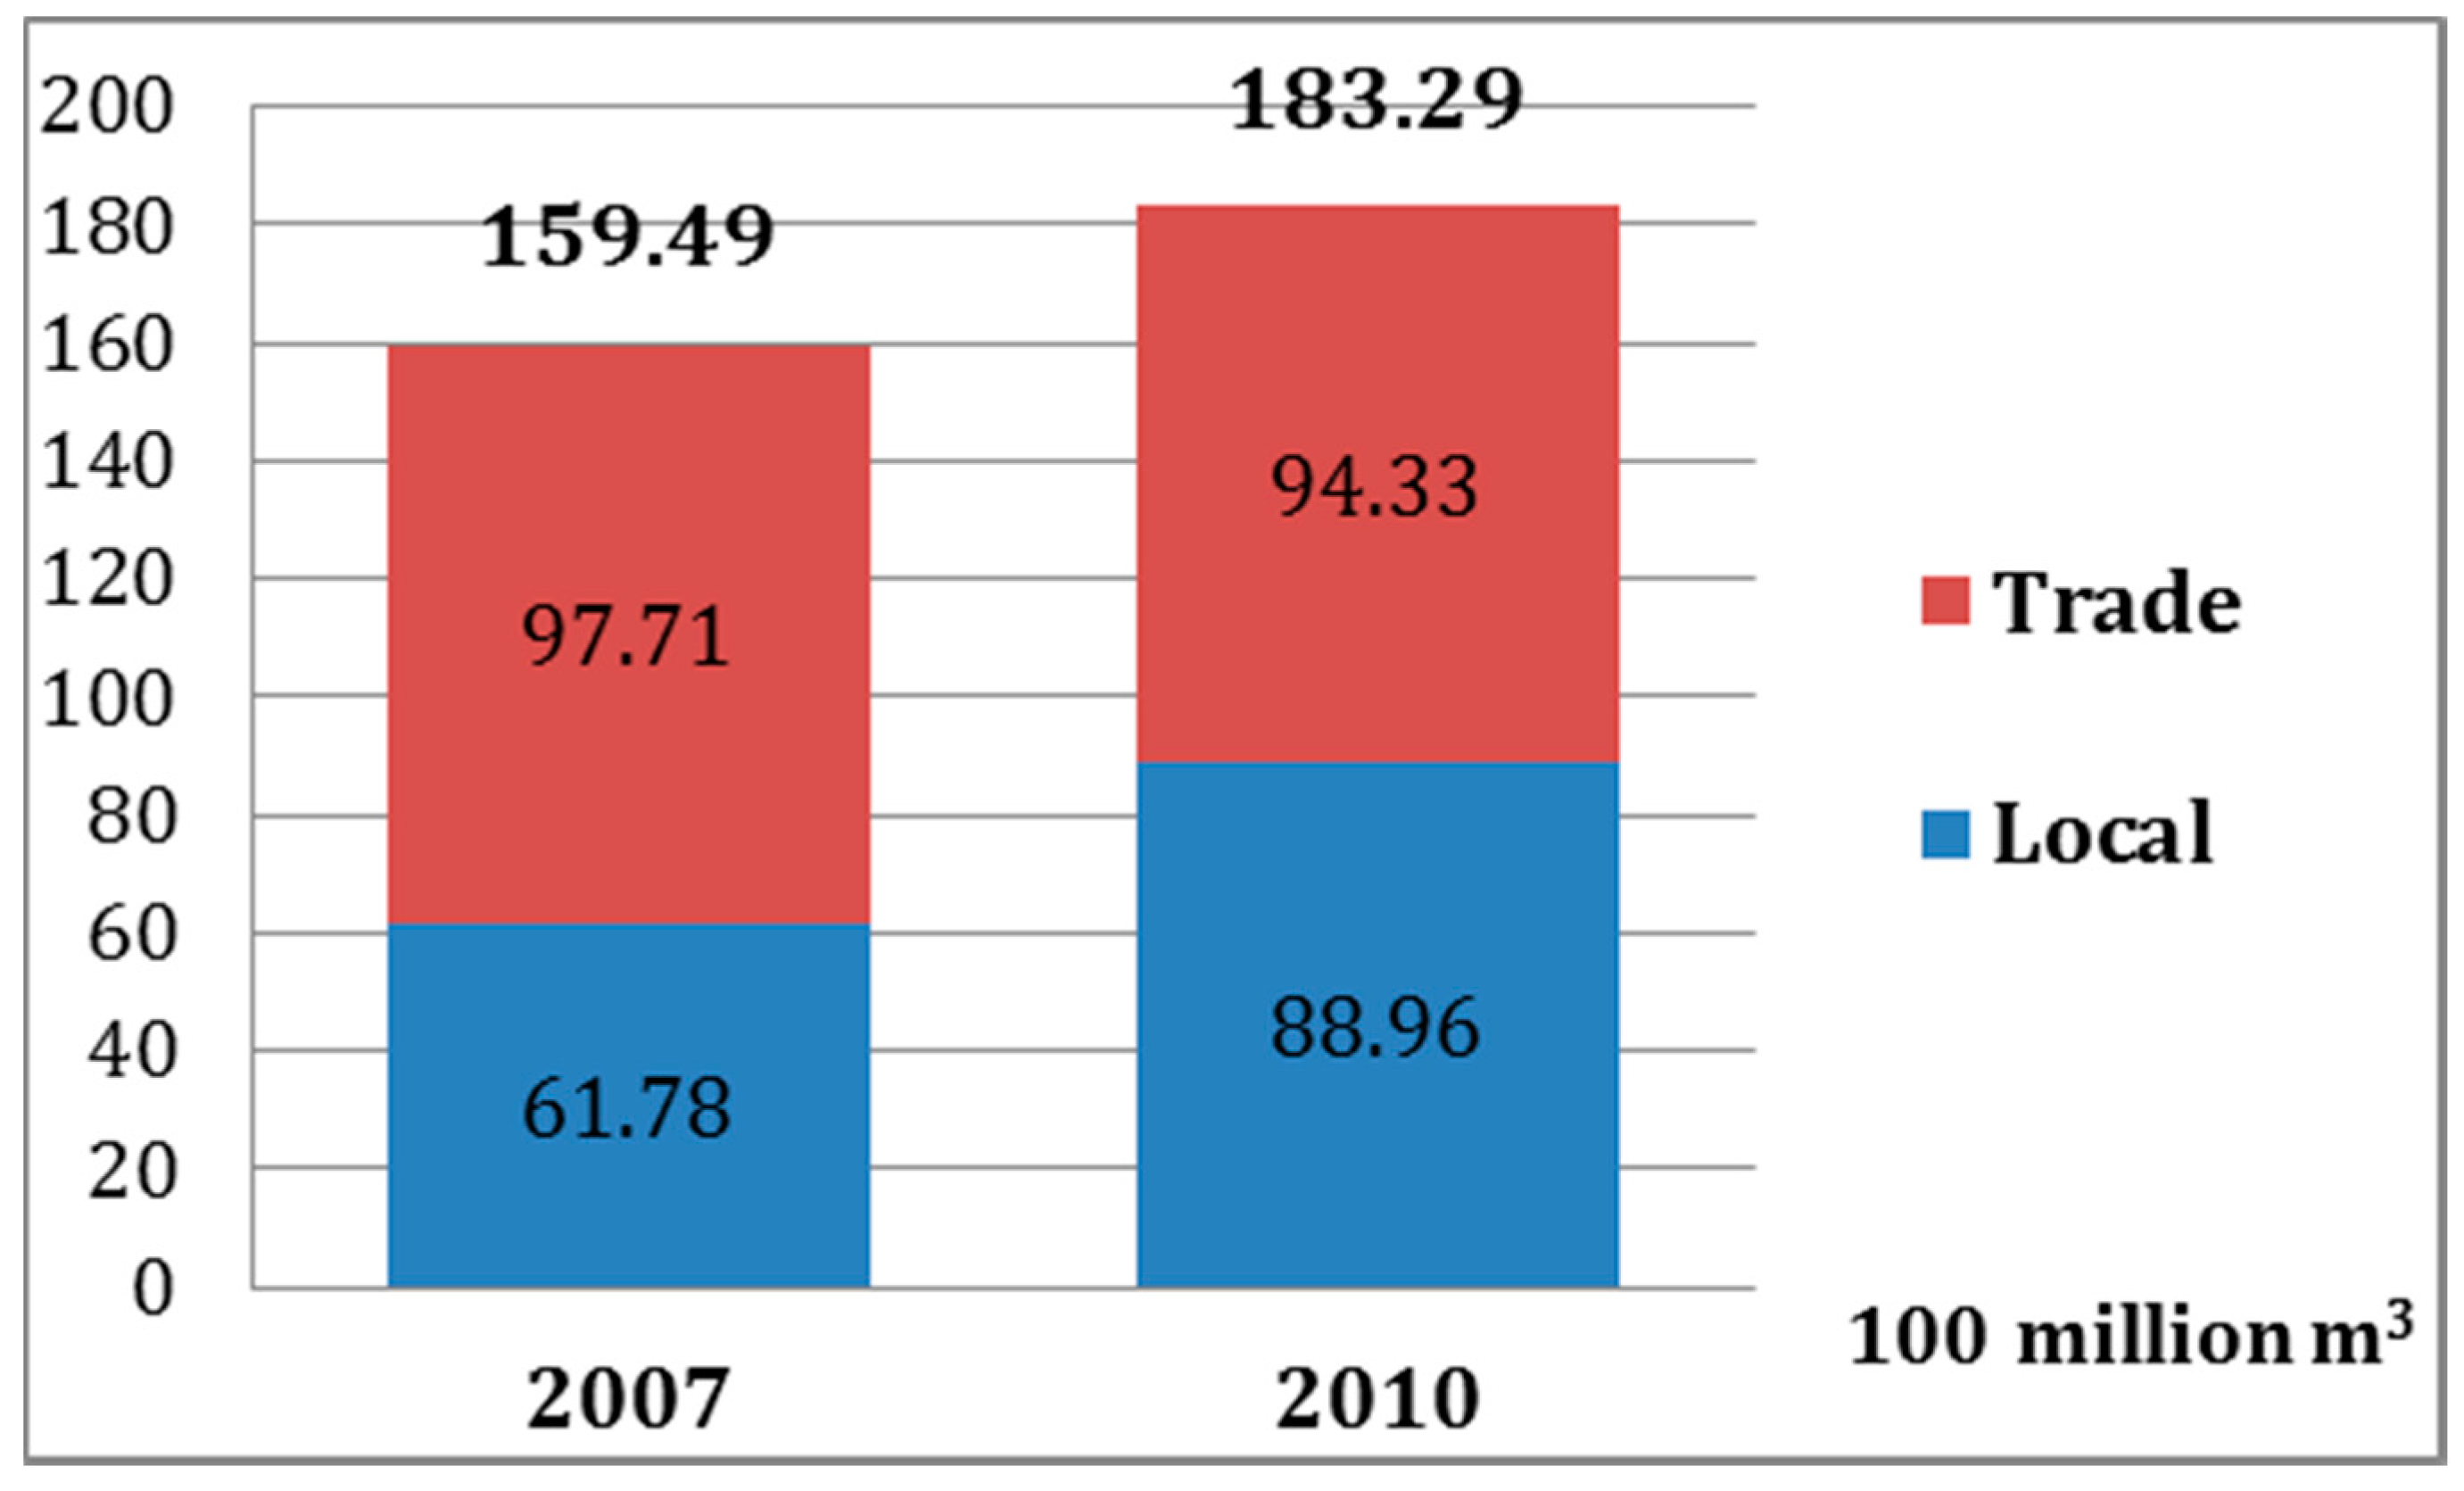
Table 1. It is clear that the total virtual water amounts due to the consumption of agricultural products in Beijing were 159.49 × 10⁸ m3 in 2007 and 183.29 × 10⁸ m3 in 2010. According to the IO table, 61.27% and 51.46% of the agricultural products consumed were origin from net import in 2007 and 2010. Based on these percentages, the agricultural virtual water consumption by trade was 97.72 × 10⁸ m3 in 2007 and 94.32 × 10⁸ m3 in 2010 with domestic virtual water consumption being 61.78 × 10⁸ m3 and 88.96 × 10⁸ m3, respectively (Figure 1).
Table 1. Water consumed by the production of agriculture products in 2007 and 2010 (100 million m3).
YearGrainVegetable and MushroomEdible OilMeatPoultry and EggDairy ProductAquatic ProductFresh and Dried FruitsTotal
200720.0525.077.2314.1710.3253.0318.8110.81159.49
201023.8329.099.6115.7311.7761.2619.3612.65183.29
Figure 1. Virtual water consumption by local agriculture production and trade.
Sustainability 07 13206 g001

4.1.3. Water Consumption by Industry

In the production sectors of Beijing, water consumption not only occurs during the general processes of production, but also includes water consumption by other products from external sectors, which will be consumed as an intermediate input. Therefore, these direct and indirect water consumptions should be included in the water consumption value for the sector [19]. Considering the sector correspondence of Beijing input–output (IO) Table, the production sectors were categorized into three groups, including primary, secondary and tertiary industrial sectors in China. Given that the primary industrial sector generally refers to agricultural sector, the industrial water consumption here represents the water consumption by other industrial sectors. Different from the method used in the calculation of agricultural water consumption in the previous chapter, IO table was used in secondary and tertiary industrial water consumption, since it can specify how the water flow among sectors through supplying inputs for the outputs (where virtual water is embedded) in the Beijing economic system [14]. Thus, an IO method analysis was applied to calculate the cumulative water utilization of each sector based on the known amount of direct water consumption. The IO analysis included input–output table data published by national or regional statistical departments (Table 2), which reflects the constructional associations between production sectors and consumption.
Table 2. The standard format China-IO (input–output) table for the water footprint calculation of secondary and tertiary industrial sectors.
Intermediate ConsumptionFinal ConsumptionExportImportTotal Output
Intermediate inputxijƒieimixi
Added valuecj
Total inputxj
Water consumptionwj
The matrix of direct consumption coefficients in each sector for 42 sectors can be set as A, which reflects the direct consumption by external products needed for internal production:
A = ( a i j ) 42 × 42 = ( x i j X j ) 42 × 42
With the exception of the direct consumption by an intermediate product, the production in a certain sector is also affected by water that is indirectly consumed by products from other sectors that have been involved in producing this intermediate product. In this study, B represents the matrix of cumulate demand coefficients, which reflects the total demand for the intermediate and additional products needed to product one unit of final product in one sector, including the amount of direct demand A, the amount of indirect demand A2 + A3 + …, and the amount of final demand I. The equation related to the variables above can be written as
B = ( I A ) 1 = ( b i j ) 42 × 42
where (I − A)−1 is known as the Leontief inverse matrix and bij denotes how much production output by sector j is required to meet one monetary unit of the final consumption of sector i.
In order to link the monetary output to water consumption, the direct water consumption coefficients are defined as the amount of direct water used to produce one monetary unit of product output, which indicates the direct water use (d) of a sector. The matrix for direct water consumption D is expressed as
D = ( d j ) 1 × 42 , d j = w j / X j
Therefore, the matrix for cumulative water consumption can be shown as
V = ( v j ) 1 × 42 = D × B
where vj represents the cumulative water consumption needed to produce a certain product in j sector. In conclusion, the matrices for the water footprints caused by domestic industrial sectors can be shown as follows:
W F = ( w f j ) 1 × 42
w f j = v j × f i
where i is equal to j, and wfj represents the total water resource utilization caused by the consumption of a product from j sector.
The virtual water resource used by trading generally refers to the virtual water used by commodities for import and export in Beijing. According to the categories of trade goods, the items with a virtual water resource consumption include primary, secondary and tertiary industrial products. Our study investigated the net virtual water inflow during the trading of secondary and tertiary industrial products, and estimated the virtual water inflow of agriculture products, which was described separately above because of the lack of actual trade statistics for agriculture products in Beijing.
The virtual water embodied in the net import of secondary and tertiary industrial products is regarded as the cumulative water consumption of products during net trade flow, which will be later consumed by inhabitants in Beijing. This part of virtual water consumption is not the real amount of water consumed by production in Beijing, but the water Beijing would consume if it had to produce a product itself instead of importing it. The equations for virtual water consumption during trading are as follows:
W F = ( w f j n e t ) 1 × 42
w f j n e t = v j × ( m i e i ) ( i = j )
where m i represents the sum total for imported secondary and tertiary industrial products, including the products from overseas and other provinces, and e i represents the sum of exported secondary and tertiary industrial products. The net virtual water inflow of secondary and tertiary industrial products was calculated and is shown in Table 4.
It is worth noting that IO tables for Beijing become available every five years and an extended version is available three years after publication of the original IO table. The IO table for 2012 is still unavailable, so our study adopted the IO tables for 2007 and 2010, obtained from the Beijing statistical bureau website, to calculate the water consumption by various sectors.
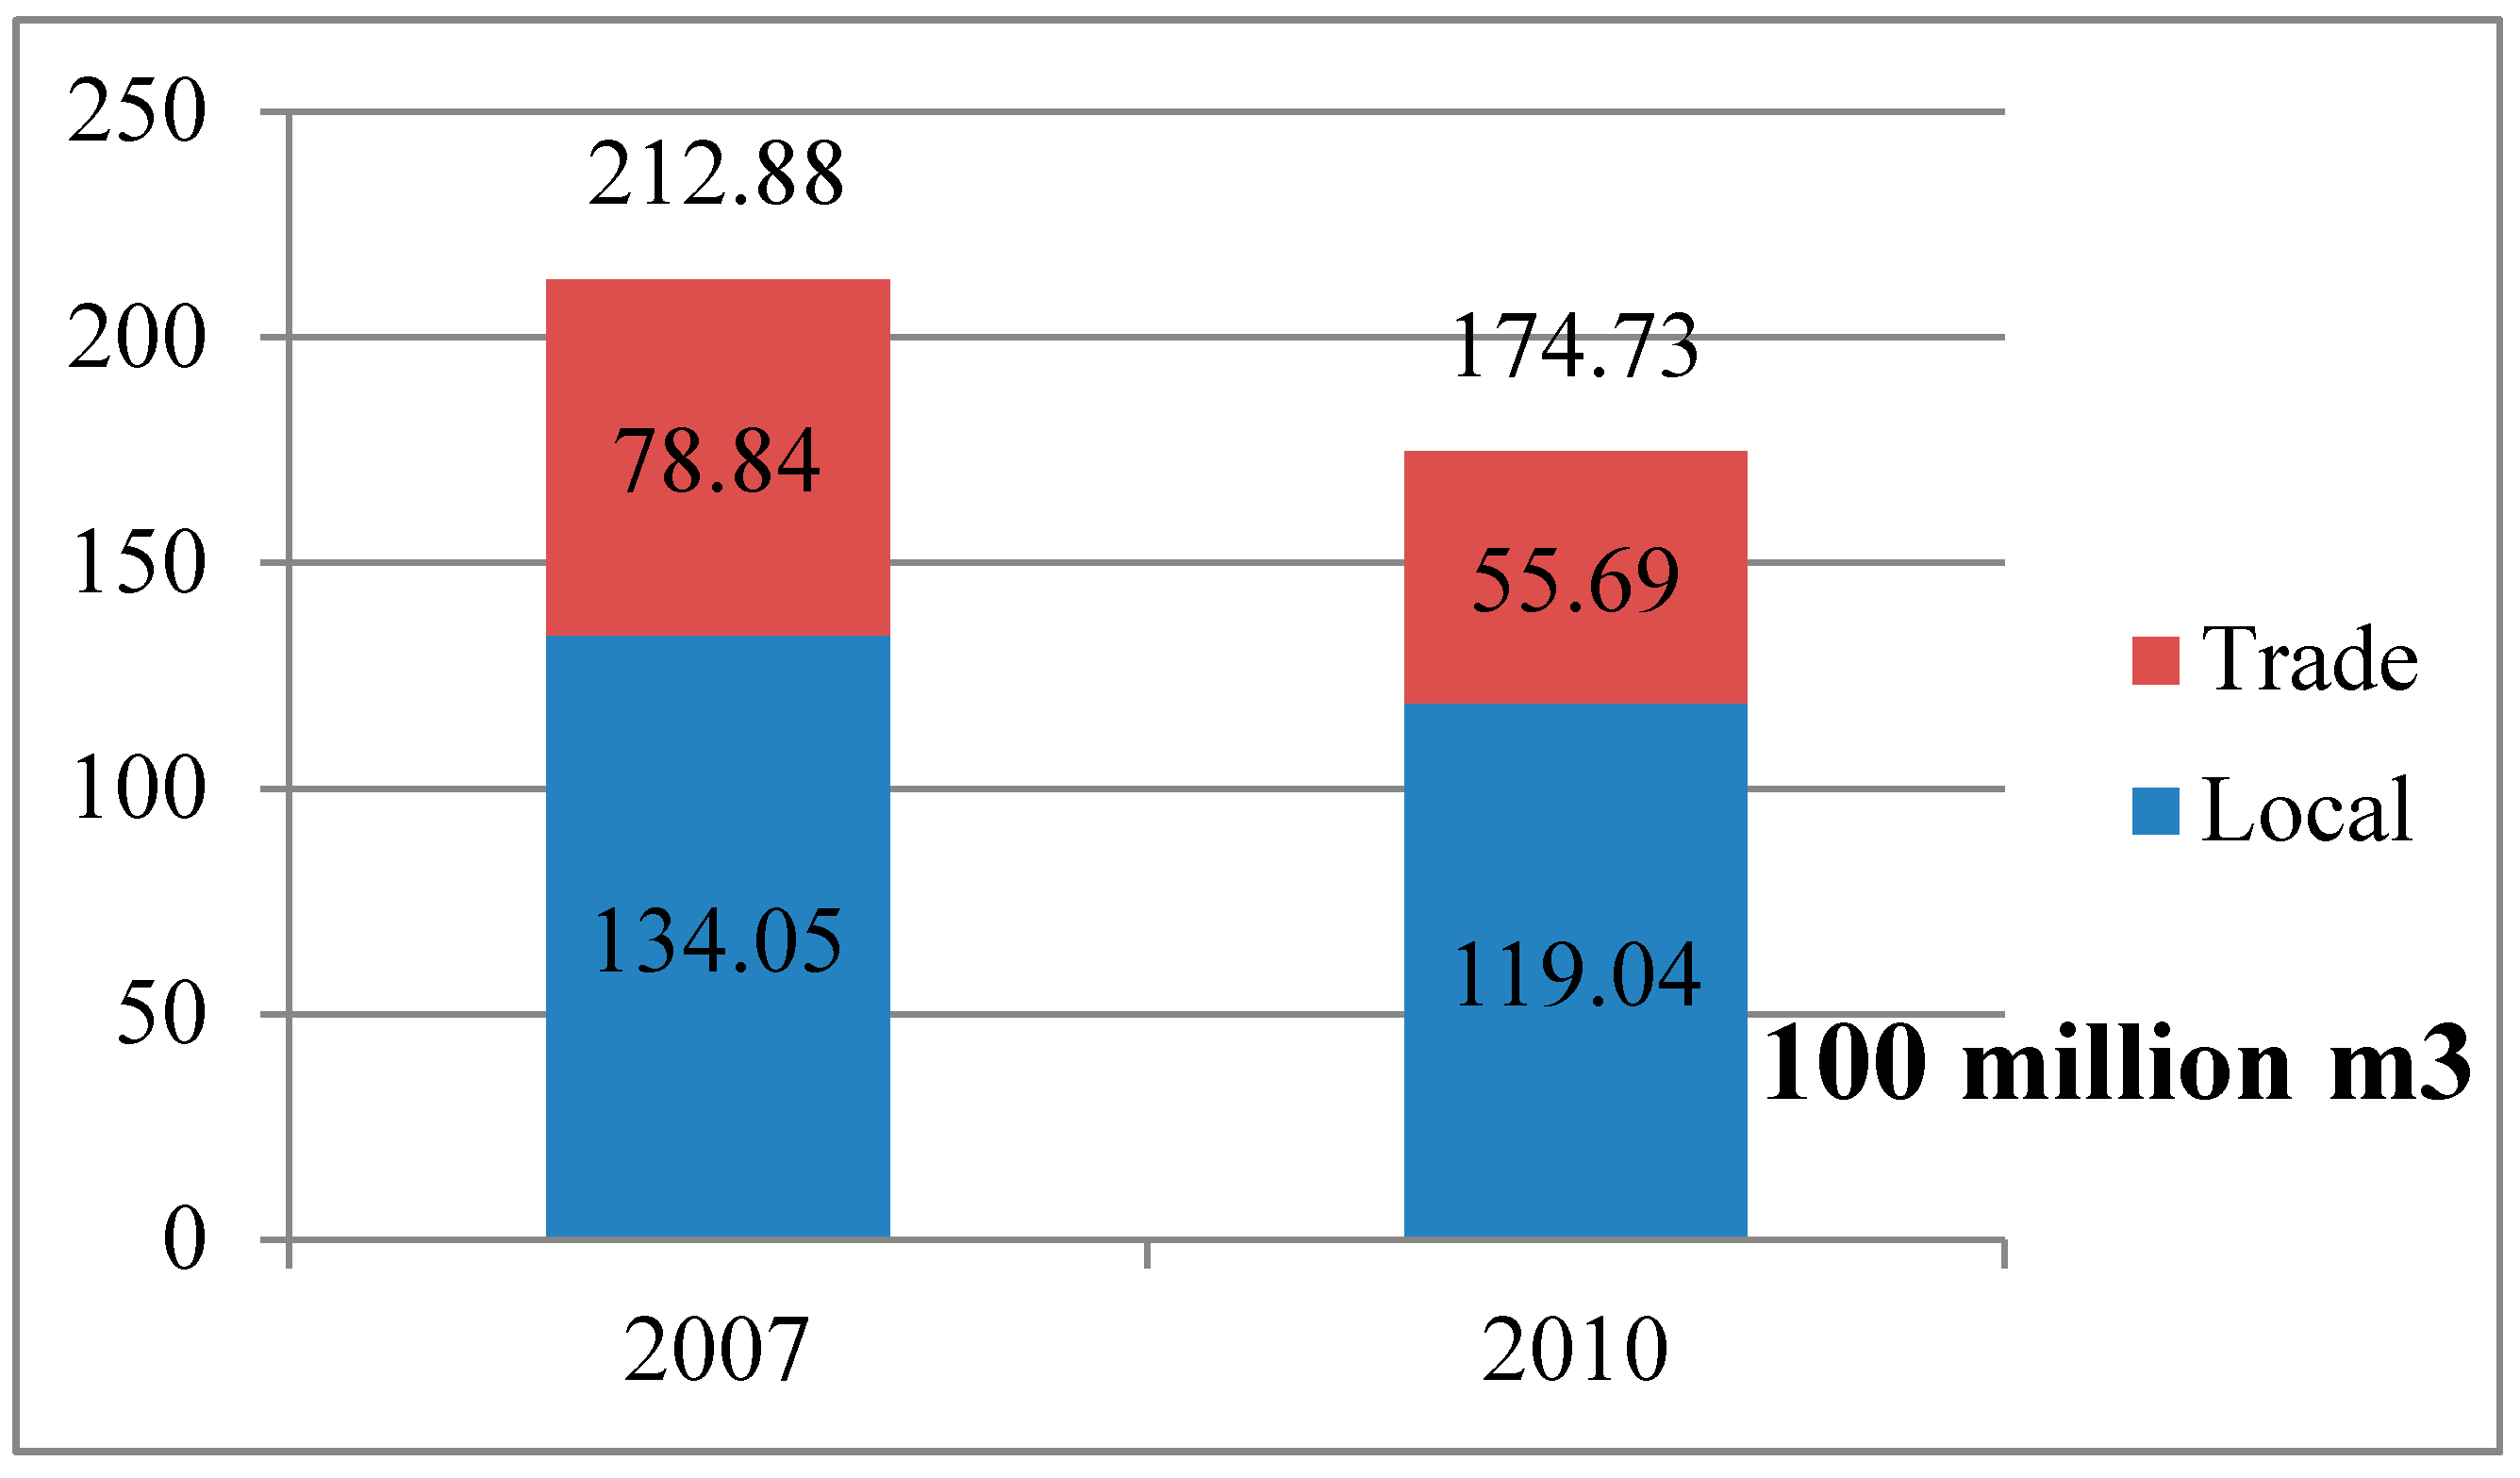
As the results in Table 3 show, the virtual water resource consumed by domestic secondary and tertiary industrial sectors was 134.05 × 10⁸ m3 in 2007 and 119.04 × 10⁸ m3 in 2010; The virtual water consumption by the production of secondary and tertiary industrial products in trading was 78.84 × 10⁸ m3 in 2007 and 55.69 × 10⁸ m3 in 2010 (Table 4). Thus, the total water footprints caused by the secondary and tertiary industrial production are the sum of the virtual water consumption by domestic production and by trading (Figure 2).
Table 3. The water consumptions by various industrial sectors in 2007 and 2010 (× 10 thousand m3).
Secondary and Tertiary Industrial Sectors20072010
Direct Water UseCumulative Water UseDirect Water UseCumulative Water Use
Secondary industry Mining and washing of coal185.601163.09399.76949
Extraction of petroleum and natural gas6.540.00136.50485
Mining of metal ores1242.360.0072,743.080
Mining and processing of nonmetal ores and other ores54.820.00 17.100
Manufacture of foods and tobacco8975.9151,689.178890.6138,102
Manufacture of textiles635.544669.77409.055689
Manufacture of textile wearing apparel, footwear, caps, leather, fur, feather (down) and its products128.798660.71224.0810,871
Processing of timbers and manufacture of furniture186.494778.77173.853391
Papermaking, printing and manufacture of articles for culture, education and sports activities1951.172033.831513.881924
Processing of petroleum and nuclear fuel, and coking146,905.6419,712.01145,789.1133,571
Chemical industry72,232.8825,097.1591,455.6327,996
Manufacture of nonmetallic mineral products7761.061042.578712.93693
Smelting and rolling of metals106,653.700.0012,657.950
Manufacture of metal products2267.0511,112.792012.747094
Manufacture of general purpose and special purpose machinery2484.9742,893.654723.2957,942
Manufacture of transport equipment7559.2723,419.8411,765.7617,270
Manufacture of electrical machinery and equipment735.8922,730.48764.719947
Manufacture of communication equipment, computer and other electronic equipment37,114.6921,430.3021,444.2616,355
Manufacture of measuring instrument and machinery for cultural activity and office work633.702462.22394.691419
Handiwork and other manufacture337.957812.40478.206948
Waste disposal2.190.0027.740
Production and supply of electric power and power for heat218,009.5036,195.82259,383.1728,,338
Production and distribution of gas410.76873.46120.831671
Production and distribution of water2215.072800.557049.735301
Construction and other industry6497.216497.21569,371.078229.60
Tertiary industry Traffic, transport and storage2821.2811,862.233058.0910,840
Post industry188.8751.53182.1532
Information transmission, computer services and software564.5257,656.67670.5258,250
Wholesale and retail trades1925.6612,098.522448.2914,123
Hotels and catering services6083.2216,972.257428.7824,468
Financial intermediation646.2012,711.97608.1322,830
Real estate5262.7048,855.767003.8581,214
Lease and commercial service industry2013.125690.792829.467583
Research and development1227.4541,267.621276.8449,350
Synthesis technique services793.8832,792.66918.027095
Water supply, environment, and public facilities management4915.089747.915936.518362
Service to households405.026876.16379.715173
Education6917.4443,683.697421.0440,306
Sanitation, social insurance, and welfare2419.9097,842.902740.99150,620
Culture, sports, and entertainment1457.7321,557.911676.5820,260
Public management and social organization3005.7460,840.91 3412.5667,346
Total665,836.541,340,459.12707,509.791,190,414.25
Table 4. Virtual water consumption by the trade in secondary and tertiary industrial products (10 thousand m3).
Year20072010
Secondary industryMining and washing of coal8024.52−474.29
Extraction of petroleum and natural gas14,144.2515,868.68
Mining of metal ores21,912.44−21,036.92
Mining and processing of nonmetal ores and other ores22,165.2621,185.23
Manufacture of foods and tobacco18,083.2319,378.47
Manufacture of textile7004.7910,361.16
Manufacture of textile wearing apparel, footwear, caps, leather, fur, and feathers (down) and its products4019.289859.74
Processing of timbers and manufacture of furniture11,451.627599.93
Papermaking, printing, and manufacture of articles for culture, education, and sports activities35,810.5928,178.07
Processing of petroleum, coking, processing of nuclear fuel134,576.4863,384.70
Chemical industry98,716.4696,056.17
Manufacture of nonmetallic mineral products50,831.1331,388.03
Smelting and rolling of metals361,224.02315,652.08
Manufacture of metal products69,917.3748,511.43
Manufacture of general purpose and special purpose machinery−1717.372099.94
Manufacture of transport equipment−25,720.14−44,095.49
Manufacture of electrical machinery and equipment55,185.2738,681.22
Manufacture of communication equipment, computers, and other electronic equipment41,259.8861,146.87
Manufacture of measuring instruments, and machinery for cultural activities and office work6299.592620.33
Handiwork and other manufacture6207.804386.43
Waste disposal4055.45−164.24
Production and supply of electric and power for heating51,156.0238,712.94
Production and distribution of gas1631.034601.31
Production and distribution of water17.1311.81
Construction and other industry152,844.66−4098.74
Tertiary industryTraffic, transport and storage−51,981.9793,430.83
Post industry−4138.36−3679.97
Information transmission, computer services and software−87,996.66−65,889.29
Wholesale and retail trades−12,840.16−819.82
Hotels and catering services−4225.98−1887.18
Financial intermediation−41,316.14−66,908.97
Real estate−1041.61−699.77
Lease and commercial service industry−23,667.37−57,324.39
Research and development−2159.164247.77
Synthesis technique services−111,680.02−136,178.91
Water supply, environment, and public facilities management−7460.44−9368.77
Services to households2.77−96.85
Education−11,569.78433.81
Sanitation, social insurance, and welfare−1503.2852,364.24
Culture, sports, and entertainment−2316.33−1726.07
Public management and social organization3182.181197.50
Total788,388.46556,909.01
Figure 2. Water consumption by non-agricultural locally produced products and by trading.
Sustainability 07 13206 g002

4.1.4. The Total Water Footprints of Beijing

The water footprints for all real and virtual water resources consumption by all the sectors in Beijing were 384.72 × 10⁸ m3 in 2007 and 372.75 × 10⁸ m3 in 2010 (Table 5). The industrial production sector was the largest consumer of water in Beijing in 2007, while agricultural water consumption contributed the most to total water consumption in 2010. Generally, the water footprint of Beijing had decreased by 11.97 × 10⁸ m3 over three years.
Table 5. Components of the Beijing Water footprint (100 million m3).
ResidentEnvironmentAgricultureIndustryTotal
IWFEWF IWFEWF
20079.652.70159.4961.7897.71212.88134.0578.84384.72
201010.763.97183.2988.9694.33174.73119.0455.69372.75

4.2. The Sustainability of Water Utilization in Beijing

4.2.1. The Water Consumption by Beijing and Its Inhabitants

Beijing will experience a water resource shortage over the long term. According to the annual water resource quantity in Beijing, the available water resource for inhabitants was less than 300 m3, which is far below the national average level (1/8) and the international level (1/30), and remains lower than the international standard minimum of 1000 m3 per capita. Based on the annual water resource amount (21.2 × 10⁸ m3) between 1999 and 2010 and the population of Beijing (19.61 million) reported by the sixth nation-wide census, the water resource per capita remained at 108 m3 in 2010.
The number of residents in Beijing was 16.33 million in 2007 and 19.61 million in 2010, while the water footprints per capita were 2355.91 m3 in 2007 and 1900.82 m3 in 2010. Given that the water footprint per capita was around 10 times more than the water resource available for one inhabitant, Beijing needed to consume more virtual water to meet the very high demand for water consumption.
Compared with the water footprint in 2007, it is clear that the 2010 footprints from residents, the environment, and agriculture increased, whereas those from industry decreased. By 2010, the proportions due to the residential and environmental water footprints were 2.89% and 1.07%, respectively, and were mainly derived from real water resource consumption. The water footprints caused by industries explained 46.88% of the total water footprint of Beijing. The proportions for the external water footprint and the internal water footprint were 14.94% and 31.94%, respectively. The agricultural water footprint represented the largest percentage of the total footprint (49.17%), the external water footprint (25.31%), and the internal water footprint (23.87%). In 2010, the food demand for grains and vegetables strongly relied on water imports. The results indicated that Beijing maintained local water consumption mainly through consuming virtual water.

4.2.2. Evaluation of Water Resource Utilization

The rainfall and hydrological inflow are main sources of water resources in Beijing, which supports the sustainable development of the social economy and ecosystem restoration in the capital. The regional climate characteristics result in the uneven rainfall distribution in Beijing and the majority of the precipitation (85%) occurs from June to September. A wet period generally lasts two or three years with a maximum of six years, while the longest recorded dry period was 20 years. The high frequency of dry periods means that the available water resource for Beijing is limited. For example, the annual rainfall between 1999 and 2010 decreased by 19% compared to previous annual precipitation. Meanwhile, the amount of local surface water and the groundwater resource fell by 59% and 33%, respectively. This means that the total water resource decreased by 43%. With regards to the hydrologic inflow supplement, Beijing mainly relies on the water supply from the two biggest reservoirs (Miyun and Guanting) and from other provinces. Due to the negative impacts of climate change and increased water consumption in upstream regions, the annual inflow into the area over the same period decreased by 77%. There was also a 79% reduction from the reservoir supply.
Beijing lacks the available water resources mentioned above, which means that there is no extra water for environmental protection, especially with the sharp increase in population. By 2010, the population of Beijing had reached 18 million, which was the upper limit for 2020 set by governmental strategy [20]. The growing population increases the demand for residential water consumption, but the completed construction of the “South to North Water Diversion Project (SNWDP)” for water supply was delayed to 2014. These factors contributed to the water shortage in Beijing and this situation will be exacerbated by the continuous demand for water resources as the population continues to grow and the natural water resources become more limited.
The amounts of water supplied to Beijing were 34.8 × 10⁸ m3 in 2007 and 35.2 × 10⁸ m3 in 2010, and the WS indexes were 11.06 and 10.59, respectively. The water scarcity in Beijing in 2010 was alleviated, mainly because of the promotion of water saving measures. However, the current water resource still cannot satisfy the requirements for sustainable development. The inflow from upstream regions, such as Shanxi and Hebei provinces, was 0.31 × 10⁸ m3 in 2007 and 0.56 × 10⁸ m3 in 2010. The inflow piped by the SNWDP was about 2.56 × 10⁸ m3 in 2010 and the total inflow reached 3.12 × 10⁸ m3 in 2010. The WSS indexes for 2007 and 2010 were 54.03% and 58.92%, respectively, while the WD indexes were 45.97% and 41.08%, respectively. These indicate that the degree of dependency on external water resources was enhanced due to the local water scarcity and the construction of water supply projects, meaning that water utilization in Beijing continued to be unsustainable (Table 6).
Table 6. Evaluation of the Beijing water utilization indexes.
YearWSWSS/%WD/%Water Footprint per Capita/m3
200711.0654.0345.972355.91
201010.5958.9241.081900.82

5. Discussion and Conclusions

The variation in population density, economic development and industrial production was low within the study area, so the results of calculation were supposed to be reliable at a regional scale. The calculation methods for the water footprints were chosen based on the water consumption characteristics of different sectors. The IO analysis was used to calculate the water footprints for industry and trade. It also integrated the water footprints caused by the production and consumption sectors. However, the long five-year period between publication of the national and regional IO tables limits further research into water footprint calculations due to data hysteresis, which has negative impacts on the water footprint calculation in Beijing. The agricultural water footprint was calculated using the water content of consumed agricultural products. The lower accuracy of the results was unavoidable because of the lack of relevant measured data, but the results generally reflect the overall water consumption by agriculture. Meanwhile, the residential and environmental water footprint adopted the practical water consumption data. After the water footprint calculations and water utilization evaluations, the study drew the following conclusions:
(1) The water footprint of Beijing city and the per capita values declined between 2007 and 2010. The Beijing water footprint was 384.72 × 10⁸ m3 in 2007 and fell to 372.75 × 10⁸ m3 in 2010. Similarly, the water footprint per capita decreased from 2355.91 m3 in 2007 to 1900.82 m3 in 2010, which is still 10 times more than the available local water supply per capita. The limited local water resource failed to meet the water demand in Beijing, thus excessive consumption of virtual water is, realistically, an unavoidable approach to keep the balance of water supply and demand.
(2) By 2010, the residential and environmental proportions of the water footprint were 2.89% and 1.07%, respectively, mainly from real water resource consumption. However, the agricultural water footprint represented the largest percentage of the total footprint (49.17%). The water consumption by industrial production was 46.88% of the total; a large proportion of this (40.25%) was due to trading. These results indicate that Beijing maintained local water consumptions in the sectors of agriculture, trade, and industry, mainly by consuming virtual water.
(3) According to the water footprint results in 2007 and 2010, the degree of water scarcity in Beijing decreased slightly from 11.06 to 10.59, but the water shortage situation still remained. However, water self-sufficiency increased from 54.03% to 58.92%, and water importation dependency weakened.
Further urbanization in Beijing and climate change (i.e., more extreme weather events) are likely to increase the future challenges in water resources management water in the capital of China. To address the problems of unsustainable water resource utilization in Beijing, the improvement of water resource utilization efficiency is proposed as the key measures for mitigating water shortages. The municipal government is proposed to (1) promote the optimized allocation of water quota for different water users; (2) encourage the industrial sectors toward low water consumption through market mechanisms and bring a blacklists of large water consumers and low efficiency users to the public; (3) increase reuse rates of reclaimed water and rainwater with the introduction of environment friendly technology; and (4) encourage virtual water consumption by production to minimize the local water resource utilization.

Acknowledgments

This research was financially supported by the National Natural Science Foundation of China (Grant No. G031202) and the fund grant from the Beijing City Finance Project “The annual evaluation of sustainable development of economics and society coordinated water in Beijing” through the Beijing Water Authority (Grant No. PXM2015_035313_000031). We thank the staff at the Beijing Water Science and Technology Institute for helping to write the article. We also would like to acknowledge Prof. Hongwei Wang for her help on the methodology and results.

Author Contributions

Dongchun Ma made substantial contributions to all of the following: (1) the conception and design of the study; (2) checking the acquisition and analysis of data; (3) data interpretation; (4) drafting the manuscript and revising it critically for important intellectual content; and (5) finishing the version to be submitted.
Chaofan Xian made substantial contributions to all of the following: (1) checking the data analysis results; (2) revising the introduction and the discussion parts of the manuscript; and (3) translating the article from Chinese into English.
Jing Zhang and Ruochen Zhang undertook data acquisition and analysis.
Zhiyun Ouyang made substantial contributions to all of the following: (1) the conception and design of the study; (2) revising the manuscript critically for important intellectual content; and (3) final approval of the version to be submitted.

Conflicts of Interest

The authors declare no conflict of interest.

References

  1. Allan, J.A. Virtual water: A strategic resource global solution to regional deficits. Groundwater 1998, 36, 545–546. [Google Scholar] [CrossRef]
  2. Hoekstra, A.Y.; Chapagain, A.K. Water footprints of nations: Water use by people as a function of their consumption pattern. Water Resour. Manag. 2007, 21, 35–48. [Google Scholar] [CrossRef]
  3. Aldaya, M.M.; Llamas, M.R. Water Footprint Analysis for the Guadiana River Basin; Value of Water Research Report Series No. 35; UNESCO-IHE Institute for Water Education: Enschede, The Netherland, 2008; Available online: http://doc.utwente.nl/77200/ (accessed on 1 April 2015).
  4. Mekonnen, M.M.; Hoekstra, A.Y. A global and high-resolution assessment of the green, blue and grey water footprint of wheat. Hydrol. Earth Syst. Sci. 2010, 14, 1259–1276. [Google Scholar] [CrossRef] [Green Version]
  5. Kampman, D.A.; Hoekstra, A.Y.; Krol, M.S. The water footprint of India. Value Water Res. Rep. Ser. 2008, 32, 1–152. [Google Scholar]
  6. Zeitoun, M.; Allan, J.A.; Mohieldeen, Y. Virtual water “flows” of the Nile Basin, 1998–2004: A first approximation and implications for water security. Glob. Environ. Chang. Hum. Policy Dimens. 2010, 20, 229–242. [Google Scholar] [CrossRef]
  7. Mekonnen, M.M.; Hoekstra, A.Y. National Water Footprint Accounts: The Green, Blue and Grey Water Footprint of Production and Consumption; Value of Water Research Report Series No.50; UNESCO-IHE Institute for Water Education: Enschede, The Netherland, 2008; Available online: http://doc.utwente.nl/76913/ (accessed on 1 April 2015).
  8. Chapagain, A.K.; Hoekstra, A.Y. The water footprint of coffee and tea consumption in The Netherlands. Ecol. Econ. 2007, 64, 109–118. [Google Scholar] [CrossRef]
  9. Chapagain, A.K.; Hoekstra, A.Y.; Savenije, H.H.G.; Gautam, R. The water footprint of cotton consumption: An assessment of the impact of worldwide consumption of cotton products on the water resources in the cotton producing countries. Ecol. Econ. 2006, 60, 186–203. [Google Scholar] [CrossRef]
  10. Liu, Y.; Shen, X. Ways of solving agriculture water shortcoming in Beijing. Beijing Water Resour. 2005, 6, 29–30. (In Chinese) [Google Scholar]
  11. Sun, Y.; Lu, C.; Xie, G.; Li, N. Water footprint in Beijing. Chin. J. Ecol. 2015, 34, 524–531. (In Chinese) [Google Scholar]
  12. Wang, Y.; Wang, H.; Cai, Y. Calculation and analysis of water footprint in Beijing City. Chin. J. Eco-Agric. 2011, 19, 954–960. (In Chinese) [Google Scholar] [CrossRef]
  13. Zhang, Z.Y.; Shi, M.J.; Yang, H. Understanding Beijing’s water challenge: A decomposition analysis of changes in Beijing’s water footprint between 1997 and 2007. Environ. Sci. Technol. 2012, 46, 12373–12380. [Google Scholar] [CrossRef] [PubMed]
  14. Zhang, Z.Y.; Yang, H.; Shi, M.J. Analyses of water footprint of Beijing in an interregional input−output framework. Ecol. Econ. 2011, 70, 2494–2502. [Google Scholar] [CrossRef]
  15. Chen, J.; Zhang, S.; Hua, D.; Long, A.; Chen, B. A study on water resources guarantee in Beijing city based on water footprint evaluation. Resour. Sci. 2010, 32, 528–534. (In Chinese) [Google Scholar]
  16. Beijing Statistics Bureau. Beijing Input and Output Survey Website. 2012. Available online: http://www.bjstats.gov.cn/2012trcc/ (accessed on 28 April 2015). (In Chinese) [Google Scholar]
  17. Deng, X.; Xie, S.; Wang, L.; Huang, Y. Calculation and analysis of urban water footprint: A case study of Shanghai city. J. Subtrop. Resour. Environ. 2008, 3, 62–68. (In Chinese) [Google Scholar]
  18. Ji, S. Virtual Water Trade of Agricultural Products in China. Master’s Thesis, Qingdao University, Qingdao, China, 2008. [Google Scholar]
  19. Cai, Y.; Wang, H.; Wang, H.; Wang, H. Water footprint in the yellow river basin. J. Beijing Norm. Univ. Nat. Sci. 2009, 45, 616–620. (In Chinese) [Google Scholar]
  20. Beijing Municipal Commission of Urban Planning. The Overall Planning of Beijing City (2004–2020). Available online: http://www.china.com.cn/aboutchina/zhuanti/09dfgl/2009-03/04/content_17371797.htm (accessed on 28 April 2015). (In Chinese)

