Article

Market Participation and Agro-Biodiversity Loss: The Case of Native Chili Varieties in the Amazon Rainforest of Peru

Chair Group Agricultural and Food Economics, Center of Life and Food Sciences Weihenstephan, Technical University of Munich, Weihenstephaner Steig 22, Freising 85354, Germany
Sustainability 2014, 6(2), 615-630; https://doi.org/10.3390/su6020615
Submission received: 13 December 2013 / Revised: 20 January 2014 / Accepted: 22 January 2014 / Published: 28 January 2014

Abstract

:
Policies for promoting the in situ conservation of underutilized crop varieties include the provision of economic incentives to farmers for their market commercialization. Nevertheless, market participation could also have the counter-effect of favoring the cultivation of uniform commercial crop varieties and inducing the erosion of crop genetic diversity. The objective of this research was to identify the determinants of the in situ conservation of native chili varieties, including market participation. To this end, 128 farmers were surveyed in the Amazon rainforest region of Ucayali in Peru. The data were analyzed using probit, multinomial logit and truncated Poisson models with covariance matrix correction for cluster errors by rural community. Results suggest that participation in commercial agriculture statistically significantly increases the in situ conservation of native chili varieties; only when farmers sell their products to local retailers, but not when they supply wholesalers. In particular, this result implies that policies designed to encourage specific forms of market participation could have a positive effect on farmers’ economic well-being and simultaneously could help to achieve crop genetic diversity conservation goals.

1. Introduction

Peru is one of the world’s centers of diversity for native chilies (Capsicum spp.) [1,2]. Many varieties of this crop are underutilized and under the threat of extinction, mainly due to the lack of economic incentives for local farmers for their continued cultivation [1]. However, the conservation of crop diversity is of extreme importance to the overall society. Crop diversity is the cornerstone of long-term food security, as it provides the genetic raw material, enabling crops to adapt to changing environmental conditions, including evolving pests and climate change [3]. Crops provide diverse nutrients and substances with therapeutic properties; whereas native chili varieties are rich in vitamins, antioxidants and capsaicin, a component used for medicinal applications [4]. The conservation of crop diversity worldwide is the basis of our food supply and our survival [5]. Market-based conservation approaches, including participation in commercial agriculture, have gained significant popularity as in situ (or in place of origin) crop conservation strategies [6]. These strategies assume that because crop diversity is insufficiently valuable for local farmers to protect, one must seek to create novel or expanded markets in order to induce conservation [6]. On the other hand, there is also the fear that increased market participation in the long run could favor the replacement of traditional subsistence farming practices with more uniform agricultural practices [3]. When farmers have access to markets, they tend to progressively specialize and replace their diverse set of landraces with a few high yielding modern varieties that could provide them with higher incomes [5]. In situ conservation of crop diversity directly depends on the local farmers’ decisions to continue cultivating diverse crop varieties within the boundaries of the agricultural ecosystems. In the latter, the crops evolved due to natural and human selection processes [7]. Nevertheless, it is still unclear how to support farmers’ efforts to maintain crop diversity on their farms [5,8,9].
The objective of this research was to identify the potential factors influencing the in situ conservation of the diversity of native chili varieties, including market participation through crop sales, by local farmers. To this end, 128 farmers were surveyed in the Amazon rainforest region of Ucayali in Peru in 2010, and the data were analyzed using a probit model for the decision to cultivate native chilies and a truncated Poisson model for the decision on the number of native chilies (both models were calculated with covariance matrix correction for cluster errors by rural community). This creates a specification that relaxes the assumption that the “zeros” and the “positives” come from the same data-generating process [10]. As such, this econometric specification allows for the obtaining of different estimates for the decision to cultivate native chilies and the decision on the number of native chilies to cultivate, when these two decisions are expected to be influenced differently by the covariates or explanatory variables. Previous studies on crop diversity have used similar econometric approach (e.g., see [11]). In addition, a multinomial logit model was conducted to evaluate the determinants for specific forms of market participation (non-market participation, market sales to wholesalers or market sales to retailers).
Following [3], the sustainable livelihood approach (SLA) was used as a framework in this research to identify the potential determinants of farmers’ crop diversity conservation. SLA is a multiple capital approach in which sustainability is considered in terms of available natural, human, social, physical and financial capital [12], as shown in Figure 1. In particular, the SLA helps to emphasize the capabilities of the rural poor [3].
Figure 1. The five capitals considered in the sustainable livelihood approach.
Sustainability 06 00615 g001
Source: [12].
One critique of SLA is that the precise elements to consider within each type of capital remain undefined and context specific [12]. Specific variables within each type of capital, which were examined in the context of this research, are included in Figure 2. The classification of some of these variables under one or another type of capital was based on convenience, because some factors could influence different types of capital (e.g., plot location is related to community facilities (physical capital), but also to community ecosystem characteristics (natural capital)) at the same time.
Figure 2. Potential factors influencing in situ conservation of agro-biodiversity.
Sustainability 06 00615 g002
A brief description of the five types of capital, as well as the expected sign of the variables considered in this research, is included below:
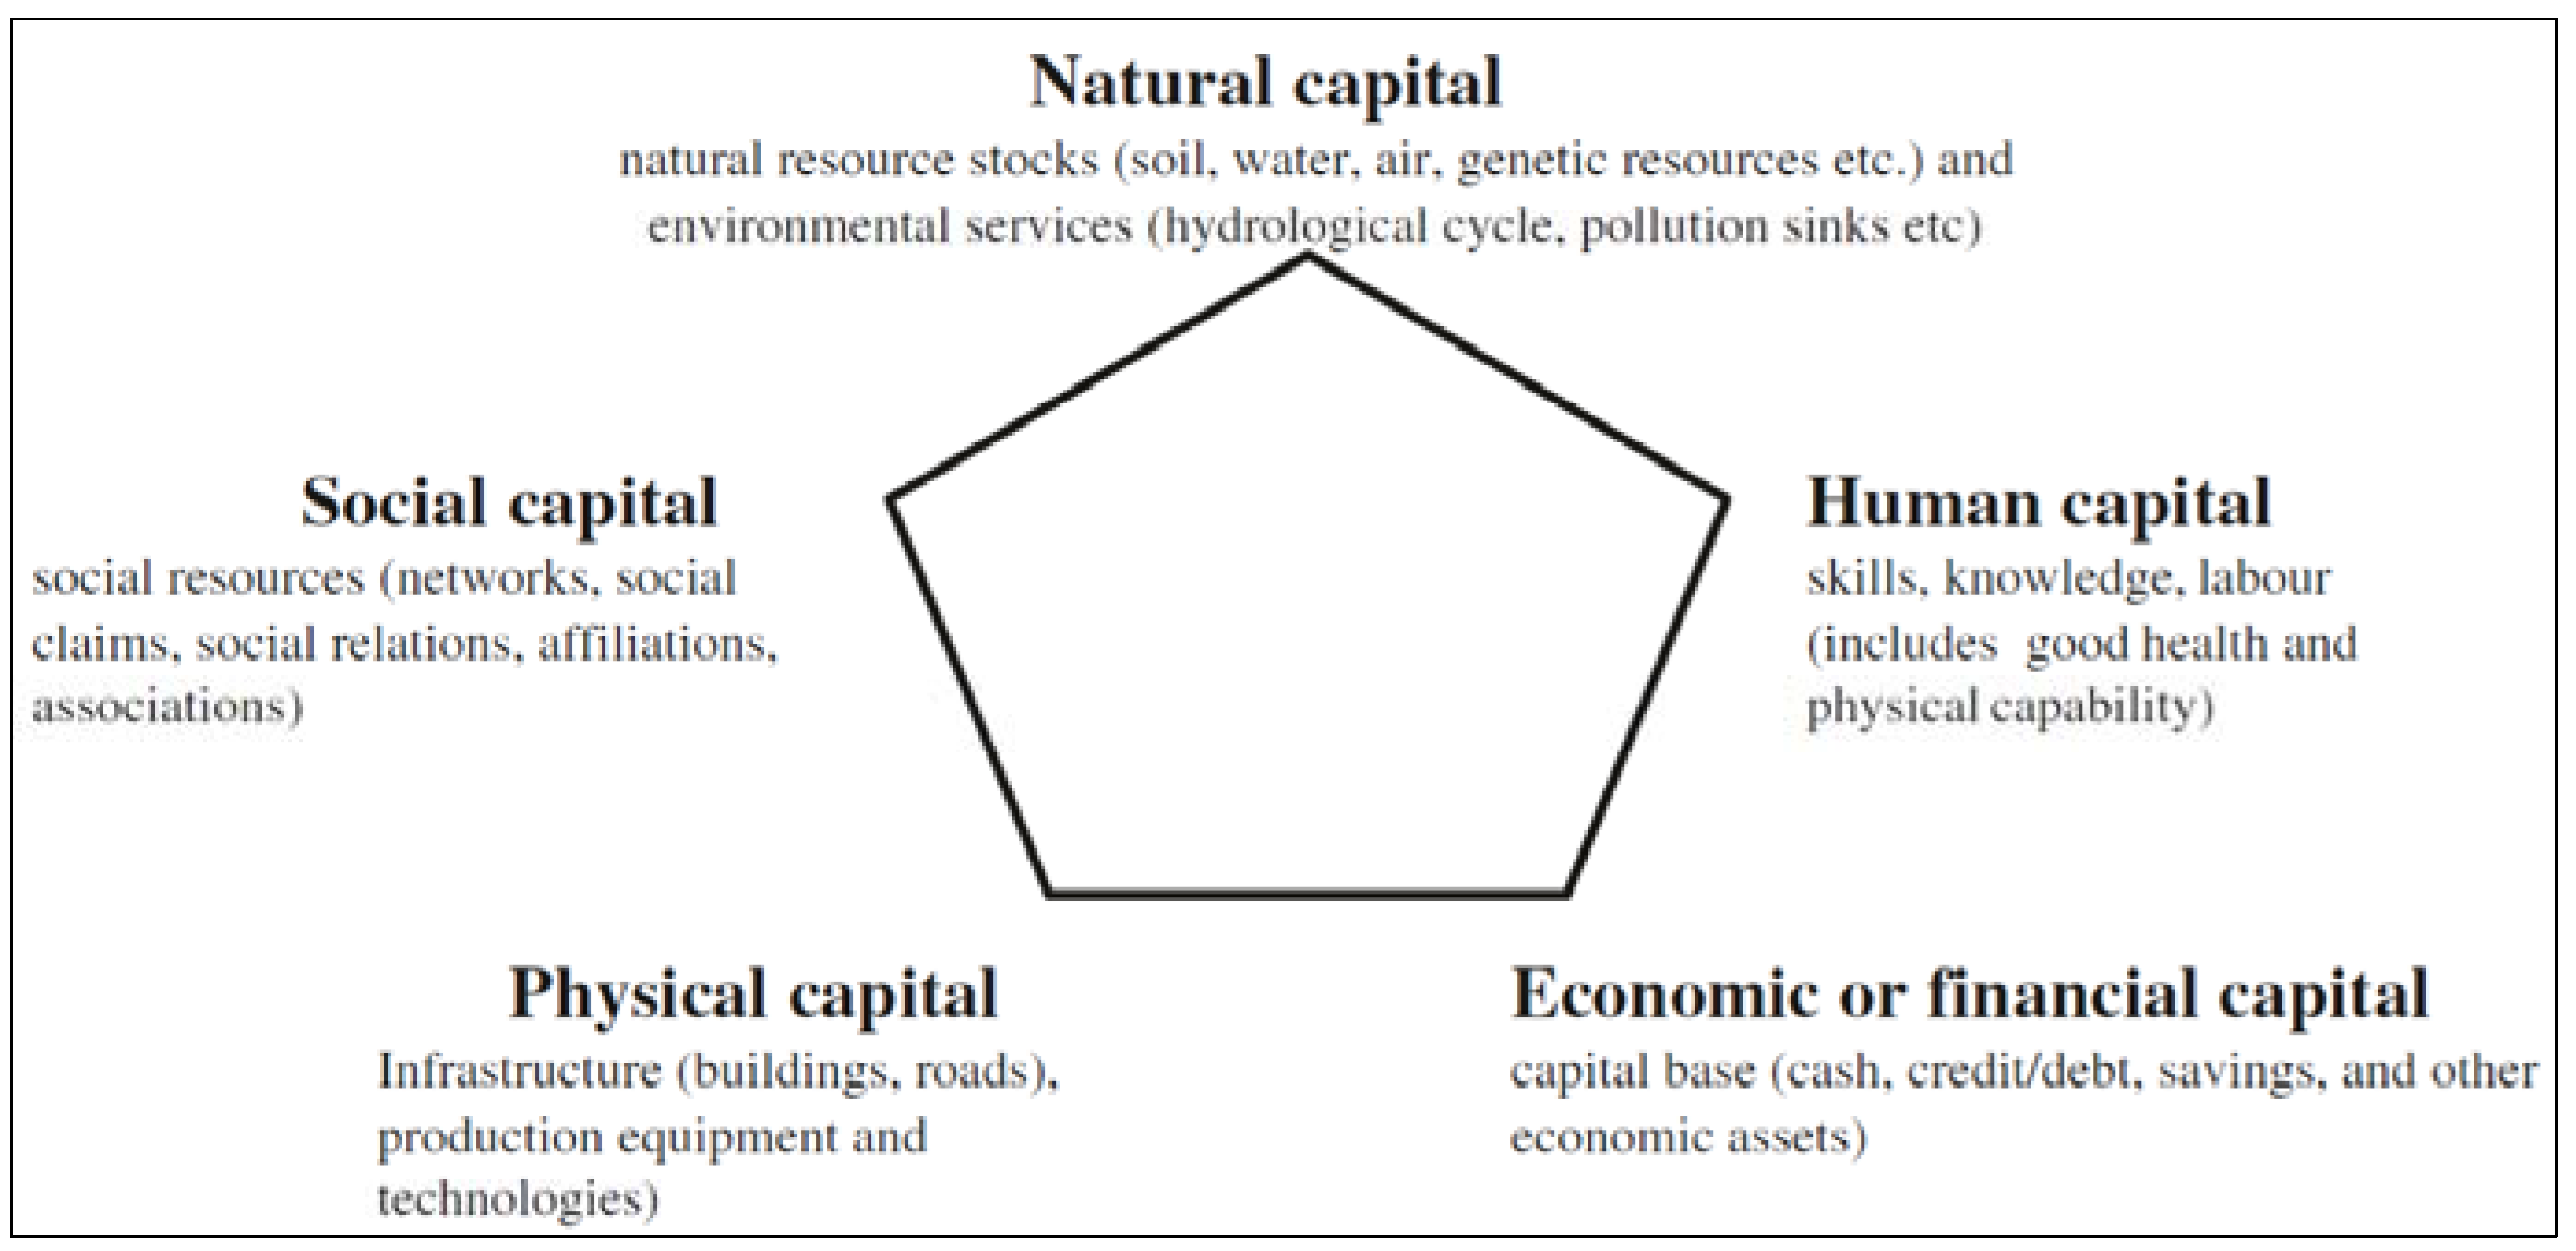
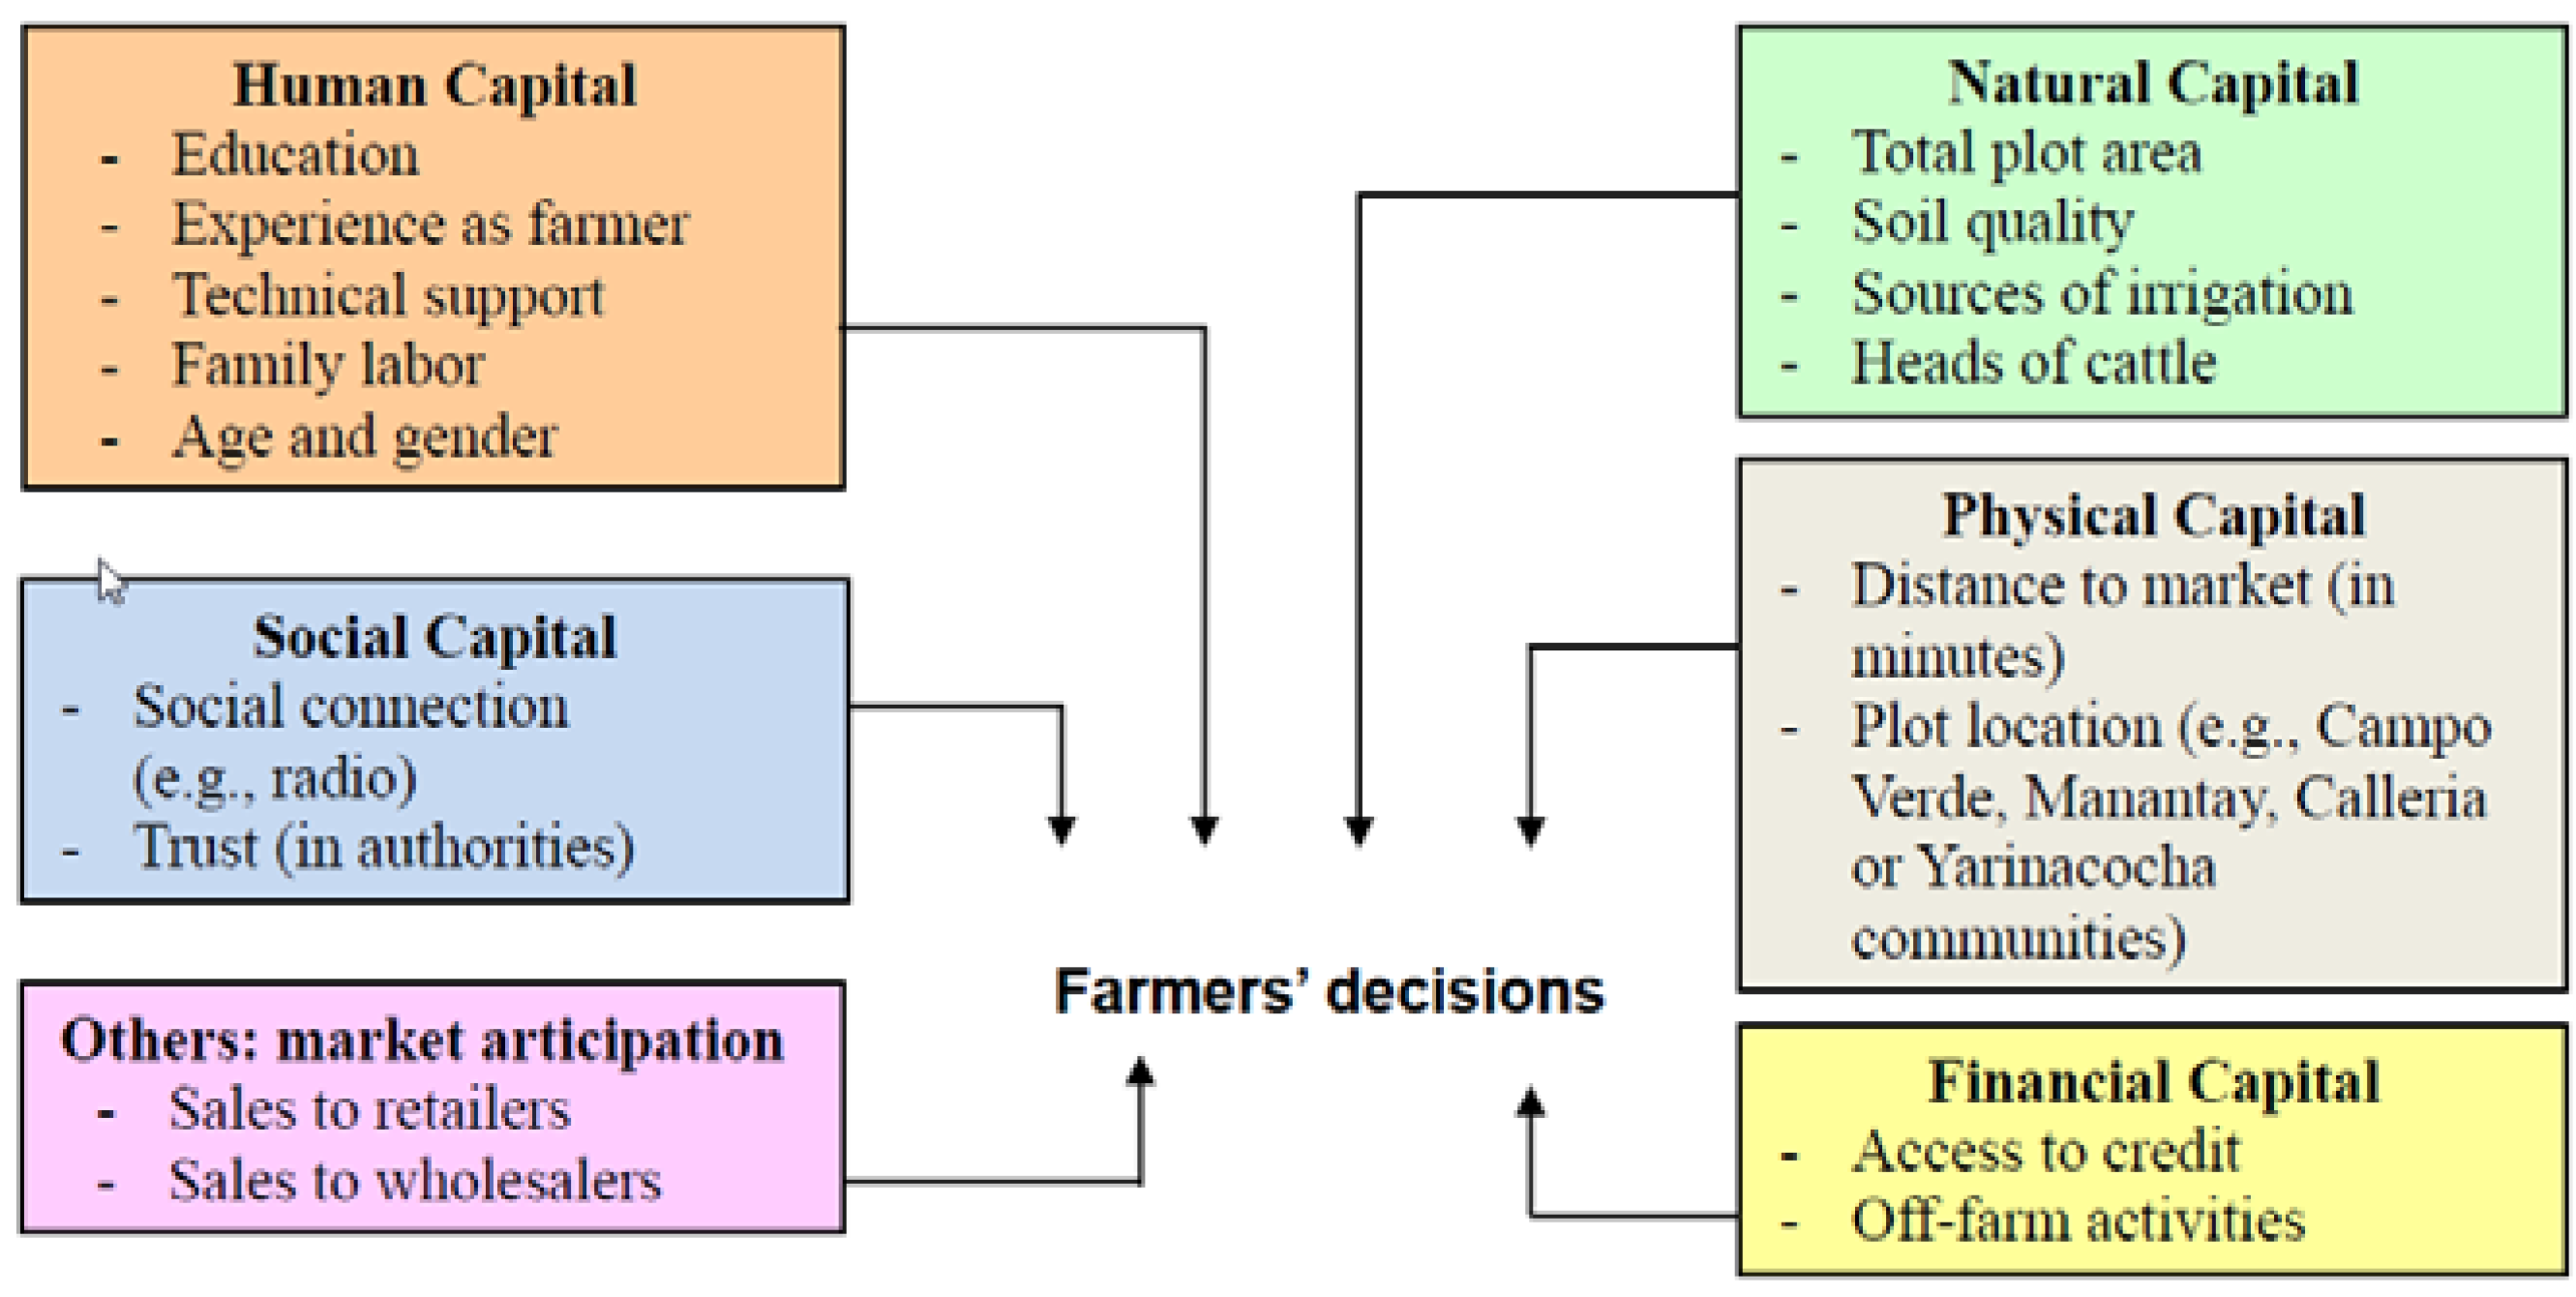
  • Human capital represents “the skills, knowledge, ability to labor and good health that together enable people to pursue different livelihood strategies” [13]. Factors considered in this type of capital include: years of formal education, experience as a farmer, receiving technical support from governmental or non-governmental agencies, the number of members of the family providing farm labor, age and gender (Figure 1). According to [3], formal education and access to technical support could increase the opportunity costs of in situ crop conservation; as such, more educated farmers are expected to preserve a lower number of crop varieties. In addition, age and years of experience [14] as a farmer may be positively associated with crop diversity conservation [15], because older farmers with more experience could have the required knowhow to cultivate a larger number of crop varieties. Family labor has been empirically positively correlated with crop diversity conservation (e.g., [16]), given that cultivating more varieties could be more labor intensive than cultivating less varieties [16]. Female farmers are typically paid lower wages than counterparts. As a result, their opportunity costs of crop diversity conservation are lower [3], and they are expected to preserve a higher number of crop varieties.
  • Social capital represents “the social resources upon which people draw in pursuit of their livelihood objectives” [13]. They are developed through networks and connectedness, membership of more formalized groups, relationships of trust, reciprocity and exchanges. Different measures of social capital are expected to affect crop diversity conservation differently, and previous research has indicated mixed results [3]. Variables considered in this type of capital include: a proxy of social connection (radio ownership) and trust in authorities (Figure 1). It is expected that these variables have a positive influence on crop diversity conservation. Similar measures of social capital, e.g., “linking” social capital, statistically significantly increased in situ crop diversity conservation in Ethiopia [17].
  • Natural capital represents “the natural resource stocks from which resource flows and services useful for livelihoods are derived” [13]. Factors considered within this type of capital include: total plot area, soil quality, access to a source of irrigation and the number of heads of cattle (Figure 1). Larger total plot area, better soil quality and access to a source of irrigation are expected to have a positive influence on crop diversity, because they facilitate crop production [3]. The number of heads of cattle is expected to have a negative influence on crop diversity, as it could diverge farmer attention to other non-crop related farming activities.
  • Physical capital comprises the basic infrastructure (e.g., changes to the physical environment that help people to meet their basic needs and to be more productive) and the producer goods (e.g., tools and equipment that people use to function more productively) needed to support livelihoods [13]. Variables considered in this type of capital include the distance to markets and plot location (Figure 1). Larger distance to markets indicates that farmers face higher transaction costs and, therefore, tend to participate less in the market and have more crop diversity to guarantee self-provisioning [18]. Plot location has an ambiguous effect, based on the infrastructure characteristics and other facilities available in the particular community where the agricultural plot is located. For example, better infrastructure in the community (e.g., roads) would decrease transaction costs, which could decrease the need for self-provisioning and, in turn, decrease in situ crop diversity conservation [18]. On the contrary, the availability of health services in the community could have a positive effect on crop diversity conservation (by increasing labor productivity).
  • Financial capital represents the financial resources that people use to achieve their livelihood objectives, including available stocks and regular inflows of money [13]. Factors considered in this type of capital include access to credit and off-farm activities (Figure 1). Access to credit is expected to have a negative effect on crop diversity, because it can favor the ability to purchase more uniform crop seeds. Furthermore, off-farm activities are expected to have a negative effect on crop diversity, because maintaining crop diversity is labor intensive [15].
Previous research has suggested that factors, such as market participation with other crops, e.g., by selling bananas in Uganda, has a positive effect on the in situ conservation of this crop’s diversity [15]; while participation in maize markets had a negative effect on maize diversity cultivated by farmers in Guatemala [3]. Including two simultaneous or endogenous decisions in a regression generates biased results. Endogeneity in this context refers to either simultaneity or unclear causality. For example, farmers may cultivate more varieties because there is market demand for those varieties, but the market demand is, in turn, affected by the number of varieties offered/supplied by the farmers in the market (for more information about the effects of endogeneity, see [19]). Therefore, the effect of market participation through commercial agriculture has not been properly evaluated in previous studies. In this research, market participation does not relate to chili sales to avoid endogeneity/simultaneity in the econometric regressions. Market participation relates to the sales of other agricultural products by farmers, mainly oranges, yucca and maize.

2. Research Area Description and Survey Conduction

There are five domesticated species of native chilies (Capsicum annuum, Capsicum frutescens, Capsicum chinense, Capsicum baccatum and Capsicum pubescens) worldwide. Peru is one of the few countries where these five species are still grown. However, the total number of native chili varieties (within species) cultivated in this country is unknown, and a full characterization and evaluation of those varieties have not been performed to date [20]. The geographical location of the five domesticated species and an unknown number of varieties in Peru expands to the coast, mountain range and Amazon rainforest. The department of Ucayali was selected for conducting this study because the Instituto Nacional de Innovación Agraria (INIA), a public research center responsible for the design and execution of the national strategy for agricultural innovation, has one of the most unique collections of native chilies accessions in Peru and had indicated that individual farmers located in this Amazonian region cultivate diverse varieties of native chilies. A face-to-face survey was conducted with randomly sampled farmers inside four rural communities, as indicated in Table 1. Farmers were surveyed inside their agricultural plots. When the farmer was not available at the time of the survey, the interviewer visited the next closest agricultural plot inside the same community.
Table 1. Rural communities and the number of farmers surveyed in Ucayali.
CommunityNumber of farmers surveyed
Calleria
(Mashanga)
13
Campo Verde
(El Pimental and Agua Dulce)
35
Manantay
(Pucallpillo, Ega, Sagrado Corazon, and Jose Olaya)
46
Yarinacocha
(Nueva esperanza de Panaillo)
34
Total128
The questionnaire included questions about human, natural, physical, financial and social capital characteristics, as well as factors related to market participation and other socio-economic aspects. The approximate number of famers located in the communities is 725 (the approximation is based on the data from [21]). Therefore, the sample included 18% of the farmers within those communities.

3. Econometric Models and Results

3.1. Econometric Models

3.1.1. Probit Model

The decision to cultivate native chilies (Y) could have two values: Y = 0, when the individual farmer (i) decides not to cultivate native chilies; or Y = 1, when the farmer decides to cultivate native chilies. Following [19], the probability (Prob) that a farmer cultivated native chilies (Y), given a set of explanatory variables (X) is:
Sustainability 06 00615 i001
where X includes human, natural, financial, physical, social and market variables, as indicated in Figure 2, and βi corresponds to the parameter estimates, the average values of which are calculated by the regression.

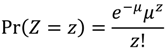
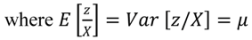
3.1.2. (Truncated) Poisson Model

The number of native chili varieties cultivated by individual farmer is a nonnegative integer, or count, denoted by z, z ∈ N = {0,1,2,…,}. Following [10], because the response variable is discrete, its probability mass is placed on nonnegative integer values only. Therefore, the number of occurrences of the event, y, over a fixed exposure period has the probability mass function:
Sustainability 06 00615 i002
Sustainability 06 00615 i003
The Poisson model tries to explain μ as a function of a set of explanatory variables, X. The most common formulation of μ is the exponential function:
μ = eX,β
The log of Equation (4) gives:
log μ = β1 + β2X2 + …+ βnXn
which, in the context of this research, transforms to:
ln(n varieties) =β0 + β1Human + β2Natural + β3Financial + β4Physical + β5Social + β6Market
where human, natural, financial, physical, social and market comprises the group of variables included in each type of capital, as indicated in Figure 2.
The Poisson model was truncated at one (to avoid evaluating the decision of whether to grow native chilies or not again, which was analyzed using the probit model, as indicated in Section 3.1.1), and the predicted values of the inverse Mills ratio (IMR) obtained from the probit model were used as an additional variable in the Poisson model to correct for the effect of the truncation, as indicated in [22].

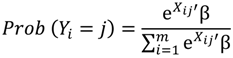
3.1.3. Multinomial Logit Model

The multinomial logit model is an extension of the probit model. Here, the outcome of interest (Y) is one of m alternatives, where Y is the individual farmer market-related decision, and m can take the values of 0 = non-market participation, 1 = sales to wholesalers or 2 = sales to retailers. The order of the m values is trivial in this type of model.
Following [20], the probability (Prob) that a farmer (i) decides for option j = 0,1,2, given a set of explanatory variables (X) is:
Sustainability 06 00615 i004

3.2. Descriptive Statistics

About 77% of the sample population cultivated native chili varieties (Table 2). Farmers cultivated up to four different varieties with an average of 1.44 (Table 2). Only one farmer indicated that he cultivates 13 native chili varieties (Figure 3). This farmer was an outlier and was eliminated from subsequent statistical and econometric analyses. The main native varieties cultivated are aji charapita, aji dulce, aji pucunucho, aji ayuyo and aji pinchito de mono (Figure 4). Those varieties are likely to belong to the species Capsicum chinense; but unfortunately, it was not possible to identify their full scientific names. It is worth mentioning that all the native chili plants cultivated in the research area are from varieties of farm-saved seeds. There is no commercialization of native chili seeds in the research area.
Table 2. Descriptive statistics.
VariablesMeanStandard deviationMinimumMaximum
Native chili grower
(native chili grower = 1, 0 otherwise)
0.77-0.01.0
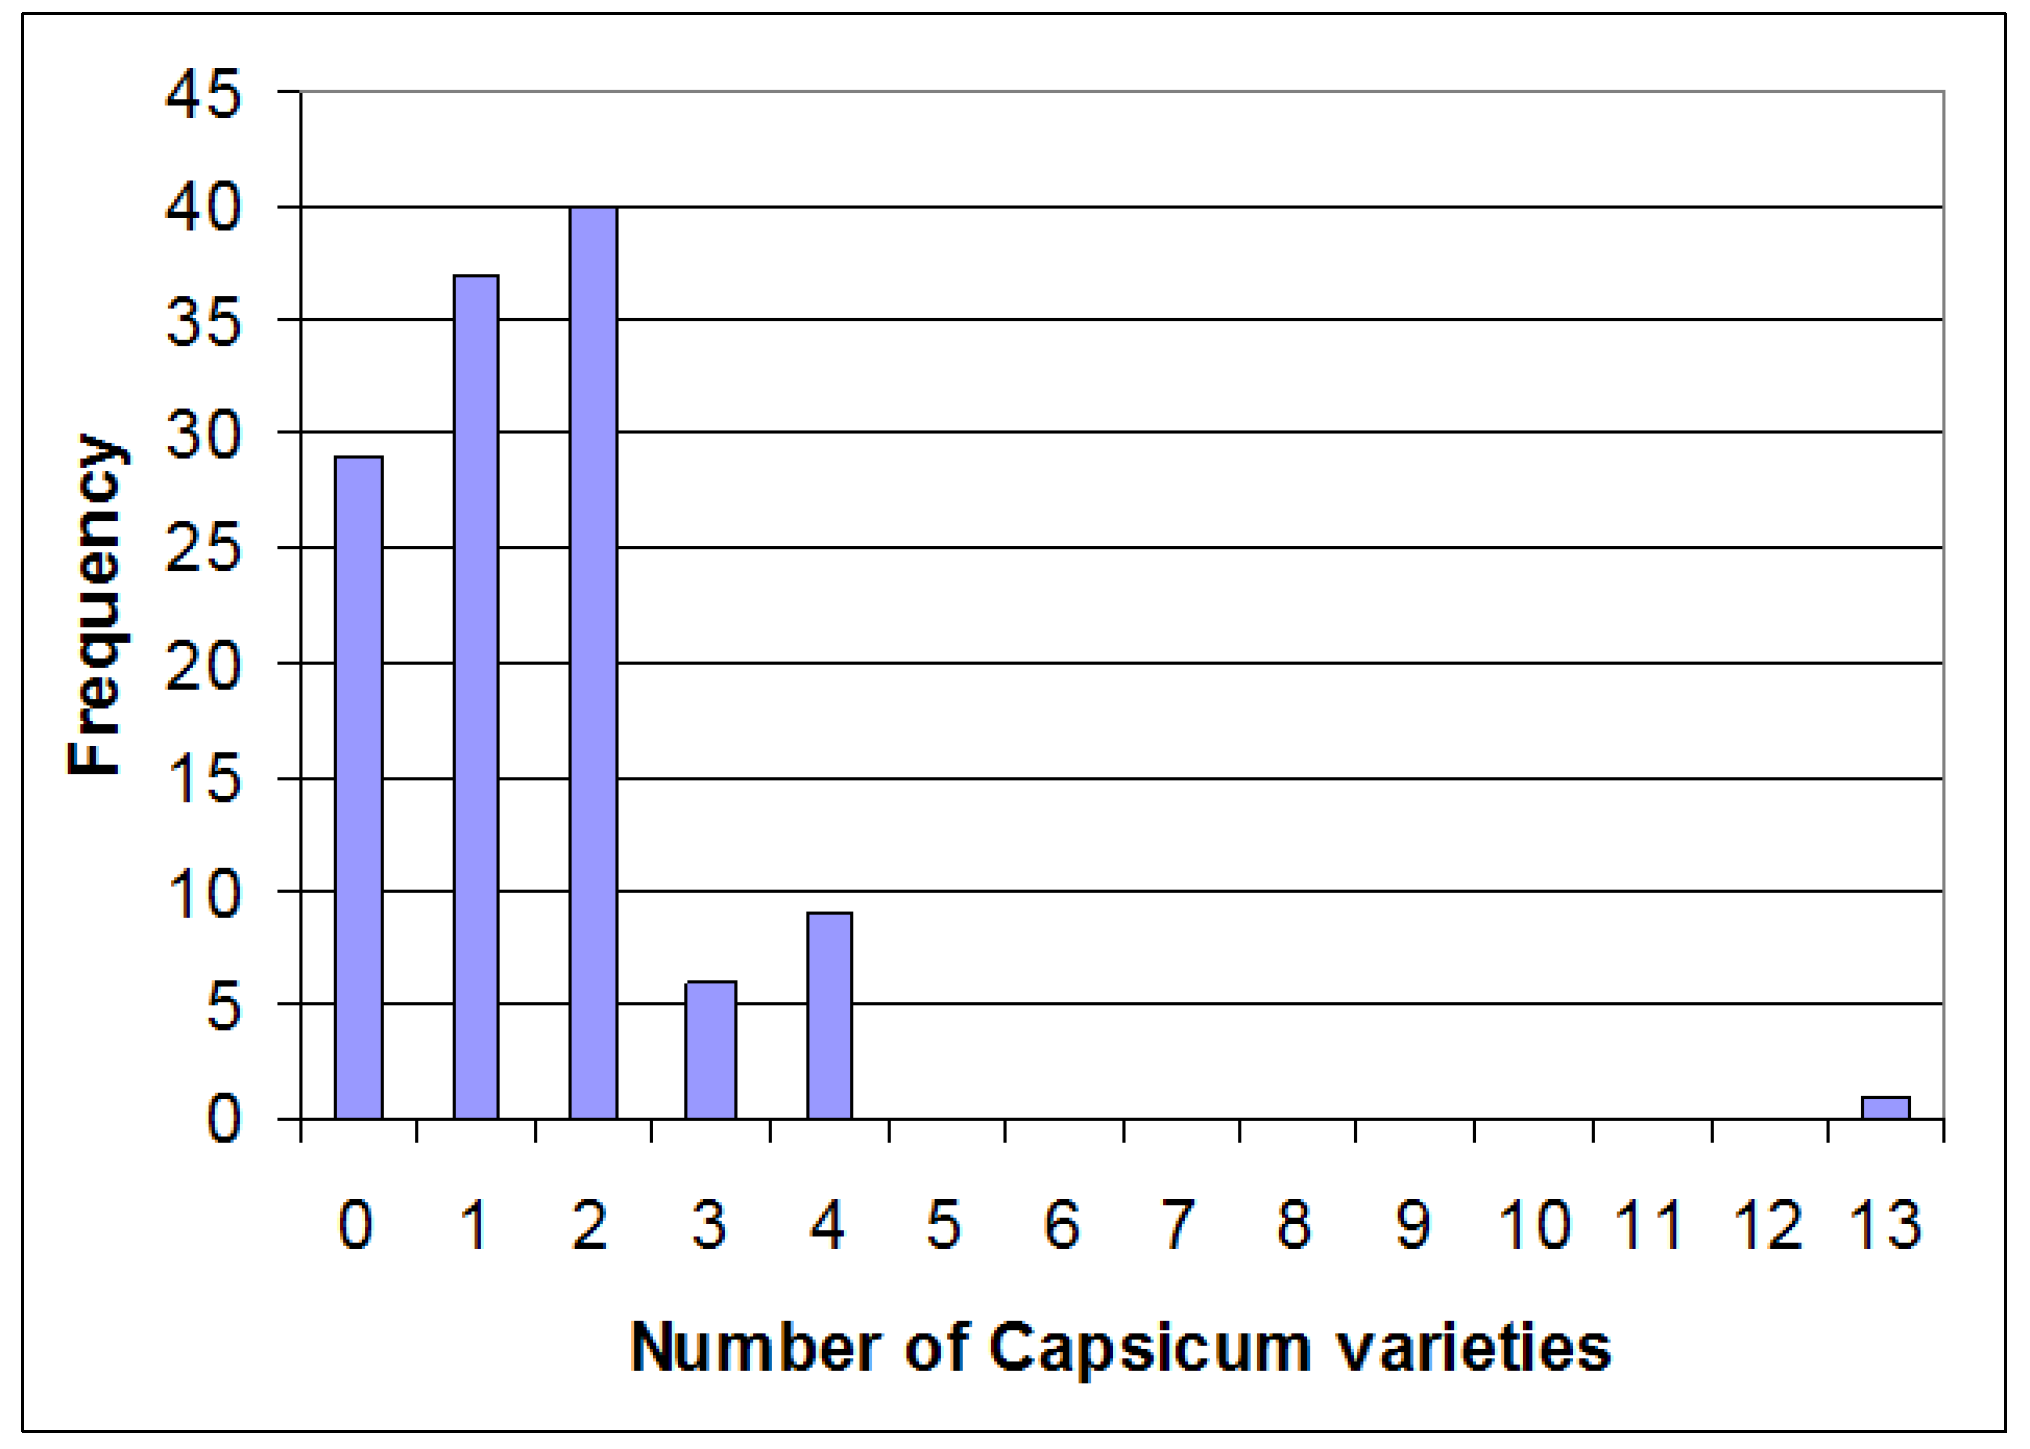
Number of native chili varieties cultivated by farmers1.44 1.13 0.04.0
Age
(in years)
46.75 13.78 22.075.0
Education
(in years)
7.32 3.41 0.016.0
Experience
(in years)
26.87 15.55 1.056.0
Gender
(male = 1, female = 0)
0.68 - 0.01.0
Technical support
(yes = 1, 0 otherwise)
0.36 - 0.01.0
Family size (additional number of family members in the household) 2.49 1.48 0.07.0
Total agricultural area
(in square meters)
189,794 940,173 2,500 10,600,000
Opinion about soil quality
(from 1 = really bad quality to 5 = really good quality)
3.561.1615
Access to irrigation
(yes = 1, 0 otherwise)
0.24 -0.01.0
Access to credit
(yes = 1, 0 otherwise)
0.22 -0.01.0
Performing other economic activities
(yes = 1, 0 otherwise)
0.28 -0.01.0
Number of head of cattle2.55 8.03 0.060.0
Trust on local authorities
(1 = do not trust, 2 = more or less, 3 = I trust authorities)
2.46 0.76 1.03.0
Radio ownership
(yes = 1, 0 otherwise)
0.71 -0.01.0
Non market sales
(yes = 1, 0 otherwise)
0.27-0.01.0
Market sales to wholesalers
(yes = 1, 0 otherwise)
0.18-0.01.0
Market sales to retailers
(yes = 1, 0 otherwise)
0.55-0.01.0
Time to market
(in minutes)
64.74 49.14 2.0 300.0
Plot located in rural community of Campo Verde
(yes = 1, 0 otherwise)
0.27 -0.01.0
Plot located in rural community of Manantay
(yes = 1, 0 otherwise)
0.36 -0.01.0
Plot located in rural community of Calleria
(yes = 1, 0 otherwise)
0.10 -0.01.0
Plot located in rural community of Yarinacocha
(yes = 1, 0 otherwise)
0.27 -0.01.0
Figure 3. The number of chili varieties cultivated by farmers.
Sustainability 06 00615 g003
Figure 4. Chili varieties cultivated by farmers.
Sustainability 06 00615 g004
Farmers were, on average, 47 years old, with seven years of formal education and 27 years of farming experience. About 68% of the farmers were males, with an average of three additional family members in their households. In addition, 36% indicated that they received technical support during the previous year (2009), 22% mentioned that they had access to credit and 24% had access to a source of irrigation. The average total agricultural area was 189,794 m2, with about three heads of cattle per household. Farmers considered that soil quality was, on average, 3.6 on a scale from one to five, where one represents “really bad” and five “really good”. About 28% of farmers performed other economic activities besides agriculture, and 18 and 55% participated in commercial agriculture by selling products to wholesalers or retailers, respectively. The average travel time to the closest market was 65 minutes. In relation to social capital, farmers indicated, on average, that they trust local authorities (a value of 2.5 on a scale from one to three, where 1 = I do not trust, 2 = more or less and 3= I trust authorities), while 71% of the farmers indicated they owned a radio (a proxy of social connectivity, because most of the radio programs deal with local problems and issues). About 36, 27, 27 and 10% of farmers had their agricultural plots located in Manantay, Campo Verde, Yarinacocha and Calleria communities, respectively.

3.3. Econometric Model Results

The results of the determinants of native chili cultivation and the number of native chili varieties cultivated by farmers in their agricultural plots are indicated in Table 3.
Table 3. Determinants of native chili cultivation and the number of native chili varieties.
VariablesProbit Model a
(Marginal Effects)
Truncated
Poisson Model a,b
(Marginal Effects)
Age 0.00595 ** 0.00227
(0.00259) (0.01084)
Education 0.02681 *** −0.01437
(0.00872) (0.01670)
Experience −0.00173 −0.00247
(0.00325) (0.00873)
Male −0.05184 0.11339
(0.07937) (0.20535)
Technical support0.04766 * 0.34705 *
(0.02666) (0.19886)
Family size −0.01331 0.05633 *
(0.02362) (0.03375)
Total agricultural area −0.74336 × 10⁻⁶ ***0.80642 × 10⁻⁶
(0.2385 × 10⁻⁶) (0.5251 × 10⁻⁶)
Opinion about soil quality0.00572 −0.03373
(0.01628) (0.06772)
Access to irrigation0.24140 *** −0.01713
(0.01770) (0.23735)
Access to credit0.11331 *** 0.28767
(0.02207) (0.21271)
Performing other economic activities−0.18996 *** −0.46402 **
(0.03091) (0.19202)
Number of head of cattle−0.00284 −0.00533
(0.00708) (0.00800)
Trust−0.02806 0.00117
(0.04272) (0.10720)
Radio0.16454 *** −0.00532
(0.02260) (0.24582)
Market sales to wholesalers0.18798 *** 0.08270
(0.02155) (0.47401)
Market sales to retailers0.29882 *** 0.63905 ***
(0.03516) (0.24429)
Time to market0.00095 *** 0.00036
(0.00021) (0.00158)
Campo Verde0.18126 ** 0.46816
(0.08784) (0.30016)
Manantay0.11500 *** −0.22991
(0.03558) (0.31144)
Calleria−0.00670 0.89431 *
(0.08864) (0.48751)
Log likelihood function−14.93416−107.14510
Restricted log likelihood function−67.97298−139.80460
McFadden pseudo R-squared0.780290.23360
Number of observations126126
a The model was estimated using a covariance matrix correction for cluster errors by rural community, as indicated in [23]; b a likelihood ratio test based on Poisson and negative binomial distributions was used to test for over dispersion. The null hypothesis of over dispersion was rejected; standard errors are in parenthesis. Significant at *** 0.01; ** 0.05; * 0.1.
The results suggest that older farmers, with more education, who receive technical support, have smaller total agricultural areas, have access to a source of irrigation and credit, who do not perform other economic activities, have higher social connectivity, whose plots are located in Campo Verde or Manantay in contrast to Yarinacocha (the omitted variable in the regression to avoid singularity problems) and participate in commercial agriculture by supplying either retailers or wholesalers, but are not close to the market place, are more likely to cultivate native chilies.
On the other hand, farmers who receive technical support, have larger family size, do not perform other agricultural activities, sell agricultural product to retailers and whose plots are located in Calleria in contrast to Yarinacocha are more likely to cultivate a larger number of native chili varieties. The empirical evidence thus suggests that policies promoting farmers’ market participation through the retailer channel may help to increase in situ conservation of native capsicum varieties.
The results of the determinants of the decision to participate in commercial agriculture (non-market participation, market sales to wholesalers and market sales to retailers) are presented in Table 4.
Table 4. Determinants of the decision of market participation.
VariablesMultinomial Logit Model a, b, c
(Marginal Effects)
Non-market participationMarket sales to wholesalersMarket sales to retailers
Age −0.00175 0.00705 * −0.00530
(−0.21722) (3.13657) (−0.47700)
Education −0.05524 ** 0.00760 0.04764 *
(−1.07617) (0.53109)(0.67352)
Experience 0.00121 −0.00925 ** 0.00804
(0.08614) (−2.36613) (0.41624)
Male 0.11545 −0.02188 −0.09357
(0.20692) (−0.14064) (−0.12170)
Technical support−0.26484 * 0.03592 0.22892
(−0.25129) (0.12223)(0.15763)
Family size −0.06548 −0.00052 0.06600
(−0.43217) (−0.01221) (0.31610)
Total area 0.30925 × 10⁻⁶−0.53182 × 10⁻⁶ ** 0.22257 × 10⁻⁶
(0.15685) (−0.96744) (0.08192)
Opinion about soil quality0.01967 0.03334 −0.05301
(0.18618) (1.13225) (−0.36420)
Access to irrigation−0.88977 *** 0.03472 0.85506 ***
(−0.58161) (0.08139) (0.40560)
Access to credit0.21353 −0.03635 −0.17718
(0.12607) (−0.07697) (−0.07591)
Performing other economic activities0.17550 −0.03134 −0.14416
(0.13322) (−0.08533) (−0.07941)
Number of head of cattle0.01403 0.87383 × 10⁻⁴−0.01412
(0.09584) (0.00214)(−0.06998)
Trust−0.01513 −0.03264 0.04777
(−0.05871) (−0.45413) (0.13449)
Radio−0.33598 ** 0.02302 0.31296 **
(−0.63760) (0.15669) (0.43100)
Time to market−0.00171 −0.00074 0.00245
(−0.29473) (−0.45449) (0.30584)
Campo Verde−0.37831 * 0.24566 ** 0.13265
(−0.27122) (0.63167) (0.06901)
Manantay−0.07268 0.08981 −0.01713
(−0.06896) (0.30563) (−0.01180)
Calleria−0.02347 0.31149 ** −0.28802
(−0.00643) (0.30624) (−0.05729)
Log likelihood function −84.26375
Restricted log likelihood function −129.54640
McFadden pseudo R-squared 0.3495478
Number of observations 126
a The model was estimated using a covariance matrix correction for cluster errors by rural community, as indicated in [23]; b a Hausman test was used to test for the independence of irrelevant alternatives (iia) assumption. The null hypothesis failed to be rejected. (The alternatives are independent.); c a more accurate econometric specification for this type of decision would have been a probit model with sample selection (i.e., the decision to supply either retailers or wholesalers, conditional on the decision to participate in the market). However, there was no evidence of sample selection in the data; based on the fact that the errors between the two decisions were not correlated (Rho was not statistically significant). Elasticities are in parenthesis. Significant at *** 0.01; ** 0.05; * 0.1.
The results particularly suggest that farmers who are more educated, have access to irrigation and have higher social connectivity are more likely to supply retailers. These results concur with previous studies and literature reviews suggesting that education, access to irrigation and social connectivity have a positive statistically significant effect on farmers’ market sales (e.g., [24,25]). This could be related to improved farm productivity (due to the better education of the farmers and access to irrigation) and the higher number of the farmers’ acquaintances (due to higher social connectivity), which might facilitate a group of farmers to directly offer a relatively high volume of their products to retailers they personally know (probably through one of their acquaintances). In general, policies to promote sales to retailers through increasing any of the statistically significant variables indicated above would result in a positive impact on native chili in situ conservation (given that sales to retailers positively influence native chili conservation).

4. Discussions and Conclusions

This straightforward evaluation of only one type of crop diversity index (the number of native chili varieties) has provided empirical evidence that human capital in the form of technical support would increase crop diversity conservation. This result was not expected given that technical support increases the opportunity costs of in situ conservation, as indicated by [3]. However, technical support in this particular area is currently oriented toward promoting participatory guarantee systems (PGS) in organic agriculture (in contrast to traditional third-party organic certification schemes, PGS is mainly based on trust between sellers and buyers [26]). Organic agriculture tends to increase the number of crop varieties cultivated by farmers, because it usually operates with a more diverse crop rotation [27]. Family labor and not performing other economic activities also favored crop diversity conservation, which can be related to the fact that cultivating diverse varieties requires large labor investments in contrast to not doing so, as suggested by [16]. On the other hand, natural capital measured by total area, soil quality, access to a source of irrigation and head of cattle did not statistically significantly influence the number of native chili varieties cultivated by farmers. Sales of agricultural products to retailers statistically significantly increased native chili conservation. This could be related to increased income from crop sales, which allow farmers to invest more time in in situ conservation, and also to a more diverse demand for different products from retailers in relation to wholesalers. In this sense, retailers are in direct contact with consumers and are more oriented toward supplying them specific niche products, in contrast to wholesalers, who tend to supply more uniform products [28]. Nevertheless, as stated by [3], markets are economic institutions, which shape and are shaped by social processes. As such, the impact of market participation is contingent upon the social context in which it operates. Therefore, the results may be different under different contexts (e.g., in another region with a more intensified, higher input agriculture), and more research is needed to clarify the impact of market participation on in situ crop diversity. In general, the results of this case study suggest that policies designed to encourage commercial agriculture through sales to retailers could have a positive effect on farmers’ economic well-being and, at the same time, could help to achieve crop genetic diversity conservation goals. In addition, sales to retailers could be encouraged by improving education, access to irrigation and promoting higher social connectivity.

Acknowledgments

The financial support of the German Federal Ministry for Economic Cooperation and Development through Deutsche Gesellschaft fuer Internationale Zusammenarbeit (GIZ) is gratefully acknowledged. This work was carried out within the project “Unravelling the potential of neglected crop diversity for high-value product differentiation and income generation for the poor: The case of chili pepper in its centre of origin” coordinated by Bioversity International. I would also like to acknowledge Mauricio Mediana, Humberto Saavedra and a group of students from Universidad Nacional de Ucayali for collecting the data for this research in Peru.

Conflicts of Interest

The author declares no conflict of interest.

References and Notes

  1. Bioversity International. Descubriendo el potencial de la diversidad de los cultivos olvidados para la diferenciación de productos de alto valor y la generación de ingresos para los pobres: El caso de los chiles en su centro de origen; Project proposal presented to Deutsche Gesellschaft fuer Internationale Zusammenarbeit (GIZ); GIZ: Cali, Colombia, 2009. (in Spanish) [Google Scholar]
  2. Eshbaugh, H. History and Exploitation of a Serendipitous New Crop Discovery. In New Crops; Janick, J., Simon, J., Eds.; Wiley: New York, NY, USA, 1993. [Google Scholar]
  3. Isakson, S. Market provisioning and the conservation of crop biodiversity: An analysis of peasant livelihoods and maize diversity in the Guatemalan highlands. World Dev. 2011, 39, 1444–1559. [Google Scholar] [CrossRef]
  4. Bosland, P.; Votava, E. Peppers: Vegetables and Spice Capsicums; CABI Publishing: Oxfordshire, UK, 2000. [Google Scholar]
  5. Bellon, M. Conceptualizing interventions to support on-farm genetic resource conservation. World Dev. 2004, 32, 159–172. [Google Scholar] [CrossRef]
  6. Lybbert, T.; Barrett, C.; Narjisse, H. Market-based conservation and local benefits: The case of argan oil in Morocco. Ecol. Econ. 2002, 41, 125–144. [Google Scholar] [CrossRef]
  7. Smale, M. Concepts, Metrics and Plan of the Book. In Valuing Crop Biodiversity: On-Farm Genetic Resources and Economic Change; Smale, M., Ed.; CABI Publishing: Washington, DC, USA, 2006. [Google Scholar]
  8. Lockie, S.; Carpenter, D. Agriculture, Biodiversity and Markets. In Agriculture, Biodiversity and Markets: Livelihoods and Agroecology in Comparative Perspective; Lockie, S., Carpenter, D., Eds.; Earthscan: London, UK, 2010. [Google Scholar]
  9. Jackson, L.; Pascual, U.; Hodgkin, T. Utilizing and conserving agrobiodiversity in agricultural landscapes. Agr. Ecosys. Environ. 2007, 121, 196–210. [Google Scholar] [CrossRef]
  10. Cameron, A.; Trivedi, P. Microeconometrics Using STATA, Revised Edition; Stata Press: College Station, TX, USA, 2010. [Google Scholar]
  11. Benin, S.; Smale, M.; Pender, J. Explaining the Diversity of Cereal Crops and Varieties Grown on Household Farms in the Highlands of Northern Ethiopia. In Valuing Crop Biodiversity. On-Farm Genetic Resources and Economic Change; Smale, M., Ed.; CABI Publishing: Washington, DC, USA, 2006. [Google Scholar]
  12. Morse, S.; McNamara, N. The Theory Behind the Sustainable Livelihood Approach. In Sustainable Livelihood Approach: A Critique of Theory and Practice; Morse, S., McNamara, N., Eds.; Springer: New York, NY, USA, 2013. [Google Scholar]
  13. DFID Sustainable livelihoods guidance sheets. Emergency Nutrition Network: Oxford, UK, 1999. Available online: http://www.ennonline.net/resources/667 (accessed on 13 December 2013).
  14. Age and experience tend to be correlated (older farmers are usually more experienced). A correlation was not found in the sample. Similar situation was also observed in [15].
  15. Edmeades, S.; Smale, M.; Karamura, D. Demand for Cultivar Attributes and the Biodiversity of Bananas on Farms in Uganda. In Valuing Crop Biodiversity. On-Farm Genetic Resources and Economic Change; Smale, M., Ed.; CABI Publishing: Washington, DC, USA, 2006. [Google Scholar]
  16. Van Dusen, E. Missing Markets, Migration and Crop Diversity in the Milpa System of Mexico: A Household-Farm Model. In Valuing Crop Biodiversity. On-farm Genetic Resources and Economic Change; Smale, M., Ed.; CABI Publishing: Washington, DC, USA, 2006. [Google Scholar]
  17. Winters, P.; Cavatassi, R.; Lipper, L. Sowing the Seeds of Social Relations: The Role of Social Capital in Crop Diversity; ESA Working Paper N 6-16; European Space Agency: Rome, Italy, 2006. [Google Scholar]
  18. Winters, P.; Hintze, L.; Ortiz, O. Rural Development and the Diversity of Potatoes on Farms in Cajamarca, Peru. In Valuing Crop Biodiversity. On-Farm Genetic Resources and Economic Change; Smale, M., Ed.; CABI Publishing: Washington, DC, USA, 2006. [Google Scholar]
  19. Greene, W. Econometric Analysis; Prentice Hall: Bergen County, NJ, USA, 2003. [Google Scholar]
  20. Meckelmann, S.; Riegel, D.; van Zonneveld, M.; Rios, L.; Pena, K.; Ugas, R.; Quinonez, L.; Mueller-Seitz, E.; Petz, M. Compositional characterization of native Peruvian chili peppers (Capsicum spp.). J. Agr. Food Chem. 2013, 61, 2530–2537. [Google Scholar] [CrossRef]
  21. Instituto Nacional de Estadística e Informática (INEI). Censos nacionales 2007, XI de poblacion and VI de vivienda. Available online: http://censos.inei.gob.pe/cpv2007/tabulados/# (accessed on 13 December 2013).
  22. Breen, R. Regression Models: Censored, Sample-Selected, or Truncated Data; Sage Publications: Thousand Oaks, CA, USA, 1996. [Google Scholar]
  23. Greene, W. Limdep Econometric Modeling Guide, Version 10; Econometric Software, Inc.: New York, NY, USA, 2012.
  24. Abera, G. Commercialization of Smallholder Farming: Determinants and Welfare Outcomes. Master Thesis, University of Agder, Kristiansand, Norway, 2009. [Google Scholar]
  25. Jaleta, M.; Gebremedhin, B.; Hoeksa, D. Smallholder Commercialization: Processes, Determinants and Impact; Discussion Paper No. 18; International Livestock Research Institute: Addis Ababa, Ethiopia, 2009. [Google Scholar]
  26. International Federation of Organic Agriculture Movements (IFOAM). Participatory Guarantee Systems; IFOAM: Bonn, Germany, 2007. Available online: http://www.ifoam.org/sites/default/files/page/files/ifoam_pgs_web.pdf (accessed on 13 December 2013).
  27. Bengtsson, J.; Ahnstrom, J.; Weibull, A. The effects of organic agriculture on biodiversity and abundance: A meta-analysis. J Appl. Ecol. 2005, 42, 261–269. [Google Scholar] [CrossRef]
  28. Mendoza, G. A Primer on Marketing Channels and Margins. In Prices, Products, and People: Analyzing Agricultural Markets in Developing Countries; Scott, G., Ed.; Lynne Rienner Publishers: Boulder, CO, USA, 1995. [Google Scholar]

