1. Introduction
Research on the vulnerability of groundwater is of great importance with regard to its protection and sustainable utilization. A vulnerability assessment of the groundwater is the foundation for its reasonable development, utilization, and protection, and can assist with decision making by providing effective data and a scientific judgment. Groundwater pollution vulnerability and risk mapping are important decision-making tools to be considered in land use planning, as well as in water resource management programs worldwide (Pacheco and Sanches Fernandes, 2013) [
1]. For example, in some research, a vulnerability assessment of groundwater has been mainly applied to the field of groundwater protection, with its objective being to obtain the maximum environmental and public benefits with the minimum cost [
2,
3]. Sanches Fernandes and Haie [
4] emphasized how important in implementing the DRASTIC (D is the depth of water-table, R is the net recharge, A is the aquifer media, S is the soil media, T is the topography, I is the impact of the vadose and C is the conductivity of the aquifer) policies for land use consolidation. Sanches Fernandes
et al. [
5] performed DRASTIC and GOD (G is the groundwater status, O is overburden feature and D is groundwater depth) vulnerability maps of the Cabril River Basin, Portugal. A new methodology combining vulnerability mapping and geostatistics was proposed in another paper to help define the most efficient groundwater quality-monitoring network on a regional scale [
6]. A vulnerability assessment was performed in the Huangshuihe catchment in the Shandong province of China using both contaminant transport simulations and an index system approach [
7]. Furthermore, a groundwater vulnerability assessment of nitrate contamination was carried out for the shallow aquifer located in the Province of Milan (Italy) [
8]. The harmfulness of the hazard was evaluated by quantifying the contaminant properties and infiltrating the contaminant load. Furthermore, the vulnerability of the intrinsic aquifer was evaluated using a modified DRASTIC model, and the groundwater value was evaluated based on its quality and aquifer storage [
9]. A supervised committee machine with artificial intelligence (SCMAI) model was introduced to improve the DRASTIC method for the groundwater vulnerability assessment of the Maragheh–Bonab plain aquifer in Iran [
10]. Finally, an intrinsic vulnerability assessment was verified using a total organic carbon (TOC) concentration in groundwater, which was a novel approach for the validation of groundwater vulnerability methods on a regional scale [
11].
The Junggar Basin, in the Xinjiang Uygur Autonomous Regions (hereinafter referred to as Xinjiang), which is located in the arid area of Northwestern China, is the second largest inland basin in China. Urumqi City, Kelamayi City, Changji Hui Autonomous Prefecture (hereinafter referred to as Changji prefecture), Tacheng prefecture, Aletai prefecture, Bortala Mongol Autonomous Prefecture (hereinafter referred to as Bortala prefecture), Shihezi Municipality, Xinjiang (hereinafter referred to as Shihezi City), and Kuitun Municipality, Ili Kazakh Autonomous Prefecture (hereinafter referred to as Kuitun City) are all located in this basin. The Junggar Basin is an important supply base of petroleum and natural gas in China, and it also possesses a valuable source of phreatic water in its Quaternary loose rock. With the exploitation of petroleum and natural gas and the continuous development of urban construction and industrial and agricultural production, the phreatic water in the area has been polluted to different extents. A vulnerability assessment of the phreatic water in the plain area of the Junggar Basin could provide a scientific basis for the protection of the quality of the phreatic water, thereby achieving a sustainable utilization of the groundwater resource.
2. An Overview of the Study Area
The Junggar Basin is located in the north of Xinjiang (79.5°E–91.5°E, 43°N–49.5°N) with an area of 0.2611 × 10⁶ km2. The area of its plain is 0.1167 × 10⁶ km2, which includes water areas. The area of its desert is 0.0561× 10⁶ km2.The basin presents the shape of an irregular triangle and the topography slants from east to west with an elevation of 500–1000 m. The Ebinur Lake and Manas Lake form the catchment area of the basin.
The Junggar Basin, which is situated in the hinterland of the Eurasian Continent, is a typical arid area. Little precipitation and strong evaporation are the main features of this area. There are several indentations in the west of the basin, from which the westerly current enters, bringing precipitation to the basin and the surrounding mountains. As a result, the annual precipitation of the study area is greater in the west than that in the east, with a gradual reduction from northwest to southeast.
According to its geological structure and hydrogeological condition, the Junggar Basin is classified as a platform-type Mesozoic-Cenozoic artesian basin. The phreatic aquifer is mainly developed in the inclined plain of the piedmont alluvial-pluvial fan, with a thick aquifer and strong water-bearing capacity; moreover, the water is bicarbonate freshwater with a TDS of less than 1 g/L. The phreatic and confined aquifers are distributed from the overflow zone to the alluvial-proluvial plain, and the phreatic water is sulfate-type brackish water with a TDS of 1–3 g/L. Since this area possesses a slower slope and finer rock particles, the movement of the phreatic water is hindered. The phreatic water spills over the surface like spring water, forming swamps or springs. The confined aquifer is distributed from the middle of the alluvial-proluvial plain to the lacustrine plain, with good-quality confined water. There is only a small amount of phreatic water which has been salinized, and the phreatic water is chloride-type saline water with a TDS of 3–10 g/L, or even larger than 10 g/L. The serious salt accumulation on the surface results in a larger area of alkaline soil [
12].
3. A Proposition of the VDEAL Model
At present, the main methods used to assess the vulnerability of groundwater are the overlay index method, process simulation method, statistic method and fuzzy mathematical method. Since the overlay index method is characterized by its easy acquisition of data and ease of operation, it is commonly used in the vulnerability assessment of groundwater.
The overlay index methods, which were proposed many years ago and are widely applied in China, consist of two models, the GOD model and DRASTIC model. The assessment process of the GOD model is relatively simple, as it only considers three indicators, which are
groundwater condition (G), characteristics of
overlying strata (O), and groundwater
depth (D) [
13]. The DRASTIC model [
14] is the earliest model for conducting a vulnerability assessment of groundwater that is based on the parametric system. It consists of seven indicators: groundwater depth (D), net recharge of aquifer (R), aquifer media (A), soil media (S), terrain (T), vadose zone (I), and hydraulic conductivity (C).
Due to its fewer evaluation indicators, the simple GOD model cannot comprehensively reflect the factors controlling the vulnerability of groundwater. The DRASTIC model is the most typically and commonly used index assessment method; however the parameters of some indicators are difficult to acquire on a regional scale, and some indicators overlap to a certain extent. In addition, this model is not suitable for some parameters in the inland arid regions of West China. On the basis of the GOD and DRASTIC models, Zhou
et al. [
15] proposed a DRAV model, which is suitable for the inland arid region of Northwest China. Four indicators are included in this model, which are groundwater
depth (D), net
recharge of aquifer (R),
aquifer characteristics (A) and lithology of the
vadose zone (V). The vulnerability of the phreatic water in the plain area of the Tarim Basin was evaluated by the DRAV model to reveal the regional features of the phreatic water’s vulnerability at a river basin level. Furthermore, Zhou
et al. [
16] proposed another VLDA model to evaluate the vulnerability of phreatic water in the plain area of the Yanqi Basin of Xinjiang in China; this was on the basis of the GOD, DRASTIC and DRAV models. Its indicators include lithology of the
vadose zone (V), pattern of
land use (L), groundwater
depth (D), and
aquifer characteristics (A).
With reference to the literature regarding the DRAV model and VLDA model, both models were combined and adjusted in this paper so that they would be suitable for the inland arid region of Northwest China. Subsequently, the indicators, lithology of the vadose zone (V), groundwater depth (D), groundwater exploitation (E), aquifer characteristics (A) and pattern of land use (L), are included in a new model, i.e., the VDEAL model. Compare with DRASTIC model, we delete indicators of net recharge(R), soil media (S) and conductivity of the aquifer (C), which are difficult to obtain data, and leave out indicator of topography (T), which is meaningless to plan area in the VDEAL model. And we add indicator of groundwater exploitation (E), which has a significant impact on the groundwater vulnerability of arid zone in VDEAL model combining the advantages of DRAV model and VLDA mode. VDEAL model we proposed contains fewer indicators which easy to obtain data. Therefore, it is suitable and has good application prospects on groundwater vulnerability assessment in arid zone, which has less research.
The weight of each evaluation indicator will be assigned based on its importance to the vulnerability of groundwater. There is neither a uniform method nor a uniform criterion for the evaluation of vulnerability. Therefore, in order to ensure the universality, simplicity and accuracy, a comprehensive index evaluation method was employed in this article. The comprehensive evaluation index
R, which is calculated as follows, is the weighted sum of the above five indicators:
where
R is the comprehensive evaluation index for the vulnerability of the groundwater system;
Wi is the weight of
i-th indicator, and the sum of the weight =1; and
Xi is the assigned value of the
i-th indicator.
A smaller R value indicates a less vulnerable groundwater system with a higher stability and a stronger self-recovery function. Otherwise, the groundwater system is more vulnerable and its recovery capacity is relatively poor.
4. A Determination of Indicator Weights
According to monitoring data from 2003 and 2011, the variations in phreatic water quality in the plain area of the Junggar Basin were divided into three types by Ji
et al. [
17], that is, the water quality may have deteriorated, be unchanged or improved. Four groups of indicator weights were configured to calculate the vulnerability index using the VDEAL model (
Table 1). The variations of phreatic water quality were evaluated on the basis of the vulnerability index. Then, the third group of weights was selected for the VDEAL model according to the principle that the sampling sites of deteriorated water quality are generally distributed in high vulnerability regions, and the sites of unchanged and improved water quality are distributed in middle vulnerability, low vulnerability and invulnerable regions. The normalized weights of V, D, E, A, and L were 0.15, 0.25, 0.10, 0.10, and 0.40, respectively.
Table 1.
Four groups of indicator weights configured for the VDEAL model.
Table 1.
Four groups of indicator weights configured for the VDEAL model.
| Indicators | V | D | E | A | L |
|---|
| Weights of the first group | 0.20 | 0.20 | 0.20 | 0.20 | 0.20 |
| Weights of the second group | 0.25 | 0.20 | 0.15 | 0.10 | 0.30 |
| Weights of the third group | 0.15 | 0.25 | 0.10 | 0.10 | 0.40 |
| Weights of the fourth group | 0.30 | 0.20 | 0.10 | 0.10 | 0.30 |
5. A Vulnerability Assessment of the Groundwater
5.1. The Lithology of the Vadose Zone (V)
The lithology of the vadose zone directly determines the properties of the rock medium between the soil layer and aquifer for removing pollutants. It is also the main factor influencing various physical and chemical processes of pollutants before they reach the aquifer. The smaller the particles of the medium in the vadose zone, the fewer the pollutants reaching the aquifer and the lower the vulnerability of groundwater will be. The vadose zone of the plain area of the Junggar Basin consists of sandy gravel, silty fine sand, sandy loam, and mild clay [
18]. The grading and distribution for this indicator are shown in
Table 2.
Table 2.
The grading and area statistics of the lithology of the vadose zone (V).
Table 2.
The grading and area statistics of the lithology of the vadose zone (V).
| The Lithology of the Vadose Zone | Assigned Value | Weighted Value | Area (km2) | Proportion (%) |
|---|
| Sandy gravel | 10 | 1.50 | 30,417 | 32.7 |
| Silty fine sand | 7 | 1.05 | 26,903 | 29.0 |
| Sandy loam | 5 | 0.75 | 28,618 | 30.8 |
| Mild clay | 3 | 0.45 | 6990 | 7.5 |
| Total | | | 92,928 | 100.0 |
5.2. The Phreatic Water Depth (D)
The phreatic water depth is also a critical factor in the indicator system of the VDEAL model, as it determines the hydrogeochemical processes as well as the physical and chemical processes of pollutants before they reach the aquifer. It also influences the time of the contact between the pollutants and the medium of the vadose zone. Therefore, the phreatic water depth controls the possibility of whether the pollutants will enter the groundwater. Generally, the deeper the phreatic water depth, the longer the time needed by pollutants to transfer from the surface to the aquifer will be. This means that the pollutants have more time to make contact with the rock particles, oxygen and microbes in the movement process, and therefore more opportunities to be diluted, absorbed and degraded. Subsequently, the possibility of the pollutants reaching the groundwater system is reduced, and the vulnerability of the groundwater is relatively lower. The phreatic water depth was graded based on this rule. According to the research of Dong and Deng [
18], and the Department of Land and Resources of the Xinjiang Uygur Autonomous Region [
19], the phreatic water depths of this region were divided into five classes: <1 m, 1–3 m, 3–6 m, 6–10 m, and >10 m. According to the grading principle of the VDEAL model, the assigned value of the groundwater depths in the plain area of the Junggar Basin were 2–10, and the weighted values were 0.5–2.5 (see
Table 3).
Table 3.
The grading and area statistics of the phreatic water depth (D).
Table 3.
The grading and area statistics of the phreatic water depth (D).
| The Phreatic Water Depth (m) | Assigned Value | Weighted Value | Area (km2) | Proportion (%) |
|---|
| <1 | 10 | 2.5 | 822 | 0.9 |
| 1–3 | 8 | 2.0 | 13,120 | 14.1 |
| 3–6 | 6 | 1.5 | 28,161 | 30.3 |
| 6–10 | 4 | 1.0 | 13,584 | 14.6 |
| >10 | 2 | 0.5 | 37,241 | 40.1 |
| Total | | | 92,928 | 100.0 |
5.3. The Degree of Phreatic Water Exploitation (E)
Firstly, groundwater exploitation will increase the flow velocity of groundwater, resulting in acceleration in the movement and diffusion of pollutants and an increase in the range of pollution. The large scale of groundwater exploitation will reduce the groundwater amount, and then weaken the capacity for pollutant dilution. Secondly, the surrounding low quality groundwater will recharge the regional exploitation, resulting in the further deterioration of groundwater quality in this area. Thirdly, the groundwater exploitation, especially the over-exploitation, will have a great impact on the phreatic water, causing the decline of the water level, the increase of the vadose zone depth, the transformation of part of the saturated zone to the vadose zone, and the reduction of the environment, which will change to more of an oxidative environment. This strengthening of the oxidation will result in the decomposition of some water-insoluble organic matter and the increase of SO
42−. In addition, more calcium and magnesian ions will be dissolved into water, which will increase the hardness of the water and further deteriorate the groundwater quality [
20]. Therefore, the greater the extent of the groundwater exploitation in the inland arid region, the more vulnerable the groundwater system will be. According to the results of a study by the Xinjiang Hydrology and Water Resources Bureau and Xinjiang Agriculture University [
21], the groundwater exploitation in the phreatic water regions of plain area of the Junggar Basin was divided into three levels: over-exploitation, a balance of exploitation and recharging, and a potentially exploited region. The grading and distribution of the groundwater exploitation are shown in
Table 4.
Table 4.
The grading and area statistics of the degree of phreatic water exploitation (E).
Table 4.
The grading and area statistics of the degree of phreatic water exploitation (E).
| The Degree of Groundwater Exploitation | Assigned Value | Weighted Value | Area (km2) | Proportion (%) |
|---|
| Over-exploited region | 9 | 0.9 | 21,012 | 22.6 |
| Exploitation-recharge balance region | 5 | 0.5 | 49,962 | 53.8 |
| Potentially exploited region | 3 | 0.3 | 21,954 | 23.6 |
| Total | | | 92,928 | 100.0 |
5.4. The Aquifer Characteristics (A)
The groundwater flow system controls the pollutants’ movement route and distance, and the aquifer characteristics (the type of aquifer, hydraulic conductivity or water yield property) in turn influence the seepage route of the groundwater. For a given type of aquifer (i.e., a phreatic aquifer in this article), the larger the hydraulic conductivity, the stronger water yield property and the better permeability indicate a faster movement of pollutants, weaker capacity for removing the pollutants by means of the aquifer, and the higher the vulnerability to groundwater pollution.
According to the research by the Department of Land and Resources of Xinjiang Uygur Autonomous Region [
19], the water yield property in the plain area of the Junggar Basin was divided into four levels: extremely abundant, abundant, moderately abundant, and deficient. The grading and distribution for this are shown in
Table 5.
Table 5.
The grading and area statistics of the water yield property of the phreatic water (A).
Table 5.
The grading and area statistics of the water yield property of the phreatic water (A).
| The Water Yield Property | Assigned Value | Weighted Value | Area (km2) | Proportion (%) |
|---|
| Extremely abundant | 9 | 0.9 | 315 | 0.3 |
| Abundant | 7 | 0.7 | 19,385 | 20.9 |
| Moderately abundant | 5 | 0.5 | 31,183 | 33.6 |
| Deficient | 3 | 0.3 | 42,045 | 45.2 |
| Total | | | 92,928 | 100.0 |
5.5. The Pattern of Land Use (L)
The pattern of land use (L) determines the water consumption or drainage for each unit of area, the process of consumption or drainage, types of pollution sources and the amount of pollutants. According to the “Map of Land Use Status in the Plain Area of the Junggar Basin”, which was compiled from the remote sensing image of Xinjiang of 2000, the land use patterns in the Junggar Basin were divided into farmland, grassland, wasteland, urban/industrial/mining land and forest. In the arid inland of Xinjiang, the considerable use of pesticides and chemical fertilizers in farmland, the irrigation of brackish water in some irrigation areas and an irrational irrigation method all lead to the infiltration of irrigation water into the groundwater. Therefore, the agricultural non-point source pollution is severe and the vulnerability of the groundwater is highest in farmland. The vulnerability of the groundwater is also higher in grasslands due to the long-term raising of livestock and the random emissions of animal excrement and wastewater. In wasteland, the ratio of evaporation to precipitation is large and the salt accumulation in the surface soil is severe, which will result in salt pollution and the moderate vulnerability of groundwater. In the plain area of the Junggar Basin, since the urban/industrial/mining region is of a small scale and the wastewater drainage and processing system is robust, the waste has a lower possibility of infiltrating into the groundwater. Therefore, the vulnerability of the groundwater in these regions is lower. Moreover, the vulnerability is the lowest in the forestland because of less interference from human activities. According to the grading principle of the VDEAL model, the land use pattern in different phreatic water regions of the plain area of the Junggar Basin was assigned the value of 3–9 and the weighted value of 1.2–3.6 (
Table 6).
Table 6.
The grading and area statistics of the land use pattern (L)
Table 6.
The grading and area statistics of the land use pattern (L)
| The Land Use Pattern | Assigned Value | Weighted Value | Area (km2) | Proportion (%) |
|---|
| Farmland | 9 | 3.6 | 30,874 | 33.2 |
| Grassland | 6 | 2.4 | 24,843 | 26.7 |
| Wasteland | 5 | 2.0 | 33,796 | 36.4 |
| Urban/industrial/mining land | 4 | 1.6 | 1004 | 1.1 |
| Forest | 3 | 1.2 | 2411 | 2.6 |
| Total | | | 92,928 | 100.0 |
6. A Vulnerability Assessment and Analysis of the Phreatic Water
6.1. A Determination of the Vulnerability Index R of the Phreatic Water
After obtaining the division maps of this region and basing these on the five indicators of the VDEAL model, the five maps were superposed using MAPGIS spatial analysis technology [
22]. Thus, a map reflecting the vulnerability index of the phreatic water in the plain area of the Junggar Basin was obtained. A total of 2473 patches were generated, and the vulnerability index was 2.95–8.90. In order to better reflect the degree of vulnerability of the phreatic water in different regions, the vulnerability index was divided into four levels (
Table 7): 2.0–4.0 (low vulnerability); 4.0–6.0 (middle vulnerability); 6.0–8.0 (high vulnerability); >8.0 (extremely high vulnerability) [
15,
16,
23].
Table 7.
A vulnerability evaluation of the phreatic water in the plain area of the Junggar Basin.
Table 7.
A vulnerability evaluation of the phreatic water in the plain area of the Junggar Basin.
| Vulnerability Index (R) | >8.0 | 8.0–6.0 | 6.0–4.0 | 4.0–2.0 | Total |
|---|
| Vulnerability Level | Extremely High Vulnerability | High Vulnerability | Middle Vulnerability | Low Vulnerability |
|---|
| Area (km2) | 860 | 33,406 | 56,664 | 1998 | 92,928 |
| Proportion (%) | 0.9 | 35.9 | 61.0 | 2.2 | 100.0 |
6.2. A Division of the Vulnerability of Phreatic Water
After the grade of the vulnerability was determined, the adjacent regions with the same grade were merged. Then the final distribution map of the vulnerability of the groundwater was obtained (
Table 7 and
Figure 1).
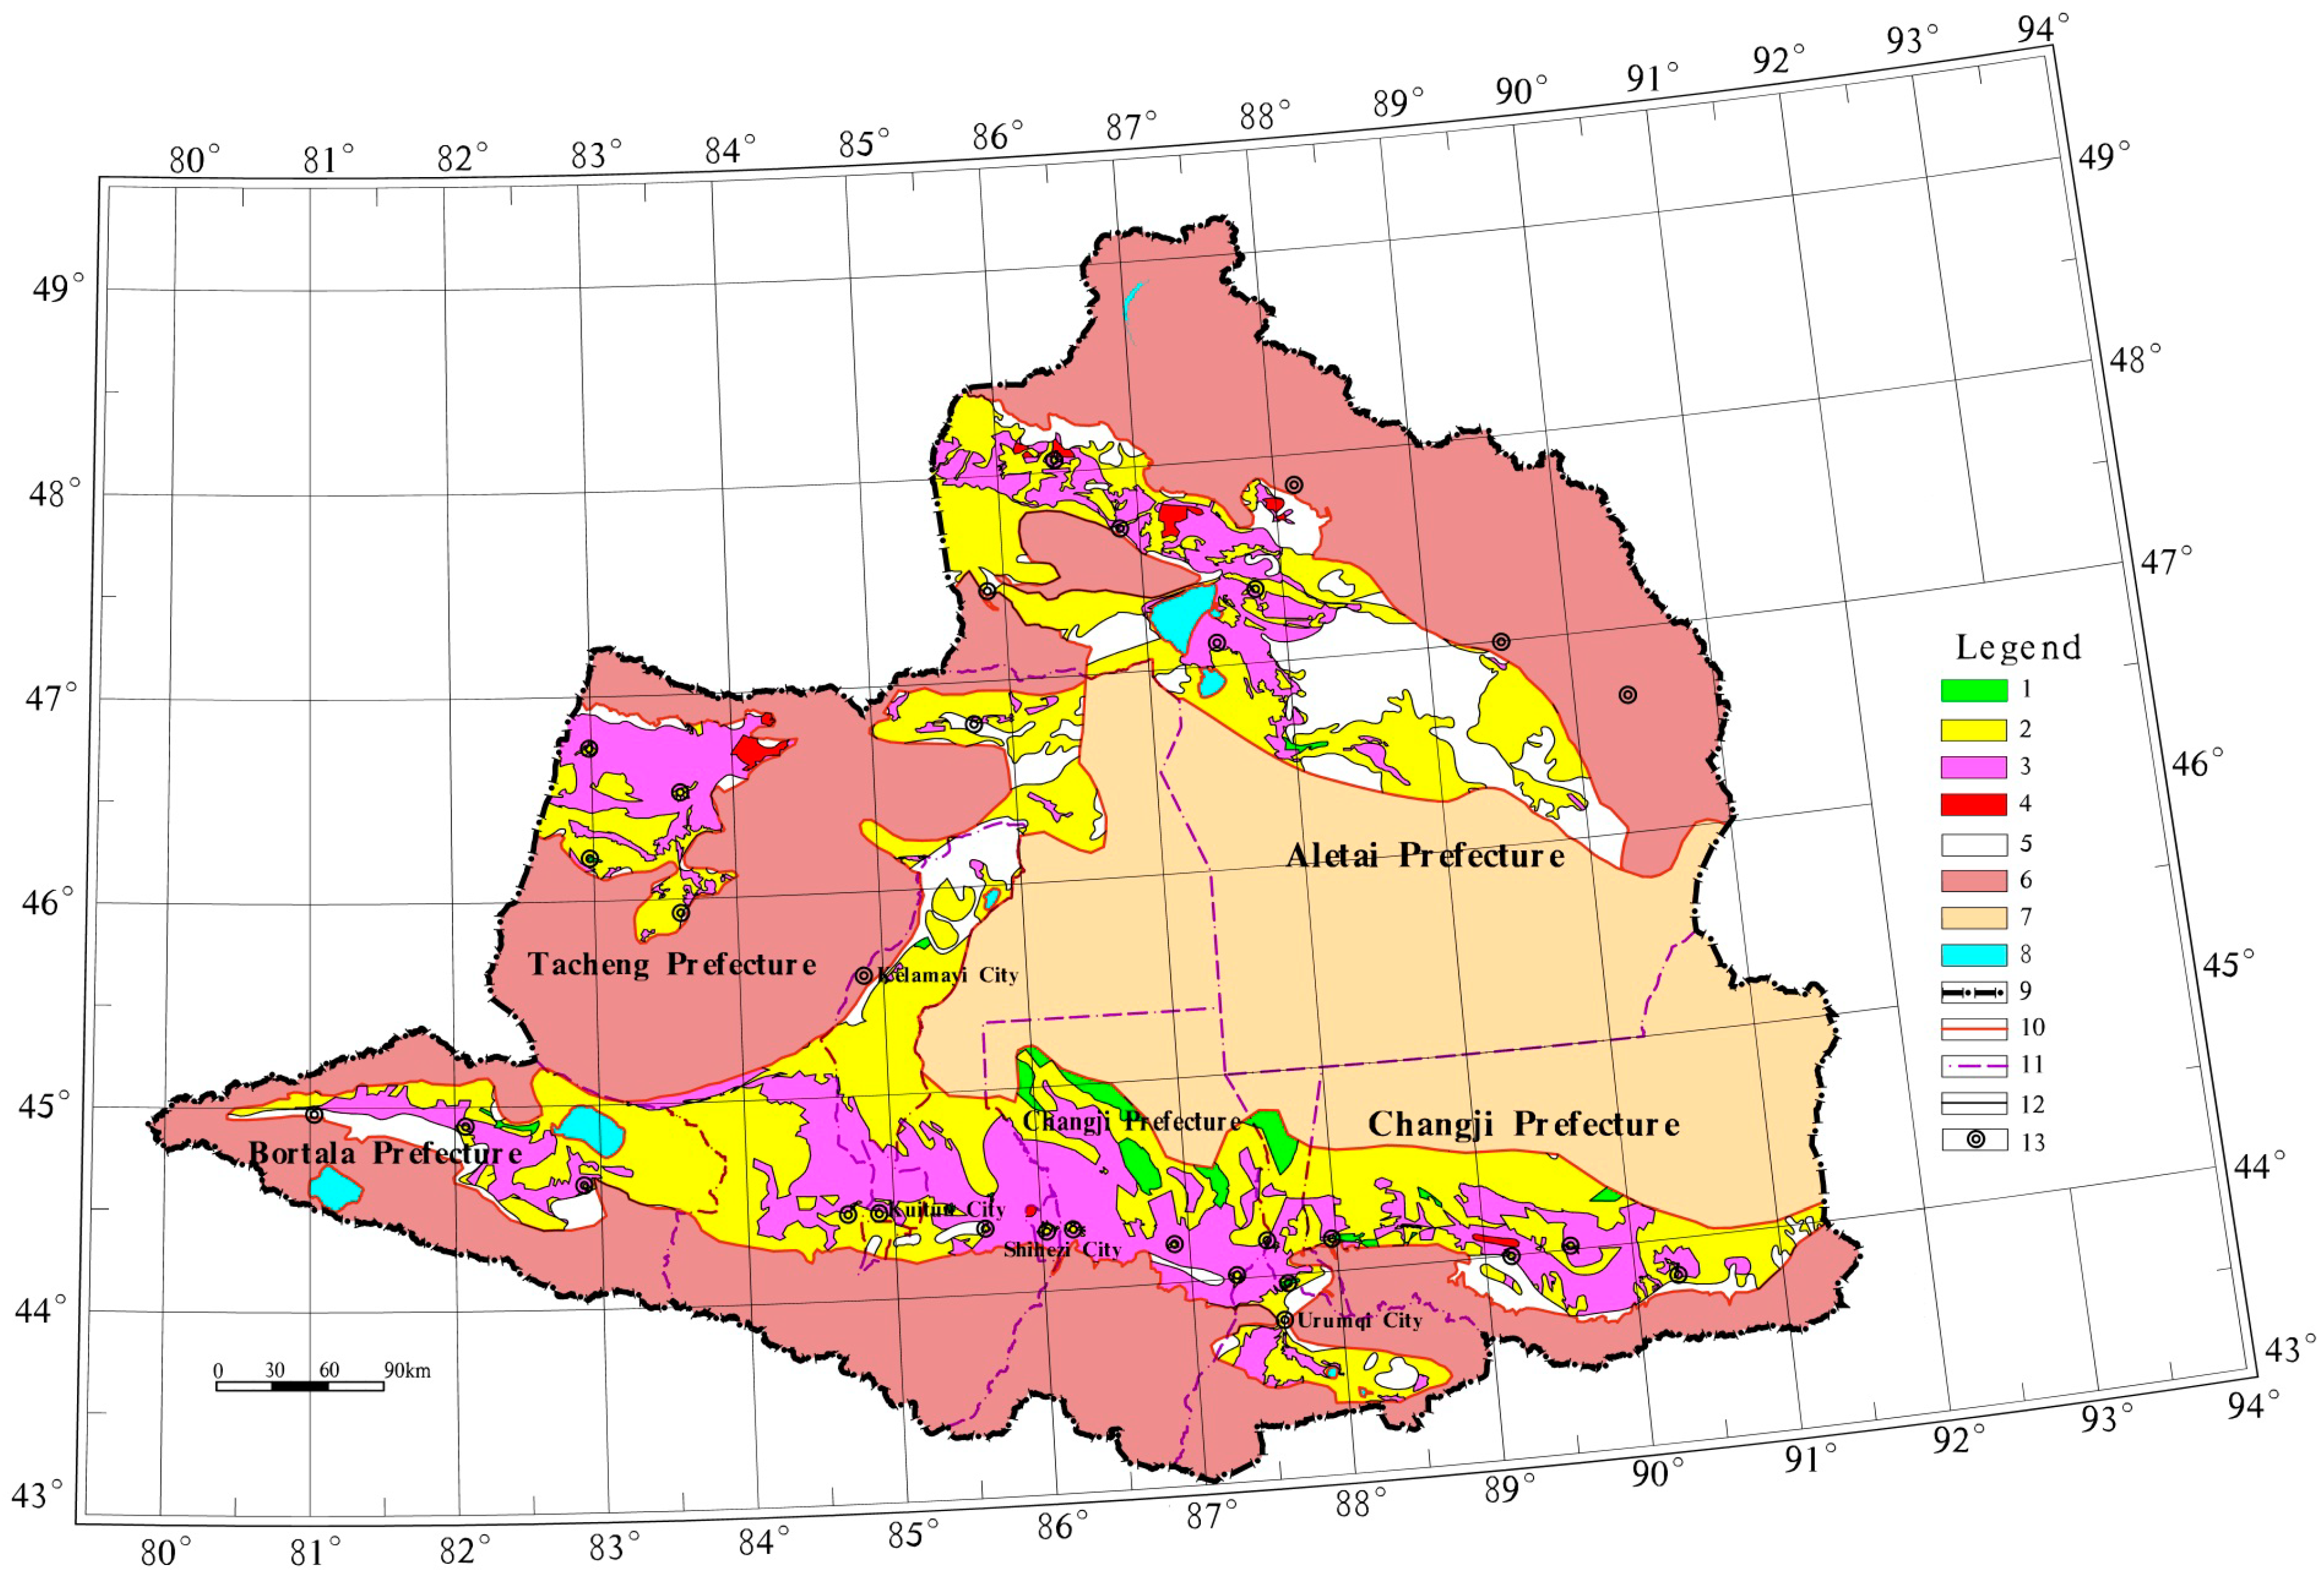
Figure 1.
A division map of the vulnerability of the phreatic water in the plain area of The Junggar Basin.
Figure 1.
A division map of the vulnerability of the phreatic water in the plain area of The Junggar Basin.
1. Low vulnerability; 2. Middle vulnerability; 3. High vulnerability; 4. Extremely high vulnerability; 5. Region without phreatic water; 6. Mountainous region; 7. Desert region; 8. Water region; 9. Basin boundary; 10. Plain boundary; 11. Prefecture (City) boundary; 12. Distribution boundary of the vulnerability of phreatic water; 13. Location of county (city).
6.3. A Vulnerability Analysis of the Phreatic Water
- (1)
The regions with vulnerability indexes of the phreatic water of 2.0–4.0, 4.0–6.0, 6.0–8.0 and >8.0, respectively, account for 2.2%, 61.0%, 35.9% and 0.9% of the plain area of the Junggar Basin.
- (2)
The regions with a higher vulnerability of groundwater are mainly distributed in the farmlands and the sandy-gravel regions with a groundwater depth of <3 m. In the Junggar Basin where there is undeveloped industry, the large-scale agricultural production becomes the most important factor influencing the vulnerability of the phreatic water.
- (3)
The regions with a lower vulnerability of groundwater are generally located in the non-irrigation regions with a sandy loam or silty fine sand and a groundwater depth of >6 m. These regions are short of phreatic water, and do not receive infiltration from irrigation water and only receive a very limited recharge from precipitation.
- (4)
As shown in
Table 8, the Aletai Prefecture, Bortala Prefecture, Changji Prefecture, Shihezi City and Tacheng Prefecture make up a small area with an extremely high vulnerability; accounting respectively for 1.8%, 1.0%, 0.4%, 6.7%, and 1.1% of the total area of each prefecture or city evaluated. These highly vulnerable regions are distributed in the farmlands with a rich water yield and a phreatic water depth of <3 m. The large areas of Kuitun City and Shihezi City are regions with a high vulnerability, respectively accounting for 74.9% and 84.1% of the total area of each city evaluated. Since the two regions are intensively developed by the Xinjiang Uygur Autonomous Region and Xinjiang Production and Construction Corps, a huge exploitation of groundwater has led to severe over-exploitation, and most of the phreatic water displays a high vulnerability. The phreatic water in most regions of Kelamayi City (accounting for 89.5% of the total area of the city evaluated) shows a moderate vulnerability. This may be because this city has a larger phreatic water depth and a lower intensity of phreatic water exploitation. Most of the areas of the Aletai Prefecture and Bortala Prefecture show a moderate vulnerability, respectively accounting for 69.5% and 70.0% of each prefecture. These areas have a relatively small-scale industrial and agricultural production and a low-intensity exploitation of phreatic water.
Table 8.
A vulnerability evaluation of phreatic water in each prefecture or city in the plain area of the Junggar Basin (Unit of area: km2).
Table 8.
A vulnerability evaluation of phreatic water in each prefecture or city in the plain area of the Junggar Basin (Unit of area: km2).
| Prefecture or City | Low Vulnerability | Middle Vulnerability | High Vulnerability | Extremely High Vulnerability | Total |
|---|
| Area | % | Area | % | Area | % | Area | % |
|---|
| Urumqi City | 444 | 8.8 | 2958 | 58.5 | 1651 | 32.7 | 0 | 0.0 | 5053 |
| Kelamayi City | 31 | 0.6 | 5047 | 89.5 | 559 | 9.9 | 0 | 0.0 | 5637 |
| Changji prefecture | 1425 | 5.9 | 12,593 | 52.4 | 9926 | 41.3 | 87 | 0.4 | 24,031 |
| Tacheng prefecture | 29 | 0.1 | 14,733 | 55.4 | 11,546 | 43.4 | 285 | 1.1 | 26,593 |
| Aletai prefecture | 69 | 0.3 | 15,268 | 69.5 | 6232 | 28.4 | 385 | 1.8 | 21,954 |
| Bortala prefecture | 0 | 0.0 | 5769 | 70.0 | 2391 | 29.0 | 78 | 1.0 | 8238 |
| Shihezi City | 0 | 0.0 | 36 | 9.2 | 327 | 84.1 | 26 | 6.7 | 389 |
| Kuitun City | 0 | 0.0 | 259 | 25.1 | 774 | 74.9 | 0 | 0.0 | 1033 |
| Total | 1998 | 2.2 | 56,663 | 61.0 | 33,406 | 35.9 | 861 | 0.9 | 92,928 |
7. Groundwater Protection in the Junggar Basin
In the context of the rapid development of Xinjiang, the Junggar Basin will also witness enormous progress due to abundant hydrocarbon resources, high-quality land resources and a unique natural landscape. The principle of “prevention first”, which combines prevention and control measures, should be adhered to in the protection of the groundwater environment of this region. The districts with a higher vulnerability of phreatic water should not be used as industrial or agricultural lands, in order to avoid the pollution of the phreatic water. When implementing the exploration and exploitation of oil and gas in those districts with a higher vulnerability, corresponding protective measures should be carried out for the local environment. The scientific use of pesticides and chemical fertilizers and a highly-efficient water-saving irrigation technique should be implemented in the vulnerable districts in order to reduce the residues of pesticides and chemical fertilizers, as well as the problems associated with irrigation water becoming infiltrated. Moreover, the methods of raising livestock should be reasonably adjusted, and its scale should be controlled in those regions with a higher vulnerability.
8. Conclusions
A VDEAL model, which is suitable for the vulnerability evaluation of groundwater in the plain area of the Junggar Basin, Xinjiang, China, was proposed on the basis of the GOD method and DRASTIC model. Five indicators were selected by referring to the DRAV and VLDA models, namely, lithology of the vadose zone (V), groundwater depth (D), degree of groundwater exploitation (E), aquifer characteristics (A), and land use pattern (L).
VDEAL model we proposed contains fewer indicators which easy to obtain data. Therefore, it is suitable and has good application prospects on groundwater vulnerability assessment in arid zones, which has less research.
The distribution regions of the phreatic water with a low vulnerability (where the vulnerability indexes are 2.0–4.0), middle vulnerability (the vulnerability indexes are 4.0–6.0), high vulnerability (the vulnerability indexes are 6.0–8.0) and extremely high vulnerability (the vulnerability indexes are greater than 8.0), respectively, account for 2.2%, 61.0%, 35.9%, and 0.9% of the plain area of the Junggar Basin.

