1. Introduction
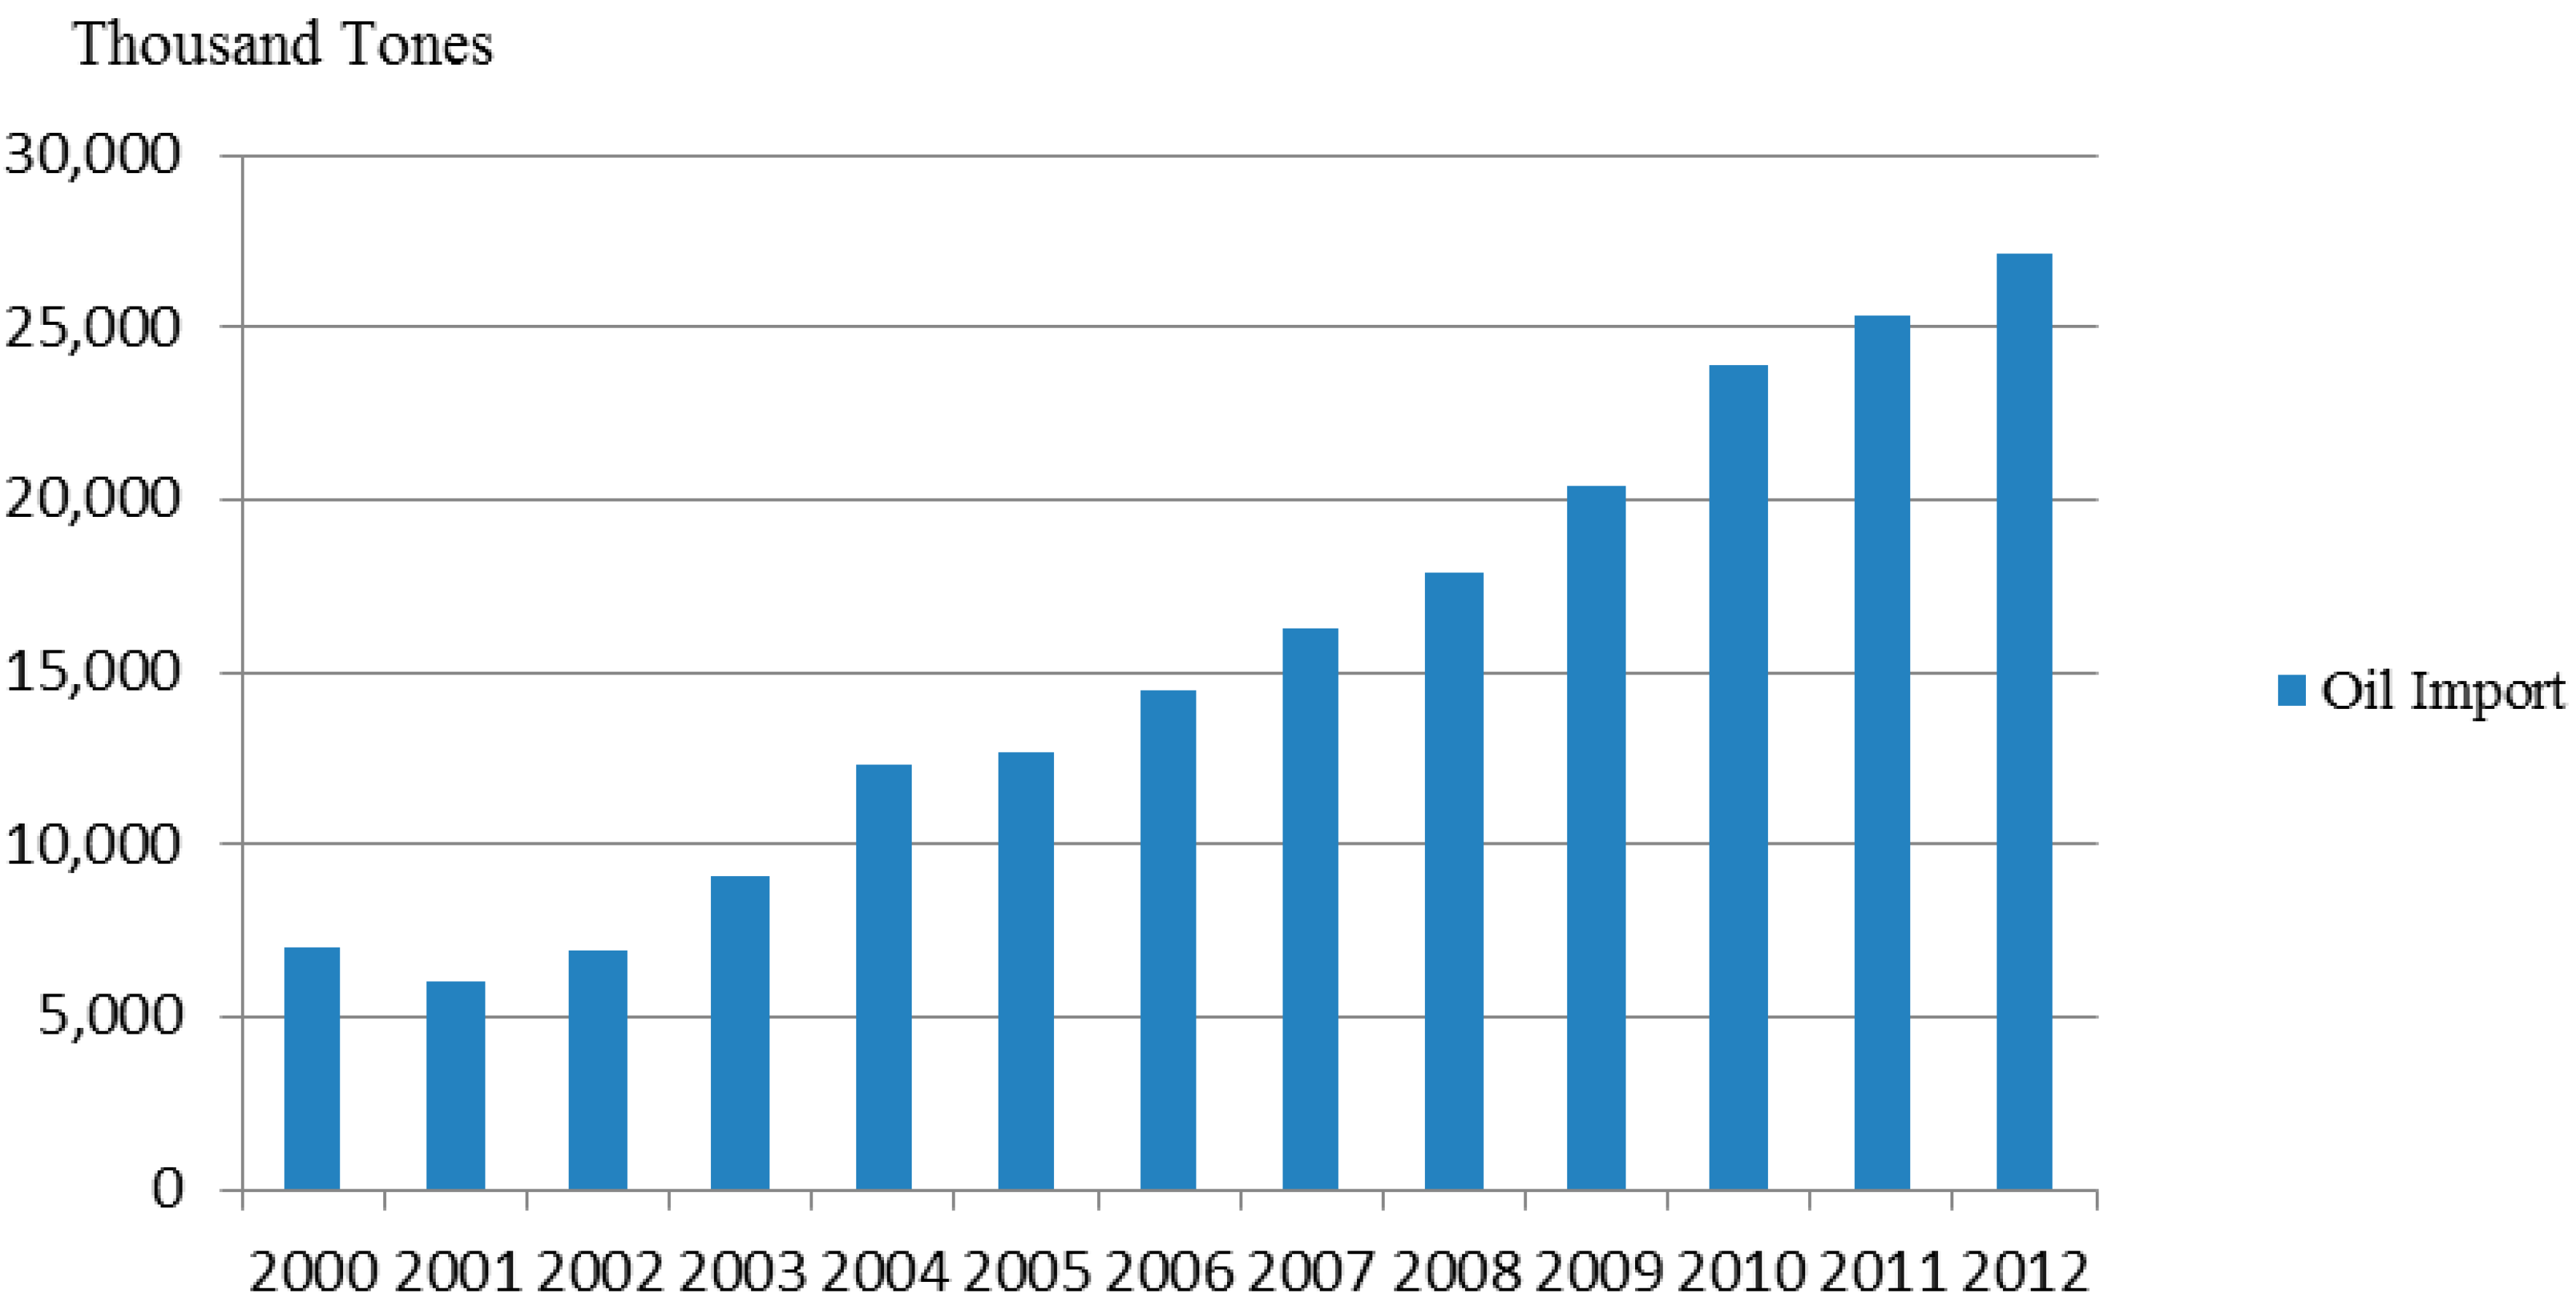
In 2013, China imported 282 million tons of crude oil with an external dependence of 58.1%, surpassing the USA as the world’s largest net oil importer. China’s oil imports have increased over the years, as shown in
Figure 1, and in response to the rapid growth in world oil demands, China has adopted a positive import source diversification strategy, which has been recognized by countries all over the world as preventing some individual countries from reducing or stopping their oil supply.
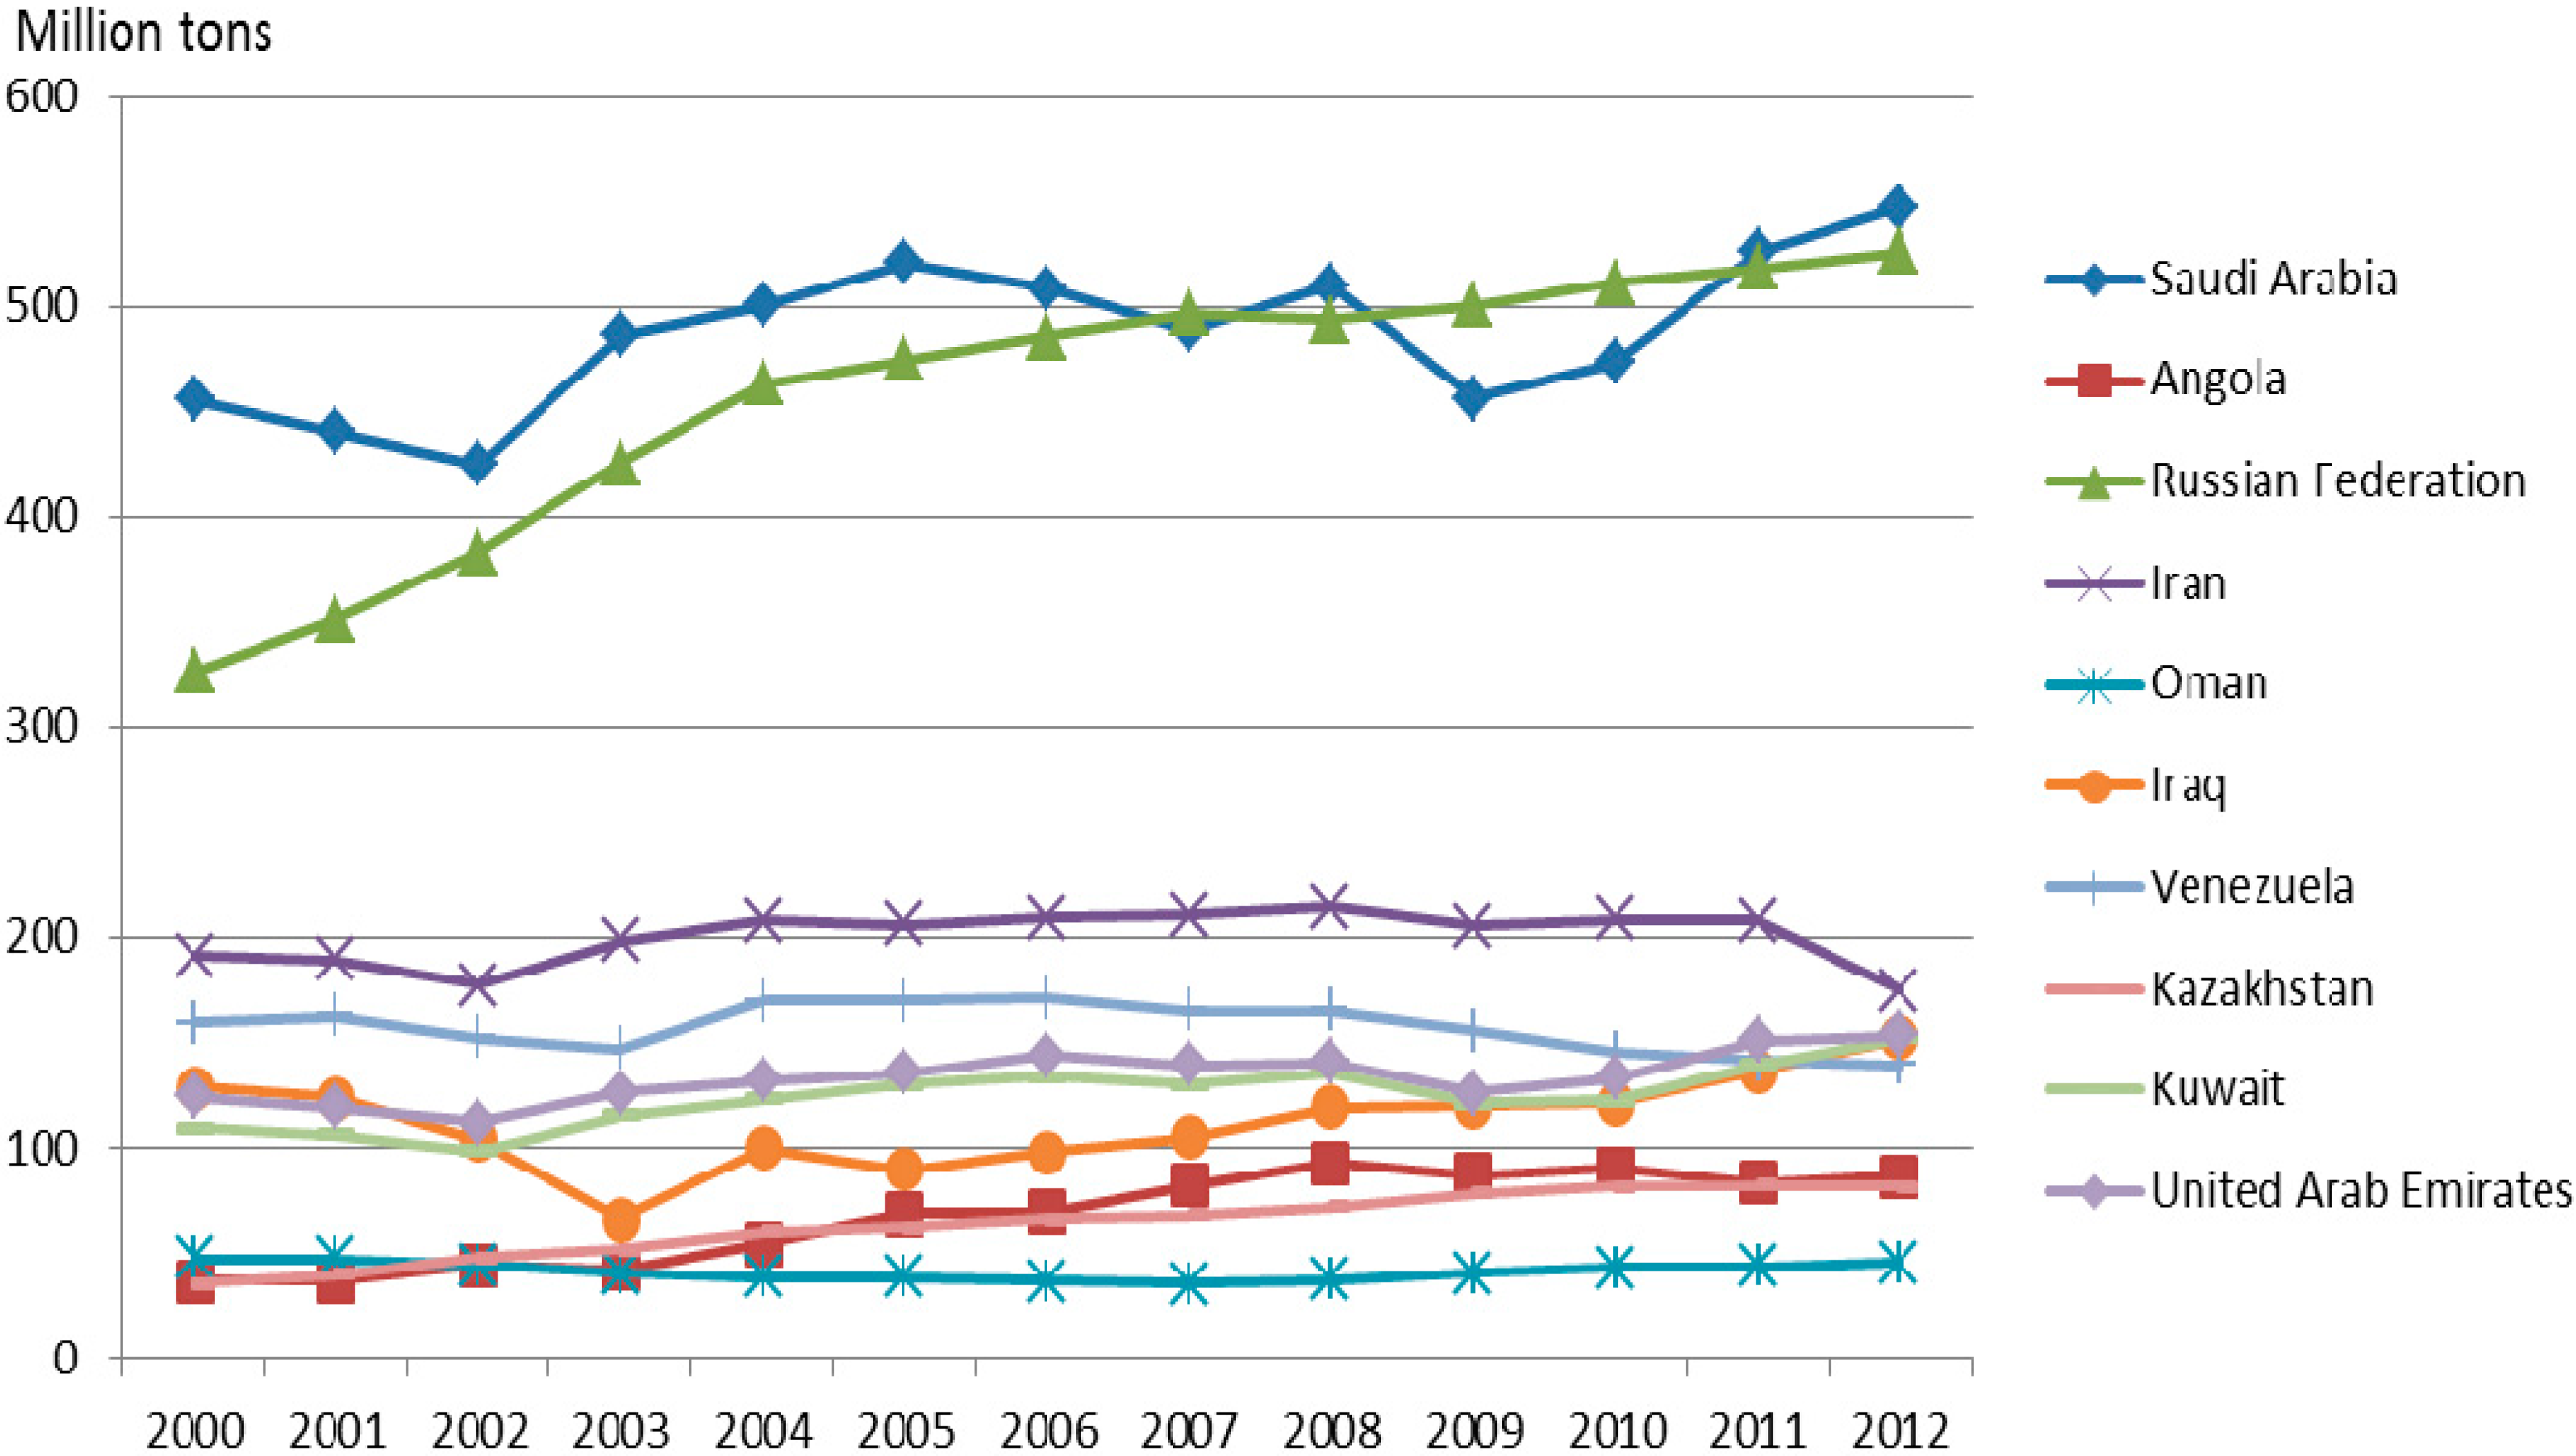
Since China became a net oil importer in 1996, the number of major oil importing countries has increased from 11 to 35. Nearly a decade later, the top five oil importing countries have remained stable, accounting for about 60% of the total oil imports, and some adjustments have been made in countries from the sixth to tenth place, whose import proportion remains at about 20%. At the same time, China has developed some overland oil import channels, building oil pipelines with Kazakhstan, Russia and Myanmar, which, to some extent, has reduced the risk from oil importing that China faces. However, there still exist some problems: (1) China’s major import sources are focused in some politically unstable regions, such as the Middle East and Africa. China’s top ten source countries are Saudi Arabia, Angola, Iran, Russia, Yemen, Oman, Sultan, Iraq and Venezuela, which have high risks. The oil supply is susceptible to emergencies and political sanctions; (2) The production of major import source countries illustrates a downward trend, which can be in
Figure 2. Except for Saudi Arabia and Russia, who maintain higher yields, many other countries, such as Iraq, Angola and Oman, show a downward trend; (3) Because the geographical location of the source countries is concentrated in the Middle East and Africa, the mode of transportation is too singular. Although there are overland pipeline transportation routes, China depends on marine channels to import two thirds of the oil, most of which relies on foreign shipping corporations. Additionally, the Malacca strait, Somalian waters and the Gulf of Aden are vital shipping routes, which have suffered many pirate attacks [
1]. Thus, the import source diversification strategy of China does not fundamentally reduce the risk of importing oil, and it is difficult to guarantee China’s oil import demands in the future.
Figure 1.
2000–2012 China oil import volume.
Figure 1.
2000–2012 China oil import volume.
Figure 2.
2000–2012 oil production of China’s oil import sources.
Figure 2.
2000–2012 oil production of China’s oil import sources.
The International Energy Agency (IEA) predicts that the oil gap for China will increase to 400 million tons by 2020. China will face cut-throat competition with both traditional oil importers and emerging oil importers, dealing with complex geopolitical relationship and all kinds of emergencies and problems of oil export regions. Meanwhile, there is a huge imbalance in the oil reserves in the whole world. In detail, the proven oil reserves of North America account for 13.6%, South and Central America 19.5%, Europe and Eurasia 8.8%, the Middle East 47.9%, Africa 7.7%, Asia Pacific 2.5% of oil reserves worldwide. The oil reserves of Africa, the former Soviet Union, the Middle East and South America account for 83.6% of the whole world, while their consumption is only 24.8% [
2]. Oil reserves are unbalanced across all countries; there is a huge imbalance between oil producing and consuming countries. However, because of the political nature of oil, there is fierce competition among countries. If the importers want to have access to a safe and stable supply, they should resort to political, economic and even military force. This implies that the number of import source countries will not be increased unlimitedly. If the traditional import source diversification strategy is still adopted, could China’s oil supply be sustainable under the imbalanced conditions of oil reserves? Is it feasible for China to optimize oil import source diversification?
The paper is organized as follows: after the Introduction, the
Section 2 gives a brief overview of the import source diversification strategy that is necessary to ensure oil supply security.
Section 3 addresses the model built by the oil import source diversification index. In
Section 4, we describe the oil import source diversification index of China (2012) and the USA (2012), as well as the oil production distribution index of oil exporters in the world. In the final section, policy implications are derived.
2. Literature Review
Energy security is very important for any country, but its concept is very confusing and has been broadened over time. Many authors give different definitions [
3,
4,
5,
6,
7,
8,
9]. Christian Winzer [
10] “suggests narrowing down the concept of energy security to the concept of energy supply continuity”. An importer takes insurance measures against the disruptions of energy importing at reasonable prices to support its economic growth and social welfare [
11,
12,
13].
Despite the fact that there are different risk sources [
14,
15], import source diversification strategies has been recognized by countries all over the world [
16] and studied in various countries and regions [
17,
18,
19,
20]. Oil import source diversification refers to the mix of state providers of oil [
19]. Diversification was quantified by using one or more of the scientific measures of diversification. Neff [
19] utilized the Herfindahl–Hirschman index (HHI) for market concentration to value energy supply dependence across the fuels of Asia Pacific. Most of the literature [
18,
19,
20,
21] uses HHI to measure diversification.
From the review of the literature, it is clear that an importer should enhance the diversification degree against the disruption of the oil supply. However, the exact objective is not given. Many scholars chose to use the HHI method to build a diversified index. The HHI method can give a company with a bigger market share more weight, amplify the company’s influence and reflect the impact of large-scale companies on the changes of market concentration sensitively and in an exaggerated way. However, the method cannot react to the unbalanced market truthfully and accurately; hence, it is not intuitive. Therefore, we will use the oil import diversification index based on the Gini coefficient method to analyze oil import diversification situations, the imbalanced oil production characteristics of export countries and oil reserve distribution of exporters. Finally, we put forward the goal of China’s oil import diversification strategy.
3. Data and Method
3.1. Data Sources
The data for China’s oil importing (2012) are taken from China’s Customs Statistics Yearbook (2012). The data for the USA’s oil importing (2012) and the oil production of oil export countries are taken from the Energy Information Administration (EIA), U.S. Department of Energy.
3.2. Model of Oil Import Source Diversification Index
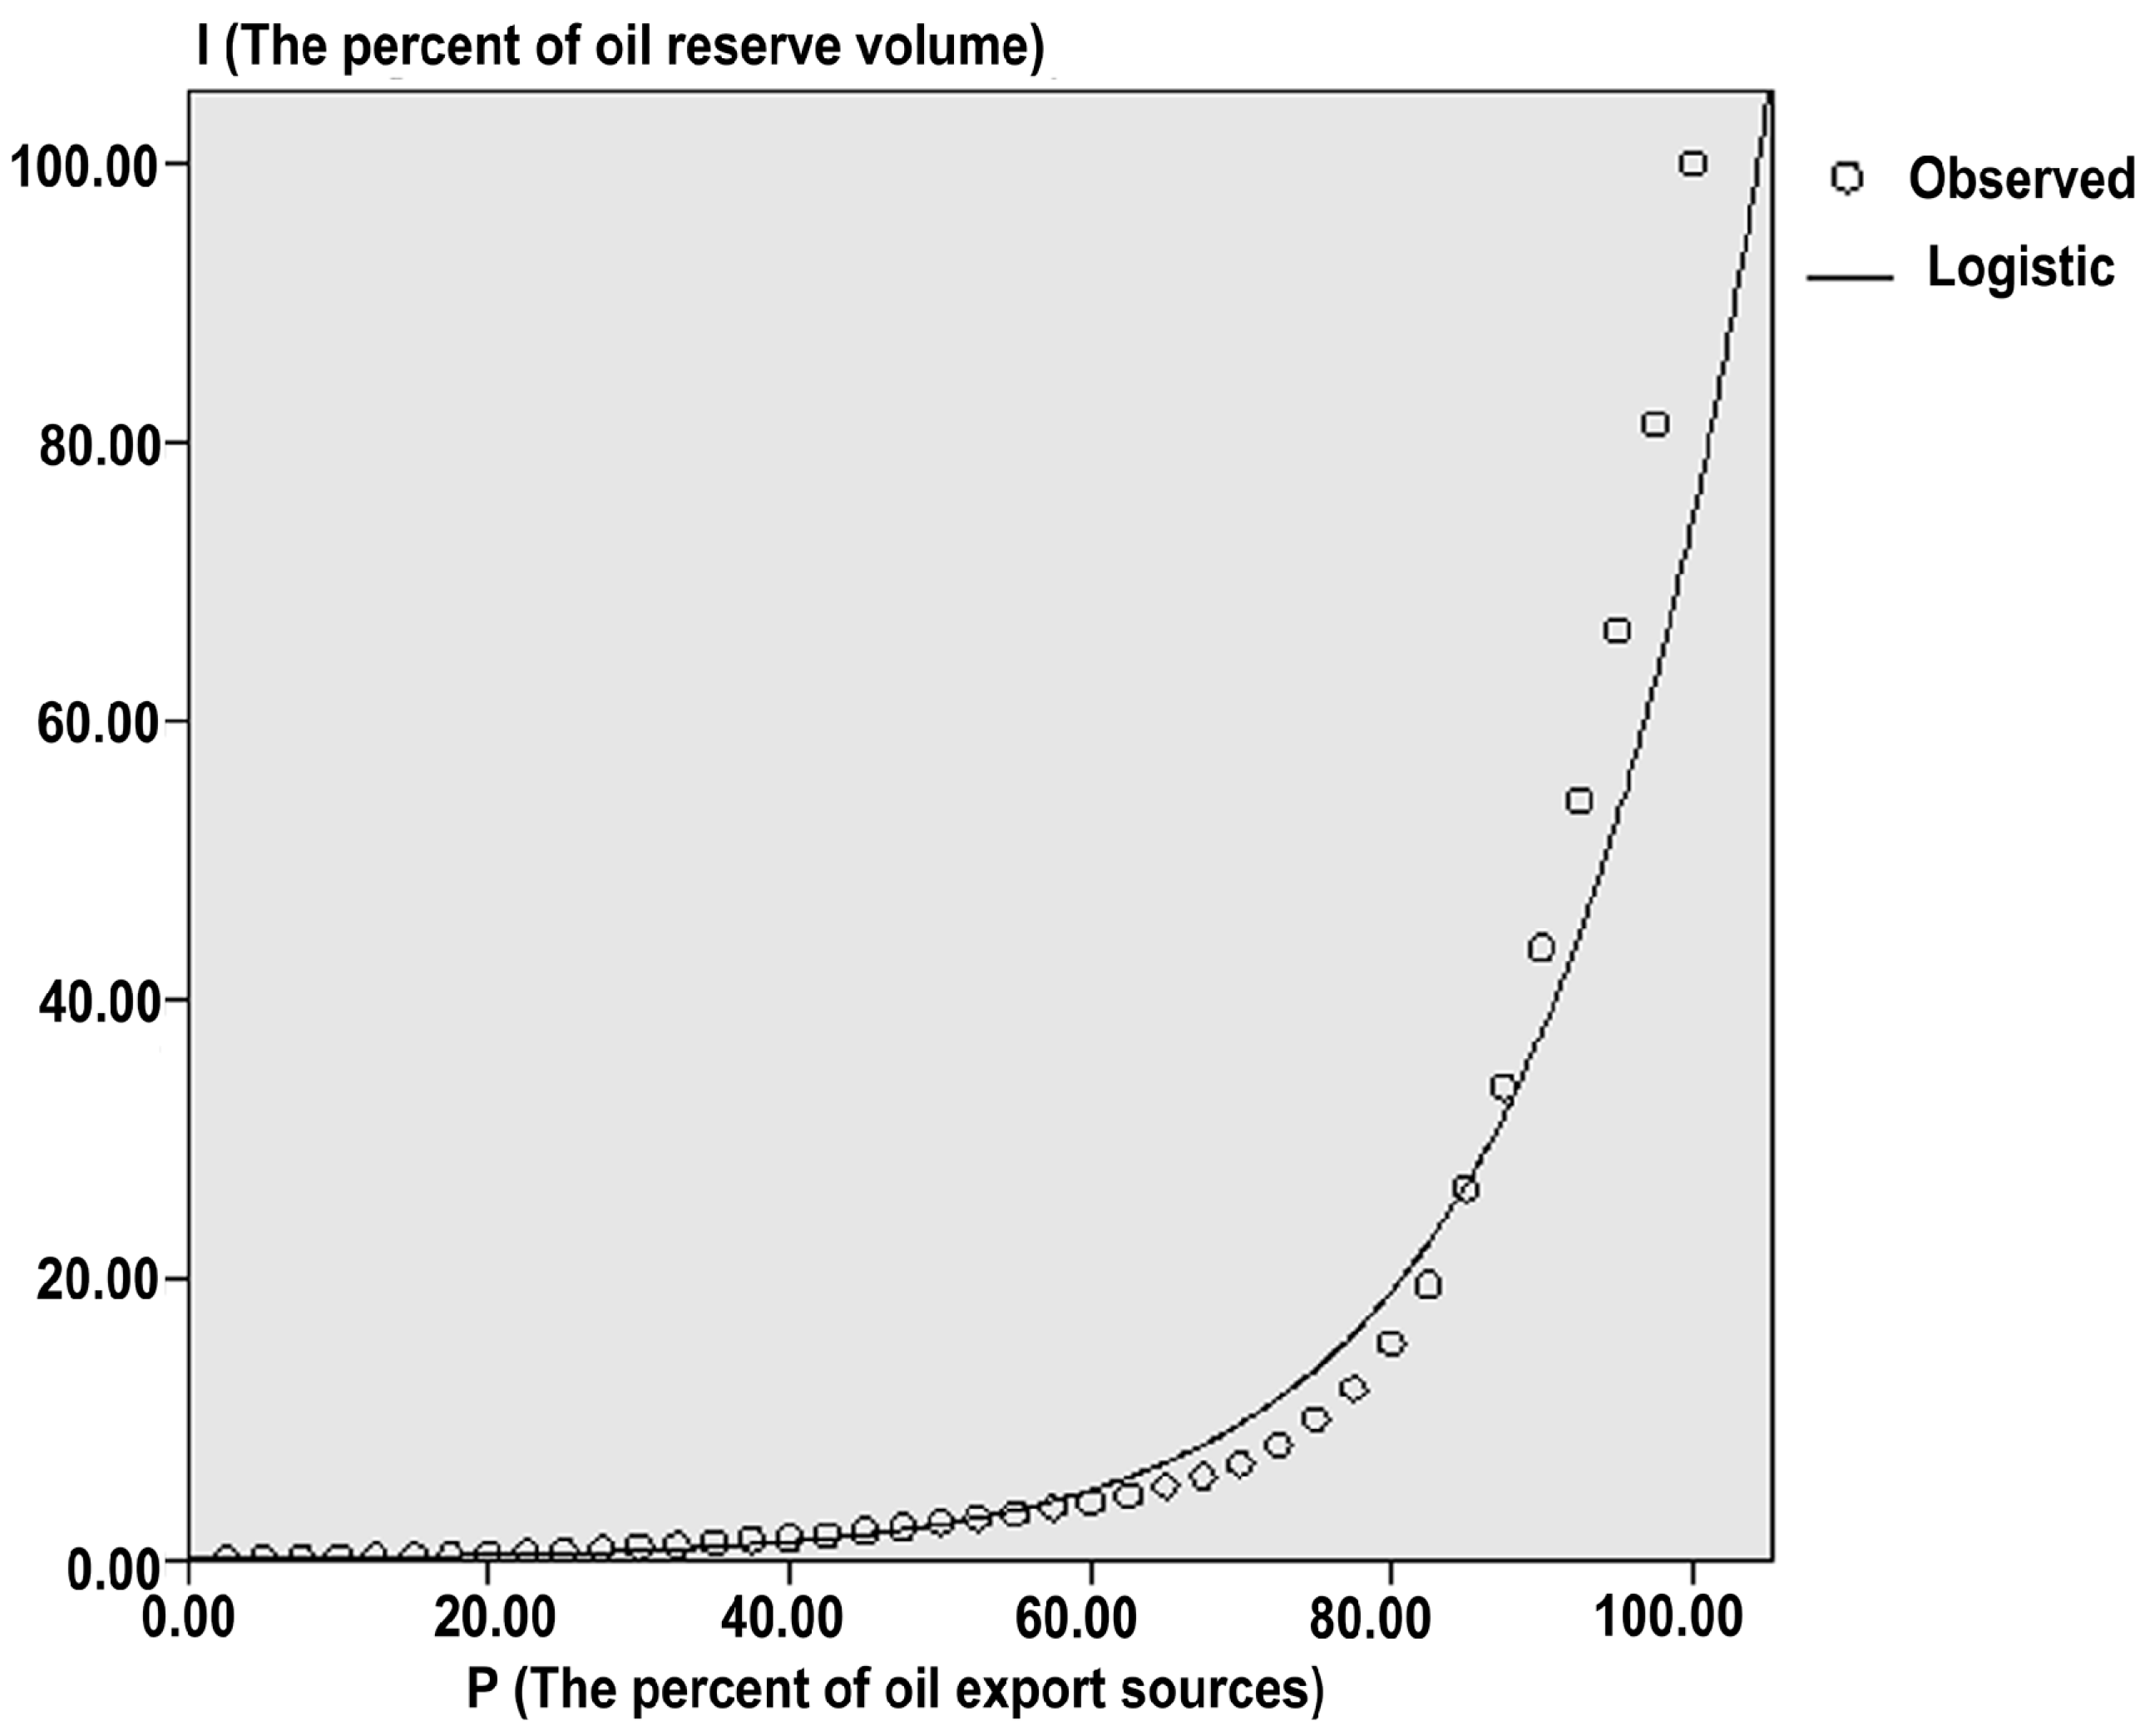
Lorenz proposed using the cumulative percentage curve as a method to test the degree of social income imbalance in 1905, namely the Lorenz curve. By mapping the Lorenz curve of a country, one can observe and analyze the degree of balance and concentration of its income distribution. In order to accurately reflect the changing degree of income distribution, C. Gini proposed a measure to indicate the balance level of income distribution, namely the Gini coefficient. The index values are between 0 and 1. A value of zero means that the income is absolutely balanced. A value of one means that the income is absolutely unbalanced. A larger index value means a less balanced income distribution.
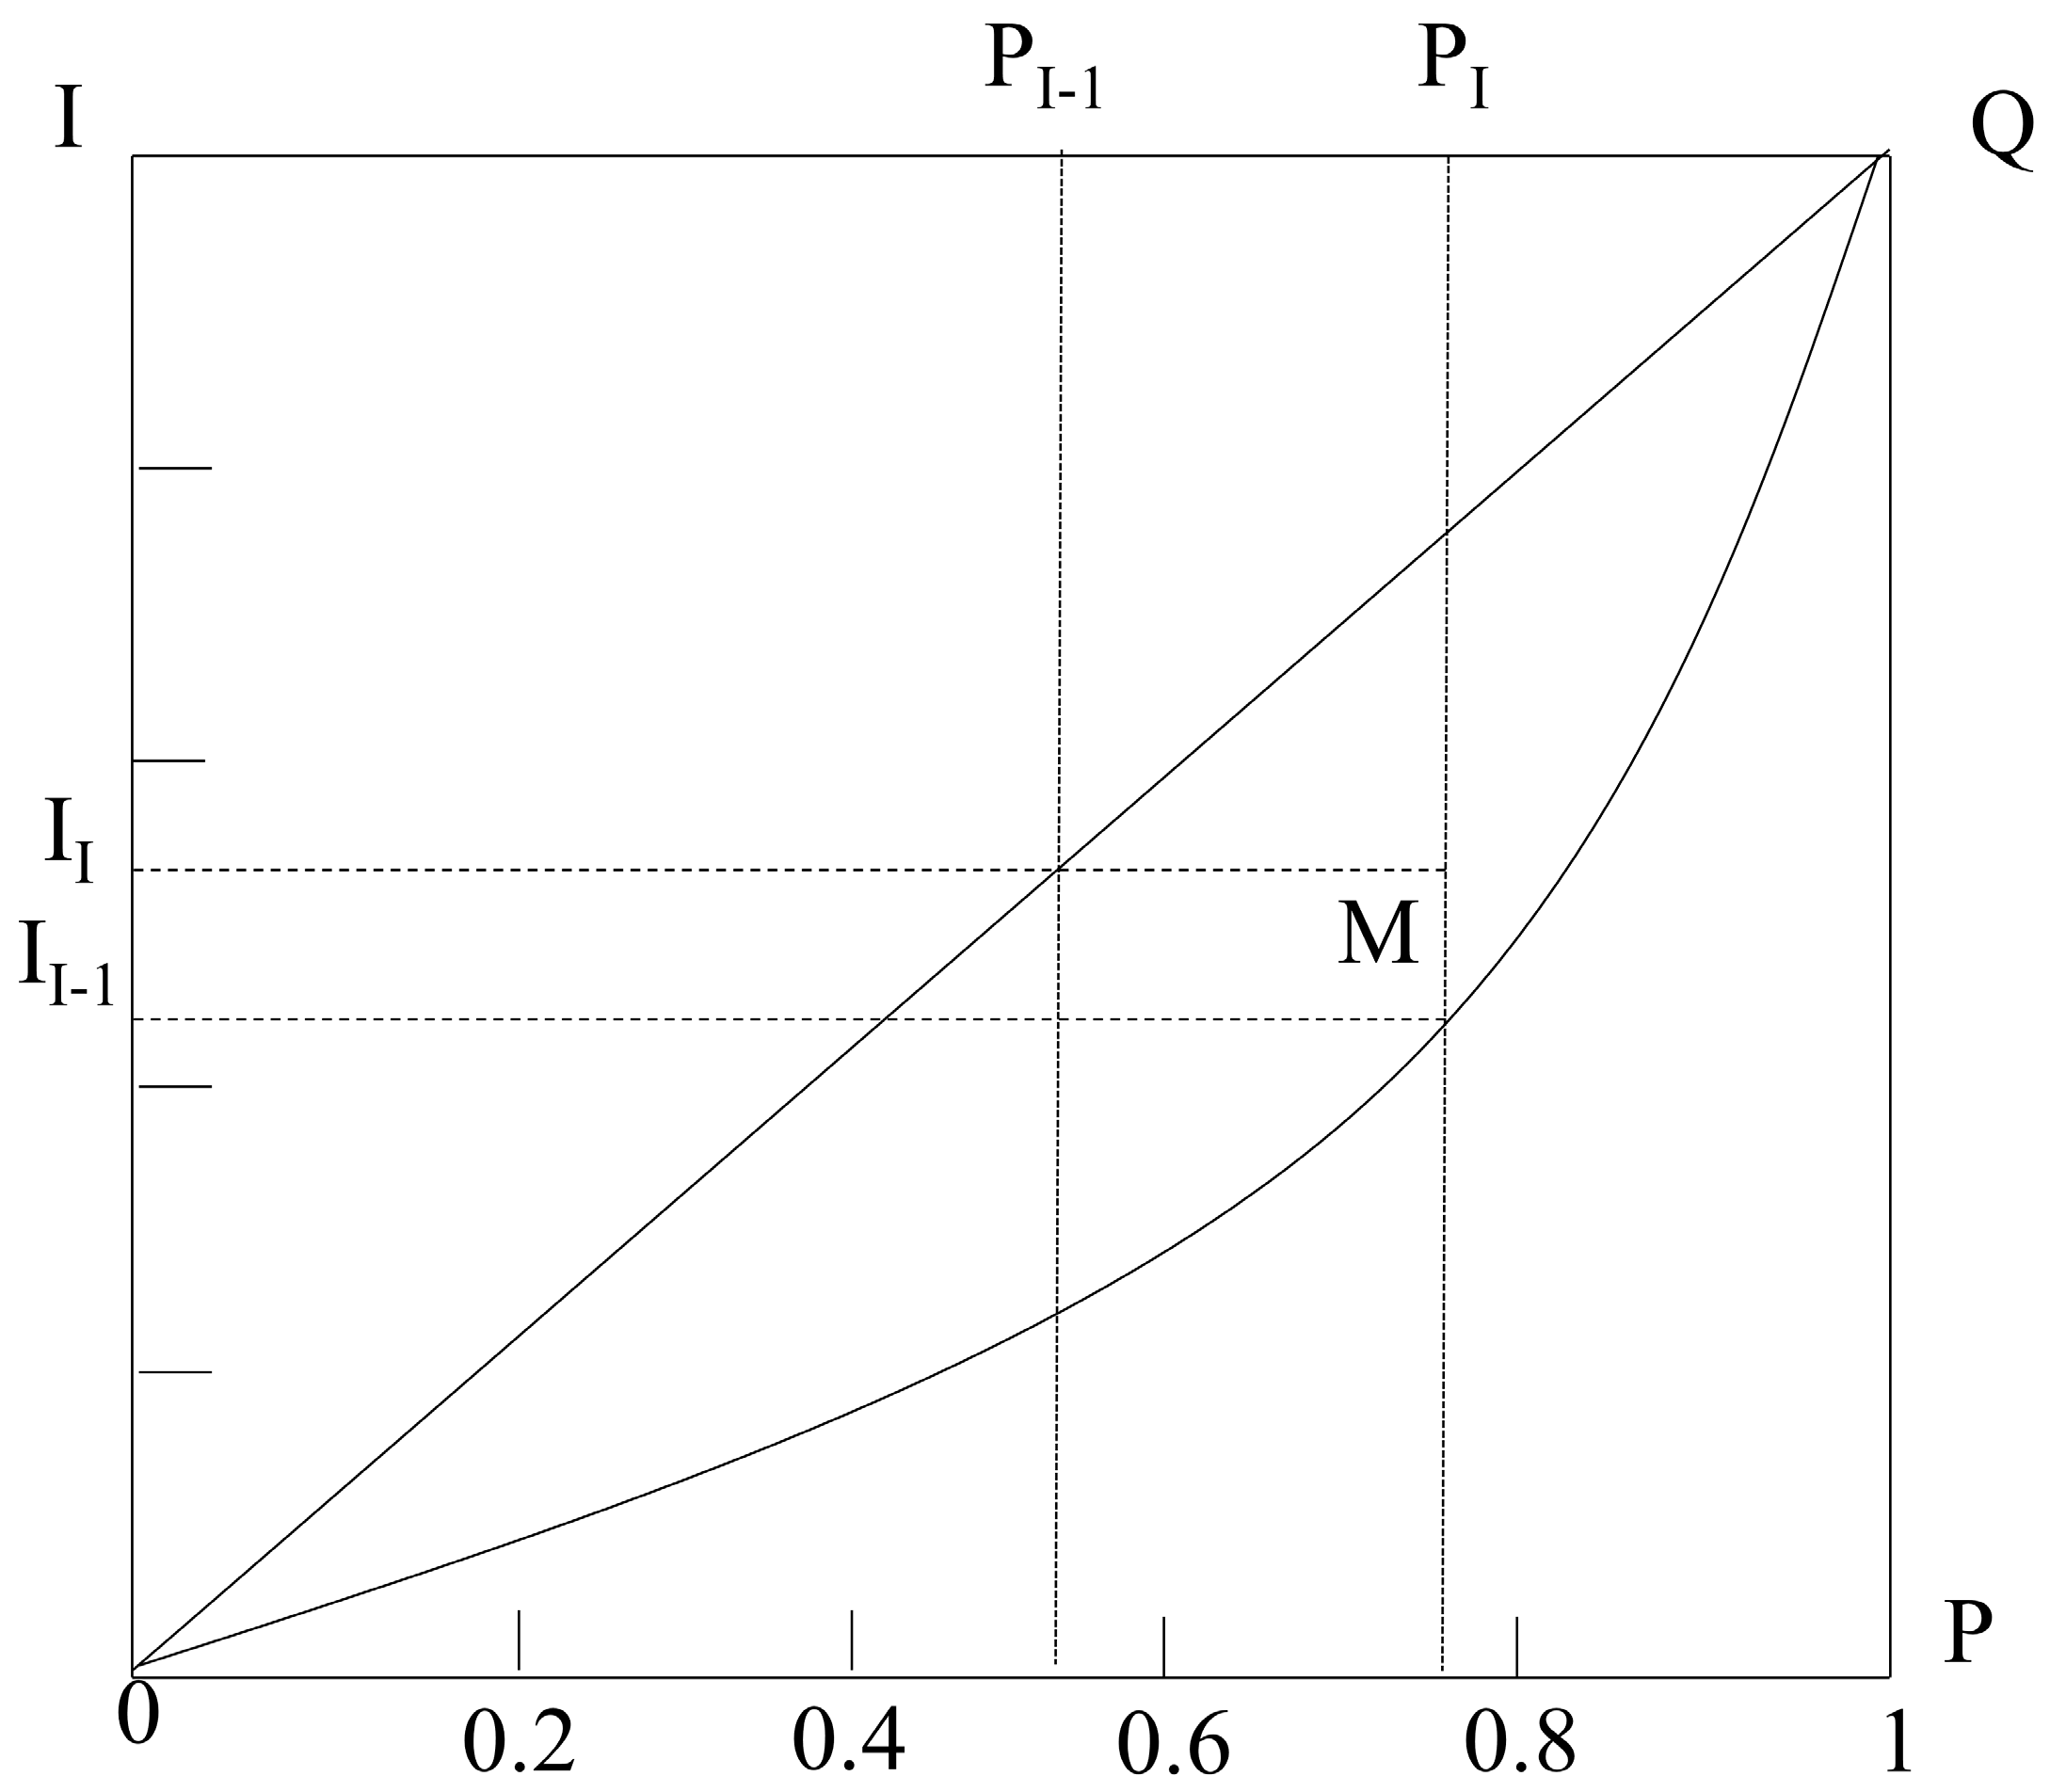
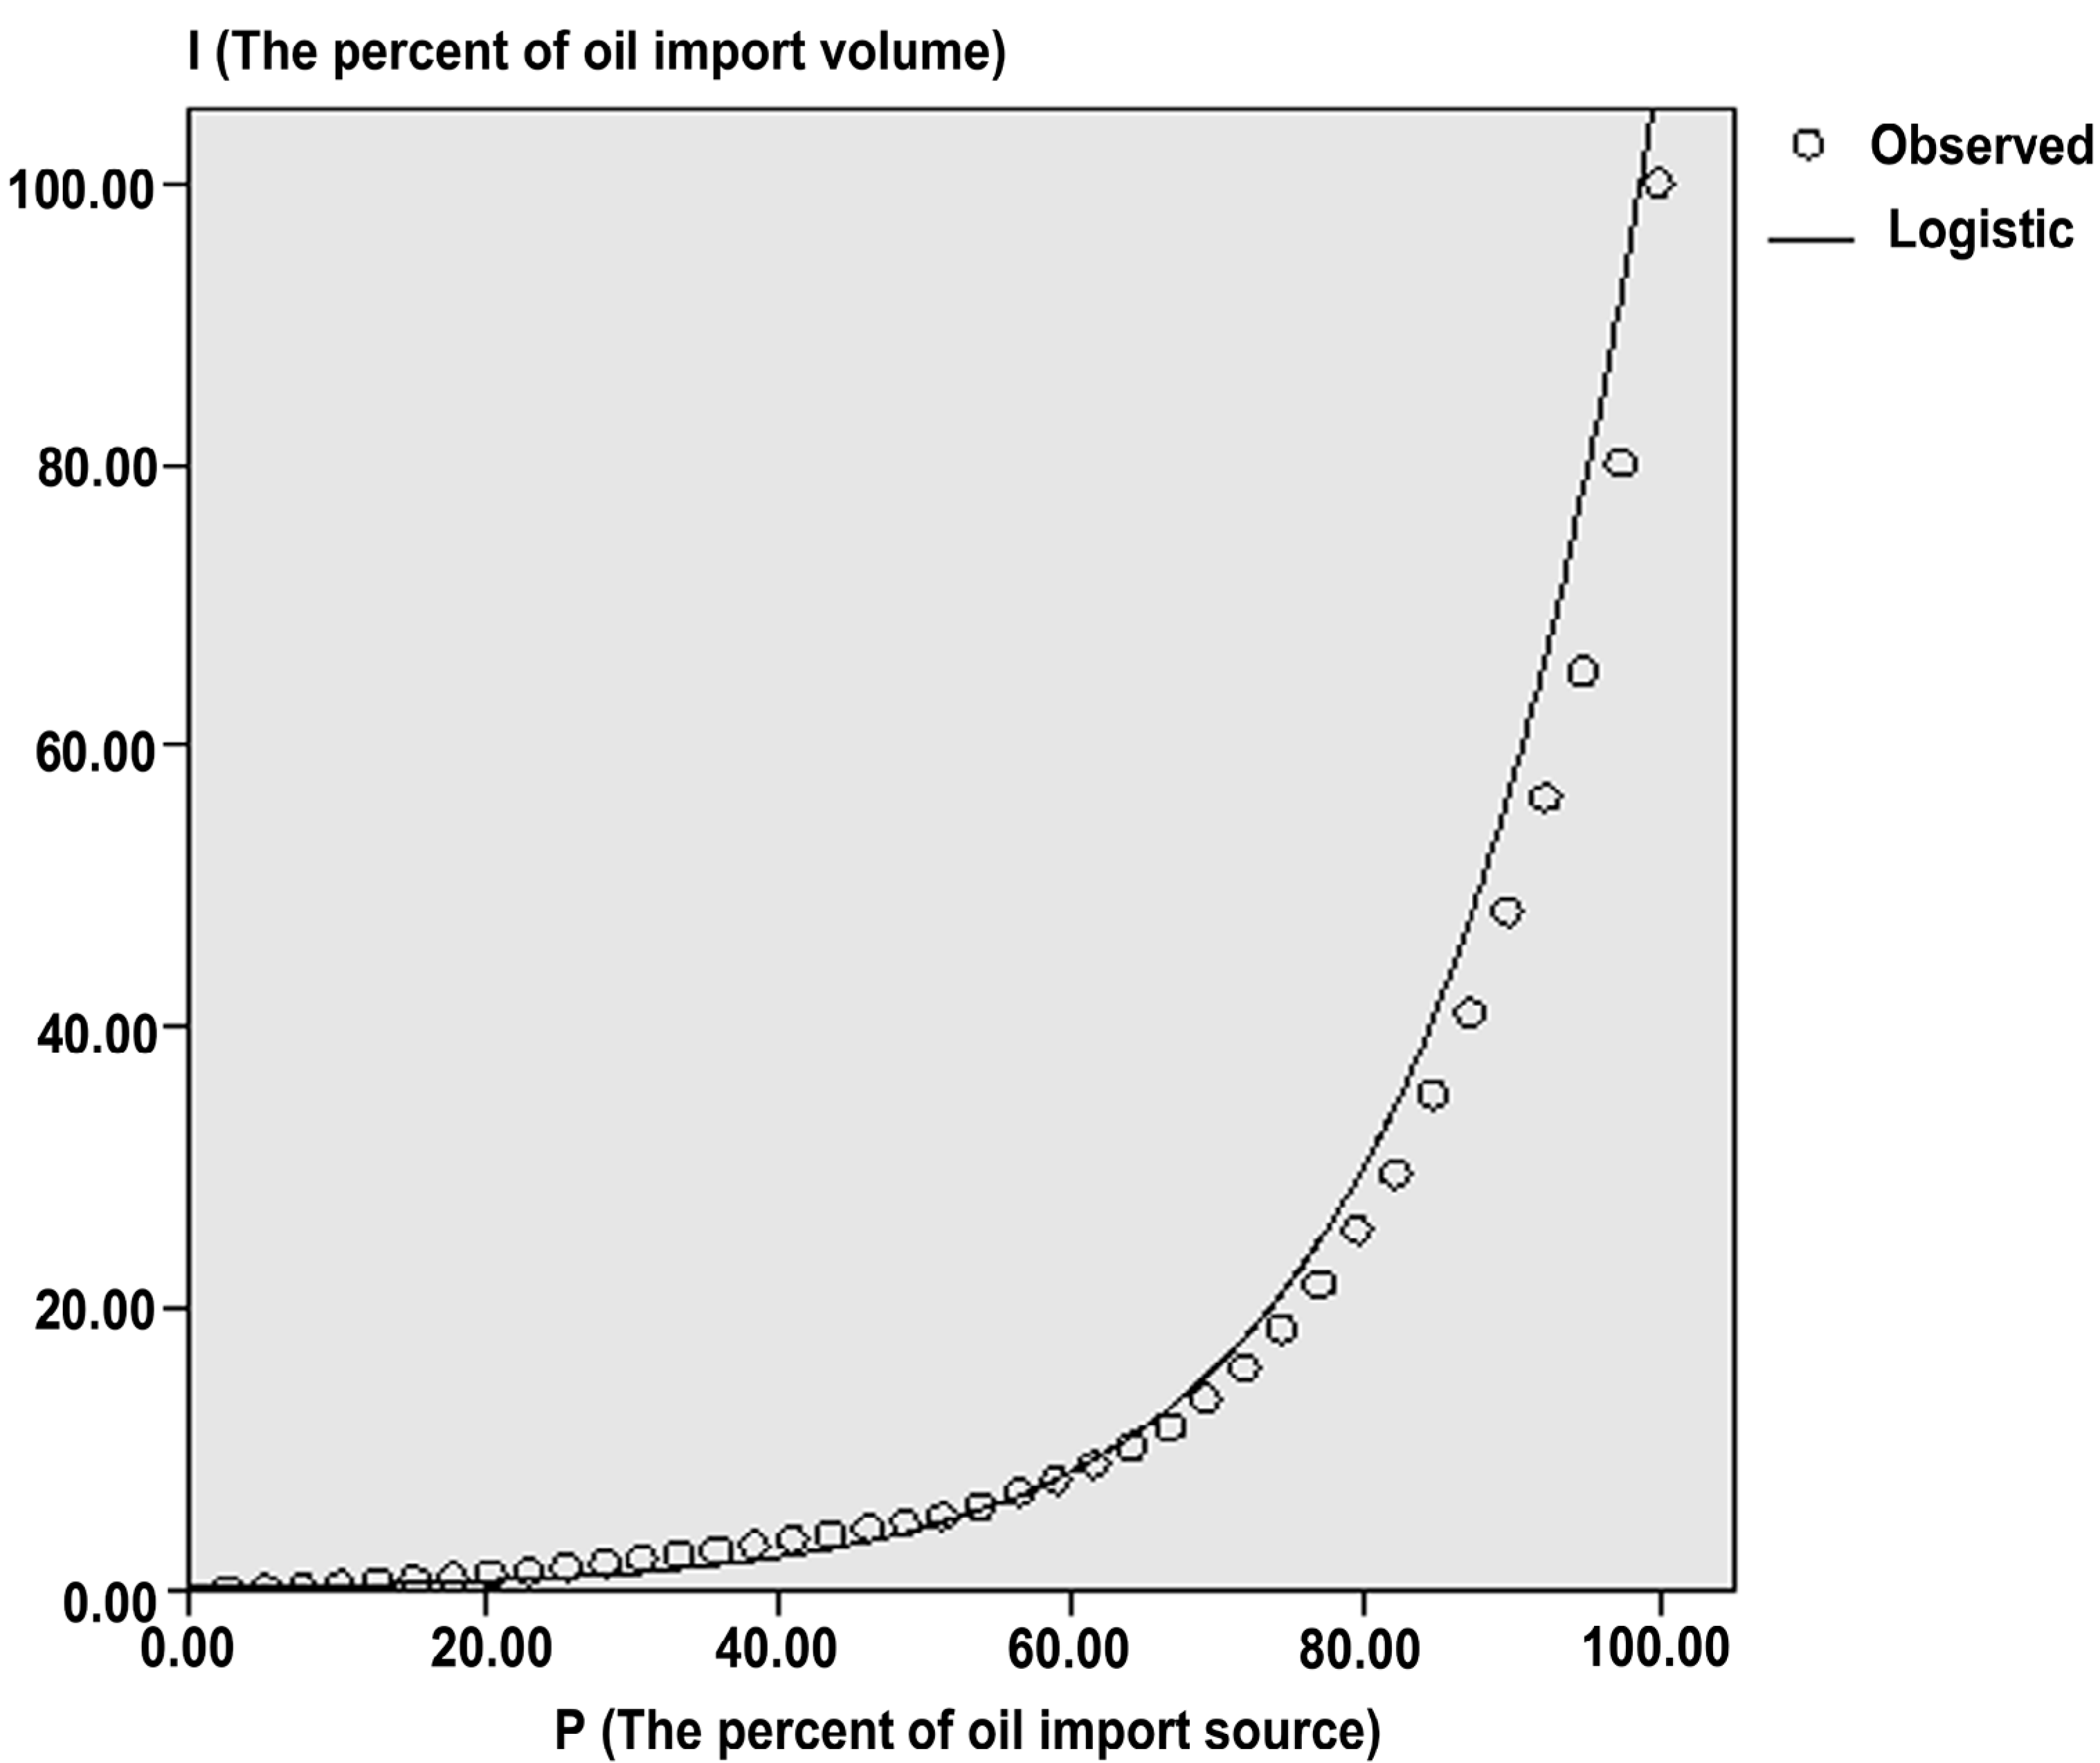
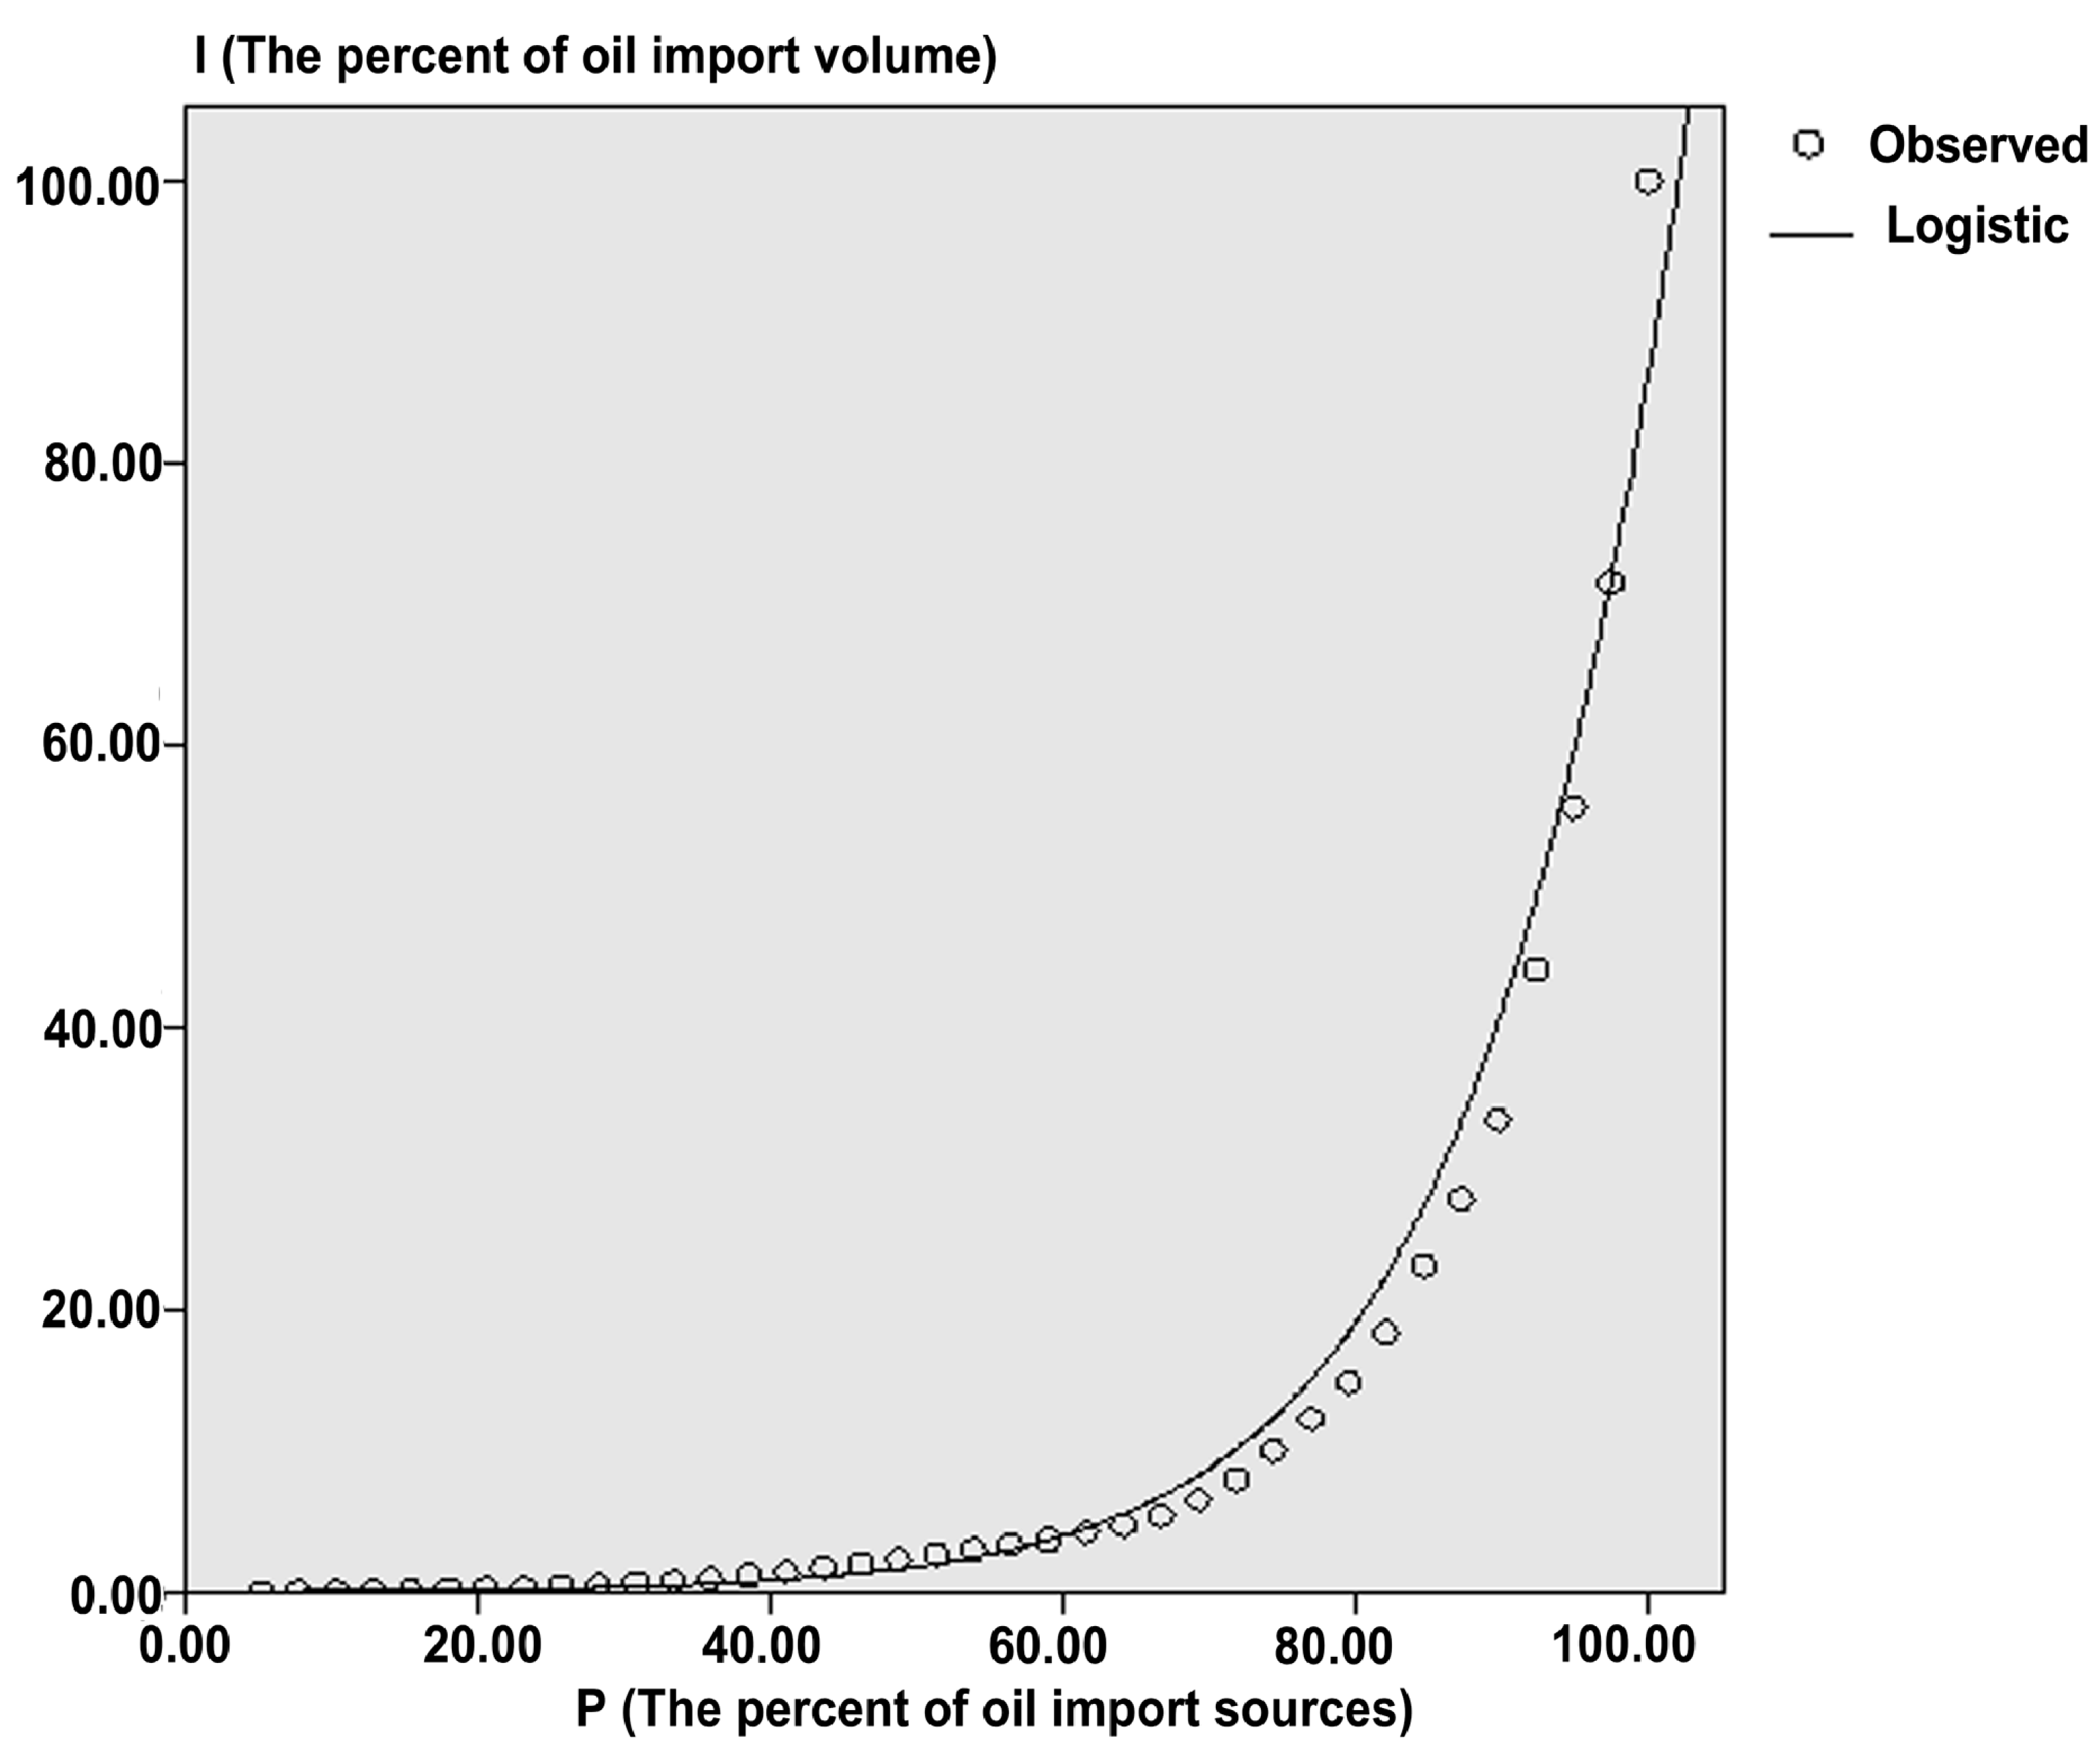
According to the principles of the Lorenz curve and the Gini coefficient, we build a function of the oil import diversification curve and calculate the oil import diversification index. The import diversification curve (
Figure 3) is a function that describes the relation between the proportion of import sources and the percentage of imported oil.
Figure 3.
Import diversification curve.
Figure 3.
Import diversification curve.
The import diversification function is I = I(P). I is the cumulative percentage of import volume, and P is the cumulative percentage of the oil import source.
The oil import diversification index is defined as:
3.3. Method
The most important step is to calculate the area of the diagram formed by 45° OQ and actual diversification curve OMQ. Firstly, draw the oil import diversification scatter plot based on the oil import data. Then, preliminarily judge the shape of the curve and carry out the curve regression and statistical tests to get the acceptable function expressions. Finally, calculate the oil import index using the diversification index model.
5. Results and Discussions
5.1. Market-Oriented Diversification Strategy
China’s oil import diversification strategy is market-oriented, which focuses on a short-term market and can meet the demands of the domestic markets in the short term; thus, it is also more susceptible to short-term fluctuations of the oil market.
As the world’s second largest oil importing country, China’s oil import diversification index is 0.669, which is close to the oil production diversification index of oil exporters, 0.622, and lower than the oil exporters’ reserve diversification index, 0.79. This shows that, currently, China’s oil import diversification strategy is a market-oriented diversification strategy rather than a long-term market strategy. This phenomenon has a close relationship with the rapid growth of domestic demand for oil. In the past 10 years, the average growth rate of China’s oil consumption was 7.1%, and its foreign-trade dependence rose from 36% in 2003 to 56.4% in 2012. To meet the rapid economic development of China, China always purchases oil by short-term contract trading in spot markets, so China’s oil import diversification index is similar to the oil production diversification index of oil exporters. What is more, China is a developing country, which has little advantage in competing with the developed countries to gain a long-term contract with exporters with political stability and with rich oil reserves in the world oil markets. According to the information provided by the general administration of customs, in 2012, about 49.8% of China’s oil imports were from the Middle East, 23.9% from Africa, 13.1% from the former Soviet Union and Europe and 10.4% from America. As we can see, more than 70% of China’s oil imports are imported from the Middle East and Africa, and the political situation of these two regions has been unstable for a long time. Influenced by the political situation, in 2012, Iran’s oil exports to China fell by 20.7% compared to the previous year, and Sudan experienced a four-month supply interruption. Thus, the import source diversification strategy cannot reasonably avoid political risks of source imports; instead, it pays more attention to the current short-term oil production distribution in order to solve the pressing domestic oil consumption demands. Therefore, under the condition of oil reserve disequilibrium, excessive dependence on short-term trade and politically unstable regions is not sustainable.
As the world’s largest oil importer, America’s diversification index is 0.767, which is higher than the oil exporter production diversification index, 0.622, and close to the oil exporters’ reserve diversification index, 0.79. This shows that America’s diversification strategy not only focuses on short-term market supply, but also is concerned with the long-term market supply. According to the information from EIA, we know that 2% of oil imports come from five oil exporters: Canada, Saudi Arabia, Iraq, Mexico and Venezuela. These countries are America’s allies or neighbors and have huge storage capacities. Canada’s oil reserves are 173 billion barrels, ranking third. Saudi reserves are 267.02 billion barrels, ranking first. Iraqi reserves are 143.1 billion barrels, ranking fifth. Mexican reserves are 10.36 barrels, ranking 13th. Venezuelan reserves are 211.17 billion barrels, ranking second.
5.2. The Future Diversification Strategy of China
We propose that China’s oil import diversification strategy be reserve-oriented. This fact, coupled with the future development of import source economies, means that some export countries will transform into importers, which will not provide a large quantity of oil to guarantee the oil imports of China, increasing the risk to China’s oil imports in the future. To provide a sustainable and stable oil import guarantee for future oil consumption, the oil import diversification strategy should be directed toward optimizing the structure of import sources, focusing on long-term, stable import sources. China’s objective should aim at the oil reserve diversification index of export countries, which reflects the long-term market supply guarantee, instead of the market-oriented diversification strategy.
According to IEA [
22], in 2020, China’s net oil import will be 400 million tons (mt), which is a 68% increase over 2011; the EU’s net oil import will 450 mt, which is down by nearly 9% compared to 2011; India’s net oil import will be 190 mt, which is a 72% increase over 2011; the United States’ net oil import will be 290 mt, which is down by nearly 39% compared to 2011; Japan’s net oil import will be 190 mt, which has a nearly 2% decline over 2011. From that, we can see that the United States will significantly reduce oil imports in the future, and the European Union and Japan will have a small cut, as well. India has relatively rapid growth, but its amount is not very great. With an energy independence strategy implemented, the United States will significantly reduce its imports, until North America becomes a net oil exporter in about 2030. This trend will shift the international oil trade direction to Asia much faster. Canada, Mexico and Venezuela are eager to seek new trading partners, which provides strategic space for China to adjust its oil import strategy. At the same time, the European Union is actively exploring new oil suppliers to reduce its dependence on Russia; Russia is also trying to break the situation of relying too much on the EU. Therefore, China has an opportunity to expand its oil imports from Russia. In 2013, China put forward the idea of the “Silk-Road Economic Belt”, and China has strengthened energy cooperation with central Asian countries, including: Kazakhstan, which has 30 billion barrels of oil reserves; Turkmenistan, which has 600 million barrels of oil reserves; Uzbekistan, which has 600 million barrels; and Azerbaijan, which has seven billion barrels. They have in total 125.2 billion barrels of oil reserves. This situation will increase China’s imports from the land, reducing the transportation risk of oil imports. Based on the above analysis, we suggest that in the future, China’s oil import diversification strategy should be guided by oil reserves and diversified transport channels. The oil import source distribution in 2020 is shown in
Table 5, and we find that our import diversity index is 0.81, which is close to the oil reserve diversification index.
Table 5.
China oil import sources distribution (2020).
Table 5.
China oil import sources distribution (2020).
| Import Sources | 2012 | 2020 | Import Sources | 2012 | 2020 |
|---|
| Indonesia | 54.85 | 55 | Sudan | 250.59 | 1500 |
| Vietnam | 74.46 | 74 | Equatorial Guinea | 200.13 | 200 |
| Malaysia | 111.47 | 111 | Cameroon | 57.63 | 58 |
| Australia | 371.56 | 372 | South Africa | 44.33 | 44 |
| Brunei | 40.5 | 41 | Congo-Kinshasa | 85.5 | 86 |
| Thailand | 72.29 | 72 | Others | 120.87 | 121 |
| Mongolia | 45.79 | 46 | Total Africa | 6469.91 | 8073 |
| Other Asia Pacific | 4.14 | 4 | Russian Federation | 2432.97 | 4000 |
| Total Asia Pacific | 775.06 | 775 | Kazakhstan | 1070.37 | 2300 |
| Oman | 1957.38 | 1957 | Azerbaijan | - | 600 |
| Yemen | 358.45 | 358 | Turkmenistan | - | 500 |
| Iran | 2,200.96 | 1000 | Uzbekistan | - | 500 |
| United Arab Emirates | 874.37 | 874 | Others | 45.19 | - |
| Saudi Arabia | 5390.06 | 6000 | 3548.53 | 7900 |
| Iraq | 1568.47 | 3000 | Venezuela | 1529.03 | 4000 |
| Kuwait | 1049.19 | 1000 | Ecuador | 89.37 | 89 |
| Qatar | 99.55 | - | Argentina | 120.69 | 121 |
| Total Middle East | 13,498.43 | 14,190 | Brazil | 607.05 | 607 |
| Angola | 4015.63 | 4,000 | Colombia | 290.86 | 291 |
| Nigeria | 93.65 | - | Canada | 66.37 | 3000 |
| Libya | 730.7 | 731 | Mexico | 101.55 | 1000 |
| Algeria | 257.19 | 257 | Others | 12.3 | 12 |
| Congo | 536.55 | 1000 | Total America | 2817.22 | 9120 |
| Egypt | 77.14 | 77 | Total Import Sources | 27,109.12 | 40,059 |


