Article

Energy Consumption and Carbon Dioxide Emissions of China’s Non-Metallic Mineral Products Industry: Present State, Prospects and Policy Analysis

1
Economics and Management School, Wuhan University, Wuhan 430072, China
2
Faculty of Business, Government & Law, University of Canberra, Bruce ACT 2601, Australia
*
Author to whom correspondence should be addressed.
Sustainability 2014, 6(11), 8012-8028; https://doi.org/10.3390/su6118012
Submission received: 10 September 2014 / Revised: 18 October 2014 / Accepted: 4 November 2014 / Published: 12 November 2014
(This article belongs to the Section Environmental Sustainability and Applications)

Abstract

:
China is the largest non-metallic mineral producer in the world and one of the key consumers of four major non-metallic mineral products, including cement, refractories, plate glass and ceramics. The non-metallic mineral products industry’s rapid growth has brought about a large demand for energy. The present study provides an overview of China’s non-metallic mineral products industry in terms of production, energy consumption and carbon dioxide emissions. In this industry, the energy efficiency is relatively low and the level of carbon dioxide emission is much higher than developed countries’ average. This study interprets the effects of some newly issued policies and analyses the influential factors in achieving energy conservation and emission reduction goals. It also discusses the prospects for saving energy and emission reduction in the industry. Retrofitting facilities and using new production technologies is imperative. Additionally, implementing market-based policies, promoting industrial transformation and effective international cooperation would help decrease carbon dioxide emissions and energy consumption.

1. Introduction

The non-metallic mineral products industry (NMMPI) is a key industry in China. China is the largest non-metallic mineral producer and one of the major consumers of non-metallic mineral products. The products of the NMMPI mainly cover cement, refractories, plate glass and ceramics, which are the principle building materials for the construction industry. Due to the importance of the NMMPI, the status of the NMMPI can partially reflect the general economic trend. In 2012, the NMMPI received a sales revenue of 30,629.76 billion RMB (4980.12 billion U.S. Dollars) with a year-on-year increase of 11.63% and a total profit of 188.83 billion RMB (30.7 billion U.S. Dollars) [1].
Over the last decade, the expansion of China’s economy was particularly remarkable, at an average annual growth rate of more than 9%. China’s NMMPI has also experienced rapid development. In 2010, the NMMPI contributed four trillion RMB (0.65 trillion U.S. Dollars) to the Chinese economy, accounting for 10% of the gross domestic product (GDP) [2]. In the last five years, the average annual output of cement, refractories, plate glass and ceramics was 1.68 billion metric tons, 0.35 million metric tons, 32 million metric tons and 20 billion pieces, respectively. Recently, China has planned to invest over 40 trillion RMB (6.5 trillion U.S. Dollars) in urbanization by 2020 [3]. As a result, the production of building materials will be required to meet the need of urban construction, which would boost the NMMPI further. Taking the cement industry as an example, high demand for building materials has driven cement output to soar to record levels. From 1994 to 2010, the output of cement increased eight-fold [4,5]. At present, China produces nearly 60% of the world’s cement [6].
China’s NMMPI is a typical energy-intensive industry [7]. The rapid development of NMMPI has resulted in huge energy consumption. From 1994 to 2010, energy consumption in the NMMPI increased from 125 million metric tons of coal equivalent (mtce) to 277 million mtce. Particularly, the energy consumption of the cement sector increased from 45 million mtce to 167 million mtce, with an average annual growth rate of 8%. The cement sector has become one of the largest energy-consuming sectors, as well as a rapidly growing energy-consuming sector [4]. Cement production in China also emits more carbon dioxide (CO2) than any other industrial processes, accounting for nearly 4% of global carbon emissions [4,6].
China’s industry consumes most of this country’s coal and electricity. Electricity is produced mainly by fossil fuel-fired power plants. The high rate of fossil fuel usage results in an enormous amount of CO2 emissions. With the rapid growth of energy consumption in the NMMPI, CO2 emissions have increased tremendously. Over 6.7 billion metric tons of CO2 were emitted directly from the NMMPI in 2010; 116% more than in 1994. The NMMPI is not only a direct source of CO2 emissions, but also one of the largest indirect sources. The indirect emissions of CO2 refer to emissions during the generation of electricity [8]. Besides CO2, in 2010, the volume of industrial waste gas emitted from the NMMPI accounted for 16.8% of China’s total emissions. The volume of soot emitted from this sector was 1.07 million metric tons, which was 12.9% of the nation’s total emissions (8.29 million metric tons) [9,10].
The rapid growth of high energy-consuming sectors brought about increases in total energy consumption in China's industry. Since 1996, China’s industrial energy consumption has accounted for over 70% of total energy consumption [1,2,9]. For developed countries, the proportion is about 30%, on average [11]. China’s high industrial energy consumption makes the energy-intensive industries, such as the NMMPI, face severe constraints for energy and increases the difficulty of CO2 emissions reduction [12]. In particular, since 2002, China’s energy-intensive industries have experienced explosive development, as a result of overinvestment in most industries [13]. Therefore, the authorities started to put special emphasis on energy consumption and greenhouse gas emissions [14].
In 2012, the Chinese government released the Greenhouse Emission Control Plan, which established national targets for reducing energy consumption and carbon emissions between 2011 and 2015. The NMMPI association also developed corresponding targets. All of these targets have catalysed the moderate development of the NMMPI in China. However, how to reach these goals with limited funds and outdated facilities has become a crucial issue in the NMMPI.
This article investigates the development of NMMPI in China for the past 10–20 years. After analysing the situation of energy consumption and CO2 emissions in the NMMPI, it discusses the influential factors in achieving energy conservation and emission reduction goals. This study interprets the effects of some newly issued policies on the NMMPI’s energy-efficiency improvement and emissions reduction. It also discusses the prospects for realizing NMMPI’s sustainability. Finally, this study makes a few recommendations.

2. Non-Metallic Mineral Products Industry in China

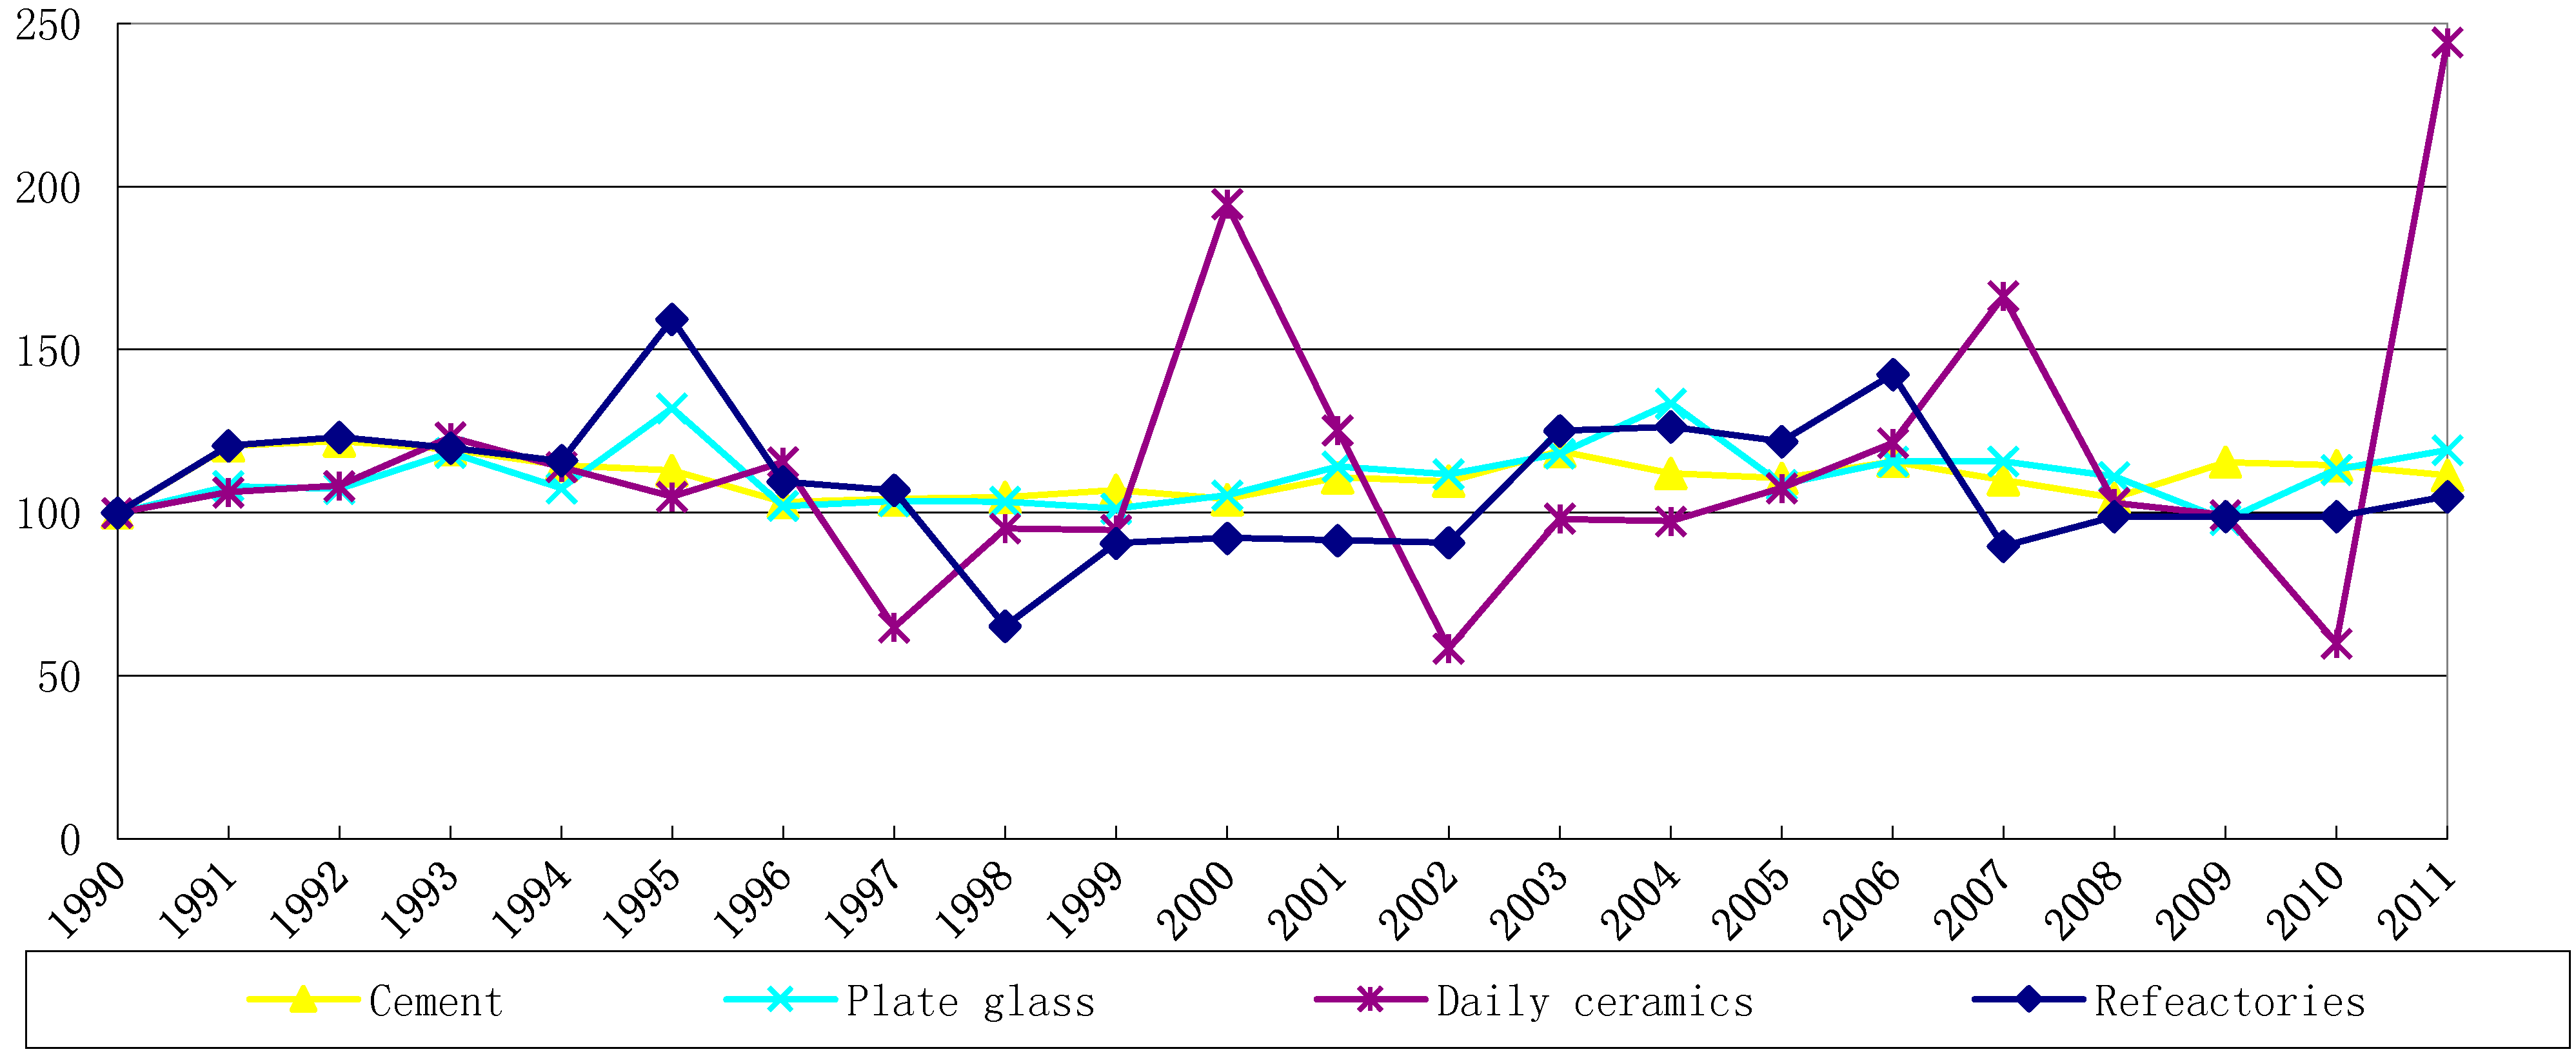
2.1. Main Products of China’s Non-Metallic Mineral Products Industry

Since China’s large-scale construction in the 1990s, NMMPI enterprises have experienced rapid development, and there has been an enormous growth in non-metallic mineral production. This growth has been fuelled by strengthening of the manufacturing industries and has been accompanied by accelerated urbanization. In accordance with Chinese “national industry classification” (GB/T4754-2011), the main products of the Chinese non-metallic mineral products industry include cement, refractories, plate glass and ceramics [15]. Figure 1 presents the indexed outputs of these products in China from 1990 to 2011, showing the rapid increase of the industry. In terms of cement, the average annual growth rate was over 14% between 2002 and 2006.
Figure 1. Indexed main non-metallic mineral products output in China (1990–2011) [2,16,17].
Sustainability 06 08012 g001

2.2. Geographic Distribution of Production

In China, the NMMPI is highly concentrated in a few areas and dominated by large-scale enterprises. As can be seen from Table 1, the output of China’s major cement enterprises accounted for almost 40% of the country’s total output. Table 2 shows China’s main plate glass enterprises and their output in 2011. These large cement and glass enterprises with related services sectors, research institutes and organizations are mostly located in the coastal provinces, the developed areas along the Yangtze River and central China. Over 70% of plate glass and cement is also produced in these areas.
Table 1. Major cement producers and their outputs in China (2011) [18].
Name of companyProvince aStart of operationOutput (million metric tons)
China National Building Materials Group CorporationBeijing1984138.66
Conch Cement Co., Ltd.Anhui1997110.49
Jidong Cement Co., Ltd.Hebei199449.57
China National Non-metallic Materials CorporationBeijing198348.38
China ResourcesHong Kong194836.02
Huaxin Cement Co., LtdHubei190735.40
China Tianrui Group Cement Co., LtdHenan198327.13
Shanshui Cement Group LtdShandong200126.32
Beijing Building Materials Group CorporationBeijing199226.25
a Provinces include special administrative regions and municipalities.
Table 2. Major glass producers and their outputs in China (2011) [19].
CompanyProvince aNumber of production linesOutput (103 m2)
Hebei Sand Glass GroupHebei34128,640
Farun GroupJiangsu1977,500
Xinyi GlassGuangdong1251,840
China National Building Materials Group CorporationBeijing1641,340
China Glass Holdings LTDHong Kong1440,830
Shandong Glass GroupShandong1035,890
China Southern Glass Holding Co. LTDGuangdong935,840
Zhejiang Glass GroupZhejiang931,360
Fuyao Group Fujian828,270
a Provinces include special administrative regions and municipalities.

3. Energy Usage in the Non-Metallic Mineral Products Industry

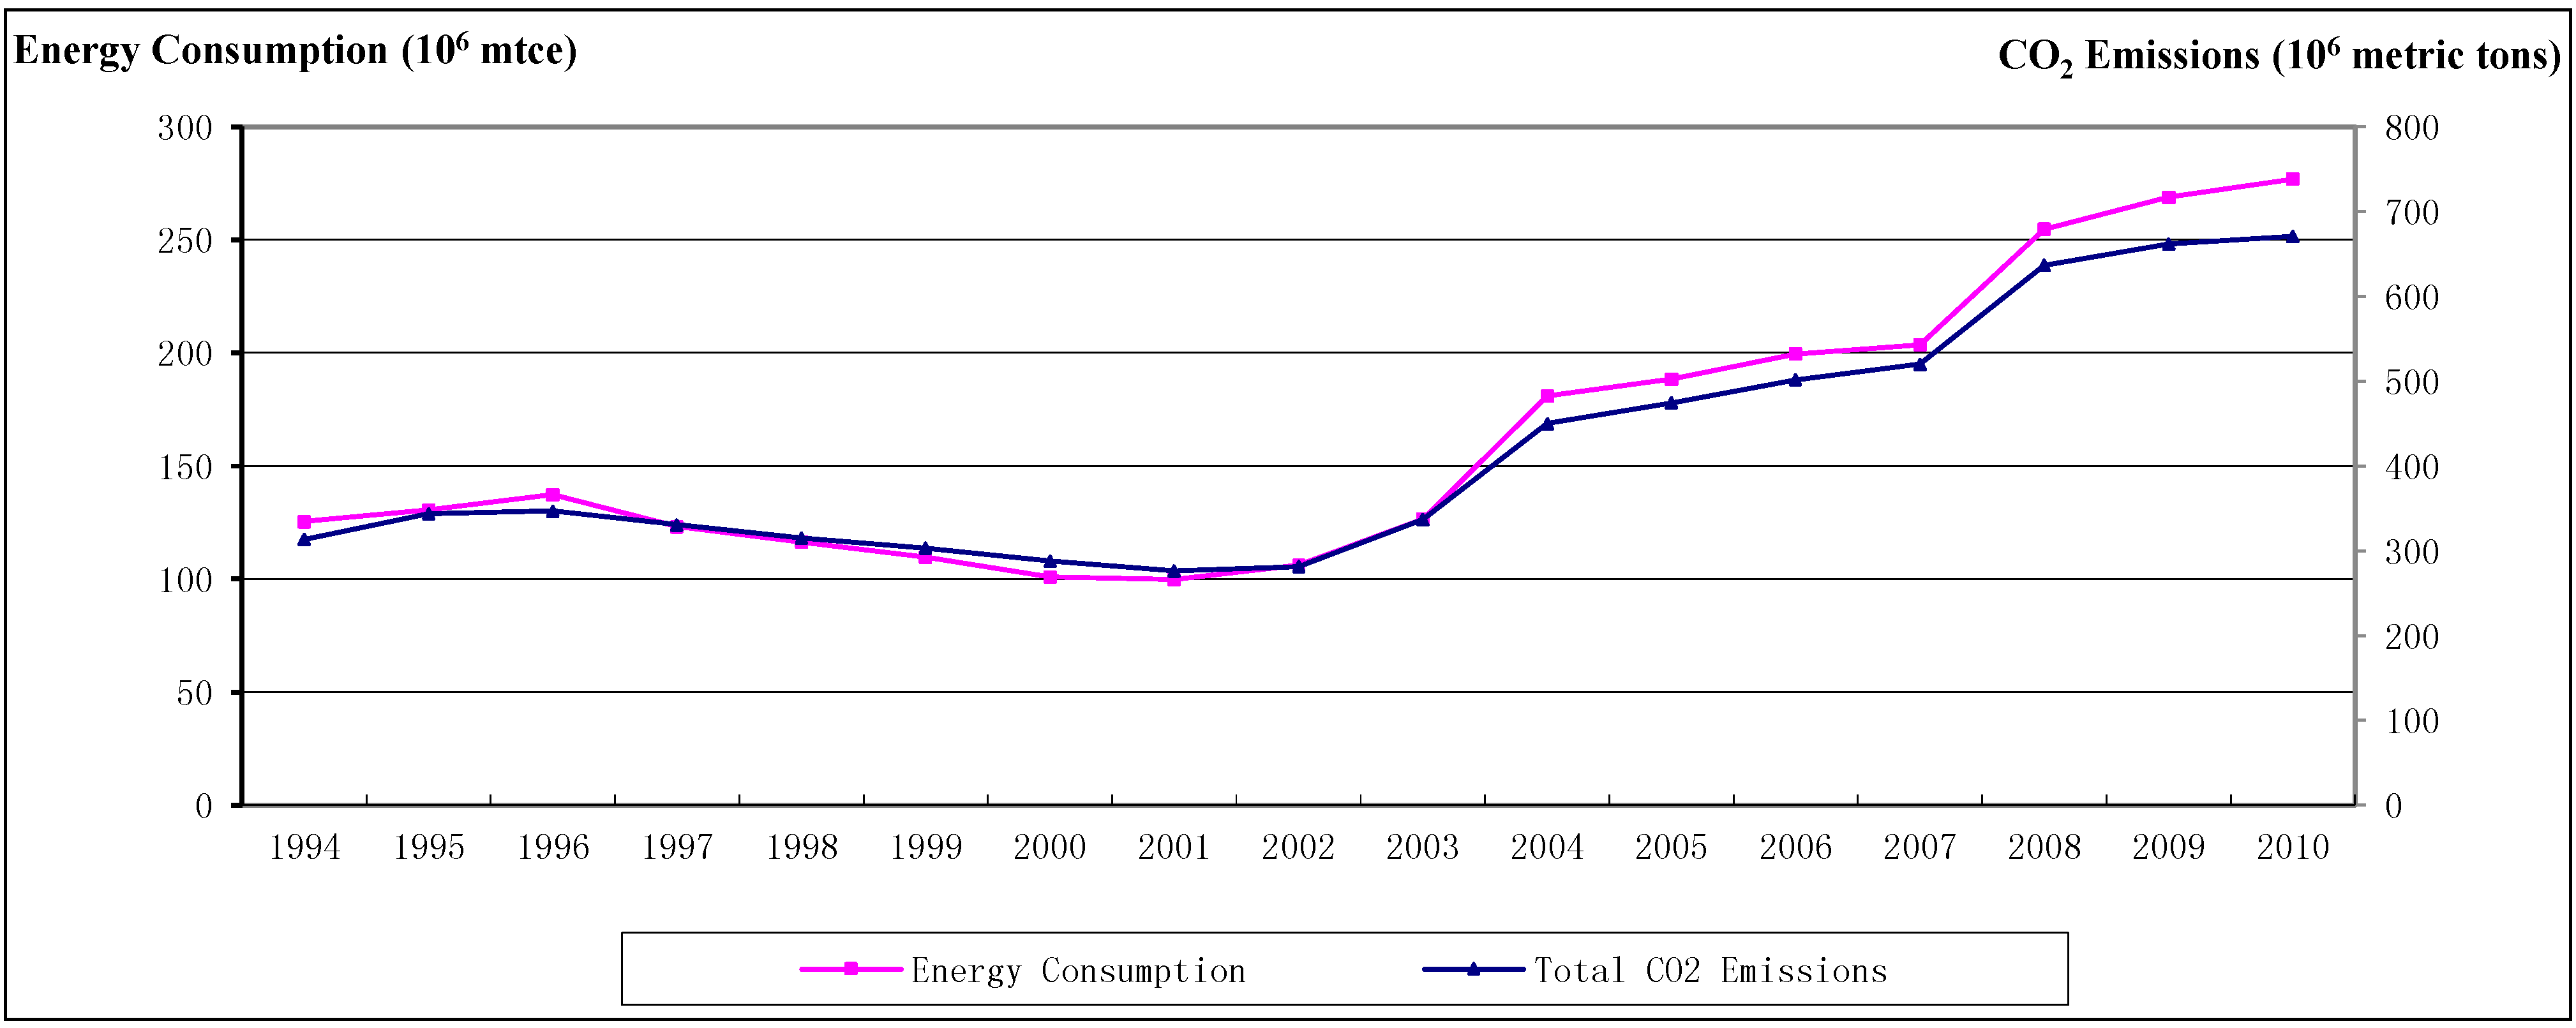
3.1. Energy Demand and Consumption

The NMMPI’s rapid growth and the expansion of enterprises’ scales have led to a large demand for energy. In terms of the cement sector, its energy demand remained at a high level from 2003 to 2011 [4,15]. The energy demand mainly depends on the technical nature of kilns. The energy demanded for producing one metric ton of cement is 110 kilograms of coal equivalent (kgce), 130 kgce and 200 kgce for new-style drying kilns, shafting kilns and humidifying kilns, respectively [18]. Given that the proliferation of new-style kilns and technologies is a long process, the amount of energy consumption would maintain a steady growth during the process [20].
For energy use in the ceramic sectors in China, producing one metric ton of porcelain, is 1.2 metric ton of coal equivalent, which is twice as high as the international average energy demand. Compared to developed states, like Japan and Germany, which make use of the most modern technologies, China lags behind in developing and using advanced porcelain production technologies. The main reason for higher energy demand is that many enterprises still use outdated manufacturing facilities. For example, in China, eight key porcelain producers still have 126 old-style vertical down-draught kilns in service, which account for half of all firing kilns in China. Their coal demand is 30%–40% higher than tunnel kilns [21].
Between 1994 and 2011, with the development of the NMMPI, the energy consumption and CO2 emissions in China rose dramatically (see Figure 2). These 18 years can be roughly divided into two phases. In the first phase (1994–2000), the energy consumption and CO2 emissions presented a slight decrease. The average annual energy consumption and CO2 emissions during this period were about 120 million mtce and over 100 million metric tons, respectively. In the second phase (2001–2011), the energy consumption and CO2 emissions of China’s NMMPI grew remarkably, with an average annual energy consumption of 190 million mtce; a 58.3% rise compared to the first phase.
Figure 2. Energy consumption and CO2 emissions in the non-metallic mineral products industry (1994–2010) [1,2,9,10]. mtce, metric tons of coal equivalent.
Sustainability 06 08012 g002

3.2. Energy Consumption Mix and Energy Intensity

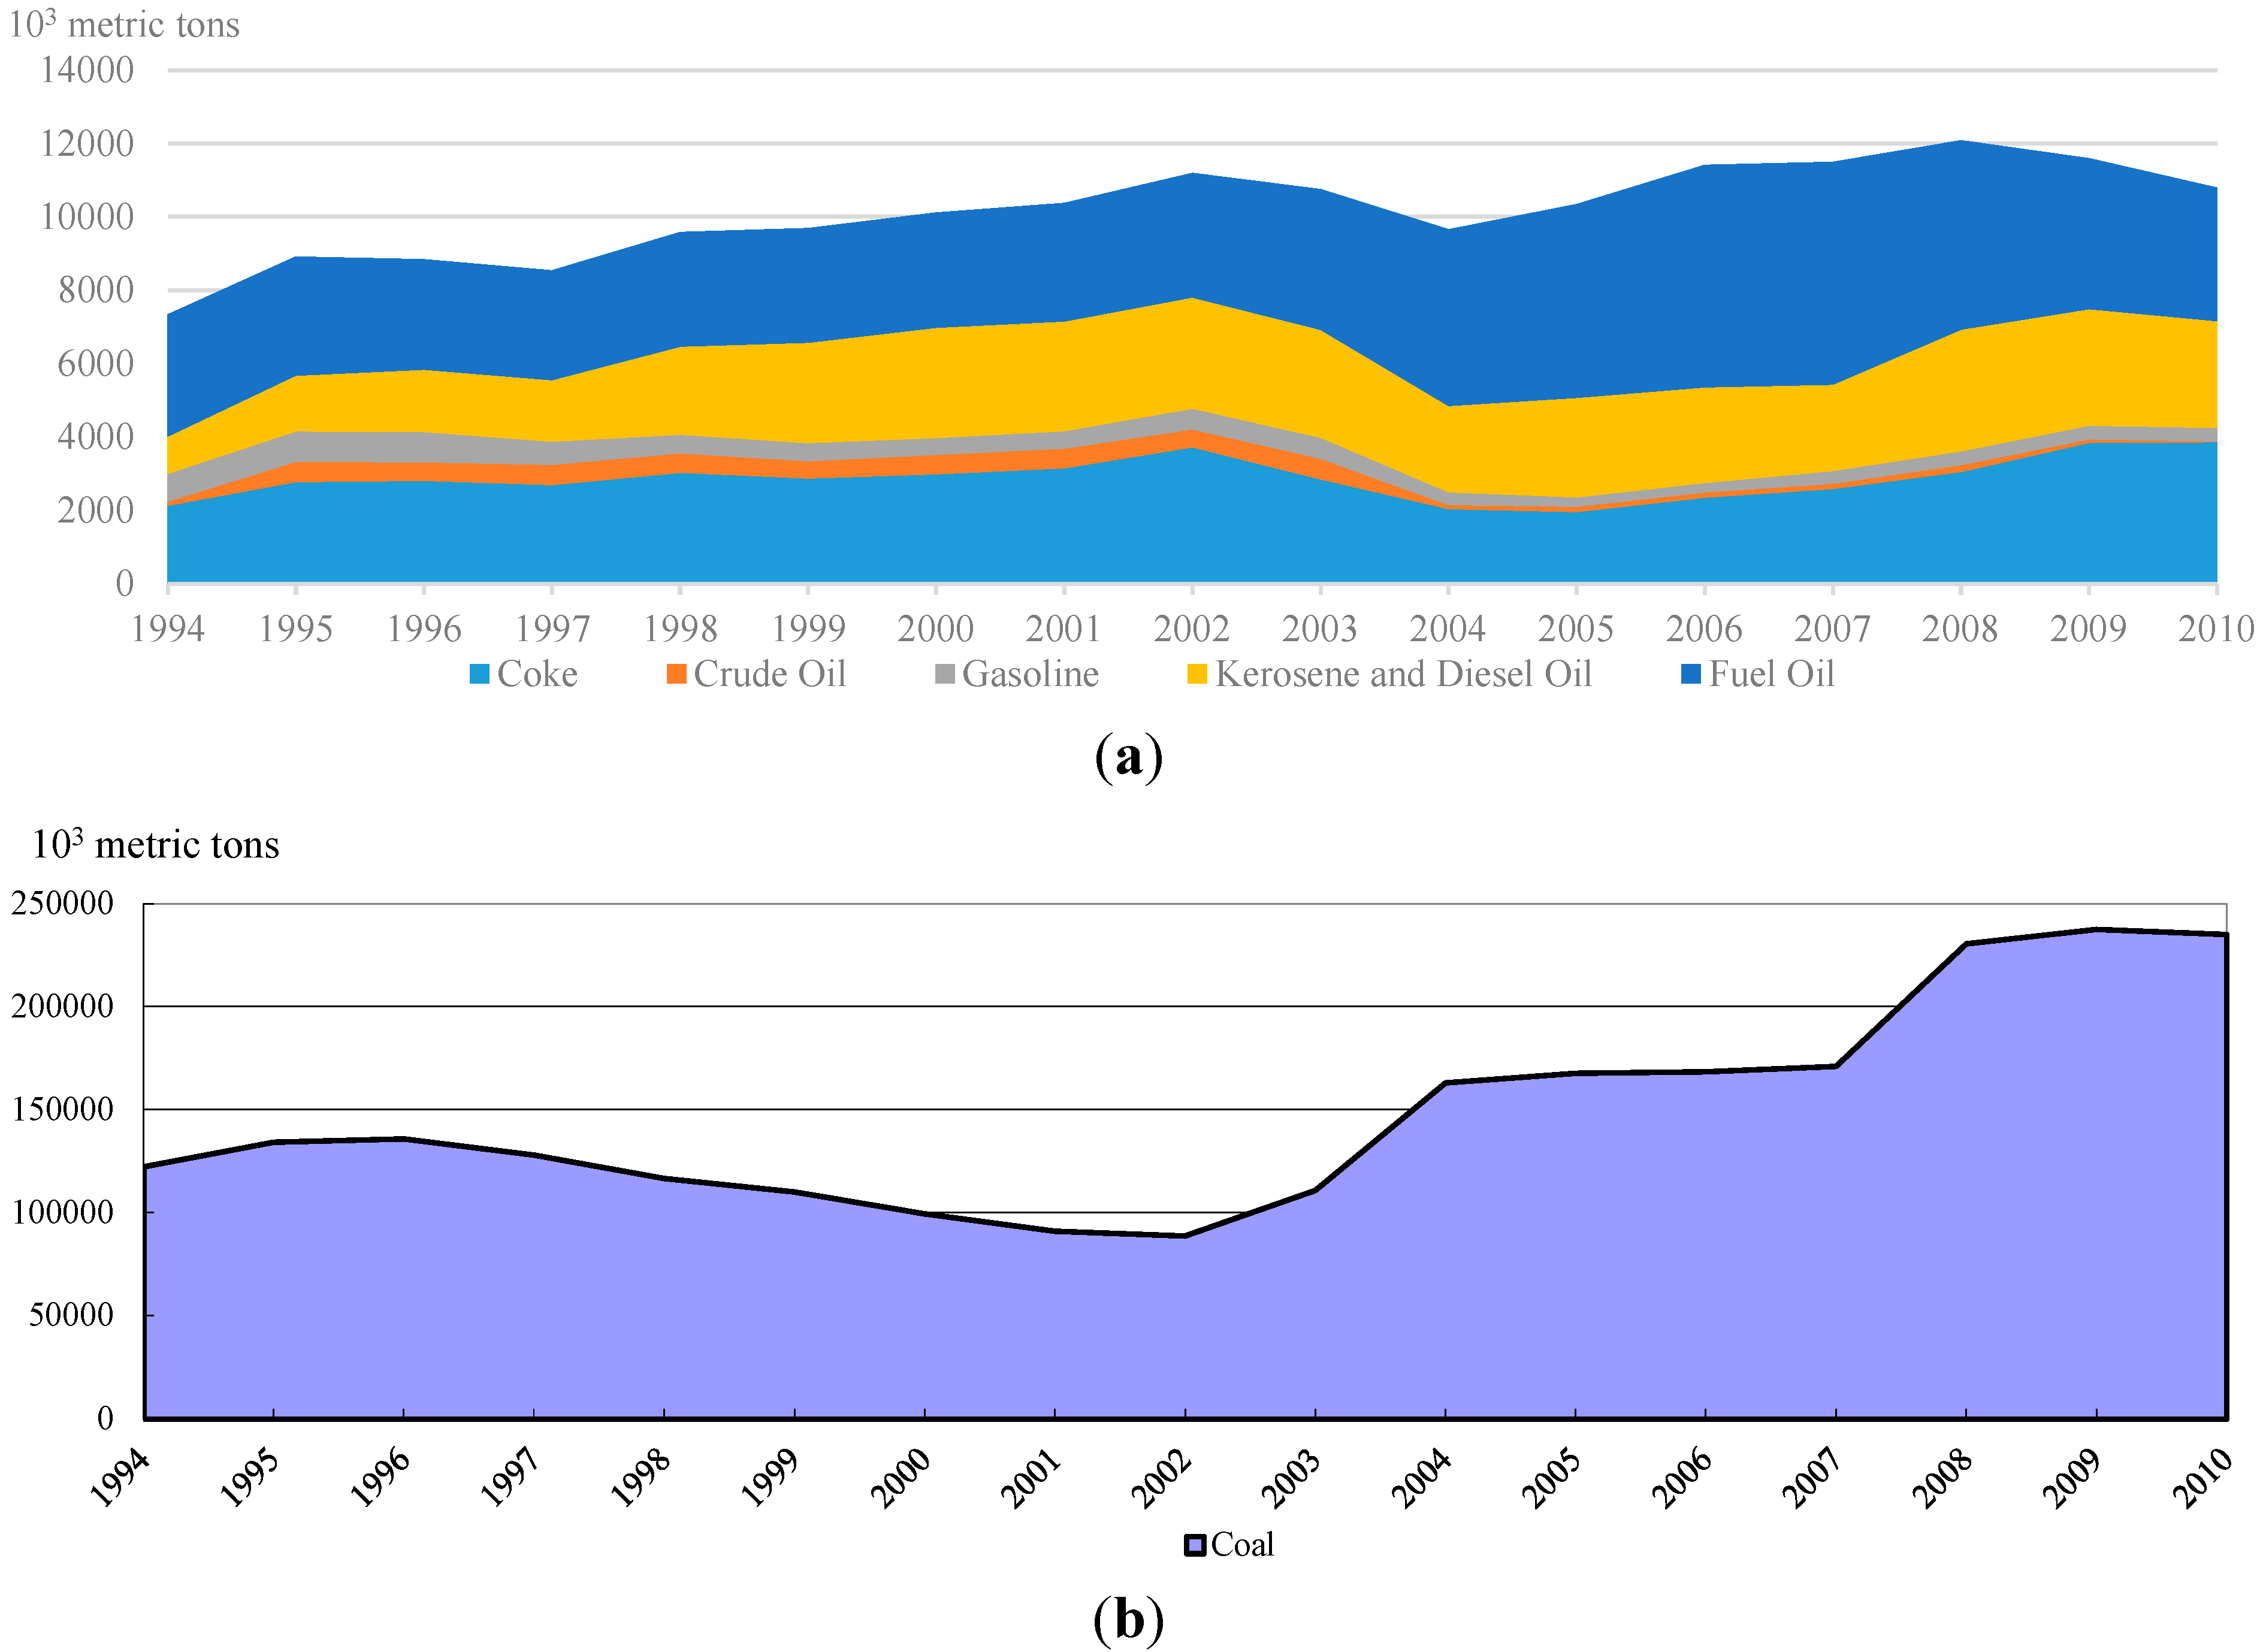
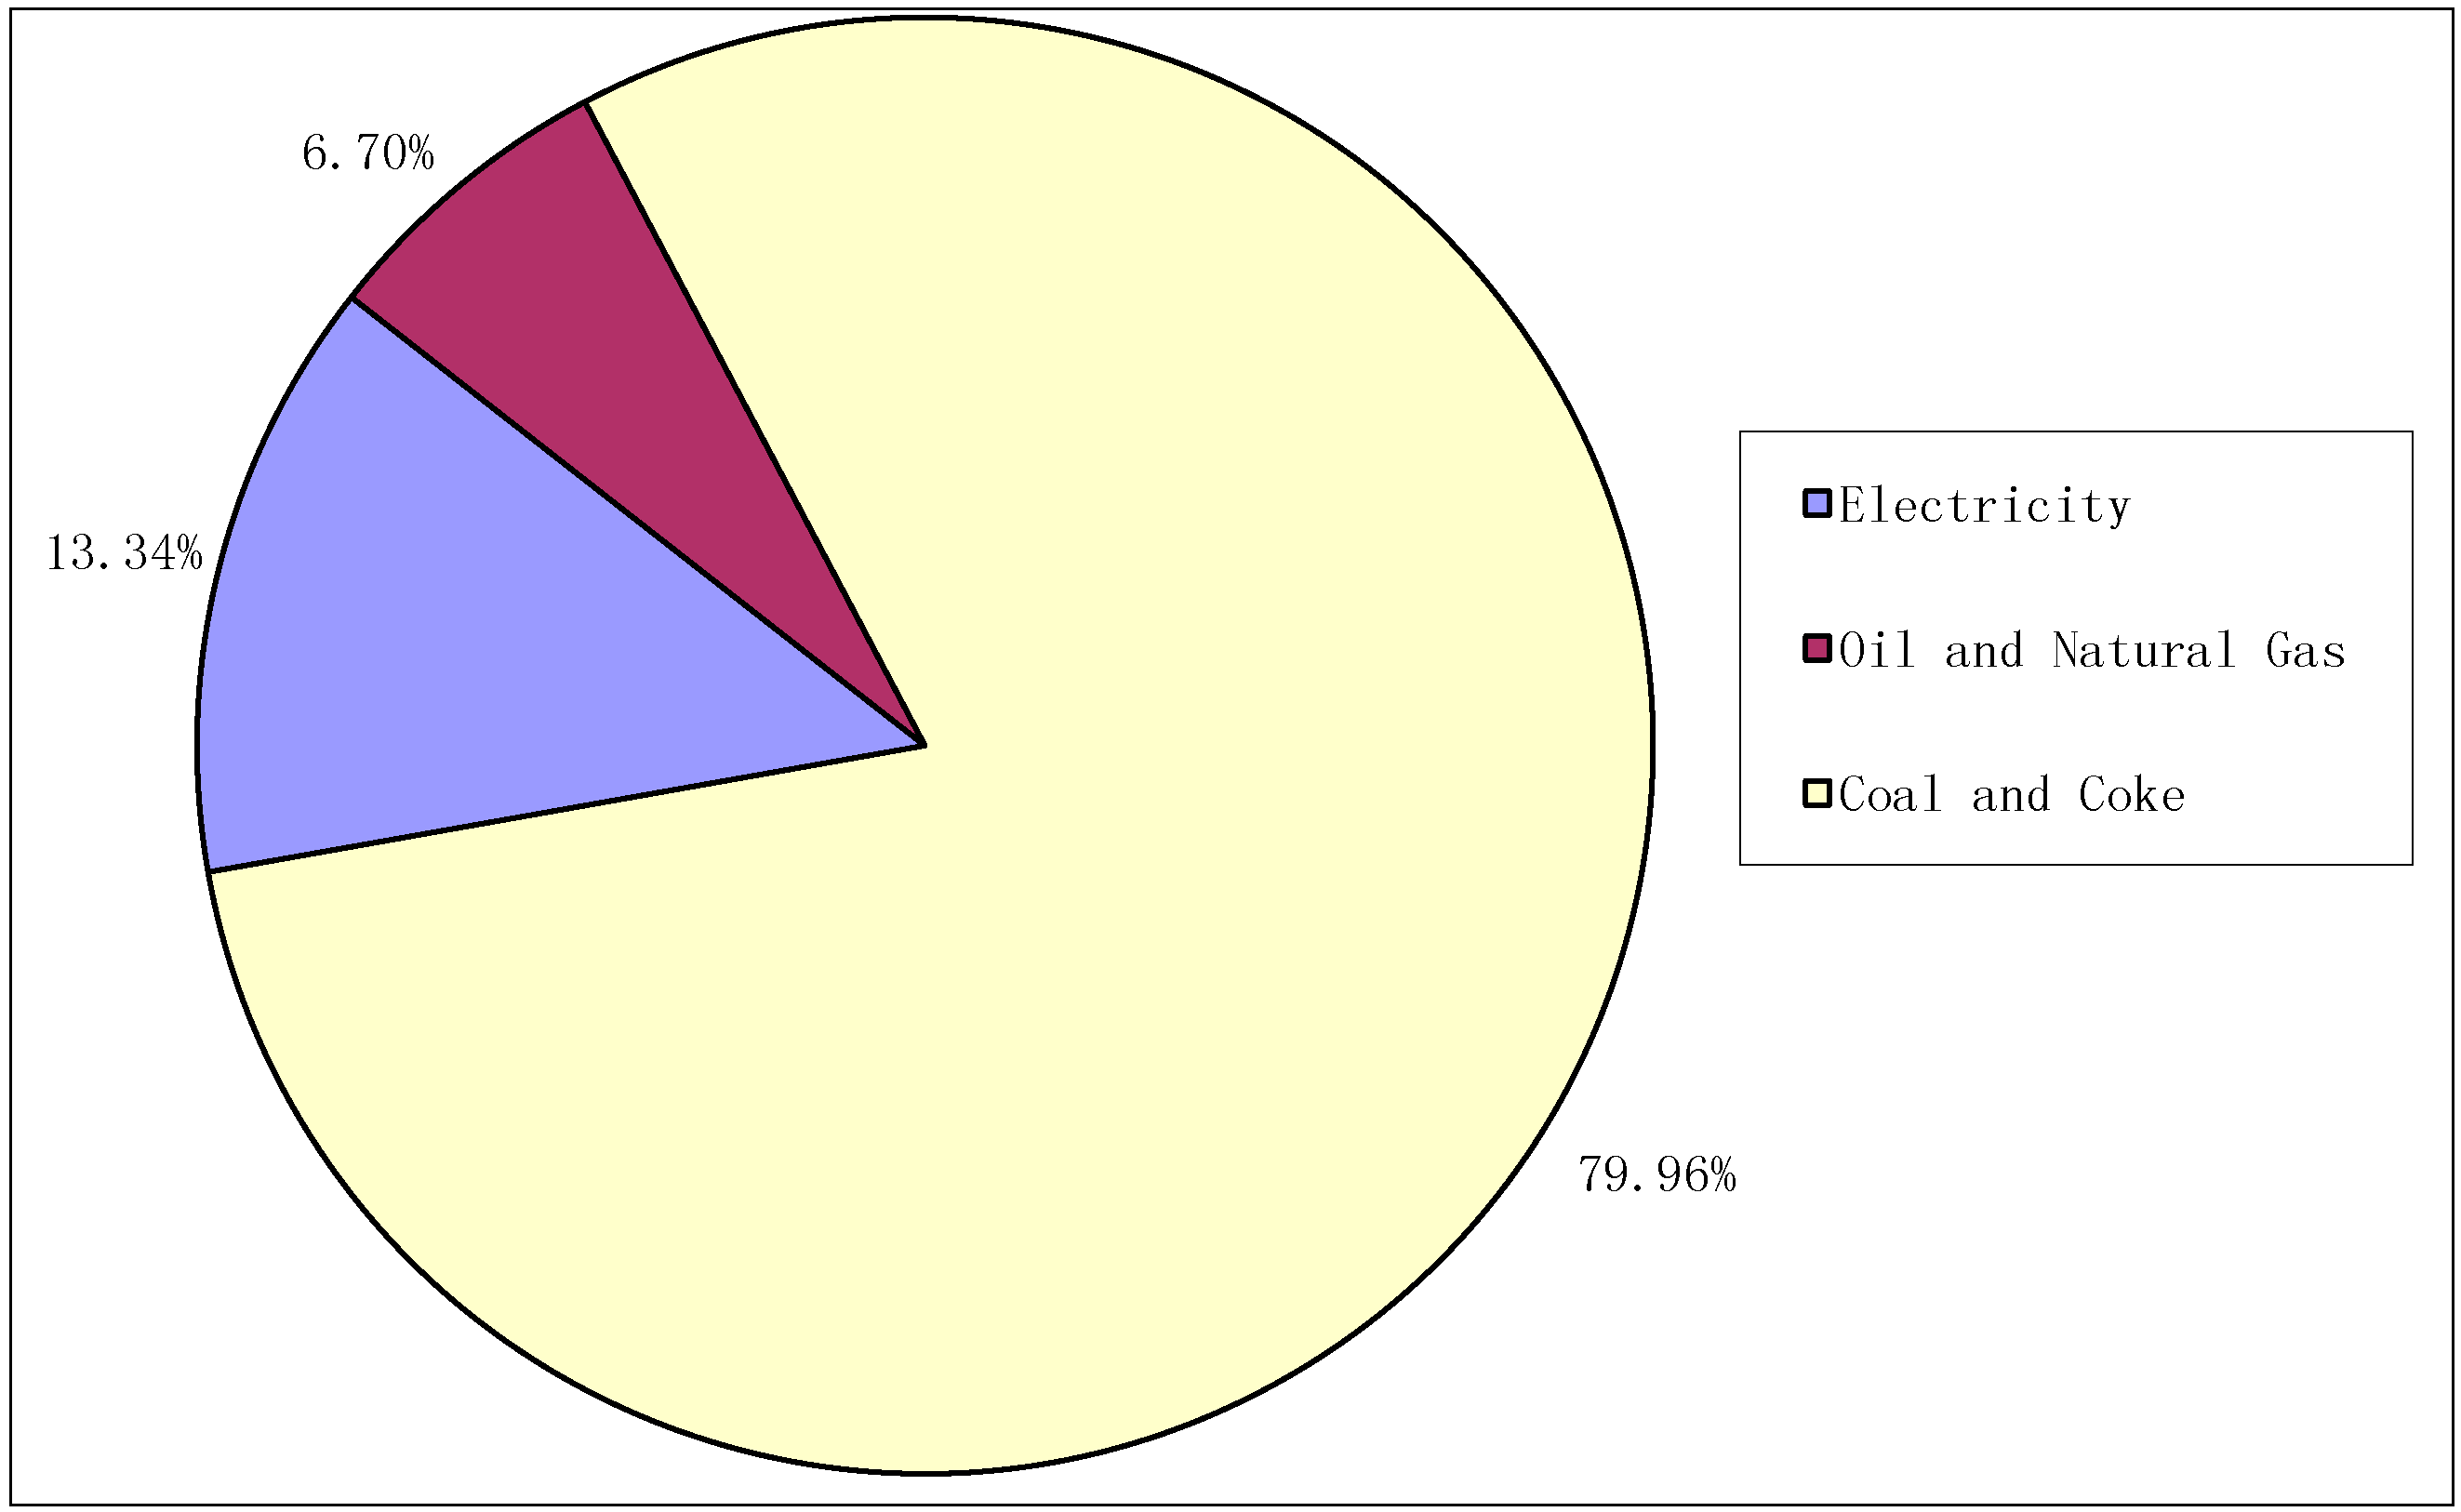
3.2.1. Non-Metallic Mineral Products Industry’s Energy Consumption Mix

Over the period of 1994–2010, the energy consumption mix in the NMMPI did not change much, and fossil fuel was the main source of energy. Figure 3 displays the fossil fuel consumption in the NMMPI from 1994 to 2010. As shown in the figure, coal is still the primary energy source and is dominant in the NMMPI’s energy scheme. Figure 4 illustrates the energy consumption mix of manufacturing non-metallic mineral products and the shares of various energies consumed in this industry (coal, coke, oil, natural gas and electricity). As noted in the figure, fossil fuels account for 87%, and electricity makes up only 13% of the total energy consumption. In terms of electricity, clean energies, such as hydropower, nuclear power, wind power and solar power, generate about 18% of China’s electricity, but over 80% of electricity comes from coal [22]. The high rate of coal usage brings about a high level of CO2 emissions and severe environmental problems.

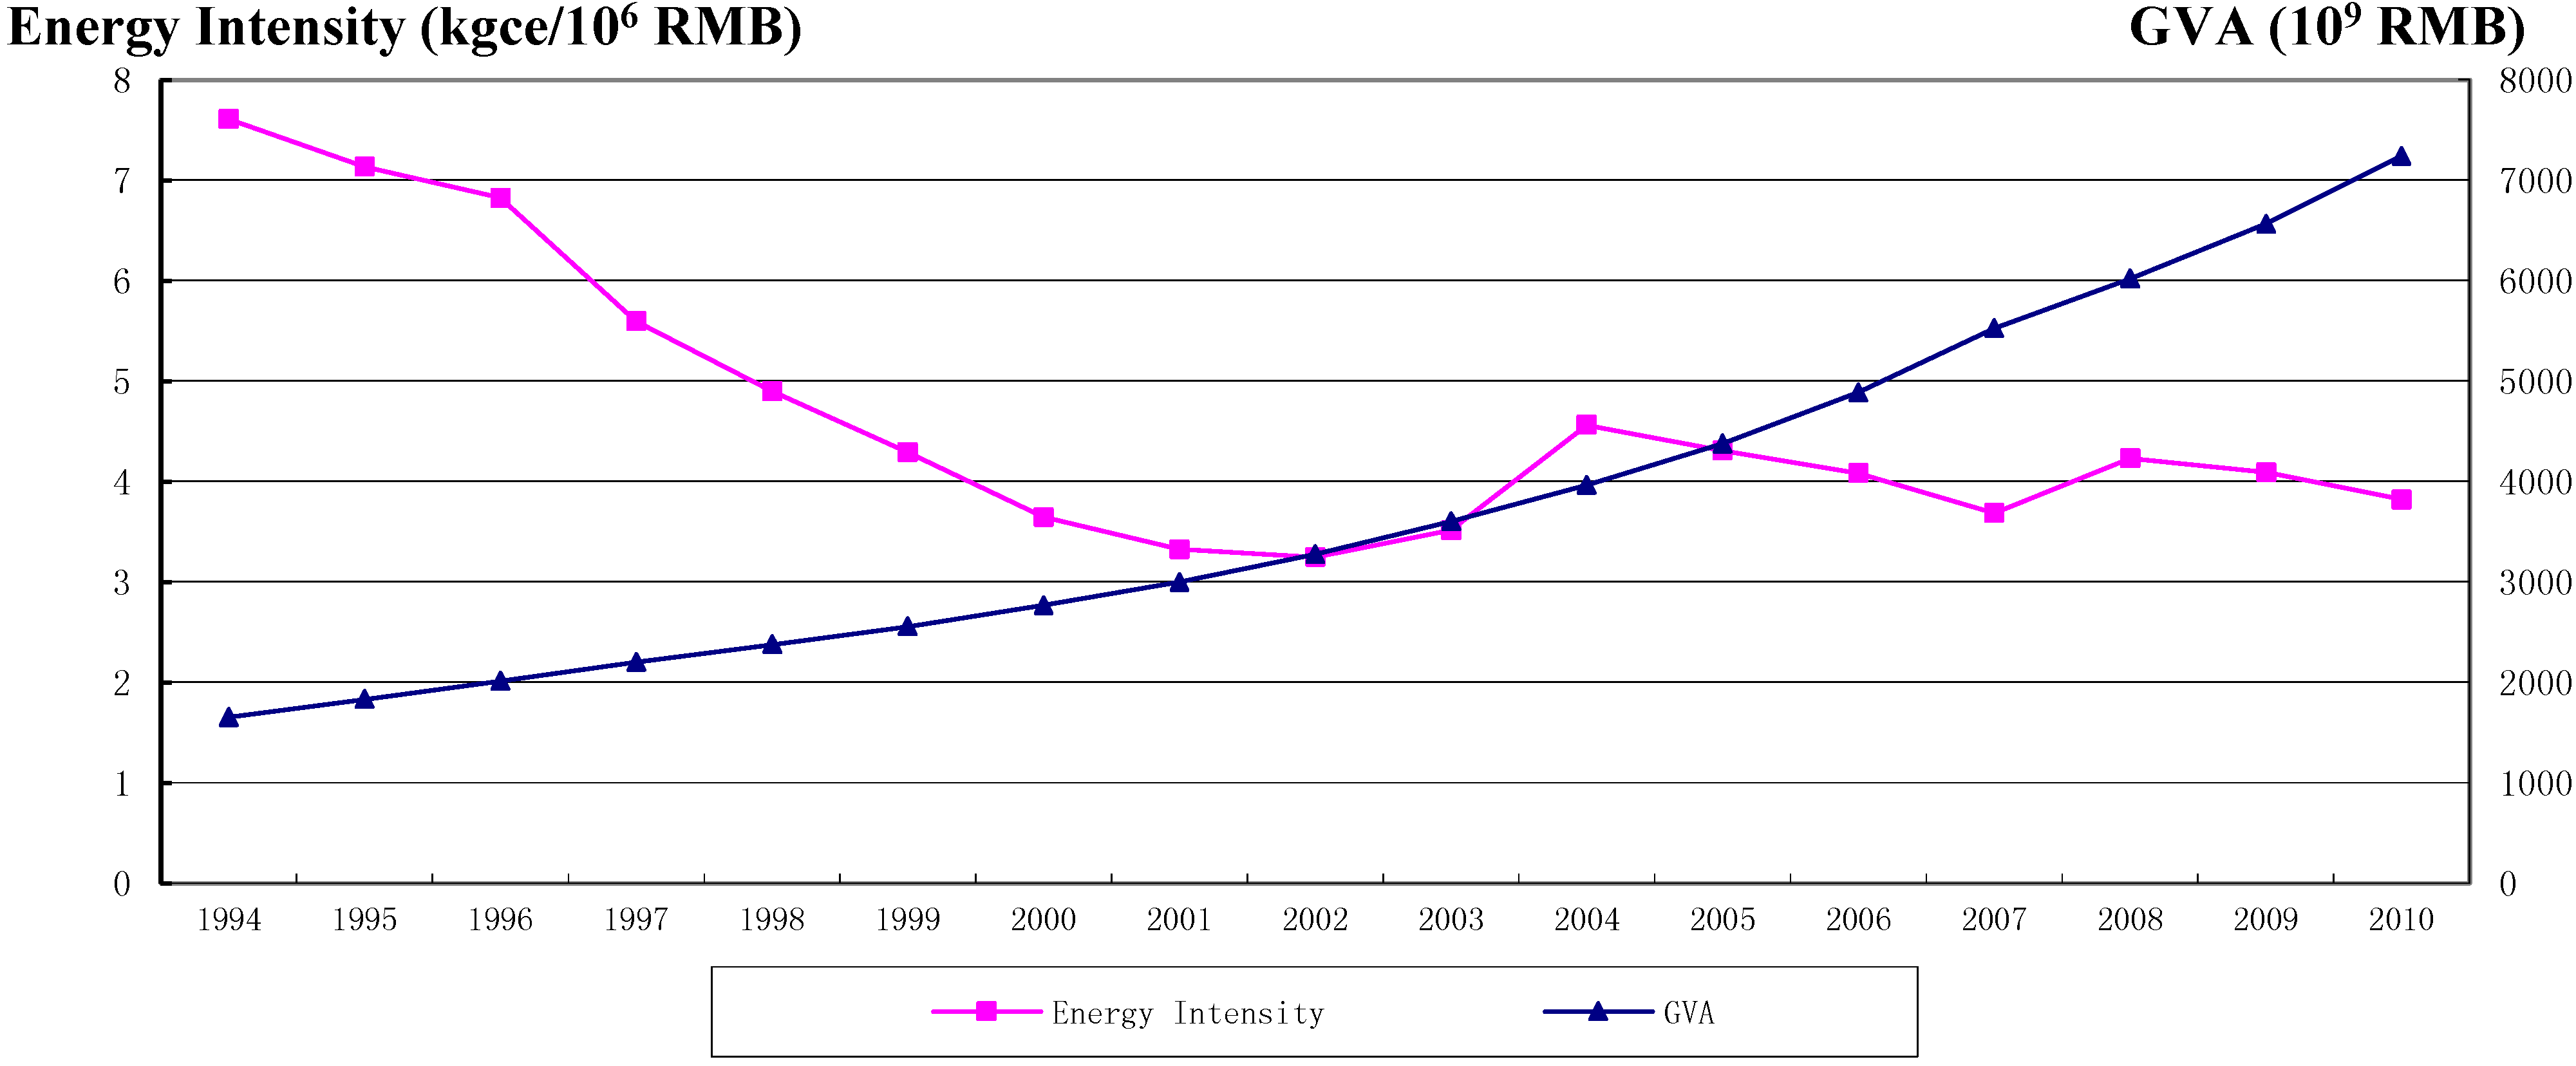
3.2.2. Non-Metallic Mineral Products Industry’s Energy Intensity

Energy intensity is a measure of energy efficiency. It is usually calculated as units of energy consumed per unit of product in a nation or region. High energy intensity indicates a high cost of converting energy into products and vice versa. Energy intensity varies widely between nations and depends on the level of industrial infrastructure, the standard of living and energy efficiency. In this section, we use energy intensity data to see how changing energy forms influence the NMMPI’s performance. Figure 5 illustrates the energy intensity of the NMMPI during 17 years (1994–2010). From 1994 to 2001, the gross value added (GVA) of NMMPI was increasing year by year, whereas the energy intensity decreased gradually. From 2002 to 2010, the energy intensity of the NMMPI in China was fluctuating, along with a significant rise of GVA. Compared to 1994, the energy consumption for one unit of GVA (one million RMB) in 2010 declined by 99%.
Figure 3. Fossil fuel consumption in the non-metallic mineral products industry (1994–2010) [16,23,24,25]. (a) Coke, crude oil, gasoline, fuel oil, kerosene and diesel oil; (b) Coal; (c) Natural gas.
Sustainability 06 08012 g003aSustainability 06 08012 g003b
Figure 4. Energy consumption mix of the non-metallic mineral products industry (2010) [10].
Sustainability 06 08012 g004
Figure 5. Energy intensity and gross value added of the non-metallic mineral products industry (1994–2010). GVA, gross value added.
Sustainability 06 08012 g005
Note: Energy intensity = energy consumed/GVA; energy intensity is calculated in constant price.

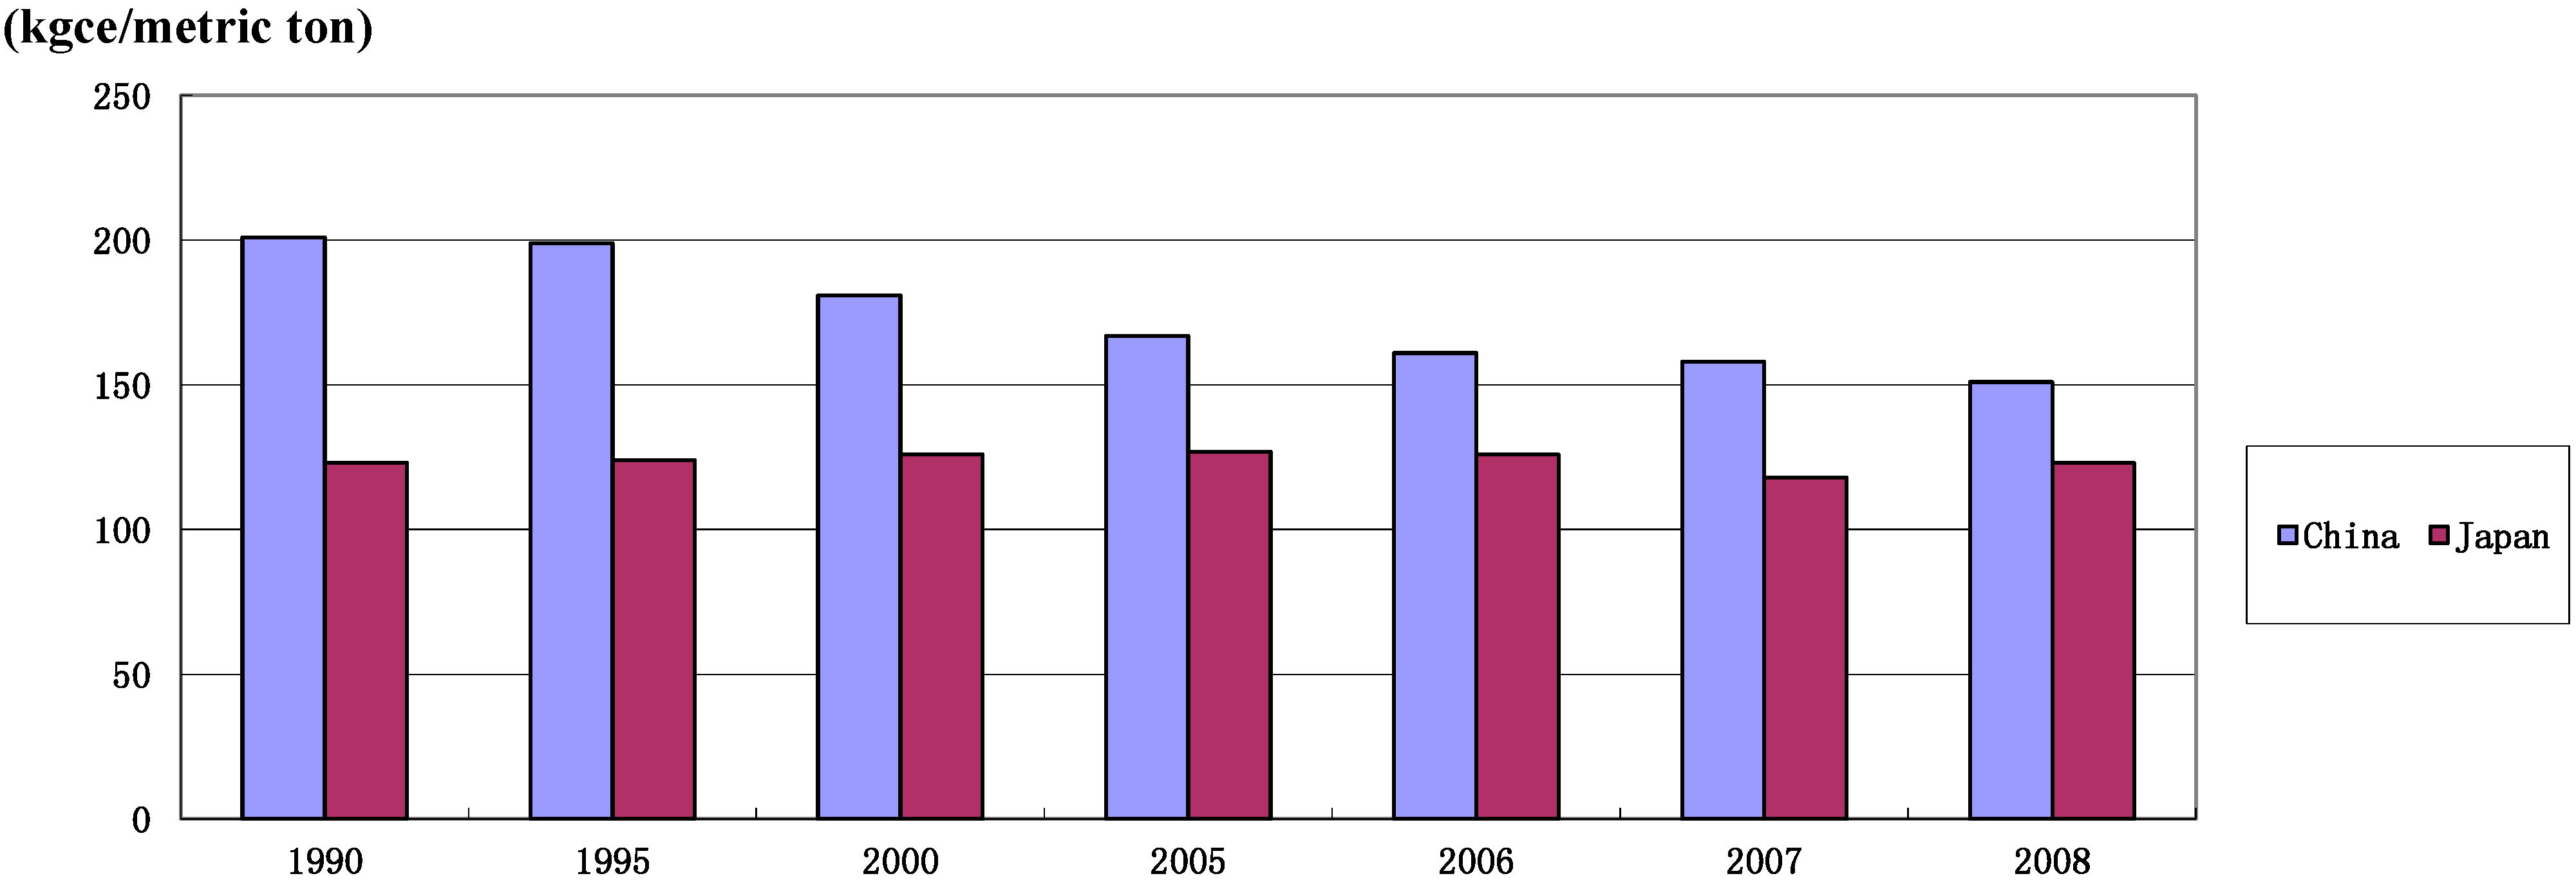
3.2.3. Energy Intensity of Ceramic and Cement Sectors

Due to the widespread use of outdated production equipment, China’s ceramic production is highly energy-consuming [21]. China’s ceramic sector is of extremely low efficiency and demonstrates only 20%–50% of developed countries’ efficiency. The cement sector is one of China’s major sectors for high energy consumption. Figure 6 presents the cement sector’s energy consumption for each unit of product in China as compared to Japan. From 1990 to 2008, China’s full energy consumption for each unit of cement declined dramatically, but was still 23% higher than Japan in 2008.
Figure 6. Full energy consumption for each unit of cement in China and Japan [10,26]. kgce, kilograms of coal equivalent.
Sustainability 06 08012 g006
Note: In the full energy consumption, the conversion coefficient for converting electricity to coal equivalent is based on gross coal consumption for fossil-fired power plants.
The central government of China has established norms of energy consumption for major industries, including the porcelain industry. The international advanced levels of energy intensity have been set as targets to improve the efficiency of energy. In order to meet these norms, over 50% of old-style kilns need to be replaced by more efficient kilns. The equipment upgrade in porcelain production is vital for achieving the targets of saving energy and sustainable industrial development.

4. Carbon Dioxide Emissions from Non-Metallic Mineral Production

4.1. Direct Carbon Dioxide Emissions

Carbon dioxide emissions typically include direct CO2 emissions and indirect CO2 emissions. Direct CO2 emissions mainly come from burning fossil fuels, such as coal, coke, crude oil, diesel oil, kerosene, fuel oil, gasoline and natural gas. Indirect CO2 emissions occur when there exists consumption of electricity or generation of electricity [27].
In 2006, the Intergovernmental Panel on Climate Change (IPCC) recommended paying attention to the incomplete combustion of fossil fuels [28]. For kilns, however, this effect is negligible due to high combustion temperatures, long residence time in kilns and minimal residual carbon found in the clinker. Consequently, carbon in all kiln fuels is assumed to be fully oxidized. The amount of direct CO2 emissions from fossil fuel combustion can be estimated based on the quantity of fossil fuels consumed and the CO2 emission coefficients of various fuels:
Sustainability 06 08012 i001
where PEFC,j,y is the amount of CO2 emissions (metric ton/year) from fossil fuel combustion in process j during year y; FCi,j,y is the quantity of fuel type i (unit/year) combusted in process j during year y; COEFi,j is the CO2 emission coefficient of fuel type i (metric ton/unit) in year y; and i is the fuel type combusted in process j during year y.
We apply the quantity of fossil fuels consumed in the NMMPI (see Figure 3) and the CO2 emission coefficients of eight fossil fuels [10,28,29] to estimate the amounts of CO2 emitted directly from the NMMPI in China for the period 1994–2010. The eight major fossil fuels include coal, coke crude oil gasoline, kerosene, diesel oil, fuel oil and natural gas. Figure 7 illustrates the NMMPI’s total CO2 emissions and indirect CO2 emissions for the years 1994–2010.
Figure 7. CO2 emissions from the non-metallic mineral products industry in China (1994–2010).
Sustainability 06 08012 g007
Note: Direct CO2 emissions include process emissions from the non-metallic mineral products industry (NMMPI).

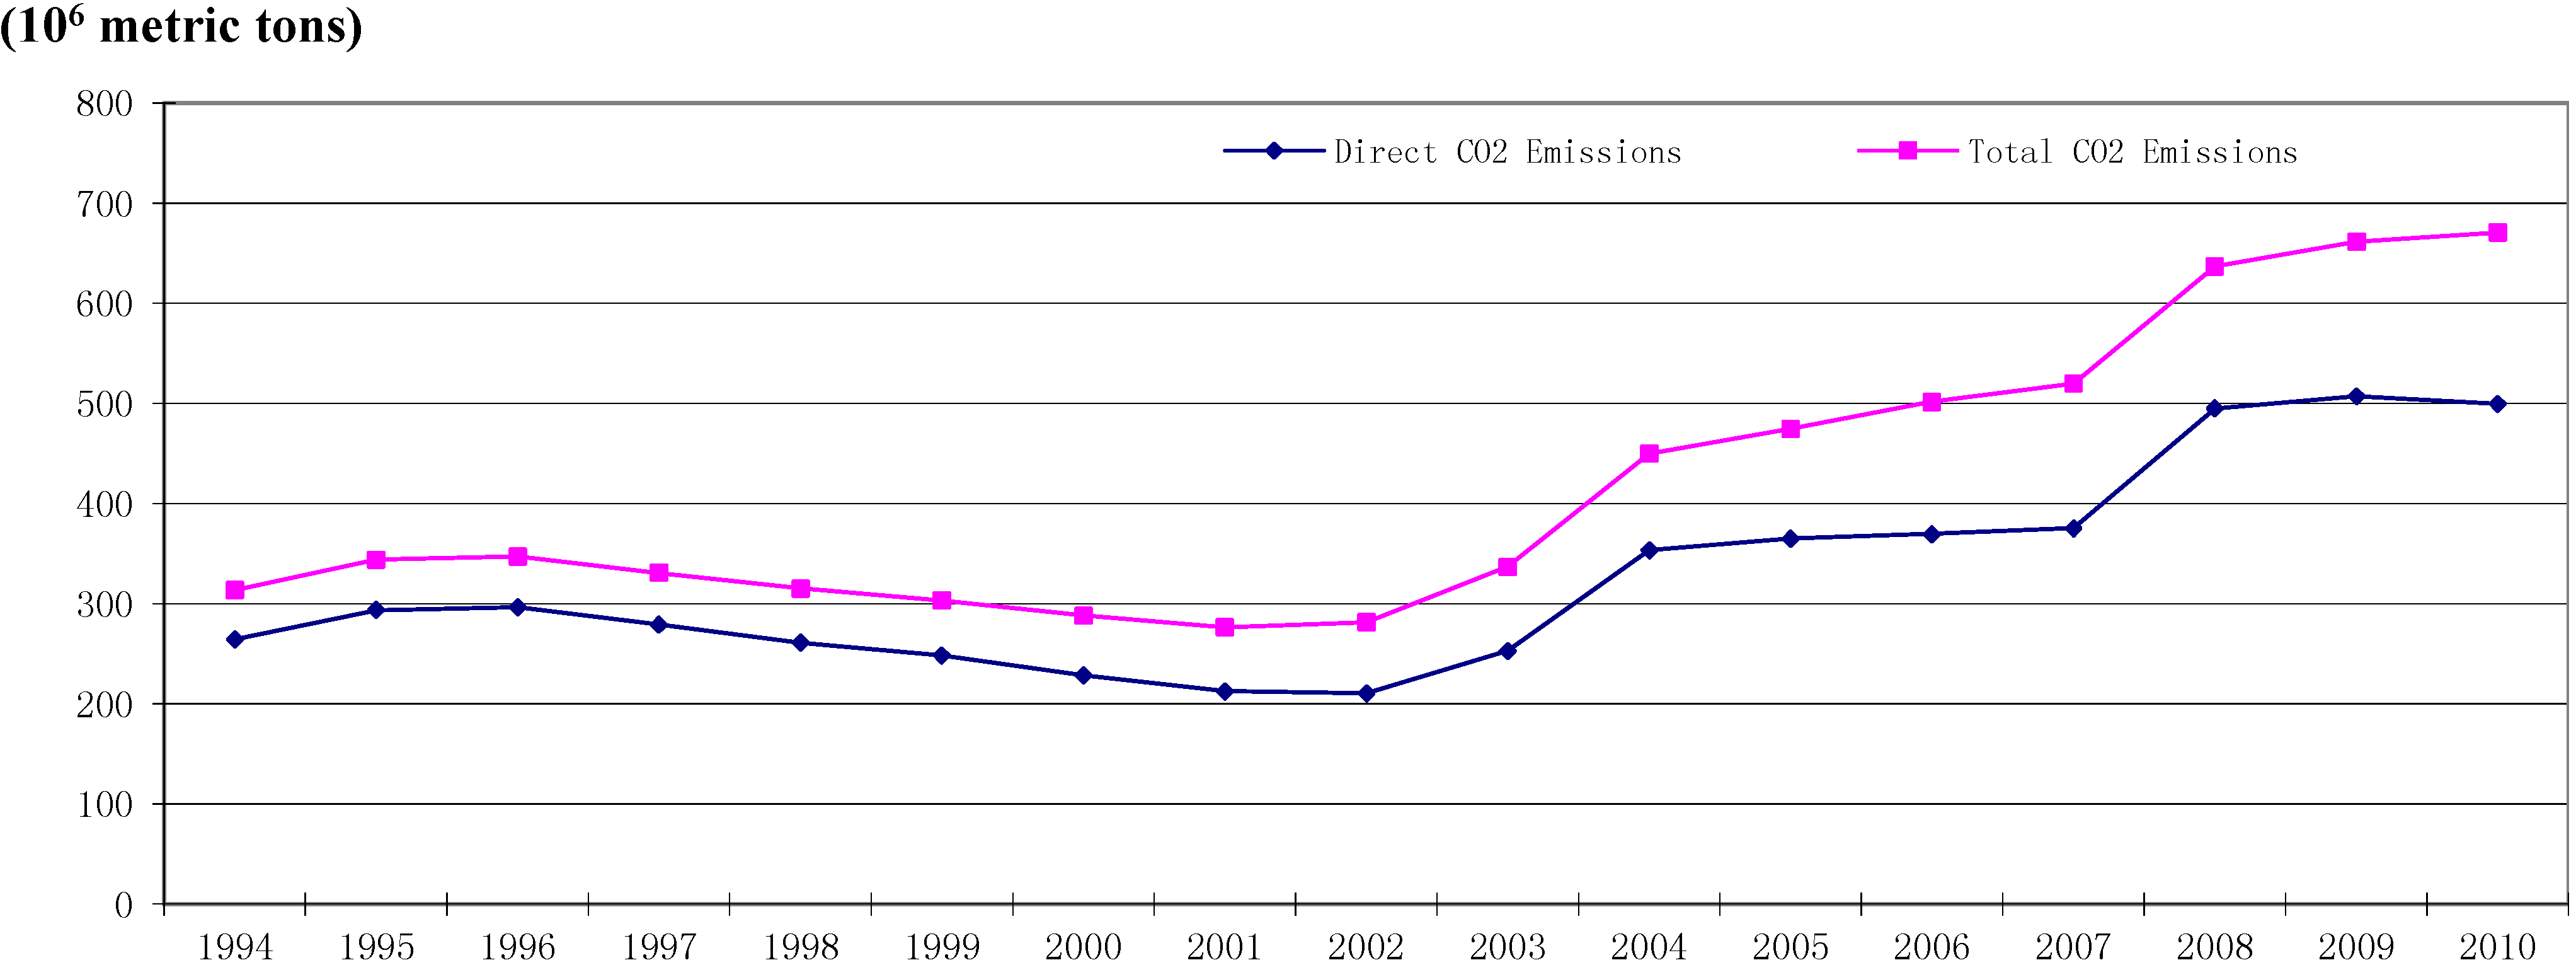
4.2. Indirect Carbon Dioxide Emissions

For the NMMPI, electricity accounts for only 13% of its total energy consumption (see Figure 4). However, CO2 emissions that occur during the electricity generation process should be taken into account. These emissions are referred to as indirect CO2 emissions, which can be estimated by using the electricity consumption data and the CO2 emission coefficients (see Table 3). The emission coefficients of electricity (COEFe) are issued by the Climate Change Information Center (CCIC) [29]. According to the information provided by the IPCC [28] and CCIC [29], the COEFe and the amount of CO2 emissions for year y (CEy) can be calculated by using Equations (2) and (3) below, respectively.
COEFe = CCR × CEF × NCV × CF
CEy = EC × STP × COEFe,y
In Equation (2), CCR denotes the coal consumption rate; CEF represents the carbon emission factor; NCV is the net calorific value; and CF is the conversion factor. In Equation (3), EC and STP are the amount of electricity consumption and shares of thermal power, respectively.

4.3. Carbon Dioxide Emissions from the Cement Sector

The cement sector is a major source of CO2 emissions, and 5% of global CO2 comes from cement production [30,31]. Global cement production emitted approximately 829 million metric tons of CO2 in 2000 [32]. The high demand for cement has also resulted in the rapid development of China’s cement industry. The cement output increased from 0.2 billion metric tons in 1990 to two billion metric tons in 2010 [2], and CO2 emissions have also experienced a sharp rise within this period. In China, the producing process, fossil fuel consumption and electricity consumption for cement production contribute to a large proportion of the total CO2 emissions caused by cement production [33].
Table 3. Electricity consumption (1994–2010) and related CO2 emission coefficients (COEFe) in the non-metallic mineral products industry [10,34].
YearElectricity Consumption (109 kWh)Electricity shares (%)Standard coal consumption rate (kg/kWh)COEFe (kg CO2/kWh)
Thermal powerOther power a
199457.480.8619.140.3810.852
199559.9680.1819.820.3790.842
199659.2581.3018.700.3770.854
199760.8181.5718.430.3750.847
199864.9181.0918.910.3730.837
199966.0781.4818.520.3690.833
200073.4280.9619.040.3630.814
200179.3181.1718.830.3570.803
200287.9481.7518.250.3560.805
2003103.0982.8817.120.3550.815
2004120.9382.5017.500.3490.798
2005141.6181.5418.460.3430.773
2006167.3883.3116.690.3420.789
2007188.4383.3416.660.3320.767
2008195.9781.3218.680.3220.723
2009212.6281.8118.190.3200.725
2010244.8580.8119.190.3120.699
a Other power includes hydropower, nuclear power, wind power, solar power and geothermal power.

4.4. Carbon Dioxide Emissions from Plate Glass, Ceramic Sectors and Refractories

The plate glass, ceramic and refractories sectors in the NMMPI are energy-intensive and high emissions sectors. The total amount of CO2 emissions from plate glass production was 22.57 million metric tons [35]. This figure was estimated by using the amount of diverse energy consumption and the corresponding CO2 emission coefficient [36]. Table 4 shows the outputs and energy consumption of the ceramic sector. The total CO2 emissions were approximately 95.37 million metric tons in 2007. The production of refractories is another major source of CO2 emission in the NMMPI, which generated about 55.19 million metric tons of CO2 in 2010 [37,38].
Table 4. Outputs and energy consumption of the ceramic sector in 2007 [39].
Architectural ceramicsSanitary ceramicsDaily ceramicsTotal
Output5.2 × 109 m20.12 × 109 m220 × 109 pieces
Mineral materials consumption (106 metric tons)1201.62.4124
Energy consumption (106 mtce)311.4234.4
CO2 emissions (106 metric tons)95.37
Note: According to Xu [17], the CO2 emission coefficient for energy consumption is 2.7725 metric tons of CO2/mtce.

5. Discussions: Energy Saving and Emissions Reduction

As mentioned above, energy saving is considered as a necessary step for reducing the energy intensity of the NMMPI in China. The large amount of CO2 emissions from the NMMPI reflects both the market’s and government’s failures in environmental management. This section discusses some possible measures that are closely related to China’s NMMPI and that play a vital role in energy saving and emissions reduction.

5.1. New Production Technologies and Processes

After the Copenhagen climate conference in 2009, the Chinese government has set an ambitious target: by 2020, the CO2 emissions per unit of GDP should be reduced by at least 40%, setting 2005 as the base year [40]. Hence, retrofitting facilities and using new production technologies in the NMMPI is imperative. For instance, the cement sector has started to adopt more efficient technologies, like using an advanced dry-processing method (DPM) to replace inefficient processing methods. Since 2003, the cement production using the DPM has begun to expand and experienced a continuous increase. The proportion of production using the DPM has risen to over 85% by 2011 [17,41]. The average integrated energy intensity of producing cement was declining year by year [14]. For the coal intensity of cement production, it declined from 150 kgce per metric ton in 2001 to 126 kgce per metric ton in 2007. Furthermore, there was a large amount of inefficient production capacity phased out. By the end of 2008, nearly 120 million metric tons of production capacity using outdated technologies had been phased out by technical retrofitting. This saved nearly 3.7 million metric tons of standard coal and reduced CO2 emissions by 9.59 million metric tons [41].

5.2. Cogeneration Technology

China has made appreciable advances in cogeneration technology over the past few decades. In China, low-temperature waste heat technology has been widely used to generate power in the NMMPI. The low-temperature waste heat power generation is characterized by using the low-temperature gas emitted from cement pre-calcination kilns and cooling machines to produce power. Low-temperature waste heat is clean power and has played a crucial role in reducing CO2 in the NMMPI, particularly in the cement sector. In 2008, China’s cement sector had 263 dry-processing production lines installed with low-temperature waste heat power generation devices, accounting for 45% of the total production lines. The total electricity capacity is about 1662 megawatts (MW). The low-temperature waste heat in the cement sector generated 7.1 billion kilowatt-hours (kWh) of electricity. In other words, it eliminated 6.65 million metric tons of CO2 emissions [41].

5.3. Introducing New Products for Carbon Dioxide Emissions Reduction

In China, a high proportion of cement is produced in large-scale and state-owned plants, which are mostly near limestone quarries or other raw carbonate mineral sources, as they supply raw materials used in the cement production processes. CO2 is emitted during the production of clinker, a component of cement, in which calcium carbonate (CaCO3) is heated in a rotary kiln to induce a series of chemical reactions [12,42]. Specifically, CO2 is released as a by-product during the calcination, which occurs in the upper end of the kiln, namely the pre-calciner, at temperatures from 600 to 900 °C. It results in the conversion of carbonates to oxides [43]. The simplified chemical reaction is as follows:
Calcination: CaCO3 → CaO + CO2
In the lower end of the kiln, with a higher temperature, the lime (CaO) reacts with silica, aluminium and iron-containing materials to produce minerals in the clinker, which is an intermediate product of cement manufacturing. The clinker is then removed from the kiln to cool down and ground into a fine powder. The powder is mixed with a small fraction (5%) of gypsum to create the most common type of cement, known as Portland cement. Masonry cement is the second most common cement. Since Masonry cement requires more lime than Portland cement, the production of masonry cement generally results in extra CO2.
Around 40 years ago, China began to develop sulphur aluminate cement with less CaO. This type of cement is produced by grinding cement clinker. The clinker is usually obtained through roasting suitable raw materials that consist essentially of anhydrous calcium sulphoaluminate and dicalcium silicate. Suitable gypsum with less than 10% of limestone is blended with the clinker during the manufacturing of rapid-hardening sulphoaluminate cement. The product is a hydraulic binding material and a high-strength cement. The CaO in sulphur aluminate cement clinker is 40% lower than the Portland cement clinker. Thus, using the sulphur aluminate cement instead of Portland cement could significantly reduce the emission of CO2.

5.4. Economic Adjustment and Industrial Transformation

In recent years, China’s NMMPI has faced increasing challenges. On the one hand, the comparative advantage owing to China’s low-labour costs has been diminishing. On the other hand, because of the unfavourable international economic situation and high domestic production costs, manufacturing sectors are likely to shrink in China [44]. To address these issues, China has to place its economic emphasis away from relying on labour-intensive products (e.g., non-metallic mineral products). Nevertheless, the industrial transformation from labour-intensive industries to capital-intensive and technology-intensive industries is usually a time-consuming process. The technology-intensive, capital-intensive and labour-intensive industries have to coexist for a long period to foster China’s current economic growth. Hence, the non-metallic mineral production, as well as its energy consumption and CO2 emission would experience a gradual decrease, due to economic adjustment and industrial transformation in the foreseeable future.

5.5 Policies Influence on Energy Efficiency Improvement and Emissions Reduction

There are a few newly issued policies that influence the NMMPI’s energy efficiency and emissions reduction. However, contradictions exist among them. On the one hand, targets for emissions reduction and energy consumption along with housing policy will decrease the energy consumption, as well as CO2 emissions in the NMMPI; on the other hand, the central government’s “cooling the overheated economy” policy would not reduce CO2 emission, but rather slow the improvement of energy efficiency in this industry.

5.5.1. “Cooling the Overheated Economy” Policy

In the last few years, China’s economy was damaged by speculative bubbles and high inflation, which were caused by excessive investment. Consequently, the central bank of China took measures to prevent economic overheating. For instance, from 2010 to 2011, the central bank raised the legal deposit reserve rate by more than ten times. Given that deposit reserve plays a vital role in the financial market, raising the deposit reserve rate is useful to control the overheated investment. Thus, investment in some fields, including the investment in retrofitting outdated facilities and introducing new technologies in the NMMPI, can be significantly limited because of the comparatively high costs of investment.

5.5.2. Housing Policy

Real estate and property construction in China accounted for around 11% of GDP by the end of 2011. Residential property investment in China tripled from 2% of GDP in 2000 to 6% in 2011, based on figures released by the Ministry of Land and Resources and the Chinese National Bureau of Statistics. Besides the deposit reserve policy, the Chinese government has taken a series of regulations to control consumers’ transaction behaviours in the real estate market and to cool the construction sector since 2010. Given that most construction materials come from the NMMPI, a weak construction sector would lead to a significant slowdown in the NMMPI’s growth along with a remarkable reduction in CO2 emissions.

5.5.3. Targets for Emissions Reduction and Energy Consumption

It is stipulated in the 12th Five-Year Plan (2011–2015) for Chinese Economic and Social Development that by 2015, non-fossil energy will rise to over 11% of China’s total primary energy consumption. Energy consumption for each unit of product should drop by 16% from 2010. Similarly, the CO2 emission for each unit of product should decline by 17%. The Chinese central government has made a further commitment: by 2020, the CO2 emission for each unit of product should be 40%–45% lower than in 2005, and non-fossil energy will account for over 15% of the total primary energy consumption. The NMMPI association and provincial governments also have adopted similar targets, as have other industrial associations. These targets can make the enterprises reduce CO2 emissions and energy consumption markedly.

6. Conclusions and Recommendations

China’s NMMPI is an energy-intensive and high CO2-emitting sector. Its rapid growth has led to continuous dependence on fossil fuels and raised environmental concerns. The present study focuses on the manufacturing of non-metallic mineral products and examines energy consumption and CO2 emissions in this sector in China. It shows that the energy consumption and CO2 emissions have been growing at an alarming rate, and energy consumption is excessively dependent on coal. Hence, how to achieve China’s energy efficiency improvement and CO2 emission reduction targets has become an issue open to debate. Although China is diversifying its energy mix to decrease its reliance on low-efficiency and high CO2-emitting energies, upgrading production facilities and adopting more efficient technologies is of paramount importance. In addition, the current study makes a few policy recommendations:
  • All of the non-metallic mineral production capacity that does not meet the newly issued norms of energy consumption should be phased out by 2020. The construction of new production capacity can drive the economy to grow quicker. The norms for building new production facilities have to be set by referring to the international advanced standards. This is vital for energy efficiency improvement.
  • Due to the relatively high cost of transporting cement or other high-density products and the wide distribution of limestone, many small plants using outdated technologies near raw materials sources are still in operation. Given that most raw materials sources are mostly located in China’s less developed areas, governments provide these plants technical and financial support, which ensures sustainable economic development and helps alleviate environmental issues here.
  • In the NMMPI, controlling total energy consumption and energy intensity is another key step towards improving energy efficiency. Governments could implement market-based policies to provide incentives to producers. These public policies include subsidies for environment-friendly products and more efficient facilities, taxes on extra CO2 emissions and tradable emission permits.
  • China needs international cooperation in applying renewable energies and pollution control to achieve environmental protection targets. The cooperation among different states, governments, research institutes and companies can be realized by crafting technology partnerships and developing environmental protection demonstration projects in the NMMPI. Such activities are essential to capitalize on mutual strengths and to provide an avenue for the commercialization of clean technology projects, which is still at the primary stage in China.

Acknowledgments

The authors are grateful to the anonymous reviewers for their insightful comments on this article. This work was financially supported by the Fundamental Research Funds for the Central Universities in China (No. 105274054) and the Humanities and Social Science Research Funds (No. 14YJCZH055; No. 13YJC790179) from the Chinese Ministry of Education.

Author Contributions

Hui Hu collected the data and wrote the manuscript. Philip Kavan reviewed related studies and contributed to the manuscript drafting and its revisions.

Conflicts of Interest

The authors declare no conflict of interest.

References

  1. Department of Industrial Statistics, National Bureau of Statistics of China (DISNBSC). China Industrial Economy Statistical Yearbook 2012; China Statistics Press: Beijing, China, 2013. [Google Scholar]
  2. DISNBSC. China Industrial Economy Statistical Yearbook 2010; China Statistics Press: Beijing, China, 2011. [Google Scholar]
  3. National Development and Reform Commission (NDRC). The Plan to Promote the Development of Urbanization (2011–2020); National Development and Reform Commission: Beijing, China, 2012. [Google Scholar]
  4. China Cement Association (CCA). China Cement Almanac 2010; Jiangsu People’s Publishing House: Nanjing, China, 2011. [Google Scholar]
  5. Ministry of Industry and Information Technology (MIIT). Steady Progress in Product Structure Adjustment of Cement Industry. 2012. Available online: http://cys.miit.gov.cn/n11293472/n11295023/n11297698/14694316.html (accessed on 14 August 2014). (In Chinese) [Google Scholar]
  6. European Cement Association (ECA). Activity Report 2010. Available online: http://www.cembureau.eu/sites/default/files/Activity_Report_2010.pdf (accessed on 14 August 2014).
  7. Energy Network. Report of Energy Consumption and Energy Conservation for China’s High Energy-intensive Industries 2012. Available online: http://www.nengyuan.com/news/d_2013100611111273698.html (accessed on 14 August 2014). (In Chinese)
  8. Shi, J.P.; Li, X.; Lu, S.Z.; Wang, H.B. Emissions of carbon dioxide from cement industry and its reduction strategy in China. Acta Sci. Circum. 2012, 32, 2028–2033. [Google Scholar]
  9. DISNBSC. China Industrial Economy Statistical Yearbook 2011; China Statistics Press: Beijing, China, 2012. [Google Scholar]
  10. Department of Energy Statistics, National Bureau of Statistics of China (DESNBSC). China Energy Statistical Yearbook 2011; China Statistics Press: Beijing, China, 2012. [Google Scholar]
  11. Cui, Q.; Kuang, H.B.; Wu, C.Y.; Li, Y. The changing trend and influencing factors of energy efficiency: The case of nine countries. Energy 2014, 64, 1026–1034. [Google Scholar] [CrossRef]
  12. Wang, Y.; Zhu, Q.; Geng, Y. Trajectory and driving factors for GHG emissions in the Chinese cement industry. J. Clean. Prod. 2014, 53, 252–260. [Google Scholar] [CrossRef]
  13. Wang, Q. Energy conservation as security. China Secur. 2006, 2, 89–105. [Google Scholar]
  14. Venmans, F. Triggers and barriers to energy efficiency measures in the ceramic, cement and lime sectors. J. Clean. Prod. 2014, 69, 133–142. [Google Scholar] [CrossRef]
  15. National Bureau of Statistics of China. National Economy Industry Classification and Code; Standards Press of China: Beijing, China, 2011. [Google Scholar]
  16. National Bureau of Statistics of China. China Statistical Yearbook 2011; China Statistics Press: Beijing, China, 2012. [Google Scholar]
  17. Xu, R. Current Situation and Prospect of China’s Cement Industry Carbon Dioxide Emissions. In Proceedings of the 2012 China Cement Technical Conference and 14th Cement Technology Exchange Conference, Liuzhou, China, 20–22 November 2012.
  18. Cheng, Y.D.; Liu, J.K. The Chinese and Foreign Cement Industrial Production and Technical Data Analysis. China Cem. 2012, 8, 20–23. [Google Scholar]
  19. China Building Materials Federation. Glass Sector in China. Available online: http://cbmia.cbminfo.com/tabid/5369/default.aspx (accessed on 14 August 2014). (In Chinese)
  20. Chinese Ministry of Industry and Information Technology (CMIIT). Operation Status of Major Industry Sectors in 2008: Material Industry. Available online: http://news.hexun.com/2009-02-02/113896206.html (accessed on 14 August 2014). (In Chinese)
  21. Porcelain Library China (PLC). How do Ceramic Enterprises Carry out Technological Transformation? Available online: http://www.gogochina.cn/news/info_2937_1.html (accessed on 14 August 2014). (In Chinese)
  22. Ren, S.G.; Hu, Z. Effects of decoupling of carbon dioxide emission by Chinese nonferrous metals industry. Energy Policy 2011, 43, 407–414. [Google Scholar] [CrossRef]
  23. National Bureau of Statistics of China. China Statistical Yearbook 2009; China Statistics Press: Beijing, China, 2010. [Google Scholar]
  24. National Bureau of Statistics of China. China Statistical Yearbook 2010; China Statistics Press: Beijing, China, 2011. [Google Scholar]
  25. National Bureau of Statistics of China. China Statistical Yearbook 2012; China Statistics Press: Beijing, China, 2013. [Google Scholar]
  26. Chinese Ministry of Industry and Information Technology (CMIIT). Status of Cement Industry in 2011 and the Industry’s Development Outlook for 2012. Available online: http://www.miit.gov.cn/n11293472/n11293832/n11294132/n12858402/n12858582/14481348.html (accessed on 14 August 2014).
  27. McLellan, B.C.; Corder, G.D.; Giurco, D.P.; Ishihara, K.N. Renewable energy in the minerals industry: A review of global potential. J. Clean. Prod. 2012, 32, 32–44. [Google Scholar] [CrossRef]
  28. Intergovernmental Panel on Climate Change (IPCC). IPCC Guidelines for National Greenhouse Gas Inventories 2006. Available online: http://www.ipcc-nggip.iges.or.jp/public/2006gl/ (accessed on 14 August 2014).
  29. Climate Change Information Center (CCIC). Estimating CO2 Emissions Reduction by Example; CCIC: Malila, Philippine, 2003. [Google Scholar]
  30. Marland, G. Estimates of CO2 Emissions from Fossil Fuel Burning and Cement Manufacturing, Based on the United Nationals Energy Statistics and the U.S. Bureau of Mines Cement Manufacturing Data; Oak Ridge National Laboratory: Oak Ridge, TN, USA, 1989. [Google Scholar]
  31. Barker, D.J.; Turner, S.A.; Napier-Moore, P.A.; Clark, M.; Davison, J.E. CO2 capture in the cement industry. Energy Proced. 2009, 1, 87–94. [Google Scholar] [CrossRef]
  32. Andres, R.J.; Marland, G.; Fung, I.; Matthews, E. A 1 × 1 distribution of carbon dioxide emissions from fossil fuel consumption and cement manufacture, 1950–1990. Global Biogeochem. Cycles 1996, 10, 419–429. [Google Scholar]
  33. Li, C.; Nie, Z.; Cui, S.; Gong, X.; Wang, Z.; Meng, X. The life cycle inventory study of cement manufacture in China. J. Clean. Prod. 2014, 72, 204–211. [Google Scholar] [CrossRef]
  34. China Electricity Yearbook Editorial Board. China Electricity Yearbook 2011; China Power Press: Beijing, China, 2012. [Google Scholar]
  35. Wei, N.N.; Yu, P. Plate glass industrial fuel combustion CO2 emissions calculation methods discussion. Glass 2011, 23, 10–13. [Google Scholar]
  36. Xue, J.; Luo, H.; Lv, L.H.; Zhao, J.; Wang, X. Emission characteristics and correlation of main air pollutant and greenhouse gas in China. Resour. Sci. 2012, 34, 1452–1460. [Google Scholar]
  37. National Bureau of Statistics of China. China Statistical Yearbook on Environment 2010; China Statistics Press: Beijing, China, 2011. [Google Scholar]
  38. Wei, T.; Wu, Y. Energy saving in China’s refractories production. Refract. Lime 2007, 32, 4–8. [Google Scholar]
  39. Fang, Z.; Liu, P.J.; Qiao, S.G. Ceramic industrial furnace fuel gas applications. Ceram 2009, 49, 49–51. (In Chinese) [Google Scholar]
  40. Cong, R.G.; Wei, Y.M. Potential impact of (CET) carbon emissions trading on China’s power sector: A perspective from different allowance allocation options. Energy 2010, 35, 3921–3931. [Google Scholar] [CrossRef]
  41. Wang, Y. China’s cement industry is committed to the reduction of CO2 Situation and Prospect. China Cem. 2009, 11, 17–20. [Google Scholar]
  42. Intergovernmental Panel on Climate Change (IPCC). IPCC Guidelines for National Greenhouse Gas Inventories; Institutefor Global Environmental Strategies: Hayama, Japan, 2006. [Google Scholar]
  43. Worrell, E.; Price, L.; Martin, N.; Hendriks, C.; Meida, L.O. Carbon dioxide emissions from the global cement industry. Annu. Rev. Energy Env. 2001, 26, 303–329. [Google Scholar] [CrossRef]
  44. Li, H.; Qi, F.; Zhang, S. Home market effects of foreign trade in China’s manufacturing sector: Analysis using international standard industry classification panel data. China World Econ. 2012, 20, 1–15. [Google Scholar] [CrossRef]

