Sustainability Life Cycle Cost Analysis of Roof Waterproofing Methods Considering LCCO2


Abstract
:1. Introduction
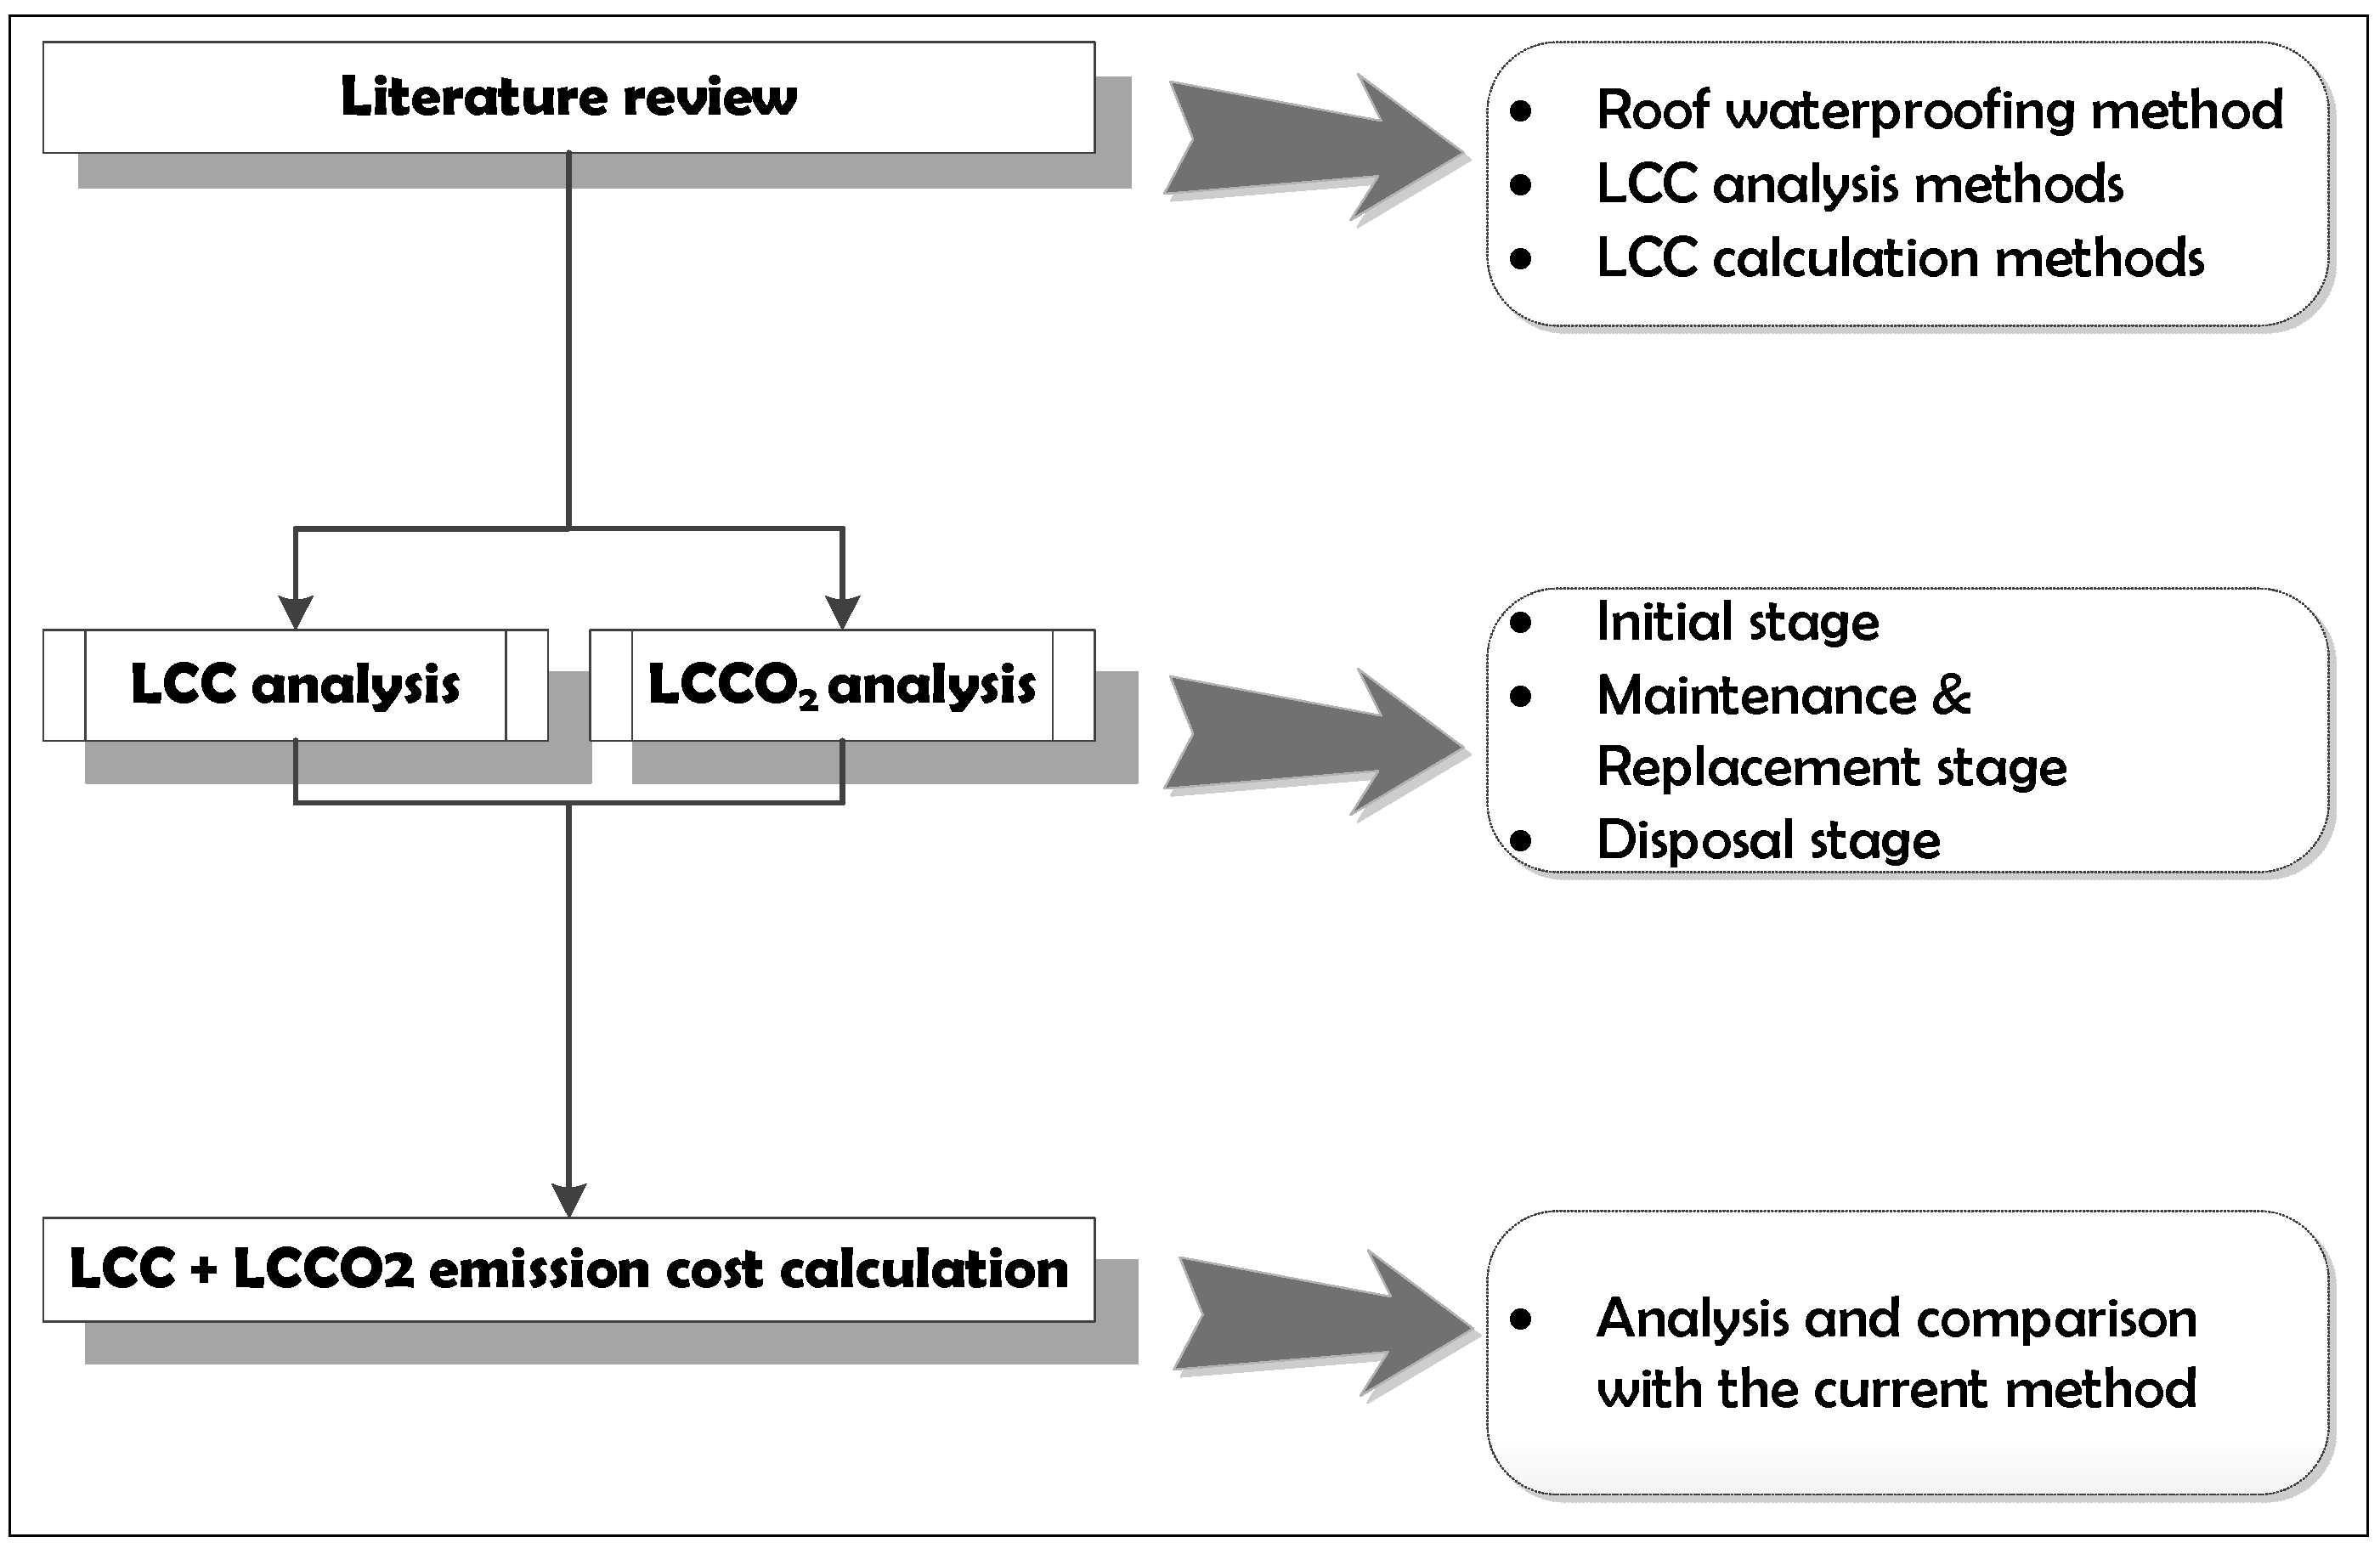
2. Methodology
3. Literature Review
3.1. Selection of Waterproofing Methods by LCC
3.2. Cost Estimation of CO2 Emission
4. LCC Estimation
4.1. Selection of Roof Waterproofing Method


| Method | Components | |
|---|---|---|
| Asphalt |  |
|
| Membrane |  |
|
| Sheet |  |
|
4.2. LCC Assessment Method
4.3. Repair Period and Repair Rate
| Area | Period | Ratio (%) | |
|---|---|---|---|
| Asphalt waterproofing | Partial | 8 | 10 |
| Full | 25 | 100 | |
| Membrane waterproofing | Partial | 5 | 10 |
| Full | 15 | 100 | |
| Sheet waterproofing | Partial | 8 | 20 |
| Full | 20 | 100 |
4.4. Analysis Period
| Period | Types of asset |
|---|---|
| 5 years (4–6 years) | Vehicle and transport. Equipment, instrument and tool |
| 12 years (9–15 years) | Ship and aircraft |
| 20 years (15–25 years) | All structure building including a brick building, block building, concrete-ramen building, wooden building, wooden-mortar building |
| 40 years (30–50 years) | Steel frame, Steel-concrete structure, masonry stone structure, all beam structure building |
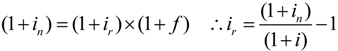
4.5. Discount Rate
| Year | Interest rate (%) | Consumer Price Index (CPI, Y2010 = 100) | Inflation rate (%) | Real rate of interest (%) |
|---|---|---|---|---|
| 1996 | 9.00 | 63.15 | 9.00 | 3.83 |
| 1997 | 10.59 | 65.96 | 4.44 | 5.89 |
| 1998 | 13.39 | 70.91 | 7.51 | 5.47 |
| 1999 | 7.05 | 71.49 | 0.81 | 6.19 |
| 2000 | 7.08 | 73.10 | 2.26 | 4.71 |
| 2001 | 5.46 | 76.08 | 4.07 | 1.34 |
| 2002 | 4.71 | 78.18 | 2.76 | 1.89 |
| 2003 | 4.15 | 80.92 | 3.51 | 0.61 |
| 2004 | 3.75 | 83.83 | 3.59 | 0.15 |
| 2005 | 3.57 | 86.14 | 2.75 | 0.79 |
| 2006 | 4.36 | 88.07 | 2.24 | 2.07 |
| 2007 | 5.01 | 90.30 | 2.53 | 2.41 |
| 2008 | 5.67 | 94.52 | 4.67 | 0.95 |
| 2009 | 3.23 | 97.13 | 2.76 | 0.46 |
| 2010 | 3.18 | 100.00 | 2.96 | 0.22 |
| 2011 | 3.69 | 104.00 | 4.00 | −0.30 |
4.6. LCC Calculation
| System | Specification | Unit (m2) | Material cost | Labor cost | Total |
|---|---|---|---|---|---|
| Asphalt (Repair period: 8 years, 10%) | Major repair | 0.1 | 1338 | 3094 | 4432 |
| Waterproof layer demolition and disposal | 0.1 | 2439 | |||
| Sum | 6871 | ||||
| Membrane (Repair period: 5 years, 10%) | Major repair | 0.1 | 2624 | 1530 | 4154 |
| Waterproof layer demolition and disposal | 0.1 | 2439 | |||
| Sum | 6592 | ||||
| Sheet (Repair period: 8 years, 20%) | Major repair | 0.2 | 2322 | 4001 | 6323 |
| Waterproof layer demolition and disposal | 0.2 | 4877 | |||
| Sum | 11,200.4 |
5. LCCO2 Estimation
| System | Material | Unit | Quantity |
|---|---|---|---|
| Asphalt | Asphalt | kg | 7.1 |
| Asphalt primer | L | 0.4 | |
| Asphalt felt | m2 | 1.1 | |
| Asphalt roofing | m2 | 2.2 | |
| Heavy oil | L | 0.8 | |
| Cement | kg | 6.8 | |
| Gravel | kg | 0.1913 | |
| Sand | m3 | 0.0098 | |
| Wire mesh | kg | 3.486 | |
| Membrane | Urethane | kg | 3.9 |
| Urethane primer | kg | 0.3 | |
| Coating material | kg | 0.3 | |
| Cement | kg | 6.8 | |
| Gravel | kg | 0.1913 | |
| Sand | m3 | 0.0098 | |
| Wire mesh | kg | 3.486 | |
| Sheet | Synthetic polymeric sheet | m2 | 1.2 |
| Cement | kg | 6.8 | |
| Gravel | kg | 0.1913 | |
| Sand | m3 | 0.0098 | |
| Wire mesh | kg | 3.486 |
5.1. Selection of Environmental Load Database
| Code | Part name | Material | CO2 emission amount (t-CO2/Mwon) |
|---|---|---|---|
| 00390100 | Sand | Sand | 0.3538 |
| 00390200 | Gravel | Gravel | 0.3538 |
| 01440100 | Heavy oil | Heavy oil | 3.7367 |
| 01920200 | Asphalt product | Asphalt | 1.7535 |
| 01710100 | Wax and coating product | Coating material | 1.815 |
| 01650301 | Thinner | Thinner | 1.602 |
| 01850101 | Normal cement | Cement | 6.616 |
| 01550100 | Synthetic rubber | Synthetic polymer sheet | 1.7407 |
| 01670100 | Adhesive(industrial) | Primer | 1.382 |
| 01650201 | Urethane product | Urethane | 1.602 |
| 01920200 | Asphalt product | Asphalt primer | 1.7535 |
| 01920200 | Asphalt product | Asphalt felt | 1.7535 |
| 01920200 | Asphalt product | Asphalt roofing | 1.7535 |
| 02210103 | Steel net | Wire mesh | 3.738 |
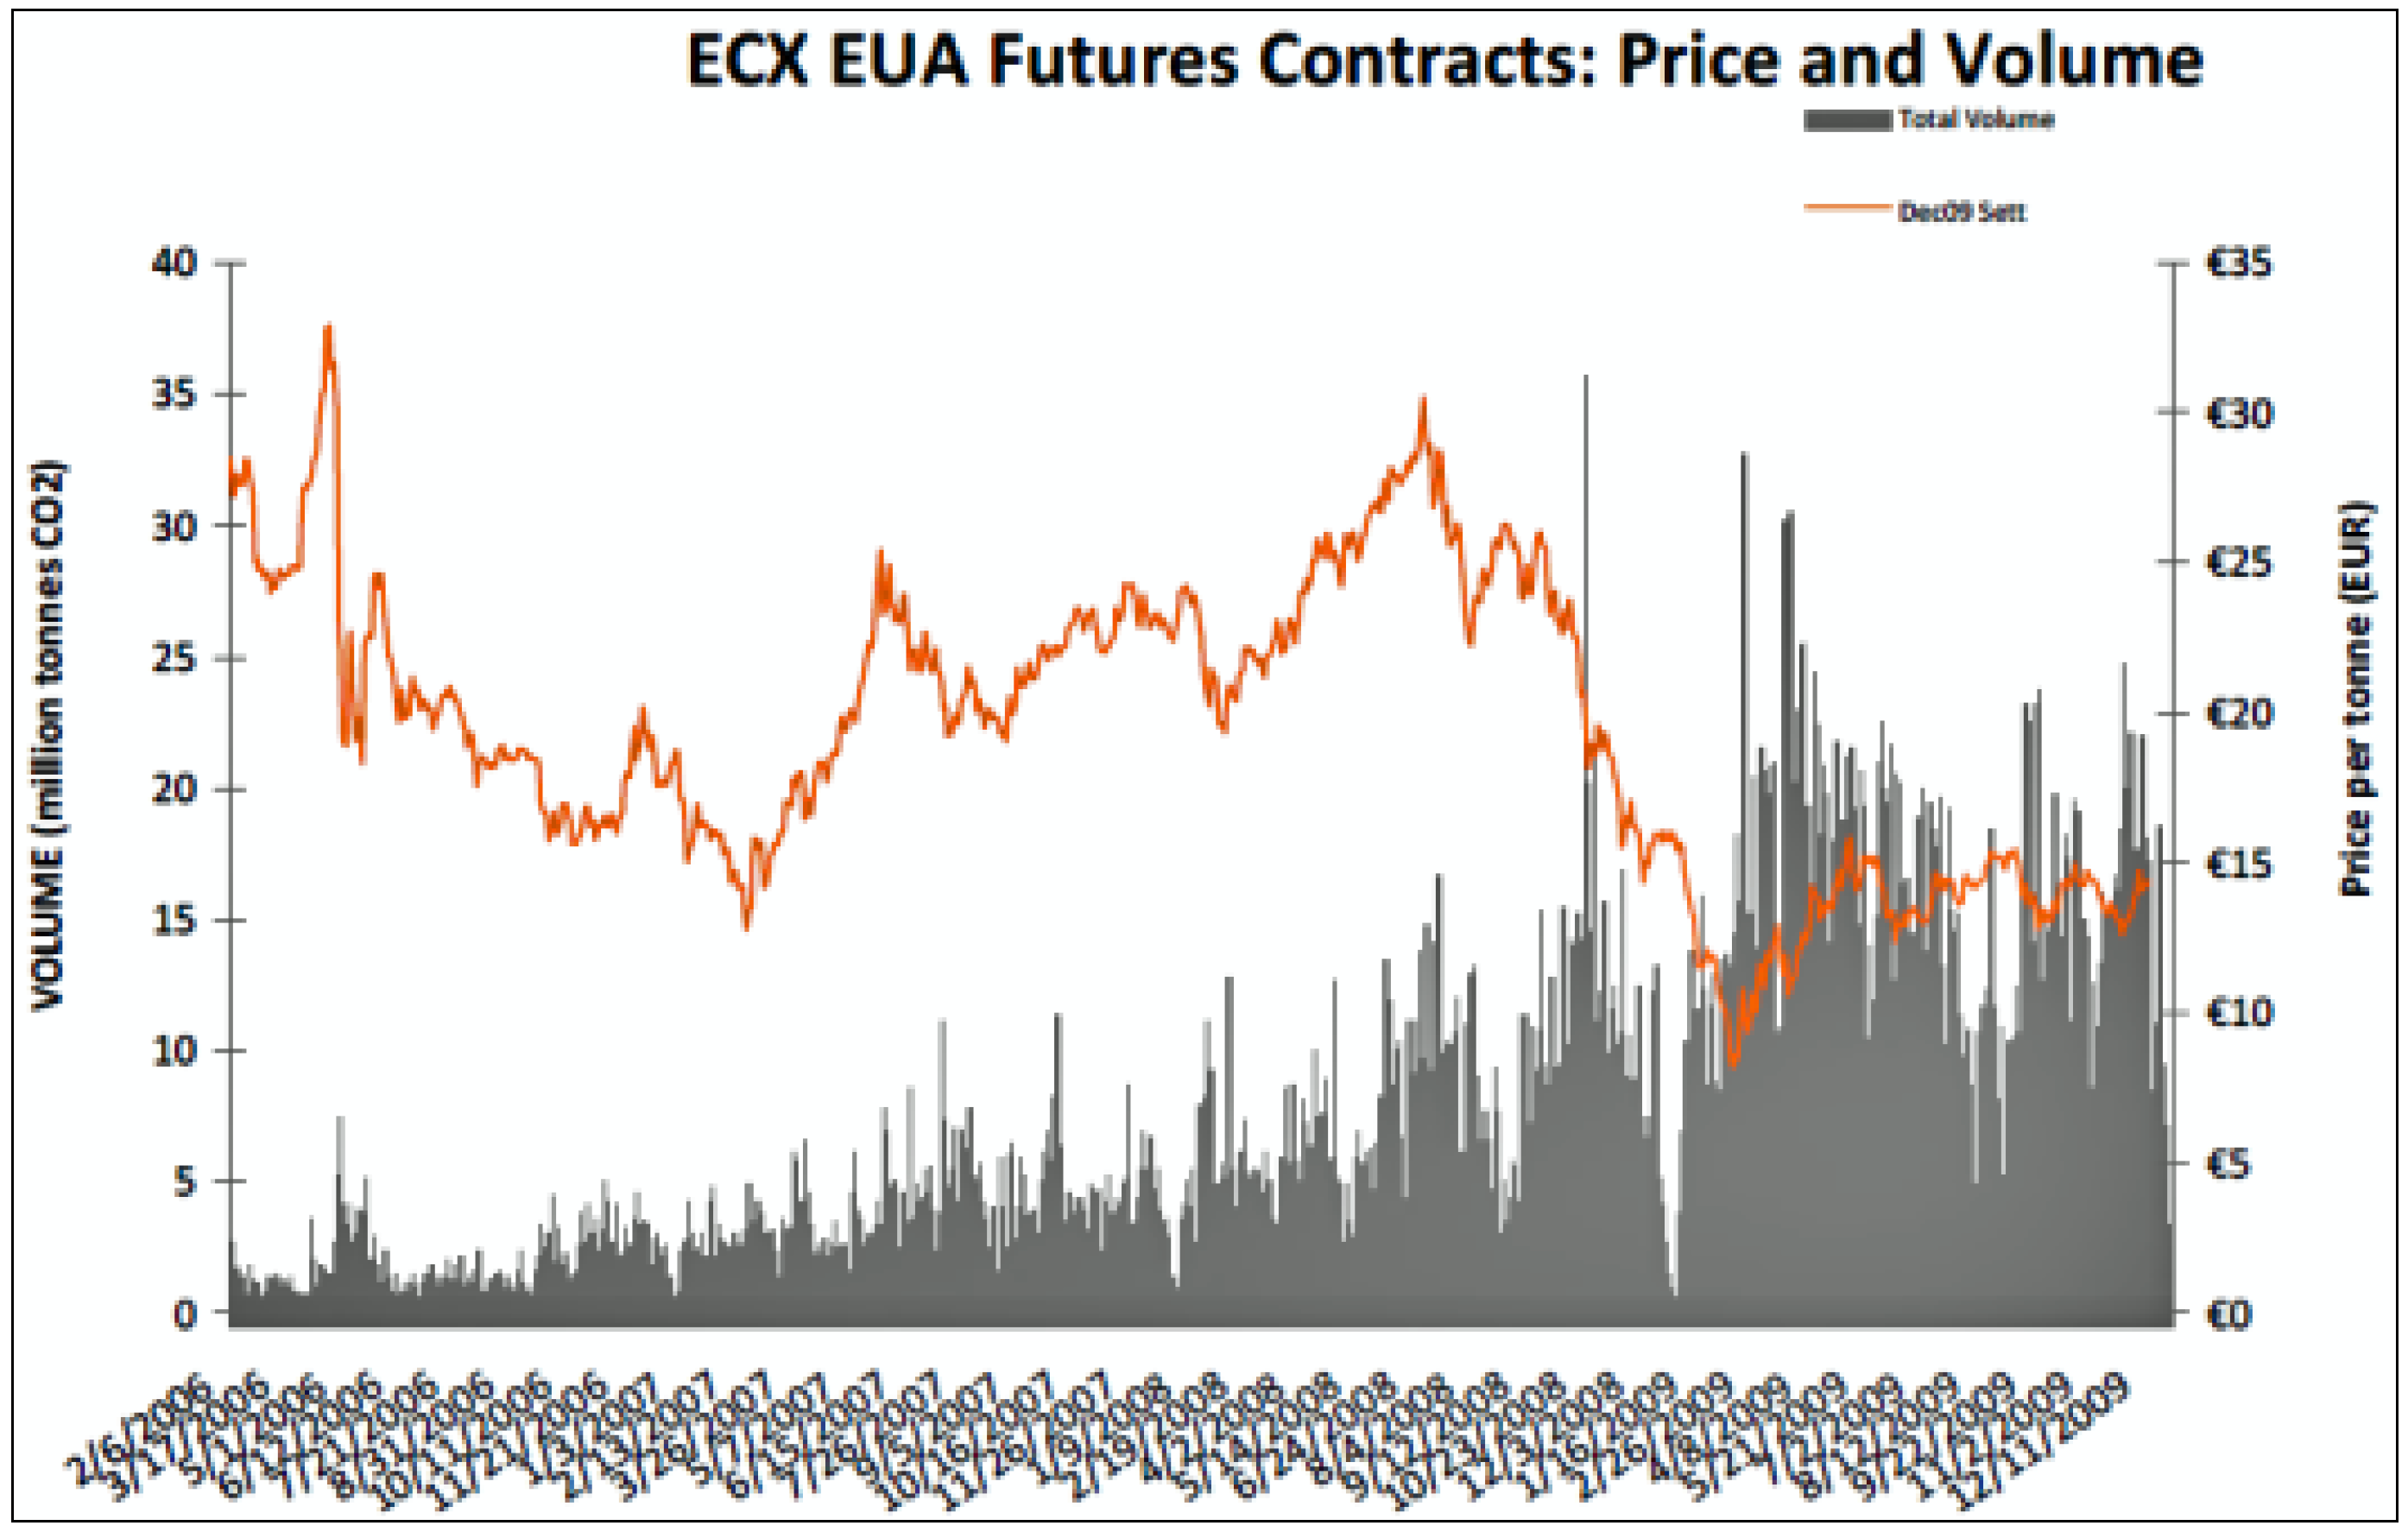
5.2. Application of CO2 Market Price

5.3. LCCO2 Cost Calculation
| Systems | Material | Unit cost | Quantity | CO2 basic unit | CO2 emission volume | Sum |
|---|---|---|---|---|---|---|
| Asphalt | Asphalt primer | 1277 | 0.0005108 | 1.7535 | 0.0008957 | 0.0297637 |
| Blown asphalt | 730 | 0.0051830 | 0.861 | 0.0090884 | ||
| Asphalt felt | 1666 | 0.0018326 | 1.7535 | 0.0032135 | ||
| Asphalt roofing | 500 | 0.0011000 | 1.7535 | 0.0019289 | ||
| Heavy oil | 654 | 0.0005326 | 3.7367 | 0.0019902 | ||
| Cement | 79 | 0.0005372 | 6.616 | 0.0035541 | ||
| Gravel | 12,500 | 0.0002391 | 0.3538 | 0.0000846 | ||
| Sand | 12,500 | 0.0001225 | 0.3538 | 0.0000433 | ||
| Wire mesh | 688 | 0.0023984 | 3.738 | 0.0089651 | ||
| Membrane | Urethane | 4900 | 0.0005134 | 1.382 | 0.0306142 | 0.0487873 |
| Urethane primer | 4900 | 0.0191100 | 1.602 | 0.0026681 | ||
| Coating material | 1277 | 0.0014700 | 1.815 | 0.0007095 | ||
| Thinner | 3271 | 0.0013411 | 1.602 | 0.0021485 | ||
| Cement | 79 | 0.0005372 | 6.616 | 0.0035541 | ||
| Gravel | 12,500 | 0.0002391 | 0.3538 | 0.0000846 | ||
| Sand | 12,500 | 0.0001225 | 0.3538 | 0.0000433 | ||
| Wire mesh | 688 | 0.0023984 | 3.738 | 0.0089651 | ||
| Sheet | Synthetic polymer sheet | 6000 | 0.0072000 | 1.7407 | 0.0125330 | 0.0258896 |
| Cement | 79 | 0.0005372 | 6.616 | 0.0035541 | ||
| Gravel | 12,500 | 0.0002391 | 0.3538 | 0.0000846 | ||
| Sand | 12,500 | 0.0001225 | 0.3538 | 0.0000433 | ||
| Primer | 688 | 0.0005134 | 1.382 | 0.0089651 | ||
| Wire mesh | 1277 | 0.0023984 | 3.738 | 0.0007095 |
| CO2 emission volume | Average price of EUAs (EUR/ton) | Average exchange currency | CO2 emission cost | |
|---|---|---|---|---|
| Asphalt waterproofing | 0.0297637 | 19.73 | 1809.65 | 1062.70 |
| Membrane waterproofing | 0.0487873 | 1741.92 | ||
| Sheet waterproofing | 0.0258896 | 924.37 |
| Equipment | Unit (m2) | CO2 basic unit (kg-CCO2/m2) | Average price of EUAs (EUR/ton) | Average exchange currency (year) | Costs (Won/m2) |
|---|---|---|---|---|---|
| Breaker | 0.12 | 0.687 | 19.73 | 1809.65 | 2452.89 |
| System | Specification | Unit (m2) | Material cost | Labor cost | Total |
|---|---|---|---|---|---|
| Asphalt (Replacement period: 25 years, 10%) | Partial repair | 0.1 | 106.27 | 0 | 106.27 |
| Waterproof layer demolition(breaker) | 0.1 | 245.29 | |||
| Sum | 351.56 | ||||
| Membrane (Replacement period: 15 years, 10%) | Partial repair | 0.1 | 174.19 | 0 | 174.19 |
| Waterproof layer demolition(breaker) | 0.1 | 245.29 | |||
| Sum | 419.48 | ||||
| Sheet (Replacement period: 20 years, 20%) | Partial repair | 0.2 | 184.87 | 0 | 184.87 |
| Waterproof layer demolition(breaker) | 0.2 | 409.58 | |||
| Sum | 675.45 |
| System | Specification | Unit (m2) | Material cost | Labor cost | Total |
|---|---|---|---|---|---|
| Asphalt (Replacement period: 25 years, 10%) | Partial replacement | 0.1 | 1062.70 | 0 | 1062.70 |
| Waterproof layer demolition(breaker) | 0.1 | 2452.89 | |||
| Sum | 3515.59 | ||||
| Membrane (Replacement period: 15 years, 10%) | Partial replacement | 0.1 | 1741.92 | 0 | 1741.92 |
| Waterproof layer demolition(breaker) | 0.1 | 2452.89 | |||
| Sum | 4194.81 | ||||
| Sheet (Replacement period: 20 years, 20%) | Partial replacement | 0.2 | 924.37 | 0 | 924.37 |
| Waterproof layer demolition(breaker) | 0.2 | 2452.89 | |||
| Sum | 3377.27 |
6. LCC Comparison Including LCCO2
6.1. Initial Cost
| System | Initial construction cost | Initial CO2 emission cost | Sum |
|---|---|---|---|
| Asphalt waterproofing | 44,319 | 1062.7 | 45,382 |
| Membrane waterproofing | 41,538 | 1741.9 | 43,280 |
| Sheet waterproofing | 31,616 | 924.4 | 32,541 |
6.2. Maintenance and Repair Cost
| Year | Asphalt waterproofing | Membrane waterproofing | Sheet waterproofing | |||
|---|---|---|---|---|---|---|
| Current price | Present value | Current price | Present value | Current price | Present value | |
| 5 | 6592 | 5714 | ||||
| 8 | 6871 | 5466 | 11,200 | 8911 | ||
| 10 | 13,185 | 10,668 | ||||
| 15 | 79,109 | 53,603 | ||||
| 16 | 13,741 | 9815 | 22,401 | 16,000 | ||
| 20 | 85,701 | 57,325 | ||||
| 24 | 82,447 | 44,410 | 78,403 | 47,615 | ||
| 25 | 92,294 | 60,550 | ||||
| 28 | 89,603 | 52,645 | ||||
| 30 | 158,218 | 88,513 | ||||
| 32 | 89,317 | 47,163 | ||||
| 35 | 164,810 | 90,937 | ||||
| 36 | 100,804 | 56,647 | ||||
| 40 | 96,188 | 49,352 | 171,403 | 93,038 | 156,806 | 75,495 |
| 44 | 168,006 | 77,679 | ||||
| 45 | 103,058 | 51,250 | 237,327 | 111,250 | ||
| Repair | 34,593 | 16,655 | 39,554 | 22,140 | 56,002 | 28,216 |
| Replacement | 68,705 | 34,596 | 197,772 | 89,110 | 112,004 | 49,463 |
| Year | Asphalt waterproofing | Sheet waterproofing | Membrane waterproofing | |||
|---|---|---|---|---|---|---|
| Current price | Present value | Current price | Present value | Current price | Present value | |
| 5 | 6838 | 5927 | ||||
| 8 | 7222 | 5746 | 11,876 | 9448 | ||
| 10 | 13,675 | 11,065 | ||||
| 15 | 83,794 | 56,732 | ||||
| 16 | 1444 | 10,317 | 23,752 | 16,965 | ||
| 20 | 90,632 | 60,592 | ||||
| 24 | 8666 | 46,683 | 83,131 | 46,864 | ||
| 25 | 97,470 | 63,938 | ||||
| 28 | 96,007 | 52,198 | ||||
| 30 | 167,589 | 93,689 | ||||
| 32 | 93,887 | 49,576 | ||||
| 35 | 174,426 | 96,194 | ||||
| 36 | 106,883 | 56,441 | ||||
| 40 | 101,109 | 51,878 | 166,262 | 75,366 | 181,264 | 98,272 |
| 44 | 178,138 | 78,742 | ||||
| 45 | 108,332 | 53,873 | 251,383 | 117,744 | ||
| Repair | 36,111 | 17,507 | 59,379 | 29,918 | 41,026 | 22,964 |
| Replacement | 72,221 | 36,366 | 118,759 | 48,824 | 210,357 | 94,780 |
| System | Initial construction costs | Repair cost | Replacement cost | Cost for O&M | Total |
|---|---|---|---|---|---|
| Asphalt waterproofing | 45,382 | 17,507 | 36,366 | 53,873 | 99,255 |
| Membrane waterproofing | 43,280 | 22,964 | 94,780 | 117,744 | 161,024 |
| Sheet waterproofing | 32,541 | 29,824 | 48,824 | 78,648 | 111,189 |
6.3. LCC Comparison Including LCCO2
| Asphalt | Membrane | Sheet | |
|---|---|---|---|
| LCC | 31,901.95 | 52,306.02 | 46,851.83 |
| Ratio (%) | 61 | 100 | 90 |
| LCC + LCCO2 | 33,222.68 | 53,514.41 | 49,511.74 |
| Ratio (%) | 62 | 100 | 93 |
7. Conclusions
- (1)
- In terms of initial capital cost, asphalt waterproofing has the highest CO2 emission cost, followed by membrane and sheet waterproofing. However, LCC including LCCO2 suggests that membrane waterproofing requires the highest cost, followed by sheet and asphalt waterproofing. In terms of initial capital cost, sheet waterproofing can be competitive, but it is expensive in the maintenance and repair stage. Asphalt waterproofing, however, has a high initial cost and low maintenance cost. Therefore, asphalt waterproofing can be the most economic method given that the LCCO2 is considered in LCC.
- (2)
- The LCC for each method including LCCO2 has resulted in a valid economic perspective, i.e., although the initial cost for sheet waterproofing is the lowest, asphalt waterproofing is more economical based on LCC analysis.
- (3)
- LCCO2 is a relatively small portion of LCC, and at a glance, may have little influence on the construction and maintenance costs. However, the length of LCC or durability of a building increases the LCCO2, and can accumulate into an amount that could have an economic impact on decision-making. Therefore, it can be concluded that LCCO2 can be a vital factors in the process.
Conflicts of Interest
References
- Project Management Institute (PMI). Guide to the Project Management Body of Knowledge; PMI: Newtown Square, PA, USA, 2004. [Google Scholar]
- Khasreen, M.M.; Banfill, P.F.G.; Menzies, G.F. Life-cycle assessment and the environmental impact of buildings: A review. Sustainability 2009, 1, 674–701. [Google Scholar] [CrossRef]
- Lawrence, T.M.; Braun, J.E. Evaluation of simplified models for predicting CO2 concentrations in small commercial buildings. Build. Environ. 2006, 41, 184–194. [Google Scholar] [CrossRef]
- Radhi, H. Evaluating the potential impact of global warming on the UAE residential buildings—a contribution to reduce the CO2 emissions. Build. Environ. 2009, 44, 2451–2462. [Google Scholar] [CrossRef]
- Oh, S.K.; Bae, K.S.; Kim, Y.S. A study on the evaluation of composite coatings of cement and powder used as waste tire and glass. Archit. Inst. Korea 2004, 20, 47–52. [Google Scholar]
- Kang, C.H.; Kim, Y.S. The current status and case studies on the waterproofing defects in the underground parking lot of apartment buildings. Proc. Archit. Inst. Korea 2001, 21, 503–506. [Google Scholar]
- An, G.U.; Lee, J.Y. Defection analysis of the waterproof work for the quality control of construction site. Archit. Inst. Korea 2005, 21, 123–130. [Google Scholar]
- Oh, S.K.; Kwak, K.S.; Choi, S.M.; Kwan, S.W. Improvement of selection system of waterproofing methods for concrete structure. Korea Inst. Build. Constr. 2007, 7, 99–106. [Google Scholar]
- Dale, A.T.; Lucena, A.F.P.; Marriott, J.; Borba, B.S.M.C.; Schaeffer, R.; Bilec, M.M. Modeling future life-cycle greenhouse gas emissions and environmental impacts of electricity supplies in Brazil. Energies 2013, 6, 3182–3208. [Google Scholar] [CrossRef]
- Choi, O.Y.; Kim, T.; Kim, G. A study on selection of roof waterproofing method by analyzing life cycle costing. Korea Inst. Build. Constr. 2008, 1, 127–134. [Google Scholar] [CrossRef]
- Choi, S.M.; Oh, S.K.; Seo, C.H. A study on the selection of the waterproofing methods which VE/RWLCC analysis methodology in roof of structure. Archit. Inst. Korea 2009, 25, 161–168. [Google Scholar]
- Wang, C.; Zhang, L.; Yang, S.; Pang, M. A hybrid life-cycle assessment of non-renewable energy and greenhouse-gas emissions of a village-level biomass gasification project in China. Energies 2012, 5, 2708–2723. [Google Scholar] [CrossRef]
- Promjiraprawat, K.; Limmeechokchai, B. Assessment of Thailand’s energy policies and CO2 emissions: Analyses of energy efficiency measures and renewable power generation. Energies 2012, 5, 925–937. [Google Scholar] [CrossRef]
- Kim, J.Y.; Lee, S.E.; Sohn, J.Y. An assessment of the energy consumption & CO2 emission during the construction stage of apartments. Archit. Inst. Korea 2005, 21, 199–206. [Google Scholar]
- Gao, L.; Winfield, Z.C. Life cycle assessment of environmental and economic impacts of advanced vehicles. Energies 2012, 5, 605–620. [Google Scholar] [CrossRef]
- Lee, B.Y.; Kim, B.R.; Kim, G.H. Comparison of construction costs of masonry wall types, including CO2 emission costs. Korea Inst. Build. Constr. 2010, 10, 83–90. [Google Scholar]
- KICT. Life cycle analysis annual report. Available online: http://www.kict.re.kr/ (accessed on 27 September 2013).
- Jung, S.S.; Kim, D.W. A study on the development of cost breakdown structure in present worth method and annul worth method by HAVC system for systematic LCC calculation. Archit. Inst. Korea 2002, 18, 167–174. [Google Scholar]
- Son, B.S.; Jang, M.H.; Lee, H.Y. A method of economic analysis for remodelling of apartments using the life cycle costing. Archit. Inst. Korea 2005, 21, 73–81. [Google Scholar]
- Choi, M.S.; Kim, M.H. The variation characteristics of life cycle cost in a office building according to the discount rates and inflation rates. Archit. Inst. Korea 2006, 22, 131–137. [Google Scholar]
© 2013 by the authors; licensee MDPI, Basel, Switzerland. This article is an open access article distributed under the terms and conditions of the Creative Commons Attribution license (http://creativecommons.org/licenses/by/3.0/).
Share and Cite
Kim, S.; Kim, G.-H.; Lee, Y.-D. Sustainability Life Cycle Cost Analysis of Roof Waterproofing Methods Considering LCCO2. Sustainability 2014, 6, 158-174. https://doi.org/10.3390/su6010158
Kim S, Kim G-H, Lee Y-D. Sustainability Life Cycle Cost Analysis of Roof Waterproofing Methods Considering LCCO2. Sustainability. 2014; 6(1):158-174. https://doi.org/10.3390/su6010158
Chicago/Turabian StyleKim, Sangyong, Gwang-Hee Kim, and Young-Do Lee. 2014. "Sustainability Life Cycle Cost Analysis of Roof Waterproofing Methods Considering LCCO2" Sustainability 6, no. 1: 158-174. https://doi.org/10.3390/su6010158